Abstract
Cities are affected by the impact of rapid urbanization on changes to soil properties. The aim of this study was to assess the physical and chemical properties of the soil of urban and peri-urban forests and to define which soil property is more significant for these two types of forests. The research took place in urban and peri-urban forests in the metropolitan area of Brasov, Romania. Among the properties determined were: particle size distribution, reaction, soil organic matter content, and the base saturation degree. As supplementary data, for plots from urban forests, the heavy metal content was determined. The results revealed that soils from urban forests had an alkaline reaction and the ones from peri-urban forests had a moderately acid reaction. The soil from the peri-urban plots was sandier and the other ones were more clayey. Testing the differences between the forests led to significant differences in the case of seven properties of which we mentioned pH and sand and clay content. Using PCA, the most significant and important soil properties for urban forests were the sum of basic exchangeable cations, cation exchange capacity, soil organic matter, and silt and clay contents. This study is more relevant in light of the EU Soil Strategy, which sets out a framework and concrete measures to protect and restore soils.
1. Introduction
Cities are affected by the impact of rapid urbanization on changes to soil properties [1]. The pressures on the ecological aspects of urban or suburban forests increase. The understanding of peoples’ interactions with forests in areas with a high population density is essential [2]. Thus, the importance of urban and suburban forests is gaining momentum. Some natural areas within the urban environment remain underexamined, and the characteristics have not been evaluated. These include natural forests and the contribution of ecosystem services to communities [3].
The contribution of urban and suburban forests to improving the microclimatic and ecological characteristics of cities is important and needs to be better understood. Improving the structure of the functions of urban ecosystems can benefit the well-being of humans in cities [4]. Urban ecosystem functions are a means to mitigate the problems associated with the urban built environment [5]. Anthropogenic pressures contribute to soil disturbance [6]. In addition, the knowledge of soil status and soil properties in urban forests are important in the urban ecosystem and play several roles such as retaining pollutants and protecting resources and citizen health [7]. Soil conditions throughout urban and suburban areas have an impact on the movement of water and pollutants and can affect ecosystem processes [8]. Thus, relevant studies have evaluated the soil properties and heavy metal distribution in cities or the surrounding forest areas. Some research has been focused on analyzing the differences among soil properties, metallic elements contents, or pH along the urban–rural gradient [9,10,11].
Soils in urban forests are the basis for the development and existence of “green infrastructure”, which, in turn, has been designed and maintained to provide ecosystem services and protect biodiversity [12]. An important goal for the development of the urban environment should be the conservation of soil biodiversity, as urban forests will become an important biodiversity reserve in the future [13].
Regarding urban forests, soil plays a very important role in providing ecosystem services. Human activities cause major disturbances in the morphology of the soil profile and in the general processes and functions of the soil. However, the protection of urban soils is rarely taken into account in the planning and development of urban areas [14]. These urban soils are often considered to be of extremely poor quality and have modified properties [15]. By determining the soil parameters, such as the level of degradation or the stock of organic matter, the soil’s ability to provide ecosystem services can be evaluated [14]. Soil quality is negatively affected (especially its physical properties) by actions carried out during the urbanization process, such as vegetation removal, the removal of the upper soil horizons, and compaction; these all affect ecosystem services (stormwater mitigation, carbon stocks, net primary production) [16]. Some studies have emphasized that some soil properties are different between rural and urban areas, such as pH (which is higher in urban areas), organic matter (which increases from urban areas to rural areas), and heavy metal content—Cd, Cr, Cu, Pb (which is decreased in rural areas) [17].
Soil is a very good indicator for quantifying the long-term effects of urbanizing activities. This was proven in a study carried out in the urban forests of three big cities (Baltimore, New York, and Budapest), the results of which suggest that forest soils offer solutions for the urbanization gradients of all three cities even though these cities have different characteristics [18]. Understanding these rapid changes in forest soil properties is important because they can indicate alterations in ecosystem processes and forest vigor [19]. Thus, forests from cities or from surroundings areas represent an interesting research topic. These types of studies were conducted not only in Europe but also on both American continents and in Asia. Thus, soil chemical properties from urban forest patches were studied in Philadelphia (a very populous city in Pennsylvania) and Newark (New Jersey) USA [20]. In other cities in the USA (Louisville, Kentucky), physical, chemical, and heavy metals content were studied in relation to disturbances and vegetation [8]. Soil bulk density and contents of some macro- and microelements were determined in plots located in urban forests in Gainesville, Florida [3]. In South America (Ecuador), ecosystems near roadsides were examined to determine soil quality indexes [21]. In Europe, urban and peri-urban forests were studied in Szeged and Sopron (Hungary) [22], Sofia (Bulgaria) [4] Madrid (Spain) [23], and Porto (Portugal) [24]. In Asia, most of the studies were conducted in China, such as in Jinan [25] and Guangdong Province [26].
Knowledge of the physical, chemical, and biological properties of soils helps to correlate them with the ecological requirements of the species and provides essential information about the fertility of the soil [27]. These factors represent a basis for better decision-making in forest planning and contribute to the health and stability of forests.
Soil fertility represents the ability of soil to fulfill the demands of plants, and thus, the old definition of soil fertility should be improved by introducing other soil functions such as productive, environmental, and socio-economic factors [28]. Trophicity (which is calculated according to certain physical and chemical properties) is an important factor defining soil fertility. The global potential trophicity index correlates very well with forest site quality and stand productivity [29].
The aim of this study was to assess the physical and chemical properties of the soil of urban and peri-urban forests in order to determine the soil richness (trophicity) and to define which soil property is more significant for these two types of forests. We hypothesized the following: (a) there are differences between urban and peri-urban forests in terms of soil properties; (b) the trophicity of urban and peri-urban forests is different; (c) the forest surrounding the city of Brasov could be affected by pollution from heavy metals.
2. Materials and Methods
2.1. Study Area
The study took place in the metropolitan area of Brasov, more precisely in the urban and peri-urban forests. The urban and peri-urban forests of the Brasov metropolitan area have been delimited according to the methodology established by [30]. All the forests are managed by the Kronstadt private forest district. In these forests, 20 experimental plots were installed (Figure 1) and the biodiversity of the flora [31] was studied, as well as the stakeholders who could influence the development of these types of forests [32].
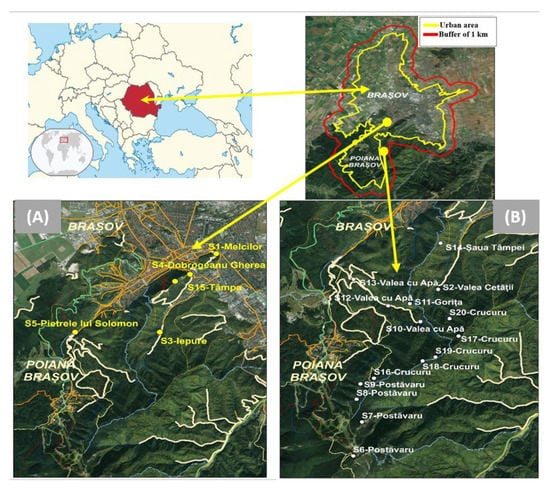
Figure 1.
Spatial distribution of experimental plots from urban and peri-urban forests in Brasov metropolitan area ((A)—urban forest, (B)—peri-urban forest).
Brasov is situated in the center of Romania. According to the Statistical National Institute, one million tourists have visited the Brasov mountain area [33]. Around 300,000 inhabitants are living in Brasov. In the metropolitan area, there is a population of more than 475,000 [34], which is expected to reach 600,000 by the middle of the 21st century [35]. In addition, this study is relevant since Brasov has gained a negative reputation regarding the issue of pollution according to the European Commission. In 2014, the Commission asked Romania to take action on air pollution and consider that Romania is failing to protect its citizens from pollution. Citizens in Bucharest, Brasov, and Iasi have been almost continuously exposed to pollution [36]. Brasov County has a well-represented network of public roads crossed by the main European driveways (E81, E68, E60) and is an important rail node. The development of the industry sector of Brasov city is above the national level, with 2021 representing an increase in the manufacturing of transport equipment, fabricated metal products, and computer, electronic, and optical products [34]. In 2018, Brasov County registered the most vehicles from the Centre Region [34]. In terms of the number of registrations of vehicles for passenger transport, Brasov County was in second place in the Centre Region after Mureș County [34]. For the period 2016–2020 the data on the contribution of industries on the emission of air pollutants in Brasov indicate that 61% of PM2.5 (fine particulate matter) and 48% of PM10 (particulate matter) are produced by households and commerce, followed by mineral products and manufacturing industries [37]. A total of 55% of pollution from NOx are made by transport (roads and rails) and 75.8% of pollution from SOx is produced by manufacturing industries and construction [37].
According to the Köppen classification, the general climate is Dfck, meaning a boreal humid climate with sufficient precipitation throughout the year, cold winters, and annual average temperatures in the warmest season above 10 °C [38]. The main types of soils in the study area are Eutric cambisol and Dystric cambisol. The predominant tree species present in the forest composition are European beech (Fagus sylvatica), Norway spruce (Picea abies), and Silver fir (Abies alba); these species create mixed forests [38]. The dominant plant communities are represented by Oxalis-Dentaria, Asperula-Dentaria, and Vaccinium [38].
Out of the 20 experimental plots installed, 5 of them were located in the urban forest and 15 in the peri-urban forest (Figure 1). It was considered that the plots from the urban forest are crossed more frequently by people than the plots in the peri-urban forests because the plots in the urban forests are located in the vicinity of tourist trails.
This point of view was supported by counting the number of visitors to some representative points for trails; it was observed that around 1000 people per week use these trails (the count was conducted in the spring period and represents unpublished data).
One soil profile was placed in each plot from which samples were collected in order to study a range of physical and chemical properties. In total, 39 samples were collected according to national and international standards [39,40]; 10 were from the urban forest, and 29 were from the peri-urban forest. The samples, after completing the preparatory steps, were analyzed, and the following properties, considered a minimum data set for soil quality, were determined: particle size distribution (contents of sand, silt, and clay), the reaction of the soil (pH), soil organic matter content (SOM), total nitrogen content (N), the sum of basic exchangeable cations (SB), exchangeable acidity (SH), cation exchange capacity (CEC), and the base saturation degree (V). As supplementary data, for plots with high levels of human traffic, the heavy metal content (Cr, Cd, Pb, Fe, Mn, and Zn) was determined. These plots were considered affected by human disturbances. For plots located in the peri-urban forest (with a smaller human impact), the content of heavy metals was not enough to justify performing laboratory analysis. All these properties have been used in other studies as indicators of soil health and quality.
2.2. Soil Analyses
The samples, dried and sieved, were analyzed within the Laboratory of Pedological and Foliar Analysis from INCDS “Marin Drăcea”—Brasov, Romania. The determination of the soil pH was done using the potentiometric method in a suspension solution of non-ionized water and soil at a ratio of 1:2.5 according to national and international standards [41,42]. In order to determine the soil organic matter, the modified Walkley–Black method was used, which involves wet oxidation and titrimetric dosing [43,44]. The total nitrogen content was determined using the Kjeldahl method [45]. The sum of the basic exchangeable cations (SB) was determined according to the Kappen method [46], which consists of treating the soil with a solution of hydrochloric acid. The sum of exchangeable acidity (SH) was determined using the same Kappen method, using a potassium acetate extraction solution [46]. Using the values of the SH and SB, it was possible to compute the cation exchange capacity (CEC) and the base saturation degree (V). The contents of heavy metals (Cu, Cr, Cd, Fe, Mn, Pb, Zn) were determined in aqua regia extract and then by dosing with an atomic absorption spectrometer [47].
The particle size distribution (granulometric fractions of the soil—sand, dust, and clay) constitutes the physical property of soil called granulometric composition [27]. The method of determining the particle size composition consists of separating the mineral fractions according to size by the method of sieving and pipetting to determine the percentage of the dimensions [48]. Another pedological index calculated was the edaphic volume (Ve), which is the volume of fine soil (m3 m−2). This index was determined depending on the thickness of the soil horizon and the soil skeleton proportion [27]. The thickness of the horizon was measured in the field using a tape measure and the skeleton proportion was visually assessed in the field according to [49].
2.3. Romanian Approach to Soil Richness: Global Potential Trophicity Index (Tp)
With the help of some of the properties mentioned above, it was possible to determine the global potential trophicity index. The global potential trophicity index (Tp) is a complex indicator that takes into account specific elements that are decisive for soil trophicity and its productive potential: the content and type of humus, the properties of the soil adsorption complex expressed by the degree of base saturation (V), and the edaphic volume (determined by the morphological thickness and skeleton proportion). A correction of the global potential trophicity index was applied using a coefficient corresponding to the type of humus. The values of this coefficient are as follows: 1—for wick acid mull, 0.9—for acid mull, 0.8—for calcic mull, 0.7—for mull–moder, 0.6—for moder, 0.5—for moder–raw humus, 0.3—for raw humus, 0.2—raw humus–peat [50]. The global potential trophicity index was obtained using the Chiriță formula [50]:
Tp = ∑(tp horizon) = ∑(H∙d∙Da∙V∙rv∙0.1)∙humus correction coefficient
H—content of organic matter (%);
d—thickness of the horizon (dm);
Da—bulk density (g cm−3);
V—base saturation degree (%);
rv—ratio of the volume of the fine soil to the total volume of the soil (calculated using the percentage of skeleton);
the humus correction coefficient—it takes values between 1 and 0.2.
Along with the soil properties, a series of geomorphological (relief) characteristics were also studied, namely the altitude of each plot, the slope, and the slope aspect. The altitude (m.a.s.l.) was measured with a 62s GPS produced by Garmin International, Inc., Olathe, KS, USA, the slope was measured using laser Vertex V (Haglöf, Långsele, Sweden), and the slope aspect was taken with a magnetic compass V (Haglöf, Långsele, Sweden).
2.4. Statistical Analysis
In the first phase, the normality of the data was tested using the Shapiro–Wilk test, and a large part of the data followed the normal distribution; therefore, parametric statistics were used. First, a basic statistic was performed. Thus, the mean, the standard error of the mean, and the minimum and maximum values were calculated for all soil properties. Afterward, the differences among all the soil properties of the urban and peri-urban forests were tested using a t-test. The variation in the heavy metal content was graphically rendered using box-plot charts with the mean, minimum, and maximum values.
A multivariate statistical analysis (principal component analysis—PCA) was used to determine whether patterns in the soil characteristics and relief characteristics were discernible among plots. PCAs were conducted separately for plots from urban and peri-urban areas to explore potential predictors that may influence these soil conditions separately. We conducted a principal component analysis (PCA) to determine the multivariate relationships among the soil properties.
Hierarchical cluster analysis using the joining (tree clustering) method was conducted to categorize all the soil properties into several groups with similar characteristics. Based on Euclidian distances and the weighted pair–group average linkage rule (indicating when cluster sizes could be uneven), the tree diagrams with soil properties were obtained for the urban and peri-urban plots. All statistical analyses were performed using STATISTICA ver. 8 software developed by StatSoft (Tulsa, OK, USA).
3. Results and Discussions
The basic statistical parameters for soil properties are presented in Table 1. The average pH of the soil in the urban forests was 7.22, and in the peri-urban forests, it was 5.36. The pH value of the urban forests means a neutral to alkaline reaction and the value of the peri-urban forests means a moderately acidic reaction. In the urban forests, the soil reaction varies from moderately acidic to weakly alkaline. In the peri-urban forests, the minimum value of the pH is under 4 (a very strong acid reaction) and the maximum is closer to a neutral reaction. The maximum pH was registered in the plots from the urban forest.

Table 1.
Basic statistical parameters of the soil properties investigated in urban and peri-urban forests.
The pH is an important indicator of soil quality because it influences biological and other chemical properties [51]. The reaction of soils from the urban forests was neutral to alkaline. A study conducted in Debrecen on urban soils showed that the reaction was alkaline to moderately alkaline for all of the soil profiles that were executed [52]. Another study performed in Szeged, Hungary, had the same results: the reactions of the soils from the city were alkaline to weakly alkaline, whereas the reactions of the soils from the surrounding areas covered by forest were mostly acidic [22]. The reaction of soils from the peri-urban forest of Brasov was moderately acidic, such as in the forest around Szeged. The bedrock of Brasov and the surrounding areas are made up of limestone and conglomerates [53]; both urban and peri-urban forests are located on these types of rocks, but the soil reactions are very different. Horváth et al. [22] mentioned in their study that the alkaline reaction of urban soils is an effect of the bedrock as well as of anthropogenic influence. Similar results were observed in the city of Jinan (China), which is very rich in forest resources and where three types of areas were delimitated (urban, suburban, and rural) [25]. The highest pH values were obtained in the urban area (7.85—alkaline reaction) and then the values decreased (4.88 and 4.50 in the suburban and rural areas, respectively) [25].
The average N content was similar in the plots from the urban and peri-urban areas (0.28% vs. 0.24%), which means a medium level of nitrogen content in the soil for both areas. The highest content was determined to be in the peri-urban forest (0.90%). The SOM was higher in the urban forest (5.53%) than in the peri-urban forest (4.69%), but the difference was not so big. In conclusion, the soils from the urban and peri-urban forests belong to the moderately humiferous to highly humiferous categories.
The sum of the basic exchangeable cations (SB) was much higher in the urban forest (33.13 me/100 g soil) by more than double compared with the peri-urban forest (15.17 me/100 g soil). The maximum value was the same for both areas, but the mean was very different. Regarding exchangeable acidity (SH), the plots from the peri-urban area registered a higher value (10.04 me/100 g soil) than in the urban area (3.62 me/100 g soil). For this parameter, the minimum value was the same. The cation exchange capacity (CEC) followed the trend of the SB and was higher in the urban forest. The mean value for the cation exchange capacity in the urban forest indicates a high cation exchange capacity; that of the peri-urban forest is in the medium category. Regarding the base saturation degree, a higher value was observed in the urban forest plots (87.68%) compared with the peri-urban area (54.13%).
The analyzed soils of the urban forest of Brasov had a higher cation exchange capacity, which means that a high amount of cations is adsorbed in the soil adsorption complex. According to the base saturation degree, the soil of the urban area is eubasic and that from the peri-urban area is oligomesobasic. This means that the soil of the urban area is richer in basic cations than the other area.
Regarding the physical properties, for the particle size distribution, the following values were observed: the soil from the peri-urban plots was sandier and that from the urban plots was more clayey. The edaphic volume (Ve) was higher in the peri-urban forest plots (0.50 vs. 0.35 m3 m−2) than in the urban forest plots (Table 1), which means the peri-urban soils were deeper and had a lower skeleton proportion.
In the urban forest, the clay content is much higher. In a study of the metropolitan area of Louisville, Kentucky, in forest plots, the predominant granulometric fraction was silt [8], very different from our results in the Brasov metropolitan area. A comparative study between two different cities—Glasgow (United Kingdom) and Aveiro (Portugal)—where the soil samples were collected from parks or ornamental gardens, showed that there was a higher content of sand in Aveiro and silt in Glasgow [54]. In another European city, Sopron (Hungary), samples were collected from different land use types (forests (majority), gardens, viticulture areas, agriculture areas, industrial areas, traffic areas, creek and lake areas, etc.) but for all these areas, the sand content was higher compared with the silt and clay contents [22]. The highest two levels of sand content were observed in the industrial areas followed by the forest area, which are found in the subarea of Sopron [22]. From this point of view, the peri-urban forest of Brasov is similar to the suburban area of Sopron.
The Tp index was higher in the urban forests (92.50) than in the peri-urban plots (67.76), but the maximum values were in the peri-urban soils.
From the point of view of relief characteristics, the study sites were similar in slope and slope aspect but different in altitude. The altitude is much lower in the urban forest and this is probably the main reason these forests are more accessible and more transited.
The contents of heavy metals were determined in the plots of the urban forest, as shown in Figure 2. The mean values of the Cd, Cu, and Pb were small compared with iron and manganese. The smaller values were observed for cadmium content at under 1 mg kg−1. The largest degrees of variation occurred in the cases of the zinc and iron contents.
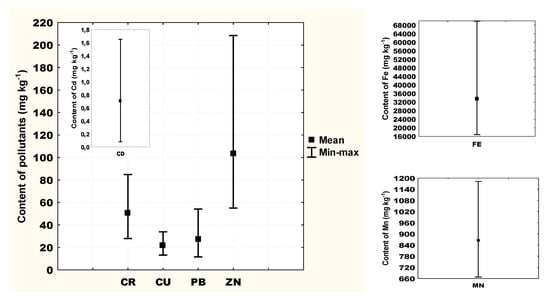
Figure 2.
Contents of heavy metals in plots from urban forest.
The heavy metal concentrations were under the legal limit with one exception—the lead content in the two plots exceeded the alert threshold of 50 mg kg−1 that was established in Romania through a pollution law [55]. With this exception, no other heavy metal exceeded the alert threshold. The specialized literature is very rich in research on heavy metal contents and pollution in soil. In the peri-urban area of Madrid, under different land cover types (forest was one type of land cover), the obtained mean value of Cd was 0.14 mg kg−1, with 12.95 mg kg−1 for Cu, 29.95 mg kg−1 for Pb, and 42.75 mg kg−1 for Zn [23]. Only one value was similar to the case of Brasov, namely Pb. All the other values were higher in the case of Brasov. For example, the Zn content was more than double in the Brasov urban area compared with Madrid. In another European city, Caserta, Italy, a city with high traffic and population, the samples collected from a park with forest vegetation and meadows showed smaller levels of Cd, Cr, and Cu, and much higher levels of Pb [56] compared with samples from the urban forest of Brasov. The second biggest city in Portugal (Porto) was the study site for research on heavy metals in soil [24]. Here, soil from the urban, rural, industrial, and mining areas was studied. The values obtained for the urban soil were much higher than in the rural area [24], and compared with the urban forest soil in Brasov, only the Cd was higher and the rest of the heavy metals had lower levels in Brasov. For the city of Wien in three forest areas (urban, suburban, and rural), Simon et al. [57] cited the same concentrations of Cd (lower than in Brasov) and higher concentrations of Cr, Cu, Pb, and Zn in the suburban area compared with the urban soil. These concentrations decreased in the rural soils but remained higher than in the urban soils. This can be caused by human activities and is a strange situation that was explored by the authors of “Anomalies in soils among Austrian provinces” [57].
Testing the differences between the urban and peri-urban areas led to significant differences in the case of seven properties (Table 2), namely the pH, SB, SH, T, V, and sand and clay contents.
Table 2.
The statistical differences among soil properties in urban and peri-urban plots.
Even if, from a statistical point of view, significant differences in the soil richness (global potential trophicity index—Tp) were not found, the mean value frames the soils in different trophicity categories, namely that the soil of the urban forest is a eutrophic soil and the soil of the peri-urban forest is mesotrophic. A study conducted in the Gurghiu Mountains (Romania) at the altitude of 700–1500 m (an altitude similar to our research) observed that when the altitude was higher, the Tp index decreased [58]. In our study, it can be observed that the higher altitude of the peri-urban forest (1239.53 m) had a smaller mean Tp value (67.76) compared with the lower altitude of the urban forest (774.4 m) with a higher mean Tp value (92.5). The altitudes between these two locations present significant differences.
Chemical properties that showed significant differences from the statistical point of view were the indexes of the soil adsorptive complex (SB, SH, CEC, V). In a study from Sofia (Bulgaria), significant differences in the CEC were not observed between locations along the urban–rural gradient in soils covered with the species of the genus Quercus; the mean was 43.23 for the urban area and 45.2 f/100 g for the rural area [4], compared with 36.76 (urban area of Brasov) vs. 25.21 me/100 g (Brasov peri-urban area).
The principal component analysis (PCA) was performed separately for the two forest types, taking into consideration the soil properties and geomorphological characteristics (Figure 3). The eigenvalues of the correlation matrix are presented in Figure 4.
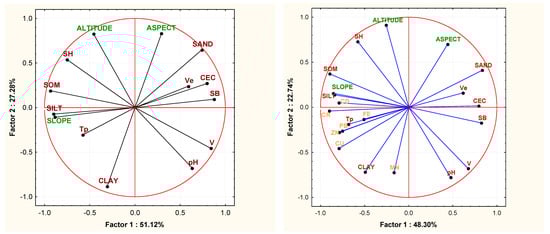
Figure 3.
Principal component analysis (PCA) for urban forest: soil properties and relief characteristics (left) and soil properties with heavy metals content and relief characteristics (right).
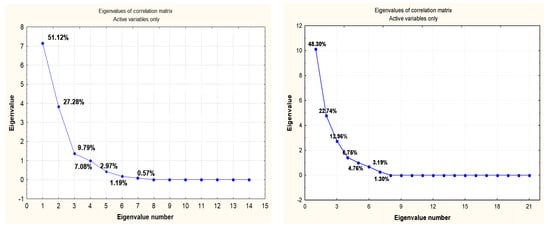
Figure 4.
Eigenvalue of correlation matrix for soil properties and relief characteristics from urban forest (left) and eigenvalue of correlation matrix for soil properties with heavy metals content and relief characteristics (right).
In the case of the urban plots, seven factors were extracted using the PCA. The first three principal components represent 88.27% of the total variance among the 14 characteristics (Figure 3, left). Only two principal components were retained in the analysis because they had higher eigenvalues (Figure 4, right). The first component (Factor 1) contributed 51.12% of the total variance and the second (Factor 2) contributed 27.28%. The variables with the strongest influence on Factor 1 were the silt content (significantly negative), the slope (significantly negative), and the SB (significantly negative) (Figure 3, left). The variables with the strongest influence on Factor 2 were the aspect (significantly positive) and the clay content (significantly negative). Tp and Ve were variables with insignificant influence in explaining Factor 1.
The next step of our analysis of the urban plots was to introduce the heavy metal contents as variables into the PCA. Seven components (factors) were extracted, but the first three accounted for 84% of the variance (Figure 3, right). For the first two factors with the highest eigenvalues (Figure 4, right), a graphical aspect of the variables was carried out. The results show a grouping of the heavy metal content variables (Figure 3, right) relating to the positions of the other variables. Factor 1 (48.30% of the variance) was explained by the CR, CEC, SB, CD, and SILT with a significant inverse correlation. In Factor 1, the CEC, SB, and Ve were negatively correlated with the CD, SILT, and CR. In the case of Factor 2 (22.74% of the variance), the MN and altitude explain these. In Factor 2 these two variables are inversely correlated.
Regarding the peri-urban plots, 12 factors were extracted using the PCA. The first three factors represent 72.78% of the total variance in the 14 characteristics (Figure 5). Only two principal components were retained in the analysis because they had higher eigenvalues (Figure 6). The first component (Factor 1) contributed 39.61% of the total variance and the second one (Factor 2) contributed 24.04%. Compared with the urban plots, in the case of the peri-urban plots, the variables with the strongest influence on Factor 1 were the CEC loadings, Tp, and SB. The variables with the strongest influence on Factor 2 were the aspect and slope. Similar to the urban plots, Ve was the variable with the least significant influence on Factors 1 and 2. Another variable with a low influence on Factor 2 was altitude.
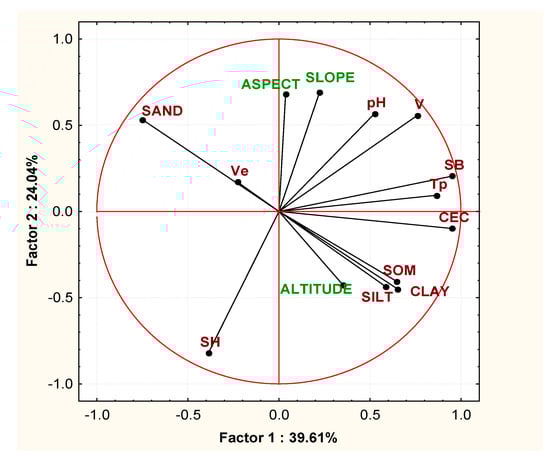
Figure 5.
Principal component analysis (PCA) for soil properties and relief characteristics from peri-urban forest.
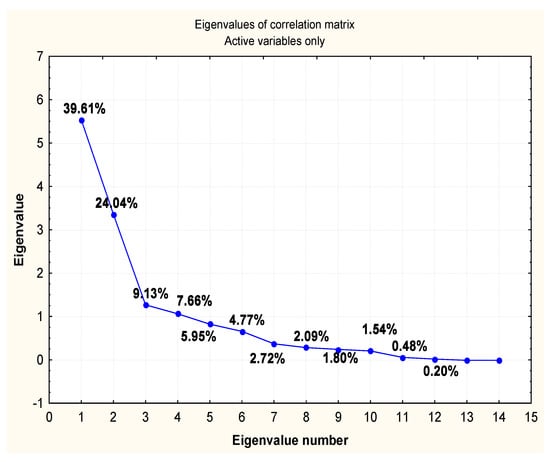
Figure 6.
Eigenvalues of correlation matrix for soil properties and relief characteristics from peri-urban forest.
Regarding multivariate analysis, the study conducted on the Atlantic East Coast of the United States in the urban forests of Newark (Delaware) and Philadelphia (Pennsylvania) performed this type of analysis and showed that the variation in Factor 1 (38,1%) is explained by the pH, Ca content, and Ca/Al ratio [20]. In our case, the variation in Factor 1 (51.12%) is higher and explained by the SB, silt content, and a relief characteristic—slope. The higher percentage in our case could be explained by the introduction of this relief characteristic into the model. When it was introduced to the model, the variation in the heavy metal contents of Factor 1 is explained by the CEC, Cr and Cd contents, and silt content. In another multivariate analysis for Wien, the pH and the P, S, Ca, Mg, and Mn contents explain the variation in Factor 1 [51]. The pH is the chemical property that is common for both cited models. On the other hand, in a model realized for different types of vegetation in a mountain area in China, the pH had a very wick load on Factor 2 [59]. The difference between the urban forest and the peri-urban forest is very visible because the properties that explain the variation in Factor 1 in the case of the peri-urban forest are grouped on the positive side of the axis, and for the urban forest, they are grouped approximately equally on both sides of the axis. The common soil properties of these two types of forests explain the variation in Factor 1 are CEC and SB. In addition, these two properties present significant differences between the studied locations. In Sofia (Bulgaria), the PCA conducted separately for the urban area and rural area showed that Factor 1 in the urban area is explained by the Cu content (mobile and total), CEC, clay content, and some metals from leaves; Factor 2 is explained by the Pb and Zn contents, pH and SOM, and Cu from roots [4]. The fact that the CEC appears as the explanation of Factor 1 in the urban area of Sofia is in line with our results of the urban forest of Brasov. In the case of the rural area from the same study, similarities to the peri-urban area of Brasov were not observed.
Another statistical analysis conducted for these two types of forests was a cluster tree diagram of the soil properties and relief characteristics. For the urban plots, the cluster tree diagram indicates four important clusters (Figure 7). The V and Tp each form a cluster with a high Euclidian distance. This is different from the other properties, which are more similar (Figure 7). The pH, SOM, SH, and Ve have similar Euclidian distances and come together under a single cluster. Another cluster of properties was formed by the SB, CEC, sand, silt, and clay.
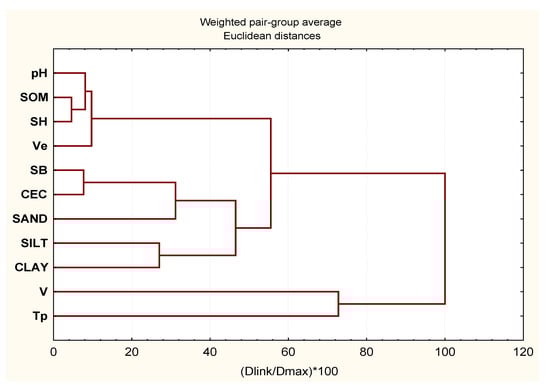
Figure 7.
Cluster diagram of soil properties of urban forest.
For the peri-urban plots, five clusters were formed. The sand with V and Tp had the highest Euclidian distance (Figure 8). The cluster with the lowest Euclidian distance was the pH, SOM, Ve, and SH. Other similar properties which are under the same cluster were the SB, CEC, silt, and clay (Figure 8).
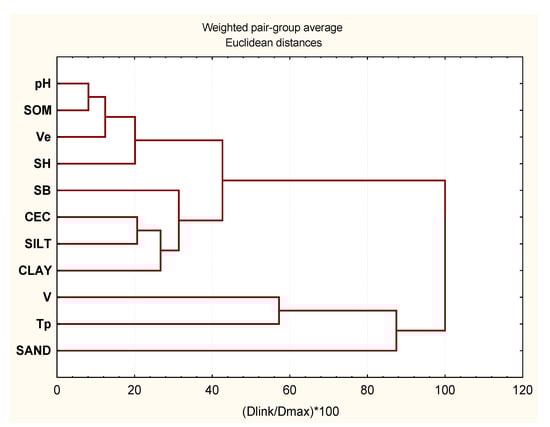
Figure 8.
Cluster diagram of soil properties from peri-urban forest.
In the case of cluster analysis, it was interesting to observe that for both the studied forests, the soil properties with the smallest Euclidian distance are, in principle, the properties that showed significant differences between locations. This method was also used in another study for grouping different soil properties such as in two forests that are crossed by a highway in India [60]. This study introduced the contents of heavy metals, organic carbon, pH, contents of nutritive elements (N, P, K), and tree biomass production [60] in cluster diagrams. Another study used this method to detect the similarities between urban soil and natural soil from a river valley based on physical properties (coarse, clay, silt, and sand contents) and chemical properties (pH, organic carbon, total nitrogen and phosphorus, CEC, content of carbonates, and C/N ratio) [61]. To assess the pollution of heavy metals in a very industrialized and urbanized area in China, the authors used cluster analyses and observed five big clusters, taking into account the contents of 11 heavy metals [26]. Another study used this method for one soil property, namely black carbon (residual carbon). All collected soil samples for this variable were grouped into two big clusters: the first cluster grouped the samples from rural and urban forests and the second cluster grouped samples from urban parks [62].
The importance of urban forests and surrounding areas is very high for communities. The pressure of urbanization can have a negative impact on the stability and quality of forests. These impacts can affect the ecosystem services provided by forests. Soil, as a component of the forest ecosystem, can be affected by these impacts on forest health. From this point of view, the evaluation of soil properties, nutrients, loss of SOM, pollution, biodiversity, etc. is very important to perform at certain time intervals.
From a policy framework perspective, soil science contributes to achieving the United Nations Sustainable Development Goals (SDGs). The sustainable management of soil health is important to achieving several SDGs connected with soil health, including SDG 2 (Zero Hunger), SDG 3 (Good Health and Well-being), SDG 6 (Clean Water and Sanitation), SDG 11 (Sustainable Cities and Communities), SDG 12 (Responsible Consumption and Production), SDG 13 (Climate Action), and SDG 15 (Life on Land) [63,64].
In particular, for this study, SDG 11.3 (to “enhance inclusive and sustainable urbanization and capacity for participatory, integrated and sustainable human settlement planning and management in all countries” by 2030) and SDG 15.3 (to “combat desertification, restore degraded land and soil, including land affected by desertification, drought and floods, and strive to achieve a land degradation-neutral world” by 2030) are connected to this study and give it more importance. Soil degradation through the decline of soil organic matter (SOM) is significant because it affects soil fertility, soil structure, water retention, and nutrient contents [65].
This study is more relevant in light of the EU Soil Strategy [66], which sets out a framework and concrete measures to protect and restore soils. As the main actions, the strategy is focused on creating a dedicated legislative proposal on soil health by 2023 and achieving good soil health by 2050; developing sustainable soil management; restoring degraded soils and remediating contaminated sites; preventing desertification by developing a common methodology to assess desertification and land degradation or increasing research, data, and monitoring on soil [66]. This strategy is also connected to the European Green Deal [67], which has adopted a zero pollution ambition. For these, and to protect Europe’s citizens and ecosystems, the EU needs to better monitor, report, prevent, and remedy pollution in the air, water, soil, and consumer products [67]. At the local level, the forest administration together with the municipality and other stakeholders can recommend a set of measurements to the users of urban and peri-urban forests such as: improving the forest infrastructure for better-organized activity, walking on the indicated trails, and in some areas with identifiable disturbances access should be restricted for a certain time period.
4. Conclusions
The soils from the urban and peri-urban forests of the metropolitan area of Brasov are different from the point of view of chemical and physical properties. The chemical properties which present significant differences were reaction SB, SH, T, and V, and the different physical properties were sand and clay contents. The soil of the urban forest had an alkaline reaction and was more clayey and the soil of peri-urban forest were sandier and had a moderately acidic reaction.
The soil richness (trophicity) was not significant between these types of forests but the soils of the urban forest are eutrophic (richer than that of the peri-urban forest).
The heavy metal concentrations were under the legal limit with one exception—the lead content of two plots from the urban forest exceeded the alert threshold.
Using PCA, the most significant and important soil properties of the urban forest were SB, CEC, SOM, silt and clay contents, and for the peri-urban forest were CEC, SB, and Tp.
For the urban plots, the cluster analysis indicates that the V and Tp form a cluster with a high Euclidian distance different from the other properties. In the case of peri-urban plots, the sand with V and Tp had the highest Euclidian distance and are grouped into a main cluster.
However, our research had some limitations such as the density of soil profiles and locations, and the determination of additional soil properties such as biological properties or physicomechanical properties (e.g., trampling). Based on the results of our study, the local forest administration can adopt some measurements such as monitoring the soil pollution level and paying attention to the change of soil properties of urban forests under the use of ecosystem services.
Author Contributions
Conceptualization, R.E.E. and Ș.D.; methodology, R.E.E. and M.Z.; validation, L.D. and Ș.D.; writing—original draft preparation, R.E.E., M.Z. and D.V.; writing—review and editing, R.E.E., L.D. and D.V.; supervision, L.D. and Ș.D. All authors have read and agreed to the published version of the manuscript.
Funding
This research was funded by Operational Program Competitiveness, Axis: 1 Research, technological development and innovation (RDI) in support of economic competitiveness and business development, Action: 1.2.3. Knowledge transfer partnerships, type D activities; Project Name: Increasing the economic competitiveness of the forestry sector and the quality of life through the transfer of knowledge, technology and skills to CDI; ID/Cod My SMIS: P_40_380/105506; Contract no. 15/01.09.2016; Subsidiary contract no. 14/23.07.2019—“Monitoring the state of forest ecosystems and capitalizing on the recreational, cultural and historical potential of urban and peri-urban forests managed by RPLP Kronstadt” and by the Romanian Ministry of Research, Innovation and Digitization through Program 1—Development of the national research—development system, Subprogram 1.2—Institutional performance—Projects to finance excellence in RDI, project “Increasing the institutional capacity and performance of INCDS “Marin Drăcea” in the activity of RDI—CresPerfInst” (Contract no. 34PFE./30.12.2021).
Acknowledgments
The authors want to thank eng. Cristian Cătălin for the help in GIS maps realization. We also thank the anonymous reviewers for their work in analyzing our study.
Conflicts of Interest
The authors declare no conflict of interest.
References
- Greinert, A. The heterogeneity of urban soils in the light of their properties. J. Soils Sediments 2015, 15, 1725–1737. [Google Scholar] [CrossRef] [Green Version]
- Grimm, N.B.; Grove, J.M.; Pickett, S.T.A.; Redman, C.L. Integrated approaches to long-term studies of urban ecological systems. Bioscience 2000, 50, 571–584. [Google Scholar] [CrossRef] [Green Version]
- Dobbs, C.; Escobedo, F.J.; Zipperer, W.C. A framework for developing urban forest ecosystem services and goods indicators. Landsc. Urban Plan. 2011, 99, 196–206. [Google Scholar] [CrossRef]
- Doichinova, V.; Zhiyanski, M.; Hursthouse, A.; Bech, J. Study on the mobility and bioavailability of PTEs in soils from Urban Forest Parks in Sofia, Bulgaria. J. Geochem. Explor. 2014, 147, 222–228. [Google Scholar] [CrossRef]
- Nowak, D.J.; Crane, D.E.; Stevens, J.C. Air pollution removal by urban trees and shrubs in the United States. Urban For. Urban Green 2006, 4, 115–123. [Google Scholar] [CrossRef]
- Madrid, L.; Diaz-Barrientos, E.; Ruiz-Corte´s, E.; Reinoso, R.; Biasioli, M.; Davidson, C.M.; Duarte, A.C.; Grcman, H.; Hossack, I.; Hursthouse, A.; et al. Potentially toxic metals in urban soils of six European cities: A pilot study on selected parks. J. Environ. Monitor. 2006, 8, 1158–1165. [Google Scholar] [CrossRef] [Green Version]
- Morel, J.L.; Heinrich, A.B. SUITMA—Soils in urban, industrial, traffic, mining and military areas. J. Soils Sediments 2008, 8, 206–207. [Google Scholar] [CrossRef]
- Trammell, T.L.; Schneid, B.P.; Carreiro, M.M. Forest soils adjacent to urban interstates: Soil physical and chemical properties, heavy metals, disturbance legacies, and relationships with woody vegetation. Urban Ecosyst. 2011, 14, 525–552. [Google Scholar] [CrossRef]
- Biasioli, M.; Barberis, R.; Ajmone-Marsan, F. The influence of a large city on some soil properties and metals content. Sci. Total Environ. 2006, 356, 154–164. [Google Scholar] [CrossRef]
- Fang, S.; Hu, H.; Sun, W.C.; Pan, J.J. Spatial variations of heavy metals in the soils of vegetable-growing land along urban–rural gradient of Nanjing, China. Int. J. Environ. Res. Public Health 2011, 8, 1805–1816. [Google Scholar] [CrossRef]
- Śkrbić, B.; Mladenović, N. Distribution of heavy elements in urban and rural surface soils: The Novi Sad city and the surrounding settlements, Serbia. Environ. Monit. Assess. 2013, 186, 457–471. [Google Scholar] [CrossRef] [PubMed]
- Morel, J.L.; Schwartz, C.; Florentin, L.; de Kimpe, C. Urban soils. In Encyclopedia of Soils in the Environment; Hillel, D., Hatfield, J.L., Eds.; Elsevier: Amsterdam, The Netherlands, 2005; Volume 3, pp. 202–208. [Google Scholar]
- Alvey, A.A. Promoting and preserving biodiversity in the urban forest. Urban For. Urban Green 2006, 5, 195–201. [Google Scholar] [CrossRef]
- Zhiyanski, M.; Sokolovska, M.; Glushkova, M.; Vilhar, U.; Lozanova, L. Soil Quality. In The Urban Forest: Cultivating Green Infrastructure for People and the Environment; Pearlmutter, D., Calfapietra, C., Samson, R., O’Brien, L., Ostoić, S.K., Sanesi, G., del Amo, R.A., Eds.; Springer: Berlin/Heidelberg, Germany, 2017; Volume 7, pp. 49–58. [Google Scholar]
- Lorenz, K.; Lal, R. Biochemical C and N cycles in urban soils. Environ. Int. 2009, 35, 1–8. [Google Scholar] [CrossRef] [PubMed]
- Wang, P.; Zheng, H.; Ren, Z.; Zhang, D.; Zhai, C.; Mao, Z.; He, X. Effects of urbanization, soil property and vegetation configuration on soil infiltration of urban forest in Changchun, Northeast China. Chin. Geogr. Sci. 2018, 28, 482–494. [Google Scholar] [CrossRef] [Green Version]
- Lu, S.; Wang, H.; Bai, S. Heavy metal contents and magnetic susceptibility of soils along an urban–rural gradient in rapidly growing city of eastern China. Environ. Monit. Assess. 2009, 155, 91–101. [Google Scholar] [CrossRef]
- Pouyat, R.V.; Yesilonis, I.D.; Szlavecz, K.; Csuzdi, C.; Hornung, E.; Korsós, Z.; Russell-Anelli, J.; Giorgio, V. Response of forest soil properties to urbanization gradients in three metropolitan areas. Landsc. Ecol. 2008, 23, 1187–1203. [Google Scholar] [CrossRef]
- McDonnell, M.J.; Pickett, S.T.A.; Pouyat, R.V.; Parmelee, R.W.; Carreiro, M.M.; Groffman, P.M.; Bohlen, P.; Zipperer, W.C.; Medley, K. Ecosystem processes along urban-torural gradients. Urban Ecosyst. 1997, 1, 21–36. [Google Scholar] [CrossRef]
- Trammell, T.L.; Pouyat, R.V.; D’Amico, V. Soil chemical properties in forest patches across multiple spatiotemporal scales in mid-Atlantic US metropolitan areas. Urban Ecosyst. 2021, 24, 1085–1100. [Google Scholar] [CrossRef]
- Guzmán, P.; Benítez, Á.; Carrión-Paladines, V.; Salinas, P.; Cumbicus, N. Elevation and Soil Properties Determine Community Composition, but Not Vascular Plant Richness in Tropical Andean Roadside. Forests 2022, 13, 685. [Google Scholar] [CrossRef]
- Horváth, A.; Szűcs, P.; Bidló, A. Soil condition and pollution in urban soils: Evaluation of the soil quality in a Hungarian town. J. Soils Sediments 2015, 15, 1825–1835. [Google Scholar] [CrossRef] [Green Version]
- Vázquez De La Cueva, A.; Marchant, B.P.; Quintana, J.R.; de Santiago, A.; Lafuente, A.L.; Webster, R. Spatial variation of trace elements in the peri-urban soil of Madrid. J. Soils Sediments 2014, 14, 78–88. [Google Scholar] [CrossRef] [Green Version]
- Rodrigues, S.M.; Cruz, N.; Coelho, C.; Henriques, B.; Carvalho, L.; Duarte, A.C.; Pereira, E.; Römkens, A.M. Risk assessment for Cd, Cu, Pb and Zn in urban soils: Chemical availability as the central concept. Environ. Pollut. 2013, 183, 234–243. [Google Scholar] [CrossRef] [PubMed]
- Shen, H.; Yang, B.; Wang, H.; Sun, W.; Jiao, K.; Qin, G. Changes in Soil Ectomycorrhizal Fungi Community in Oak Forests along the Urban–Rural Gradient. Forests 2022, 13, 675. [Google Scholar] [CrossRef]
- Hu, Y.; Liu, X.; Bai, J.; Shih, K.; Zeng, E.Y.; Cheng, H. Assessing heavy metal pollution in the surface soils of a region that had undergone three decades of intense industrialization and urbanization. Environ. Sci. Pollut. Res. 2013, 20, 6150–6159. [Google Scholar] [CrossRef]
- Spârchez, G.; Târziu, D.R.; Dincă, L. Pedology with Elements of Geology and Geomorphology (in Romanian); Transilvania University Publishing House: Brașov, Romania, 2013; p. 348. [Google Scholar]
- Kiryushin, V.I. Assessment of Land Quality and Soil Fertility for Planning Farming Systems and Agrotechnologies. Eurasian Soil Sci. 2007, 40, 785–791. [Google Scholar] [CrossRef]
- Târziu, D.; Spârchez, G. Forest Soils; Transilvania University Publishing House: Brașov, Romania, 2013; p. 257. (In Romanian) [Google Scholar]
- Enescu, R.; Davidescu, Ş.; Cǎtǎlin, C.; Zup, M.; Mirițǎ, M.G.; Samoilǎ, A.; Pitar, D. Methodology of delimitation the urban and peri-urban forests with recreational, cultural, and historical functions. Rev. Silvic. Cineg. 2019, 24, 70–77. [Google Scholar]
- Vasile, D.; Enescu, R.; Vechiu, E.; Ienășoiu, G.; Cătălin, C.; Davidescu, Ș. Biodiversity assessment and monitoring at the level of the herbaceous plant species in the forests managed by RPLP Kronstadt. Rev. Silvic. Cineg. 2021, 26, 95–102. [Google Scholar]
- Davidescu, Ş.; Ungurean, C.; Mărțoiu, N.; Enescu, R.; Zup, M.; Olteanu, D.; Comănici, A.; Tudose, N.C. Involving stakeholders in the development of recreational infrastructure in forests nearby Braşov municipality. Rev. Silvic. Cineg. 2020, 25, 77–84. [Google Scholar]
- National Statistics Institute 2021. Data. Available online: www.insse.ro (accessed on 25 May 2022).
- Statistic Data on Brasov County. Available online: https://brasov.insse.ro/ (accessed on 28 June 2022).
- Cristea, M.; Mare, C.; Moldovan, C.; China, A.; Farole, T.; Vințan, A.; Park, J.; Garrett, K.P.; Ionescu-Heroiu, M. Magnet Cities: Migration and Commuting in Romania; World Bank: Washington, DC, USA, 2017; p. 494. (In Romanian) [Google Scholar]
- European Commision. European Commision on Environmental Issue in Romania. 2014. Available online: https://ec.europa.eu/commission/presscorner/detail/MT/MEMO_14_537 (accessed on 2 May 2022).
- Maftei, C.; Muntean, R.; Poinareanu, I. The Impact of Air Pollution on Pulmonary Diseases: A Case Study from Brasov County, Romania. Atmosphere 2022, 13, 902. [Google Scholar] [CrossRef]
- Irisilva Forest Planning Company. U.P.IV Brasov Forest Management Plan of Brasov Municipality Forest Managed by R.P.L.P. Kronstadt R.A. Private Forest District; Irisilva Publisher: Brașov, Romania, 2015; p. 553. [Google Scholar]
- STAS 7184/1-84; 1984: Soils. Sample Collection for Soil and Agrochemical Studies. Romanian Standardization Association: Bucharest, Romania, 1984; p. 10.
- ISO 18400-205; Soil Quality—Sampling—Part 205: Guidance on the Procedure for Investigation of Natural, Near-Natural and Cultivated Sites. International Standardisation Organisation: Geneva, Switzerland, 2018; p. 14.
- SR 7184-13; Soil–Determination of pH in Water and Saline Suspensions (Mass/Volume) and in Saturated Paste. Romanian Standardization Association: Bucharest, Romania, 2001; p. 6.
- ISO 10390; Soil Quality-Determination of pH. International Standardisation Organisation: Geneva, Switzerland, 2005; p. 5.
- STAS 7184/21-82; Soil–Determination of Humus Content. Romanian Standardization Association: Bucharest, Romania, 1982; p. 4.
- FAO. Standard Operating Procedure for Soil Organic Carbon. Walkley-Black Method Titration and Colorimetric Method; FAO: Rome, Italy, 2019; p. 27. [Google Scholar]
- SR ISO 11261; Soil Quality–Determination of Total Nitrogen–Modified Kjeldahl Method. Romanian Standardization Association: Geneva, Romania, 2000; p. 8.
- STAS 7184/12-88; Soil–Determination of Cation Exchange Properties. Romanian Standardization Association: Geneva, Romania, 1988; p. 26.
- SR ISO 11047; Soil Quality–Determination of Cadmium, Chromium, Cobalt, Copper, Lead, Manganese, Nikel and Zinc in Aqua regia Extracts of Soil–Flame and Electrothermal Atomic Absorption Spectrometric Methods. Romanian Standardization Association: Geneva, Romania, 1999; p. 22.
- ISO 11277; Soil Quality-Determination of Particle Size Distribution in Mineral Soil Material–Method by Sieving and Sedimentation. International Standardisation Organisation: Geneva, Switzerland, 1998; p. 34.
- UNCPE-ICP Forest. Manual on methods and criteria for harmonized sampling, assessment, monitoring and analysis of the effects of air pollution on forests, Part X-Sampling and analysis of soil, Annex. United Nations Economic Comission for Europe: Convention on Long-Range Transboundary Air Pollution; International Co-Operative Programme on Assessment and Monitoring of Air Pollution Effects on Forests (ICP Forests); UNECE: Geneva, Switzerland, 2016; p. 29. [Google Scholar]
- Târziu, D.; Spârchez, G.; Dincă, L. Soils. Practical Aspects; Transilvania University Publishinghouse: Brașov, Romania, 2000; p. 164. (In Romanian) [Google Scholar]
- Schoenholtz, S.H.; Van Miegroet, H.; Burger, J.A. A review of chemical and physical properties as indicators of forest soil quality: Challenges and opportunities. For. Ecol. Manag. 2000, 138, 335–356. [Google Scholar] [CrossRef]
- Sándor, G.; Szabó, G. Influence of human activities on the soils of Debrecen, Hungary. Soil Sci. Ann. 2014, 65, 2. [Google Scholar] [CrossRef] [Green Version]
- Romanian Geological Institute. Geological Map of Romania. Available online: http://geo-spatial.org/vechi/ (accessed on 5 May 2022).
- Rodrigues, S.; Urquhart, G.; Hossack, I.; Pereira, M.E.; Duarte, A.C.; Davidson, C. The influence of anthropogenic and natural geochemical factors on urban soil quality variability: A comparison between Glasgow, UK and Aveiro, Portugal. Environ. Chem. Lett. 2009, 27, 141–148. [Google Scholar] [CrossRef]
- Romanian Government. Ministerial Order No. 756: Regulation on Environmental Pollution Assessment; Romanian Government: Bucharest, Romania, 1997.
- Papa, S.; Bartoli, G.; Pellegrino, A.; Fioretto, A. Microbial activities and trace element contents in an urban soil. Environ. Monit. Assess. 2010, 165, 193–203. [Google Scholar] [CrossRef] [PubMed]
- Simon, E.; Vidic, A.; Braun, M.; Fábián, I.; Tóthmérész, B. Trace element concentrations in soils along urbanization gradients in the city of Wien, Austria. Environ. Sci. Pollut. Res. 2013, 20, 917–924. [Google Scholar] [CrossRef] [PubMed] [Green Version]
- Cicșa, A.; Tudoran, G.M.; Boroeanu, M.; Dobre, A.C.; Spârchez, G. Influence of Soil Genesis Factors on Gurghiu Mountain Forest Soils’ Physical and Chemical Properties. Bull. Transilv. Univ. Bras. II For. Wood Ind. Agric. Food Eng. 2021, 14, 1–14. [Google Scholar] [CrossRef]
- Wu, X.; Fu, D.; Duan, C.; Huang, G.; Shang, H. Distributions and Influencing Factors of Soil Organic Carbon Fractions under Different Vegetation Restoration Conditions in a Subtropical Mountainous Area, SW China. Forests 2022, 13, 629. [Google Scholar] [CrossRef]
- Malunguja, G.K.; Thakur, B.; Devi, A. Heavy Metal Contamination of Forest Soils by Vehicular Emissions: Ecological Risks and Effects on Tree Productivity. Environ. Process. 2022, 9, 11. [Google Scholar] [CrossRef]
- Amossé, J.; Le Bayon, R.C.; Gobat, J.M. Are urban soils similar to natural soils of river valleys? J. Soils Sediments 2015, 15, 1716–1724. [Google Scholar] [CrossRef] [Green Version]
- Wang, M.; Liu, X.; Wu, W.; Zeng, H.; Liu, M.; Xu, G. Effects of Urbanization Intensity on the Distribution of Black Carbon in Urban Surface Soil in South China. Forests 2022, 13, 406. [Google Scholar] [CrossRef]
- Lal, R.; Bouma, J.; Brevik, E.; Dawson, L.; Field, D.J.; Glaser, B.; Hatano, R.; Hartemink, A.E.; Kosaki, T.; Lascelles, B.; et al. Soils and sustainable development goals of the United Nations: An International Union of Soil Sciences perspective. Geoderma Reg. 2021, 25, e00398. [Google Scholar] [CrossRef]
- European Environmental Agency. Available online: www.eea.europa.eu (accessed on 11 May 2022).
- Paustian, K.; Lehmann, J.; Ogle, S.; Reay, D.; Robertson, G.P.; Smith, P. Climate-smart soils. Nature 2016, 532, 49–57. [Google Scholar] [CrossRef] [PubMed] [Green Version]
- European Commision. Soil Strategy for 2030. 2021. Available online: https://eur-lex.europa.eu/legal-content/EN/TXT/PDF/?uri=CELEX:52021DC0699&from=EN (accessed on 11 May 2022).
- European Commision. The European green Deal. European Commision. 2019. Available online: https://eur-lex.europa.eu/resource.html?uri=cellar:b828d165-1c22-11ea-8c1f-01aa75ed71a1.0002.02/DOC_1&format=PDF (accessed on 11 May 2022).
Publisher’s Note: MDPI stays neutral with regard to jurisdictional claims in published maps and institutional affiliations. |
© 2022 by the authors. Licensee MDPI, Basel, Switzerland. This article is an open access article distributed under the terms and conditions of the Creative Commons Attribution (CC BY) license (https://creativecommons.org/licenses/by/4.0/).