1. Introduction
The trend of pressure to reduce operating costs together with the optimization of production processes to make the best use of the input raw material was not bypassed even by the wood processing industry. We are on the threshold of the fourth industrial revolution and there is a transformation in established processes [
1]. There is no doubt that the breadth and depth of these changes will result in the transformation of entire production and management systems [
2,
3]. When processing logs in the wood processing industry, innovative technologies are essential. For the wood processing industry to be competitive in the future, the priority must be to reach the technological level of industry leaders [
4].
Philp H. Steele addressed the conditions and contexts that influence the use of sawlogs in 1984 [
5]. He identified the main factors influencing the final yield of sawlogs. Increasing the yield of sawlogs due to log rotation has been discussed in detail by Lundahl & Grönlund (2010) [
6]. They state that the implementation of the cutting plan in the correct position of the log results in an increase in the sawn timber yield by 4.5%. Extensive work dealing with the optimization of log cutting was also presented by Lindner et al., (2015) [
7]. The authors describe individual types of cutting plans, and methods of their implementation, define the factors that influence the choice of cutting plan, and describe the basic mathematical model for the program for creating log cutting plans [
8]. Geerts (1984), Lin et al., (2011), and Meier & Rukki, (2001) [
9,
10,
11] have also addressed the optimization of cutting plans and the creation of programs for this purpose.
Today, various types of scanners are available for the wood-processing industry. The simplest ones are scanners for the presence of metals in logs. Higher-level scanners are combined with an optical or laser scanner to scan the surface of the log [
12]. 2D stationary X-ray scanners are available for information on internal log wood features [
13]. The latest technology is 3D CT log scanners, which are used to create an accurate three-dimensional model of the scanned log [
14,
15]. Algorithms for wood qualitative features detection are applied to this model [
16]. By combining software for creating log cutting plans with an accurate 3D model of the log with identified features, it is possible to achieve a better evaluation of the input raw material [
17,
18]. The importance of innovation is based on forecasts of future developments in log prices [
19] and requirements to ensure the sustainability of the sector [
20].
Based on the extent to which they damage the evaluated material, we divide them into destructive, semi-destructive, and non-destructive. In the wood processing industry, of course, non-destructive methods of wood evaluation are most often used. These can be described as identifying the physical and mechanical properties of a material without altering its end-use. Based on the identified properties, a decision is made on its appropriate applications [
21]. The main reasons for using non-destructive methods according to the authors (Schimleck, et al., 2019) [
21] are the protection of investments in wood raw material, potential reduction in wood processing costs, easier use in field measurements, fast real-time data collection, ability to identify the most suitable measurement applications and reduce the variability of product classes [
22].
Non-destructive wood evaluation technologies work on various physical principles. Acoustic, ultrasonic, optical, laser, X-ray and microwave are most often used. In the past, non-destructive methods were used to evaluate very valuable trees (e.g., exotic). Today, these methods are increasingly being introduced (for their speed, accuracy, and affordability) in modern wood processing enterprises, but also in forestry to assess the quality of forest stands.
Scanning technologies allow for different levels of non-destructive evaluation. Based on the publication (Österberg, 2009) [
23], the individual scanning technologies were compared with each other in
Table 1.
Table 1 compares the level of technology procurement costs, the level of applicability, safety, and suitability of selected wood properties. The evaluation ranges from - - - (then the technology is completely inappropriate) to + + + (then the technology is suitable for determining the mentioned properties). In the gray field, we present the results of commercially known technologies.
It can be deduced from the table that the X-ray method is the most suitable for the evaluation of most parameters. These devices are less widespread due to their high prices. In Europe, there are only 4 industrial CT scanners located in France, Sweden, and Germany in terms of the closest distance (
Table 1). Other types of technologies are laser and image ones. Considering that these two technologies are combined in most industrial devices, we can also consider them very suitable for wood evaluation. Laser, image, and also acoustic methods are therefore the most used in industrial practice. Their great advantage is the affordability as well as advanced computer vision technology for image analysis. This results in the possibility of accurate evaluation at high speeds, applicable in fast automated production. Laser, image, and acoustic methods, often combined with IR radiation, are used in all large, automated sawmills in Europe. Gradually, however, they started to be used in medium-sized sawmills.
Logs are a part of trees that are to be used for the production of wood products such as lumber, veneer, and plywood. In today’s competitive environment, it is important that the determination of log volume and log quality is accurate and provides a good basis for revenue estimation. An important factor is also the simplicity of determining the log volume from the user’s point of view.
When exporting Roundwood logs, it is necessary to create a record of each piece, which lists the external parameters (dimensions, quality, and volume) of logs, the type of tree species, or the harvesting location. Several standardized methods are used around the world to measure dimensions and determine log volume. A large number of methods bring confusion to the international timber trade, which creates inconsistencies in the detection of log volume. For the Slovak timber trade, it is recommended to use the standard STN EN 1309-2 Round and sawn timber method of measurement of dimensions. Part 2: Round timber; requirements for the measurement and volume calculation rules [
24]. The standard STN 48 0009 volume tables of round timber without bark according to the mean diameter measured in bark is also commonly used to calculate the volume of a log [
25].
The log volume calculation rules try to estimate the total wood volume without taking into account the expected form of followed processing (there are exceptions). Using different calculation methods, significant differences arise in the determination of log volume. Most calculations are based on the assumption that the stem corresponds to the geometric shape of a cylinder, cone, or paraboloid and that the stem has a circular diameter. The length of the log is given as a nominal value and not a rounded value. This causes further inaccuracies in determining the volume of the log because in some cases the shape of the cutout deviates considerably from the ideal geometric shape [
26].
Depending on the location, state, and business practices, different systems for measuring log volume have become extinct over the years. Examples are:
Rules for determining the volume of logs for Japan, Korea, Chile
Log volume rules for Indonesia, Malaysia and the Philippines
Rules for determining the volume of logs for British Columbia
Rules for determining the volume for Russia
We present some commonly used formulas for calculating the volume of logs, which result in a volume in m
3 [
26].
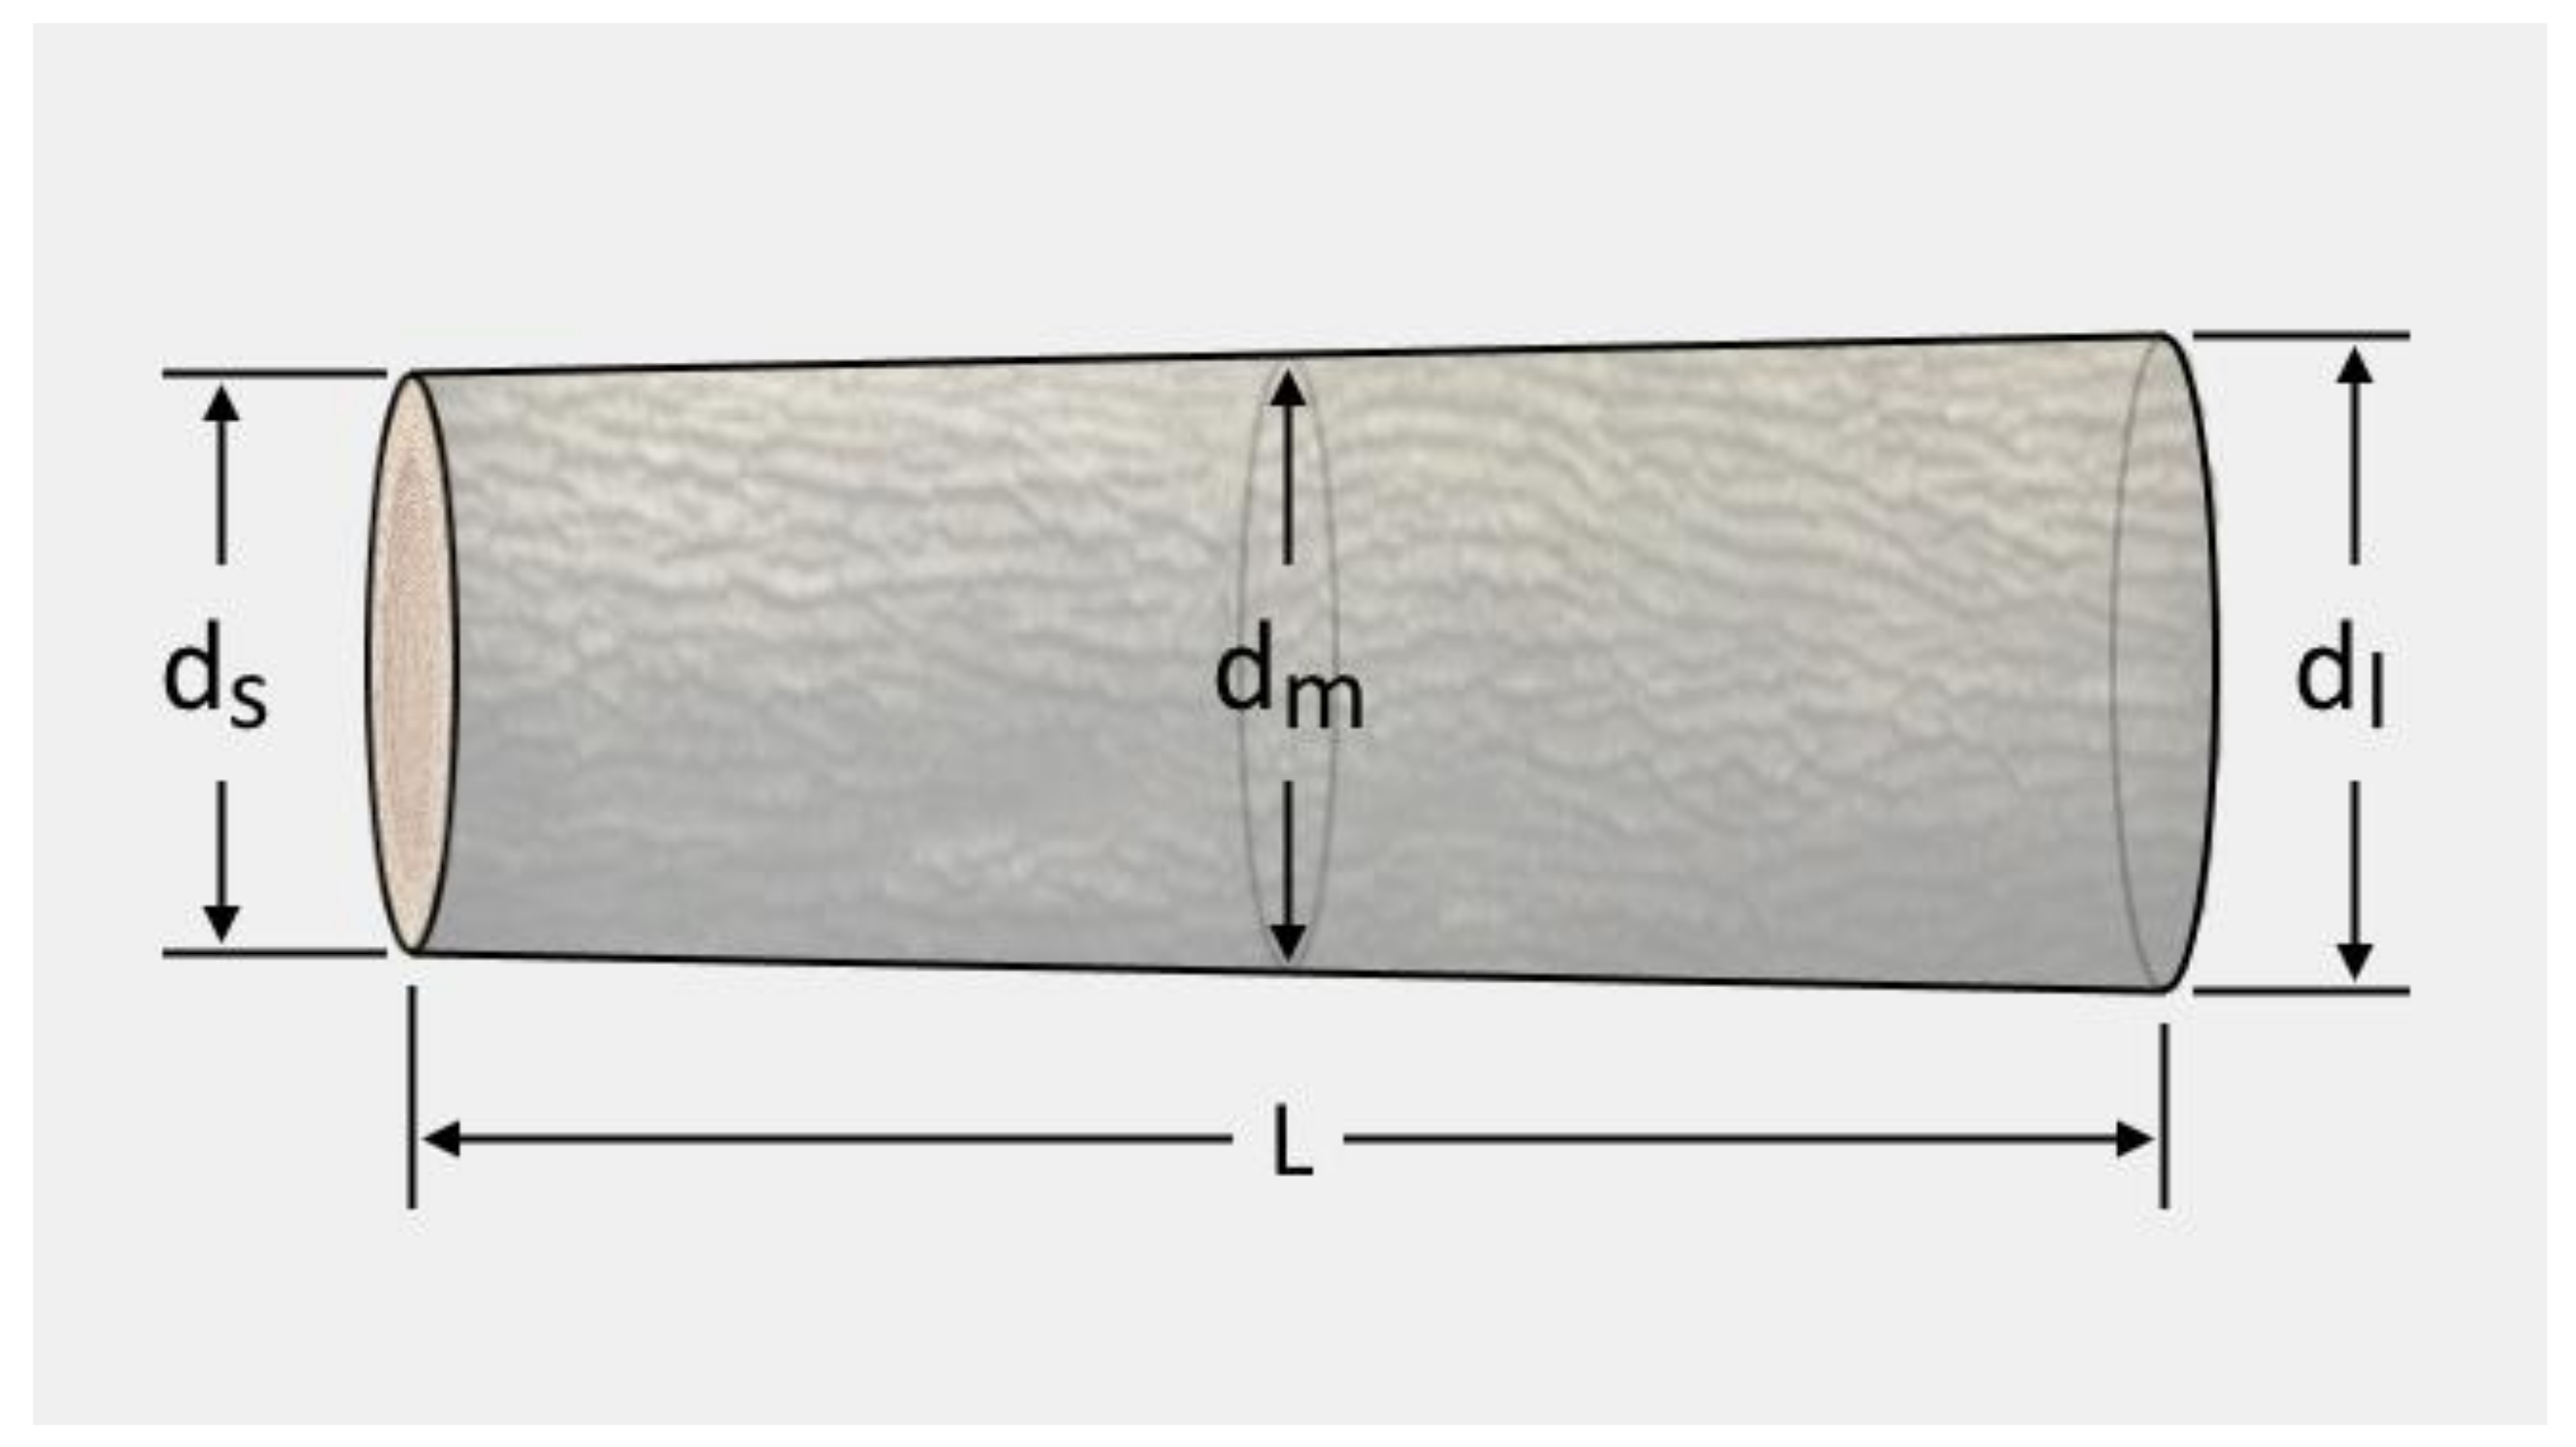
where:
f = 0.00007854
V = volume in cubic meters
ds, dm, dl = top, middle and butt end diameter in centimeters
All of the above relationships calculate the volume of the log as a function that increases steadily with increasing thickness and length of the log. The length of the log is given as a nominal value, and not a rounded value. These assumptions cause inaccuracies in determining the volume of the log, because in some cases the shape of the log has significant deviations from the ideal geometric shape. A Smalian formula is legal in British Columbia. It is based on the assumption that the strain has a paraboloid shape and therefore has a tendency to overestimate. The Huber formula assumes that the average flat cross-section of a log is at its center, this assumption does not always apply, and measuring at the center of a log without bark is impractical. The Sorenson formula is derived from the Huber formula, with the difference that the volume of the log is calculated based on the diameter of the thinner end of the log, assuming that the conicity of the log is a maximum of 1 inch per 10 feet of log length. This measurement is more practical than measuring the diameter of a log without bark in the middle. Newton’s formula is the most accurate but requires measuring the diameter of the thinner and thicker end of the log and even in the middle of the log. Due to its time and impracticality, it is used to a limited extent. The Subneiloid formula is similar to the Smalian formula. The two-end conic formula is based on the assumption that the strain has a conical shape. These facts can bring several problems in practice, which can be eliminated by determining the volume of logs by the digital method [
27].
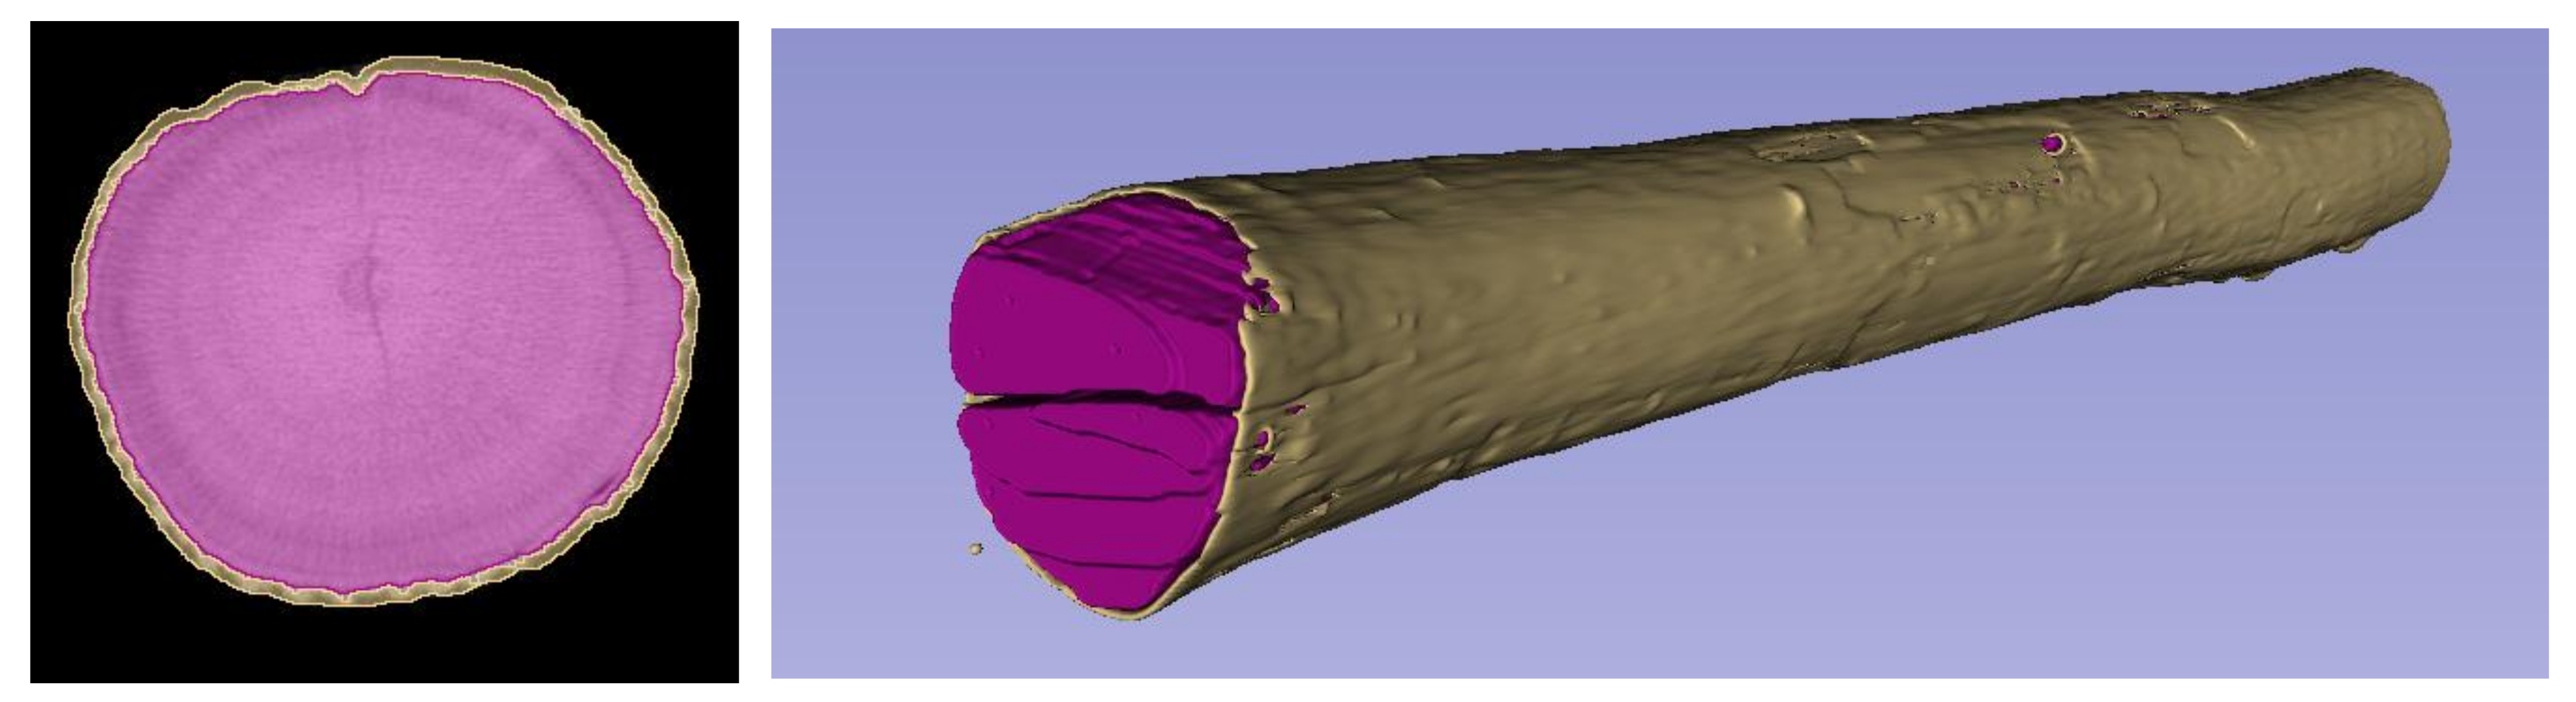
At present, various digital systems for the quantification and qualification of Roundwood logs are being developed, most often based on image and laser scanning technology. These scanners are fast, accurate, and can create a computer model thanks to the three-dimensional reconstruction of the scanned object image, which can be further worked with, for example, dimensions, volume, shape, and, to a limited extent, surface qualitative features of wood logs.
Image and laser scanning technology, combined with X-ray defectoscopy such as computed tomography, allows the exact volume of wood logs to be displayed with internal qualitative features.
These scanners are usually large stationary devices that, using a system of cameras and laser measuring systems, evaluate the external parameters of the log. Devices of this type are commercially available. They are manufactured, for example, by WEINIG Gruppe (CombiScan + model), Innovativ Vision (morel WoodEye 5), and Microtec (Goldeneye series) [
28,
29].
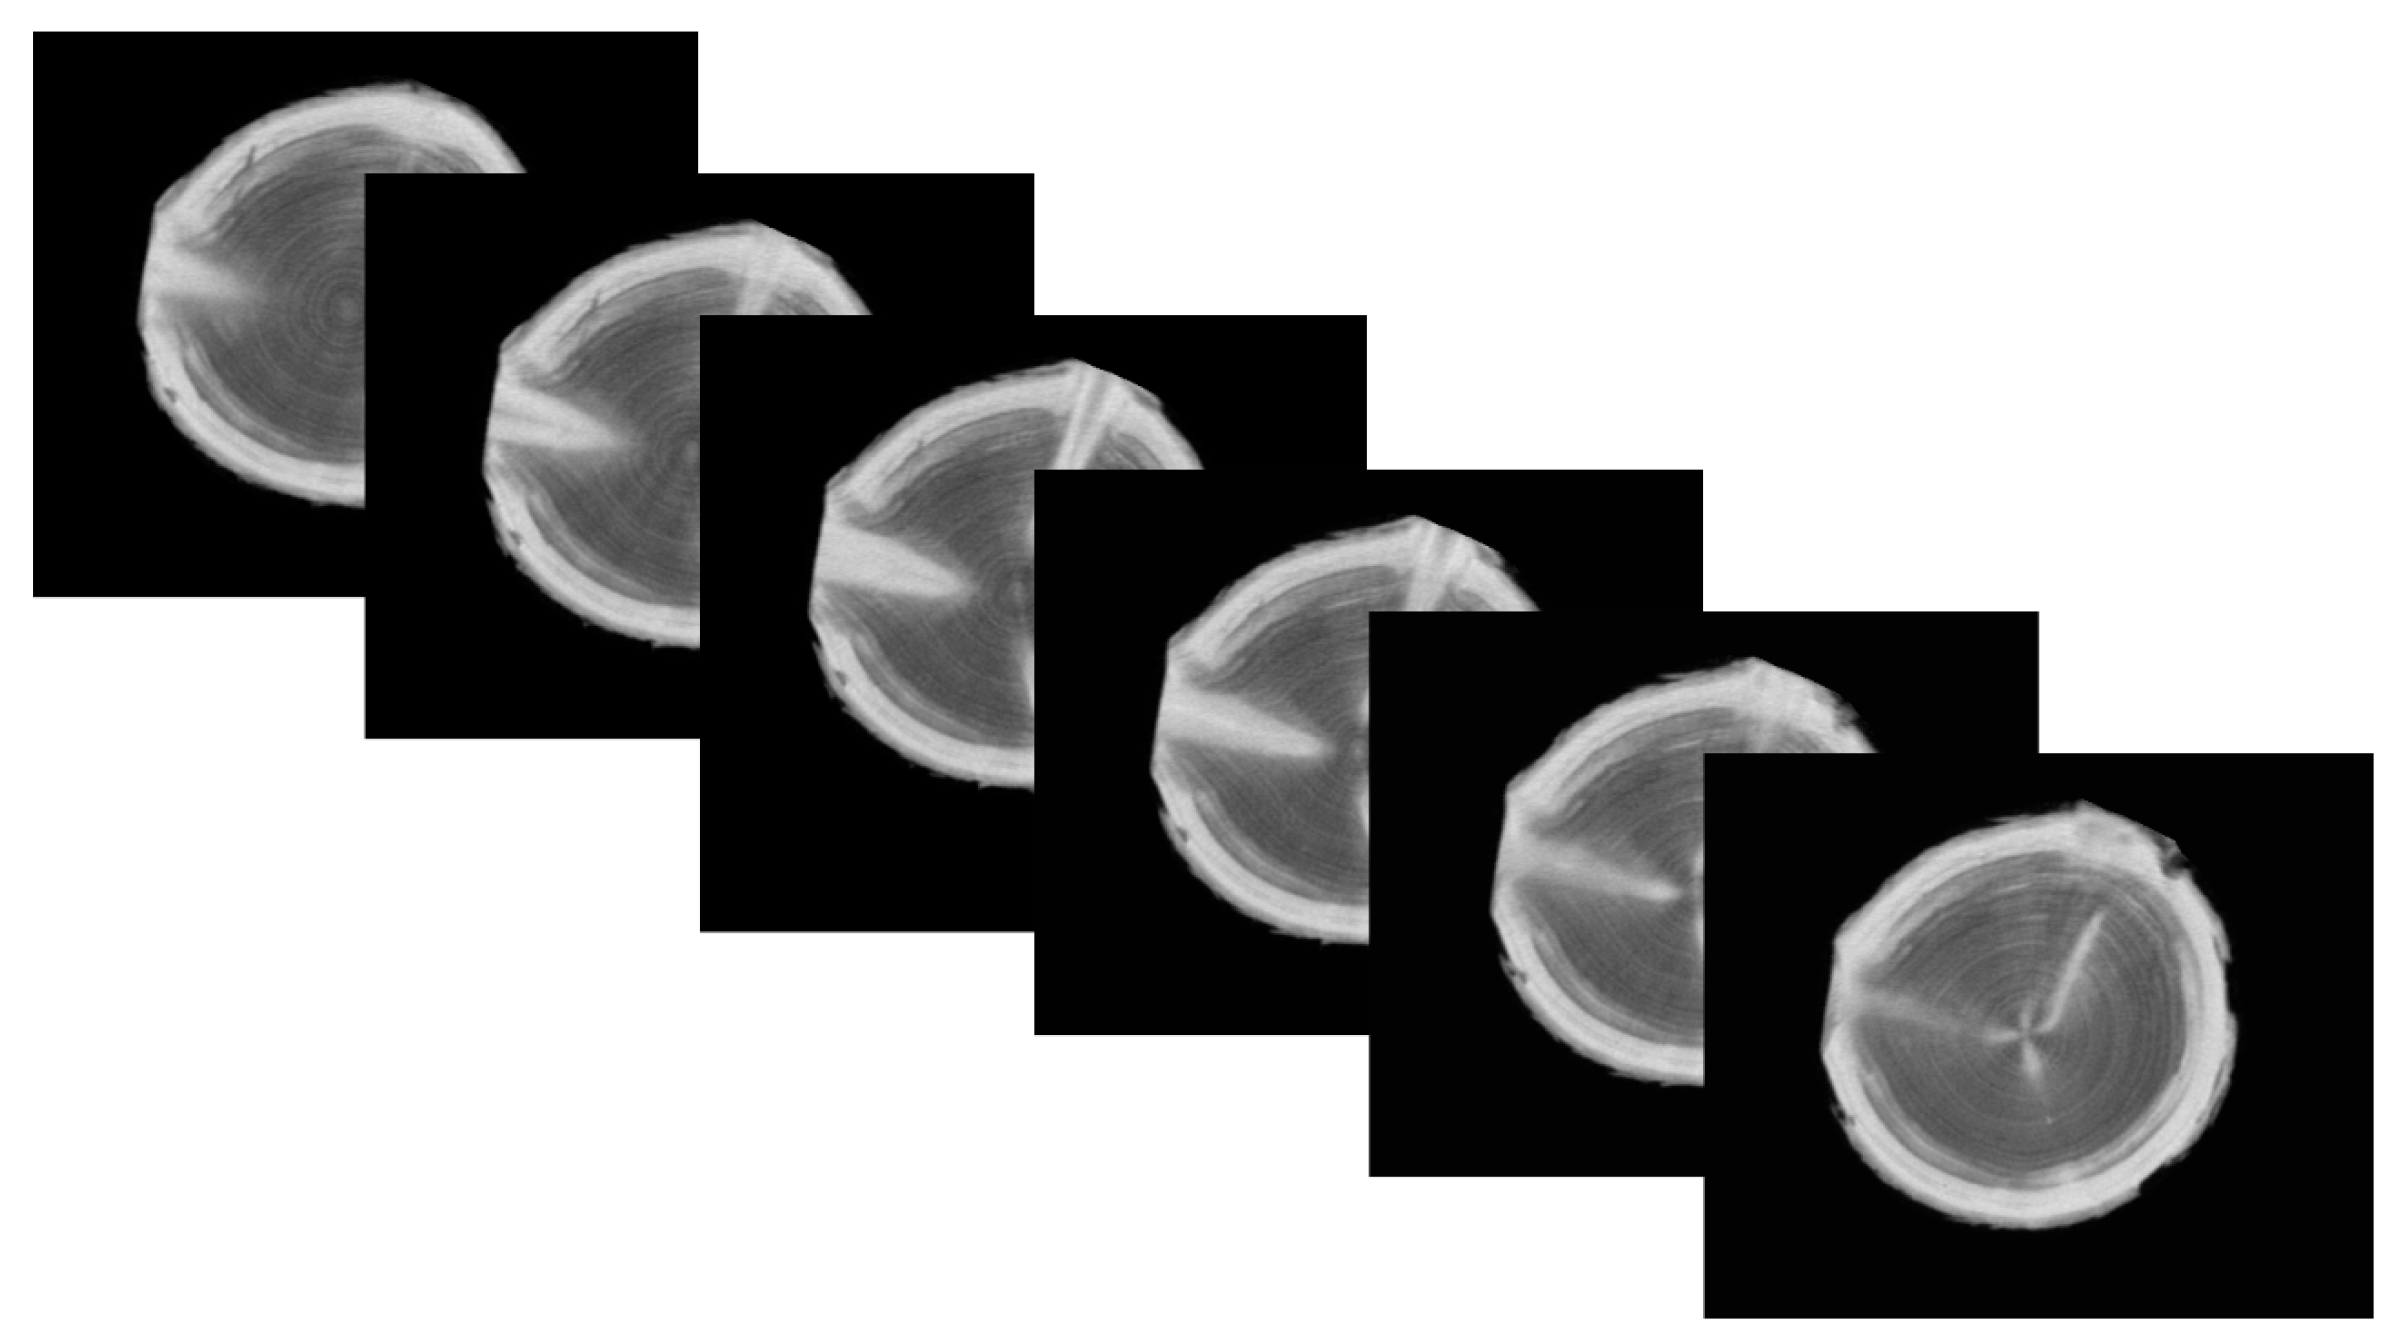
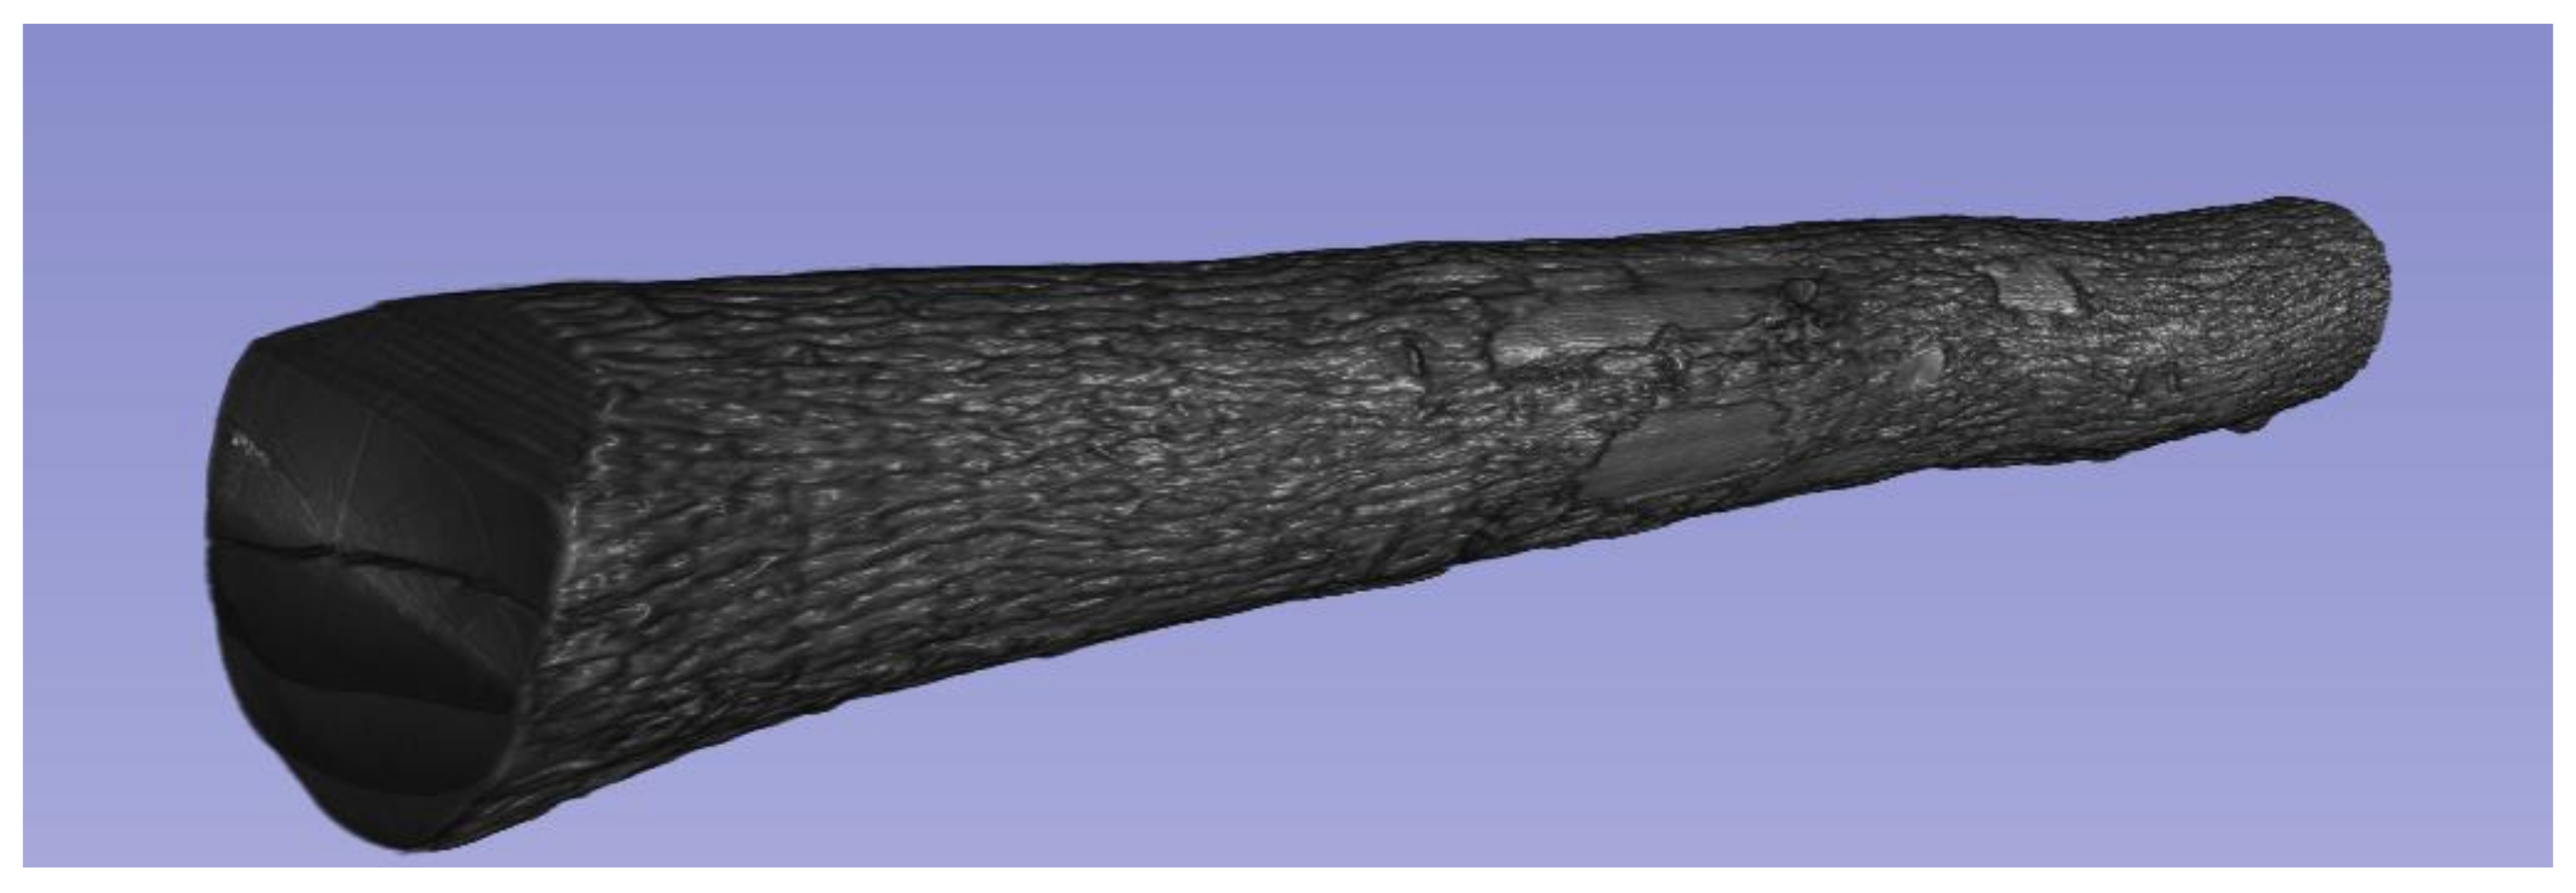
The first goal of this paper is to verify the accuracy of four calculation methods of wood log volume. The tool to achieve this goal is to compare the results of the calculation of the log volume with the real log volume obtained from the three-dimensional reconstruction obtained by computed tomography.
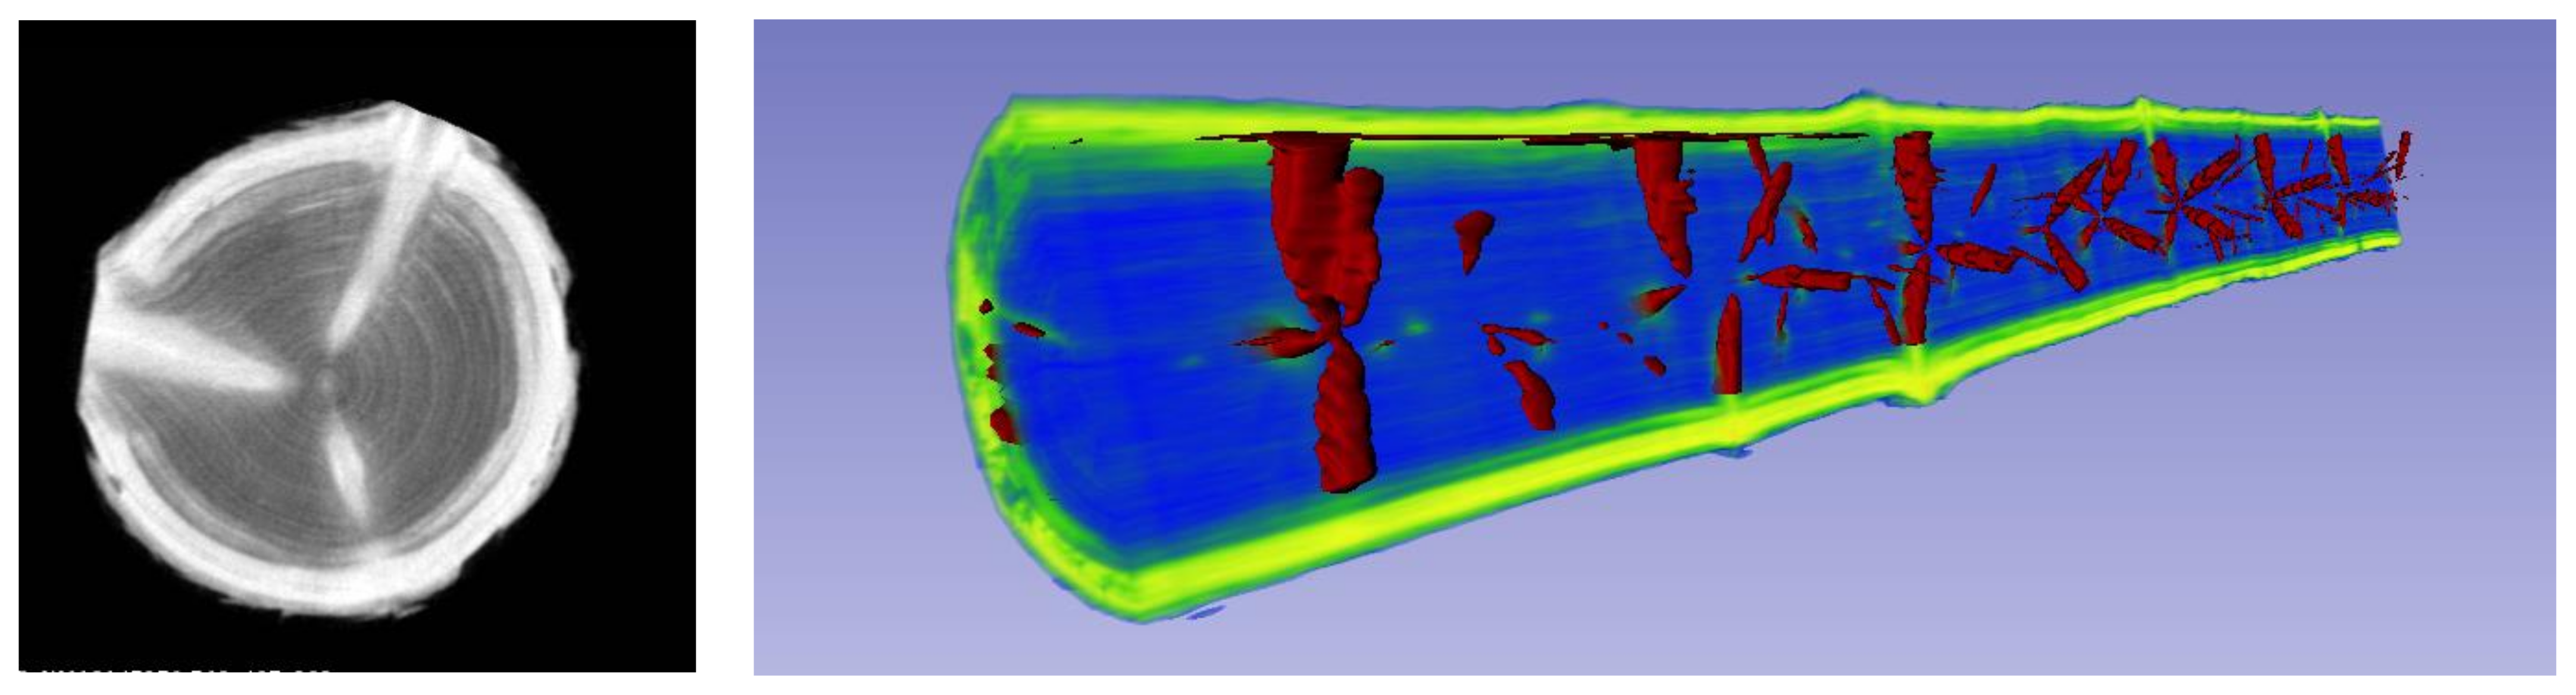
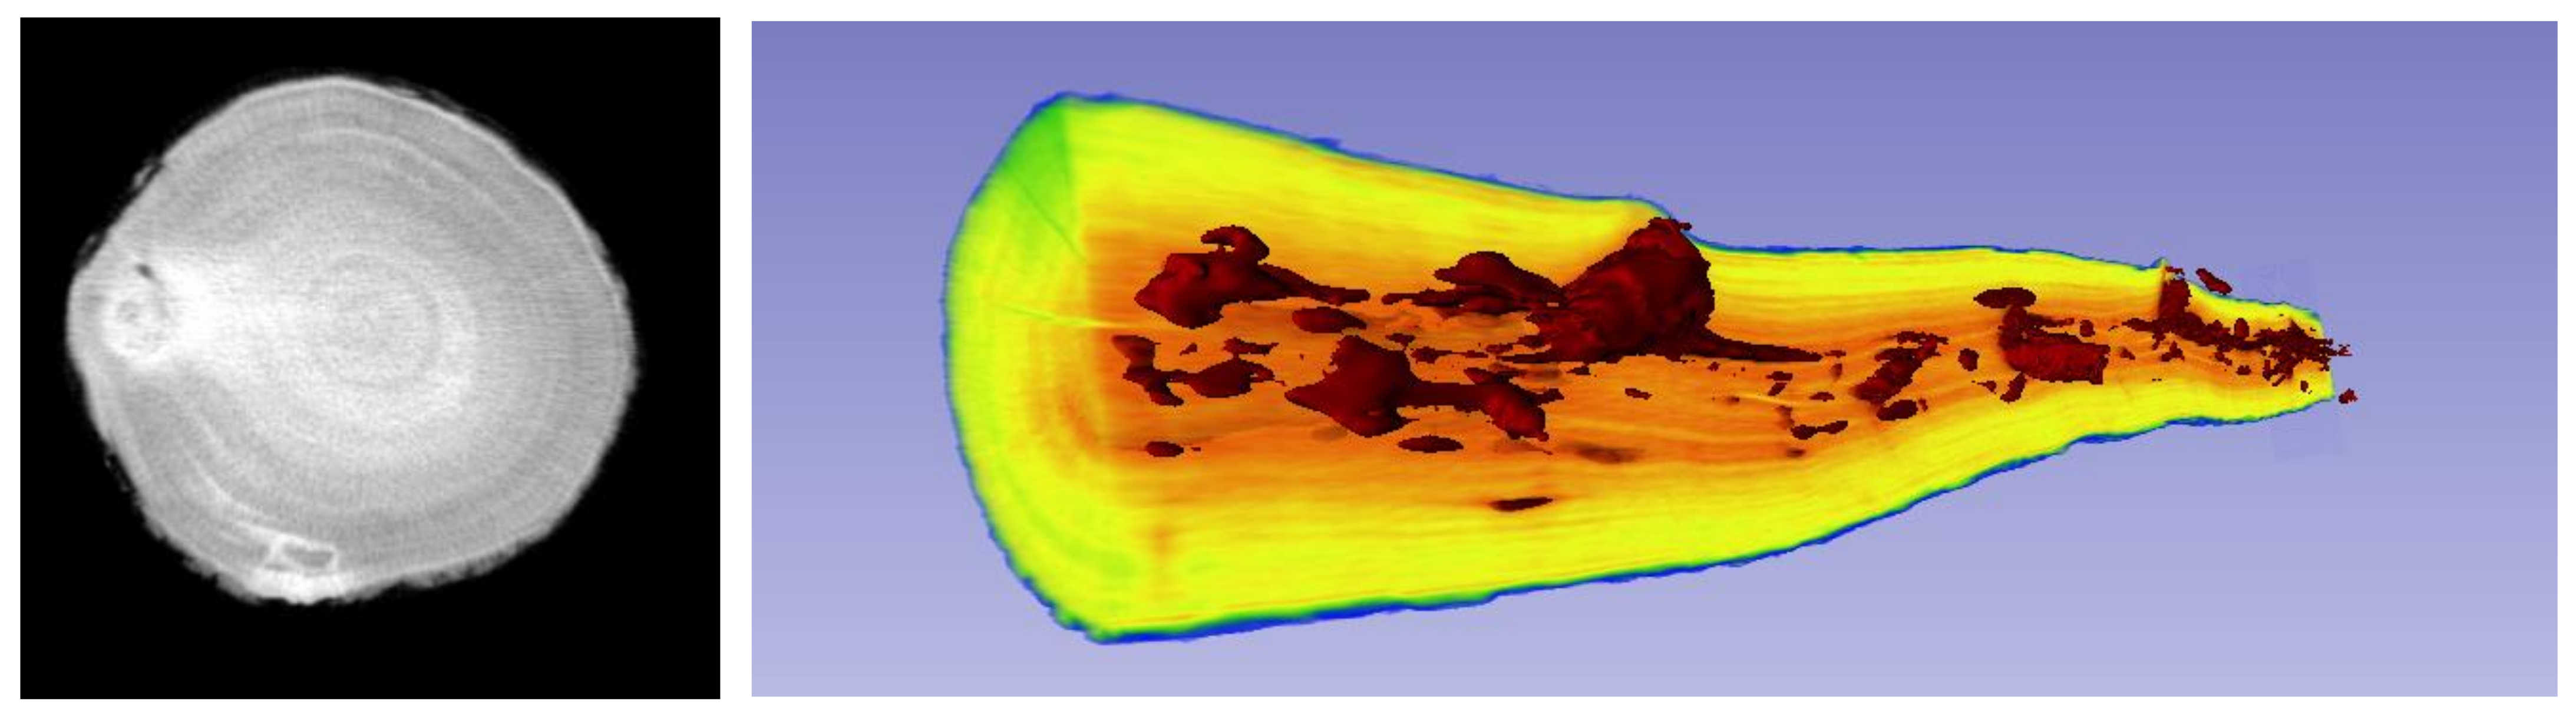
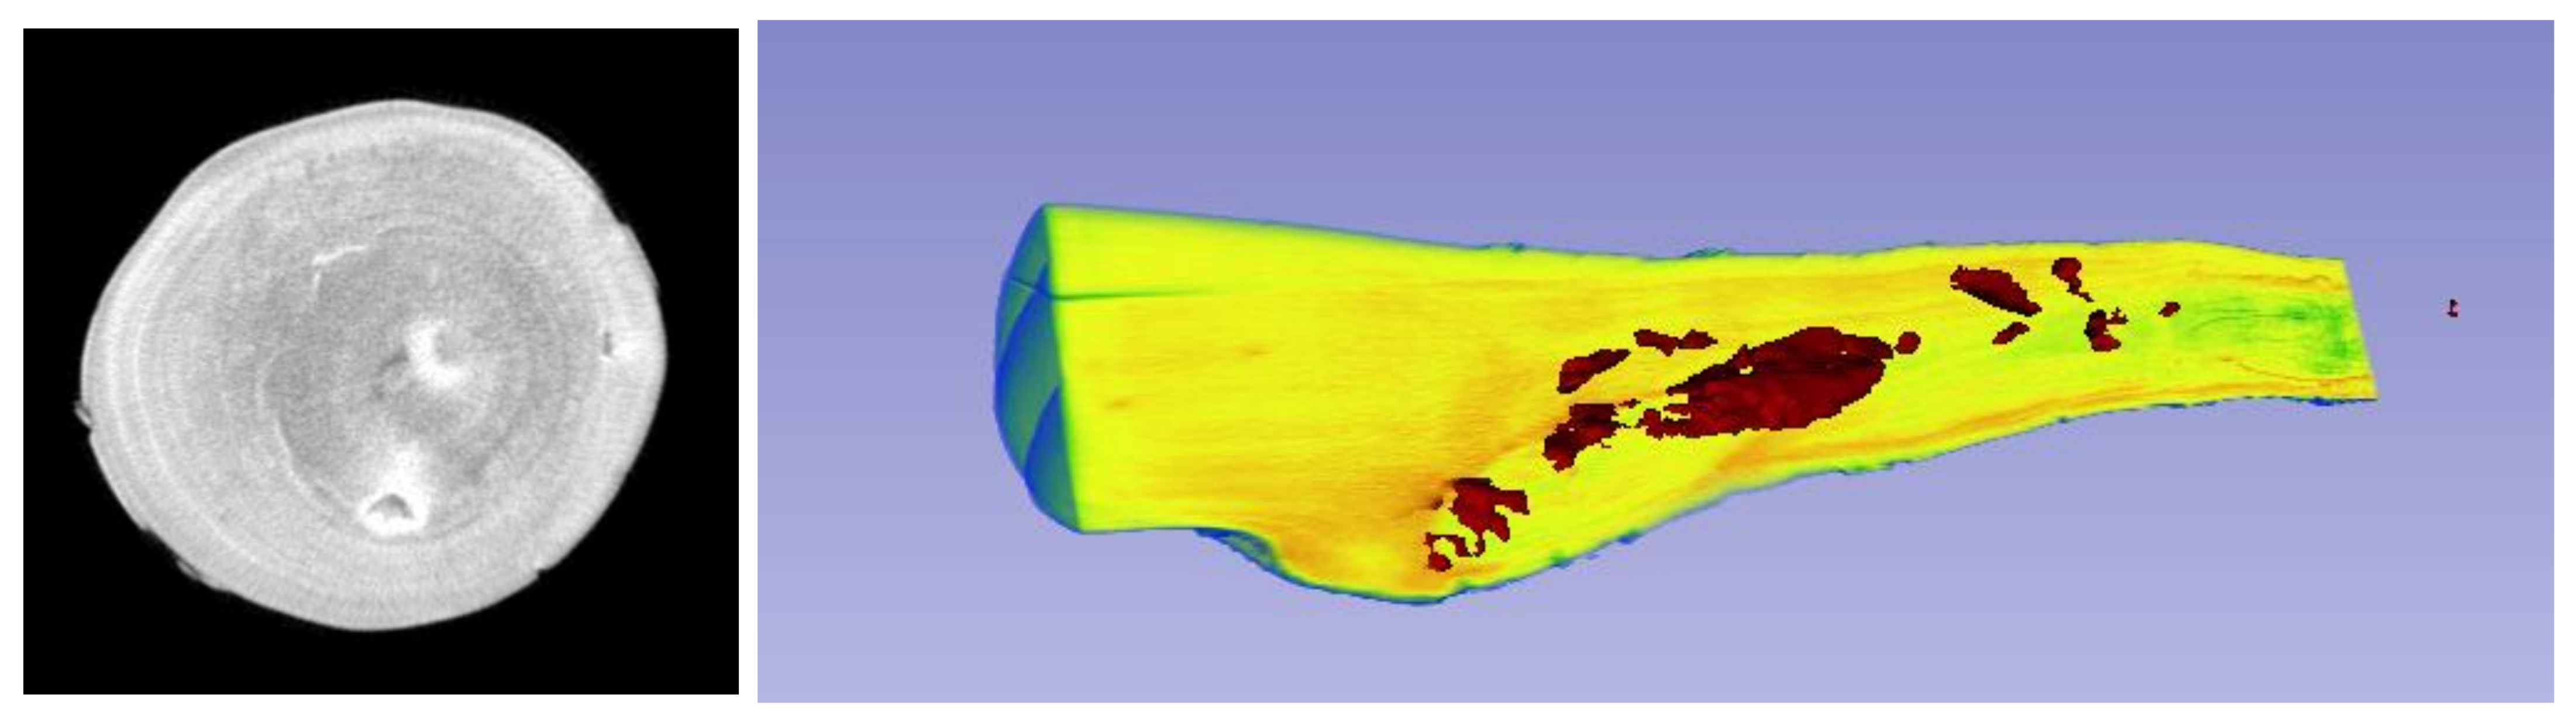
The second goal of this paper is to determine the effectiveness of displaying the qualitative features of wood in three-dimensional models of selected pieces of logs of oak, beech, and spruce, which were obtained using computed tomography.
5. Conclusions
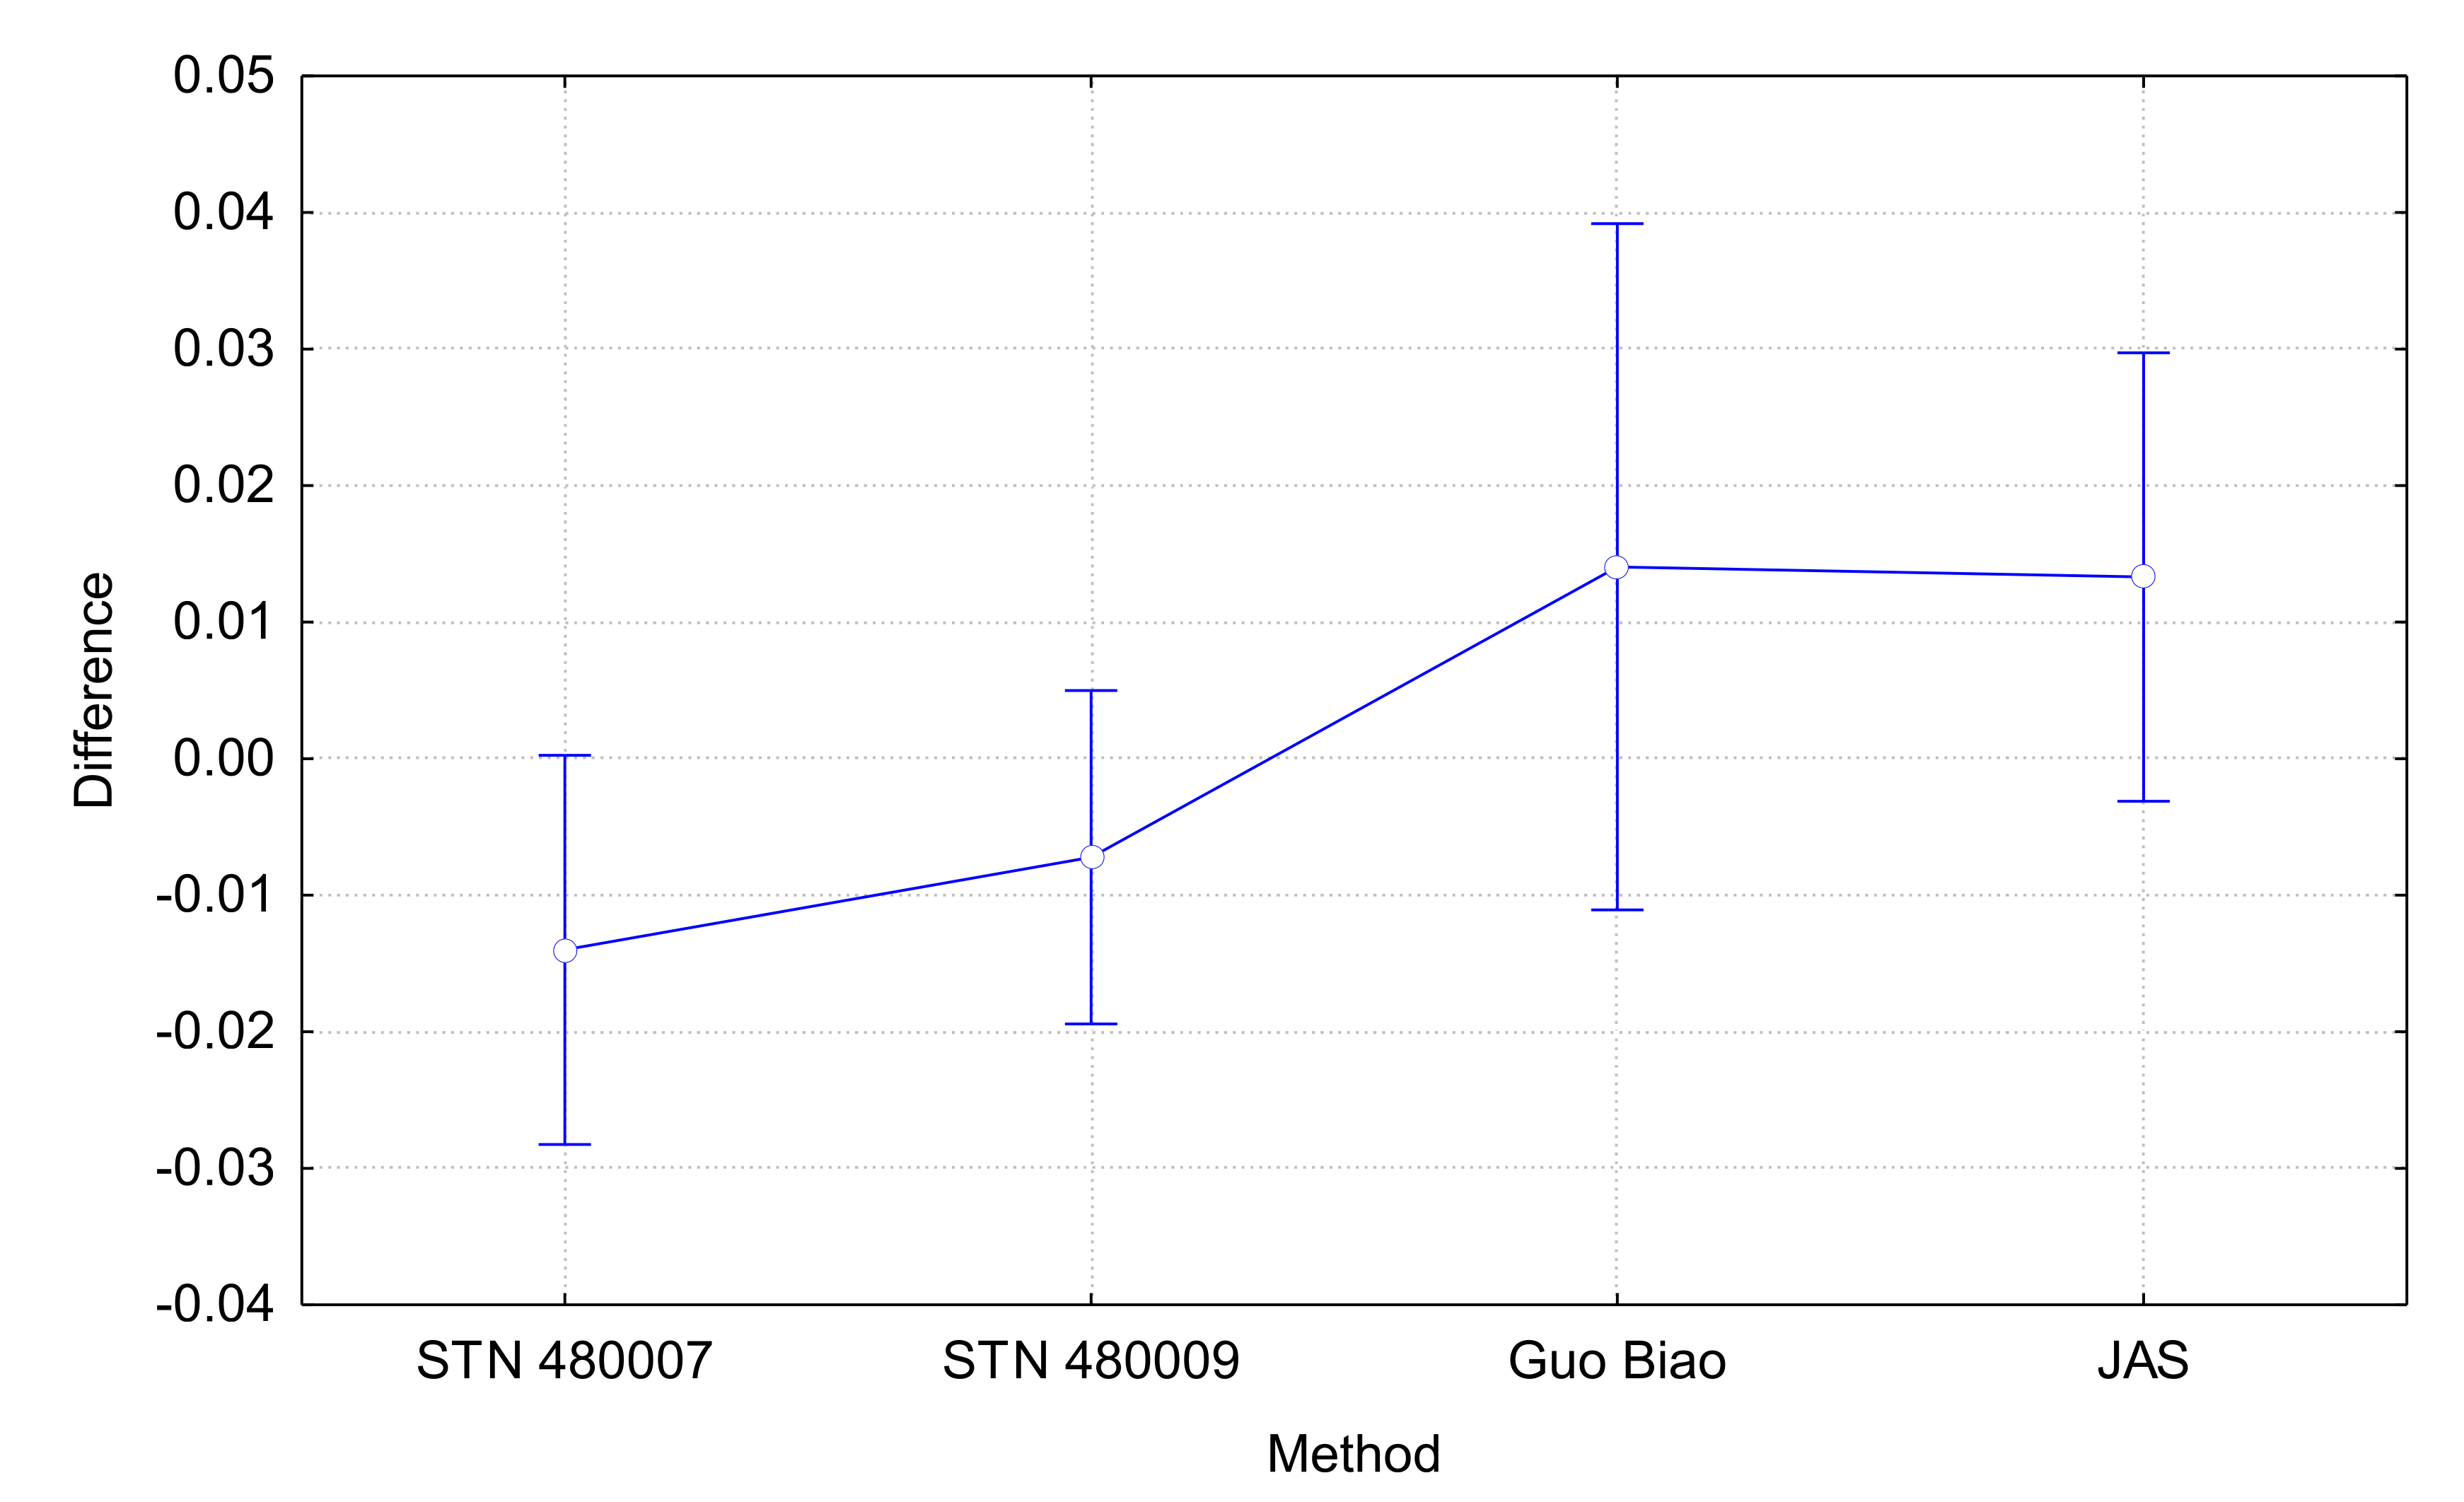
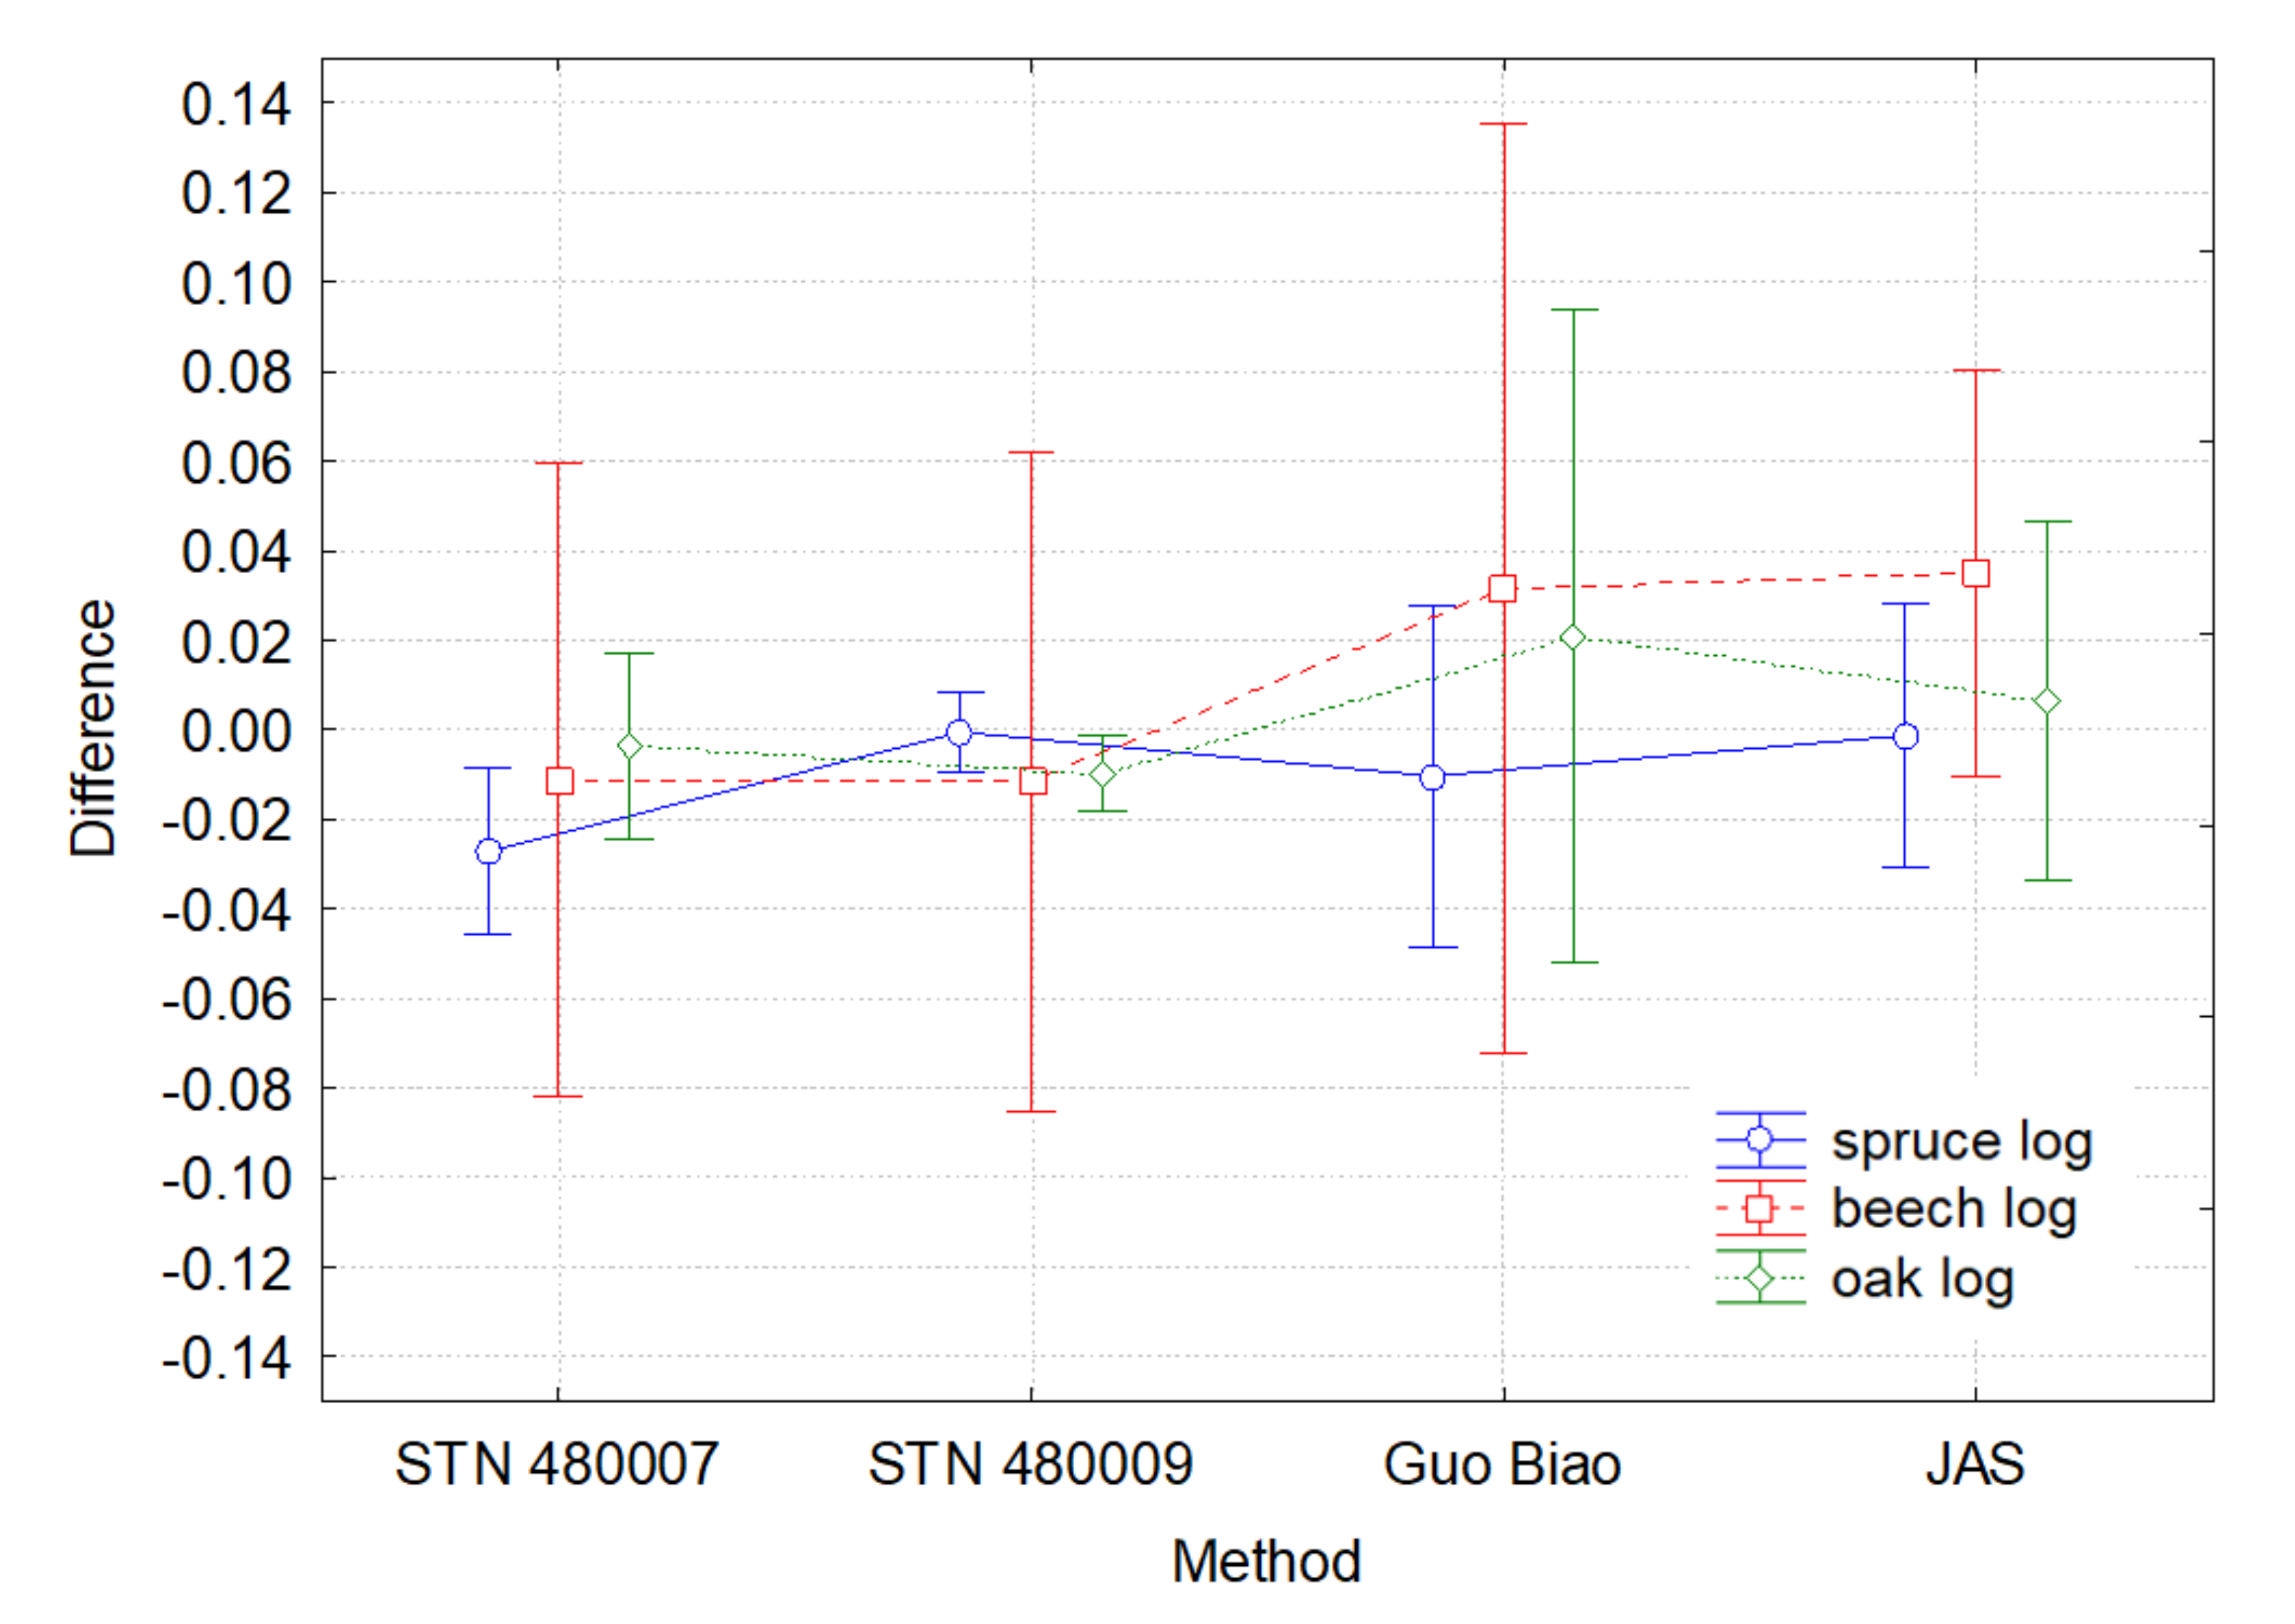
It is possible to state that each of the tested calculation methods of wood log volume is applicable in practice. In the tested cases, the comparison of the calculated log volume with the real log volume (determined by computed tomography) recorded a difference in the log volume in the range from −0.015 m3 to 0.014 m3 (from −4.8% to 4.7%). With the total amount of logs traded on the world market, the amount of undervalued or overvalued logs is significant.
Accurate calculation of the log volume by the tested methods can be achieved only if the methodical procedure for determining the thickness of the tested log is followed. Experience has shown that to meet this assumption, the technician must determine the thickness of the log entering the calculation to determine with maximum accuracy. In practice, such a precise determination of the thickness of the log is time-consuming and technically demanding, because it is necessary to handle a log that is several hundred kg and repeatedly stored in a pile with a minimum amount of handling space. The introduction of log scanning technology eliminates the need for lengthy manual measurements and at the same time eliminates the human factor in this activity.
In conclusion, it is possible to state that the tested methods achieve excellent accuracy in determining the volume of spruce logs with a small variance of values and, conversely, for beech wood, the tested methods are the most inaccurate with the largest variance of values. When determining the volume of wood logs, we recommend using the calculation method STN 48 0009, because it achieves the best results. This method can be described as the most complicated because it is based on the thickness of the log determined in the middle, calculated as the arithmetic mean of two perpendicular measurements with the bark. Subsequently, the specified coefficients are applied to subtract the bark volume.
Qualitative analysis based on CT scans of internal features can be described as a completely new level of approach to the evaluation of log quality. The performed analysis showed great potential for automatic detection of internal qualitative features in the tested spruce log. In this wood, the wood qualitative features are distinguishable using computed tomography. In the case of non-coniferous oak and beech, the situation is more complicated. The internal structure of these trees overlaps the internal wood qualitative features. To accurately detect internal features in these trees, it will be necessary to perform many comparative tests to achieve optimal results.


 ,
, 


