Article

Ground Validation of Seismic Line Forest Regeneration Assessments Based on Visual Interpretation of Satellite Imagery

1
Canadian Forest Service, Natural Resources Canada, Northern Forestry Center, Edmonton, AB T6H 3S5, Canada
2
Centre for Boreal Research, Northern Alberta Institute of Technology, Peace River, AB T8S 1R2, Canada
*
Author to whom correspondence should be addressed.
Forests 2022, 13(7), 1022; https://doi.org/10.3390/f13071022
Submission received: 27 April 2022 / Revised: 28 June 2022 / Accepted: 28 June 2022 / Published: 29 June 2022
(This article belongs to the Section Forest Inventory, Modeling and Remote Sensing)

Abstract

:
Seismic lines, which are narrow linear clearings used for hydrocarbon exploration, have accumulated throughout Alberta’s forest landscapes for decades. The inconsistent natural recovery of seismic lines over time has led to a fragmented landscape and has incited the need for restoration programs and associated monitoring of forest recovery on seismic lines. In this study, we evaluated a technique where we used satellite imagery to visually assign recovery classifications based on whether the seismic line remained >50% visible (Not Recovered), <50% visible (Fractionally Recovered), or not visible (Recovered) in upland mixedwood forests. We ground validated the recovery classification on 22 seismic lines using the recovery criteria of 2000 stems ha−1 and a mean tree height of 3 m. The categories of Recovered and Fractionally Recovered met the recovery criteria with 100% and 80% accuracy, respectively, while the Not Recovered category identified lines that failed to meet the recovery criteria with 83% accuracy. Based on these findings, visual interpretation of satellite imagery can be used to provide cursory-level recovery information for monitoring forest recovery on upland seismic lines at landscape-level scales.

1. Introduction

Seismic lines, which are narrow linear clearings created for oil and gas exploration, have accumulated throughout Alberta’s central and northern forest landscapes since the early 1940s [1]. Until the end of the 20th century, conventional seismic lines, ranging between 5 and 10 m in width, were cleared using bulldozers [2]. In 2001, the total number of kilometres of conventional seismic lines in Alberta was estimated at 1.8 million [3]. Tree growth on seismic lines is a slow and inconsistent process, dependent on many factors including disturbance characteristics, site characteristics, and repeated line use [4,5]. While current seismic practices have changed with an intention of reducing disturbance intensity by reducing their width, there remains a significant disturbance from 60 years of conventional seismic line construction that contributes to the extensive fragmentation of Alberta’s boreal forest landscape [4,6].
There are currently several industry-funded seismic line restoration programs underway in northern Alberta that involve techniques such as mechanical site preparation and tree planting [7]. These restoration programs often begin with a pre-treatment inventory that reflects the current condition of vegetation on seismic lines in order to identify areas to focus restoration efforts [7,8]. Post-restoration, long-term monitoring should be done to assess seedling establishment and growth to understand the efficacy of treatments. Assessment of seismic line recovery is achieved through field surveys or remote sensing techniques. Field campaigns, which involve measuring vegetation densities and heights using handheld instruments are time-consuming, costly, and may be impractical due to the remote locations of seismic lines and the large scale of their disturbance footprint on the landscape [9,10]. Remote sensing approaches for assessing recovery offer a less labour-intensive alternative to field campaigns. While direct field measurements can achieve higher levels of accuracy, remote sensing approaches allow larger areas to be assessed and provide a more comprehensive understanding of the landscape on broader spatial and temporal scales.
Airborne remote sensing methods such as Light Detecting and Ranging (LiDAR) or Digital Aerial Photogrammetry (DAP) have been used in several studies to assess tree recovery on seismic lines [5,10,11,12]. These techniques provide detailed information with high accuracies; however, airborne acquisitions are costly and the processing of point cloud data can be difficult [9,10]. These complex data interpretations often require specialized skill and experience, making them impractical for use by those unacquainted with the process. Furthermore, the cost associated with airborne remote sensing is likely to remain high due to the cost of fuel, mobilization, and aircraft ferrying charges [13]. Small remotely piloted aircraft systems (drones) are increasingly being used in remote sensing applications and are capable of detecting seedlings on seismic lines [14]; however, this technique is less practical over large areas as pilots need to maintain line-of-sight with the drone. As the need for assessing and monitoring seismic line regeneration on landscape-level scales grows, restoration programs would benefit from a more accessible and straightforward remote sensing approach to help prioritize areas for restoration and subsequently monitor recovery over time.
Satellite imagery acquisitions are more cost-effective than airborne remote sensing data acquisitions and conventional seismic lines are detectable from high-resolution sensors such as SPOT 5, which has been used for mapping seismic line disturbance [15]. Although tree heights and densities cannot be quantified using a simple visual assessment of satellite imagery, this technique may be capable of providing the cursory information required for landscape-level restoration planning and presents an opportunity to extract valuable information from the landscape without site access or complex data processing. To our knowledge, visual interpretation of satellite imagery has not been used to interpret forest recovery on seismic lines to date.
In this study, we explored the viability of using visual assessments of satellite imagery to classify conventional seismic lines into three recovery categories: Not Recovered (NR), Fractionally Recovered (FR), and Recovered (R), based on their linear footprint. Seismic lines in mature forests (untreated) and seismic lines in reforested cutblocks (treated) were included in the study to capture a range of representative seismic lines in the landscape. The objectives of this study were to: (1) evaluate the accuracy of the recovery classification categories derived from the visual assessment of satellite imagery based on a field measured recovery criteria of 2000 stems ha−1 and a mean tree height of 3 m and (2) determine if field-measured tree and shrub parameters were significantly different between the three classification categories assigned from visual assessment of satellite imagery.

2. Materials and Methods
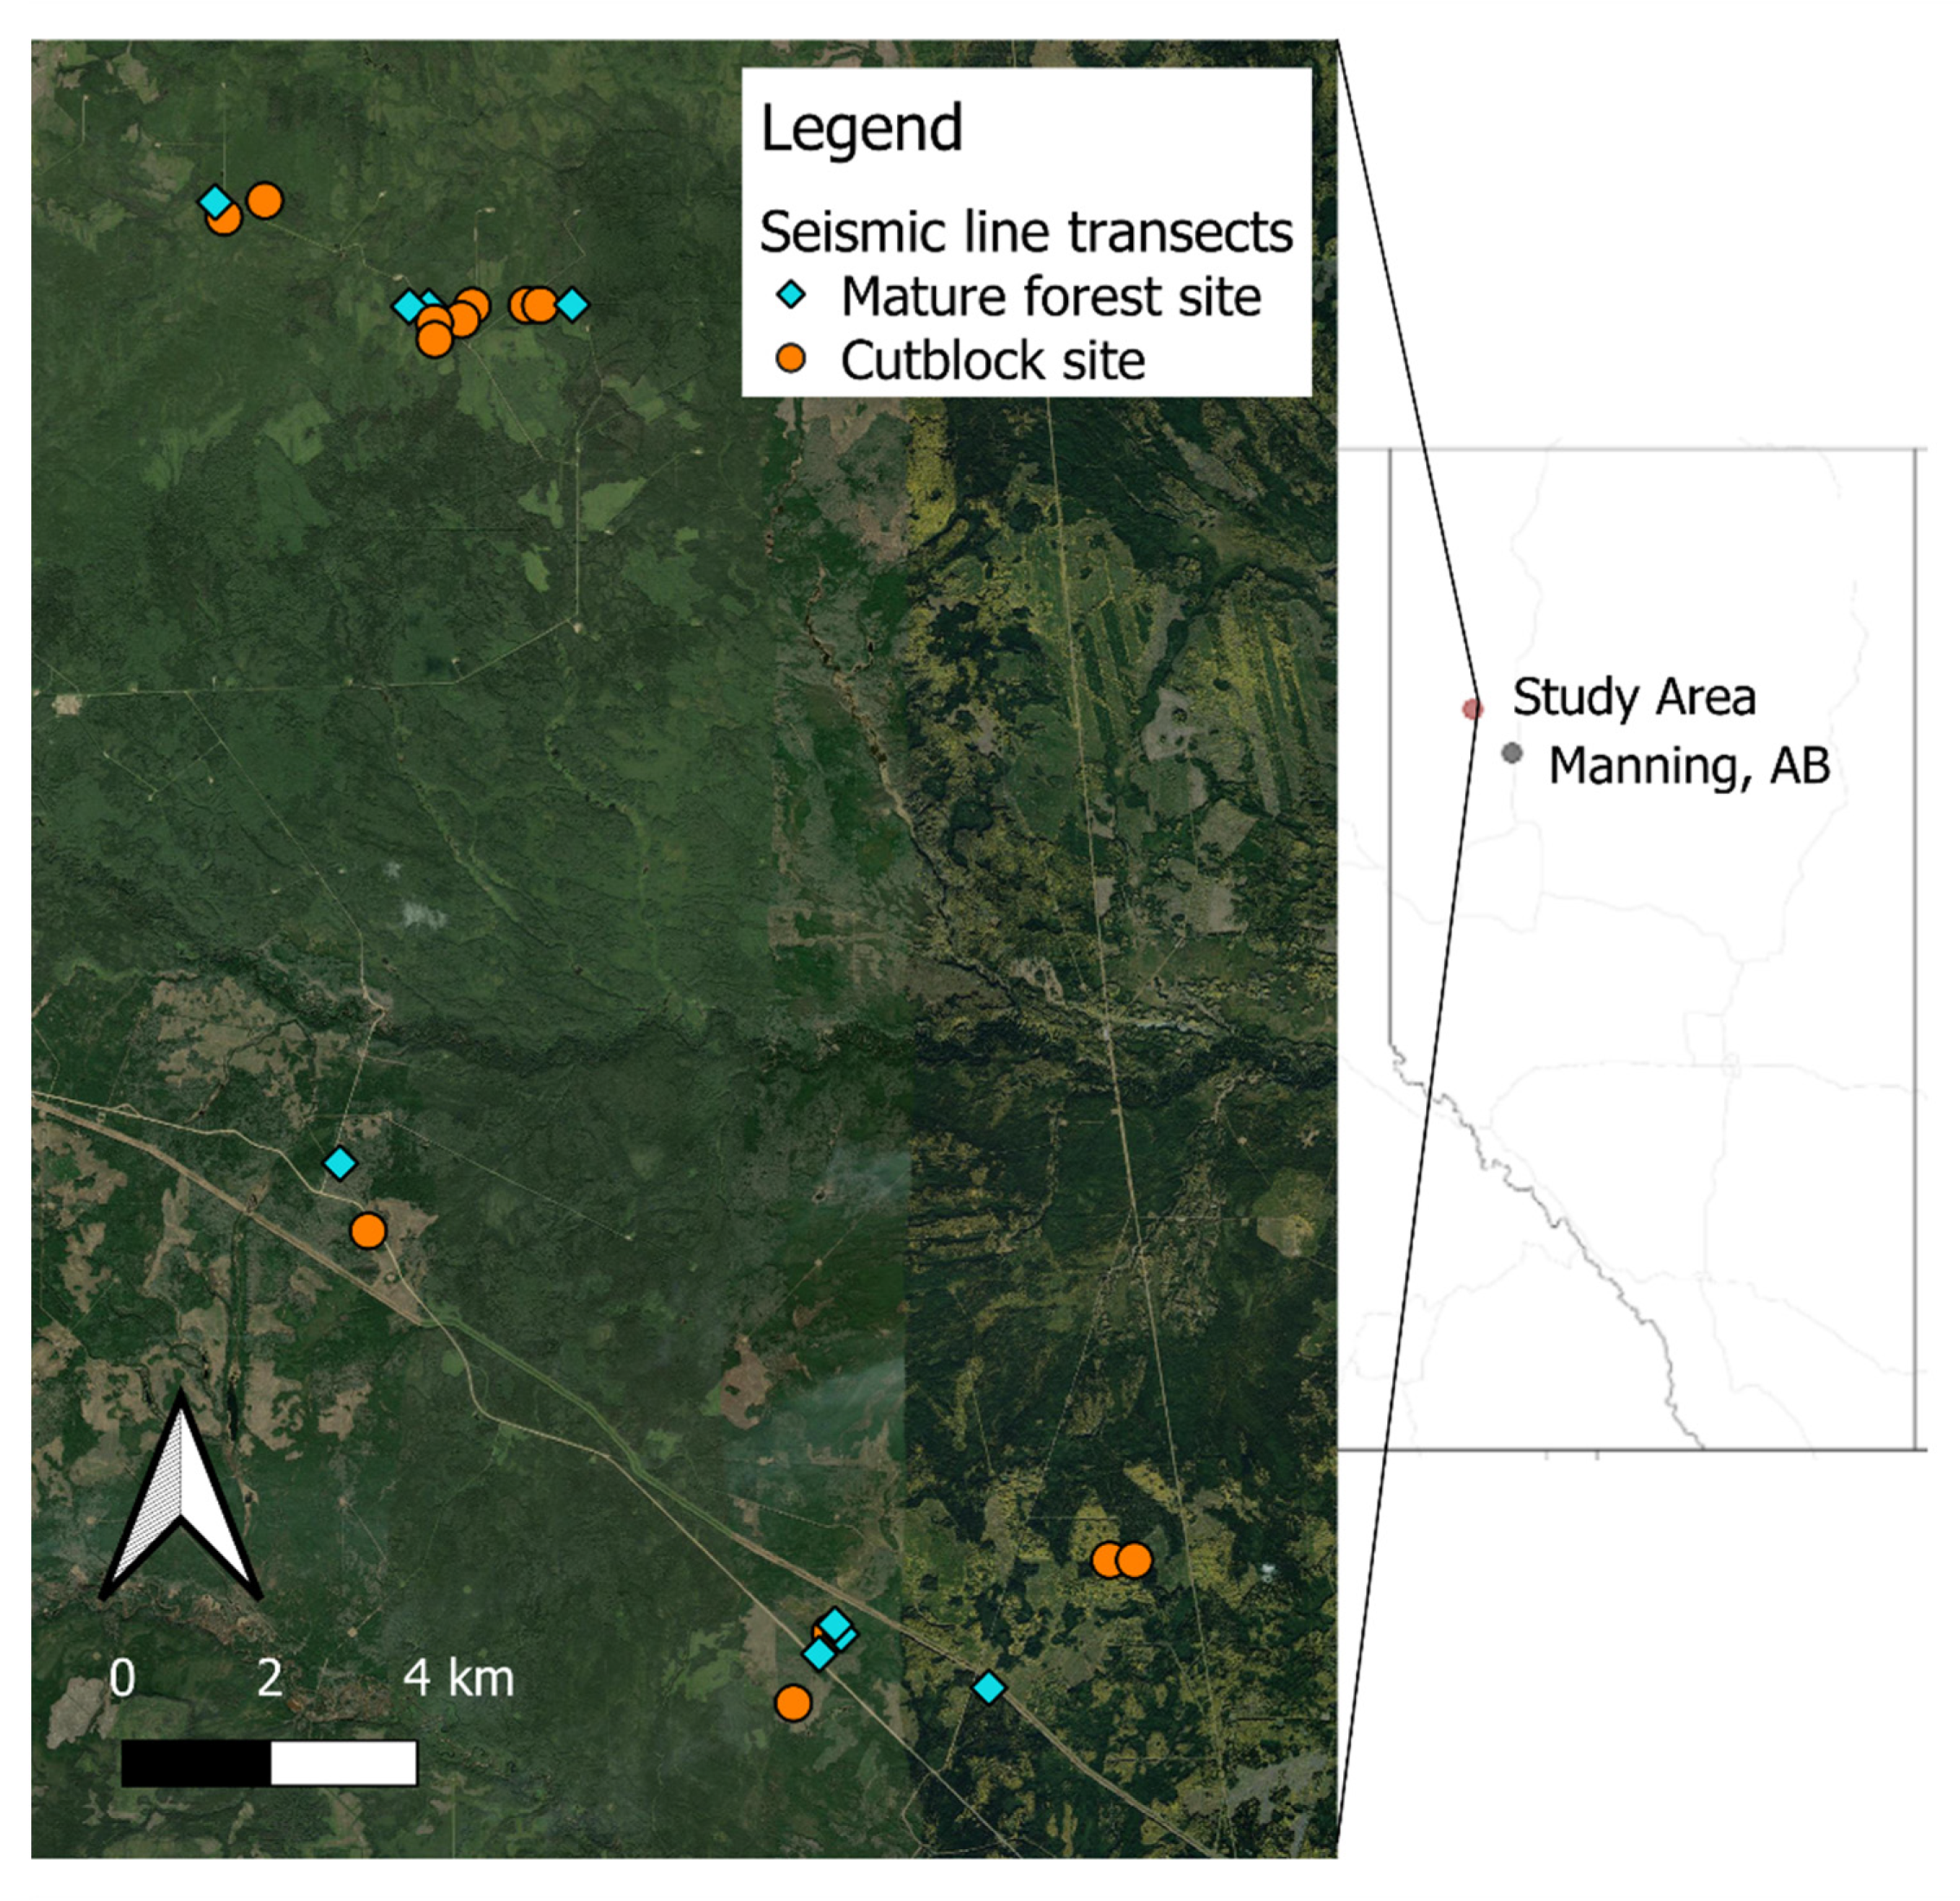
2.1. Study Area

The study area was located approximately 70 km northwest of Manning, AB, Canada, and spanned 22 km between the furthest sites (Figure 1).
The study area is within the Lower Boreal Highlands natural subregion of Alberta and is characterized by diverse mixedwood forests including Populus tremuloides Michx. (aspen), Betula papyrifera Marsh. (paper birch), Pinus contorta Doug. ex Loud. (lodgepole pine), Picea glauca (Moench) Voss (white spruce), and Abies Balsamea (L.) Mill. (balsam fir) on undulating to hummocky uplands [17]. The elevation in this area ranges from 400 to 1075 m [18]. Mean daily temperature normals range from −17 °C in January to 16.0 °C in July and mean monthly precipitation normals are between 18 mm in April to 85 mm in July [19].
This area has a history of linear disturbance from conventional seismic exploration and falls within the Manning Forest Products (MFP, Manning, AB, Canada) forest management agreement area [20]. To capture a range of regionally representative seismic lines, those in mature forests (untreated) and in reforested cutblocks (treated) were included in the study. Although there had been no targeted linear restoration programs in this area, seismic lines within reforested cutblocks received site preparation and planting, and thus were considered treated seismic lines. Untreated seismic lines were located in mature forests outside cutblocks. Seismic lines in this study were all approximately 5 m wide. Based on available historical imagery [21], seismic lines in the study area were cleared in the mid-1980s, while cutblocks were harvested and planted between 2004 and 2011, resulting in a time since disturbance (or re-disturbance in the case of seismic lines within cutblocks) ranging between 10 and 40 years at the time of the study.

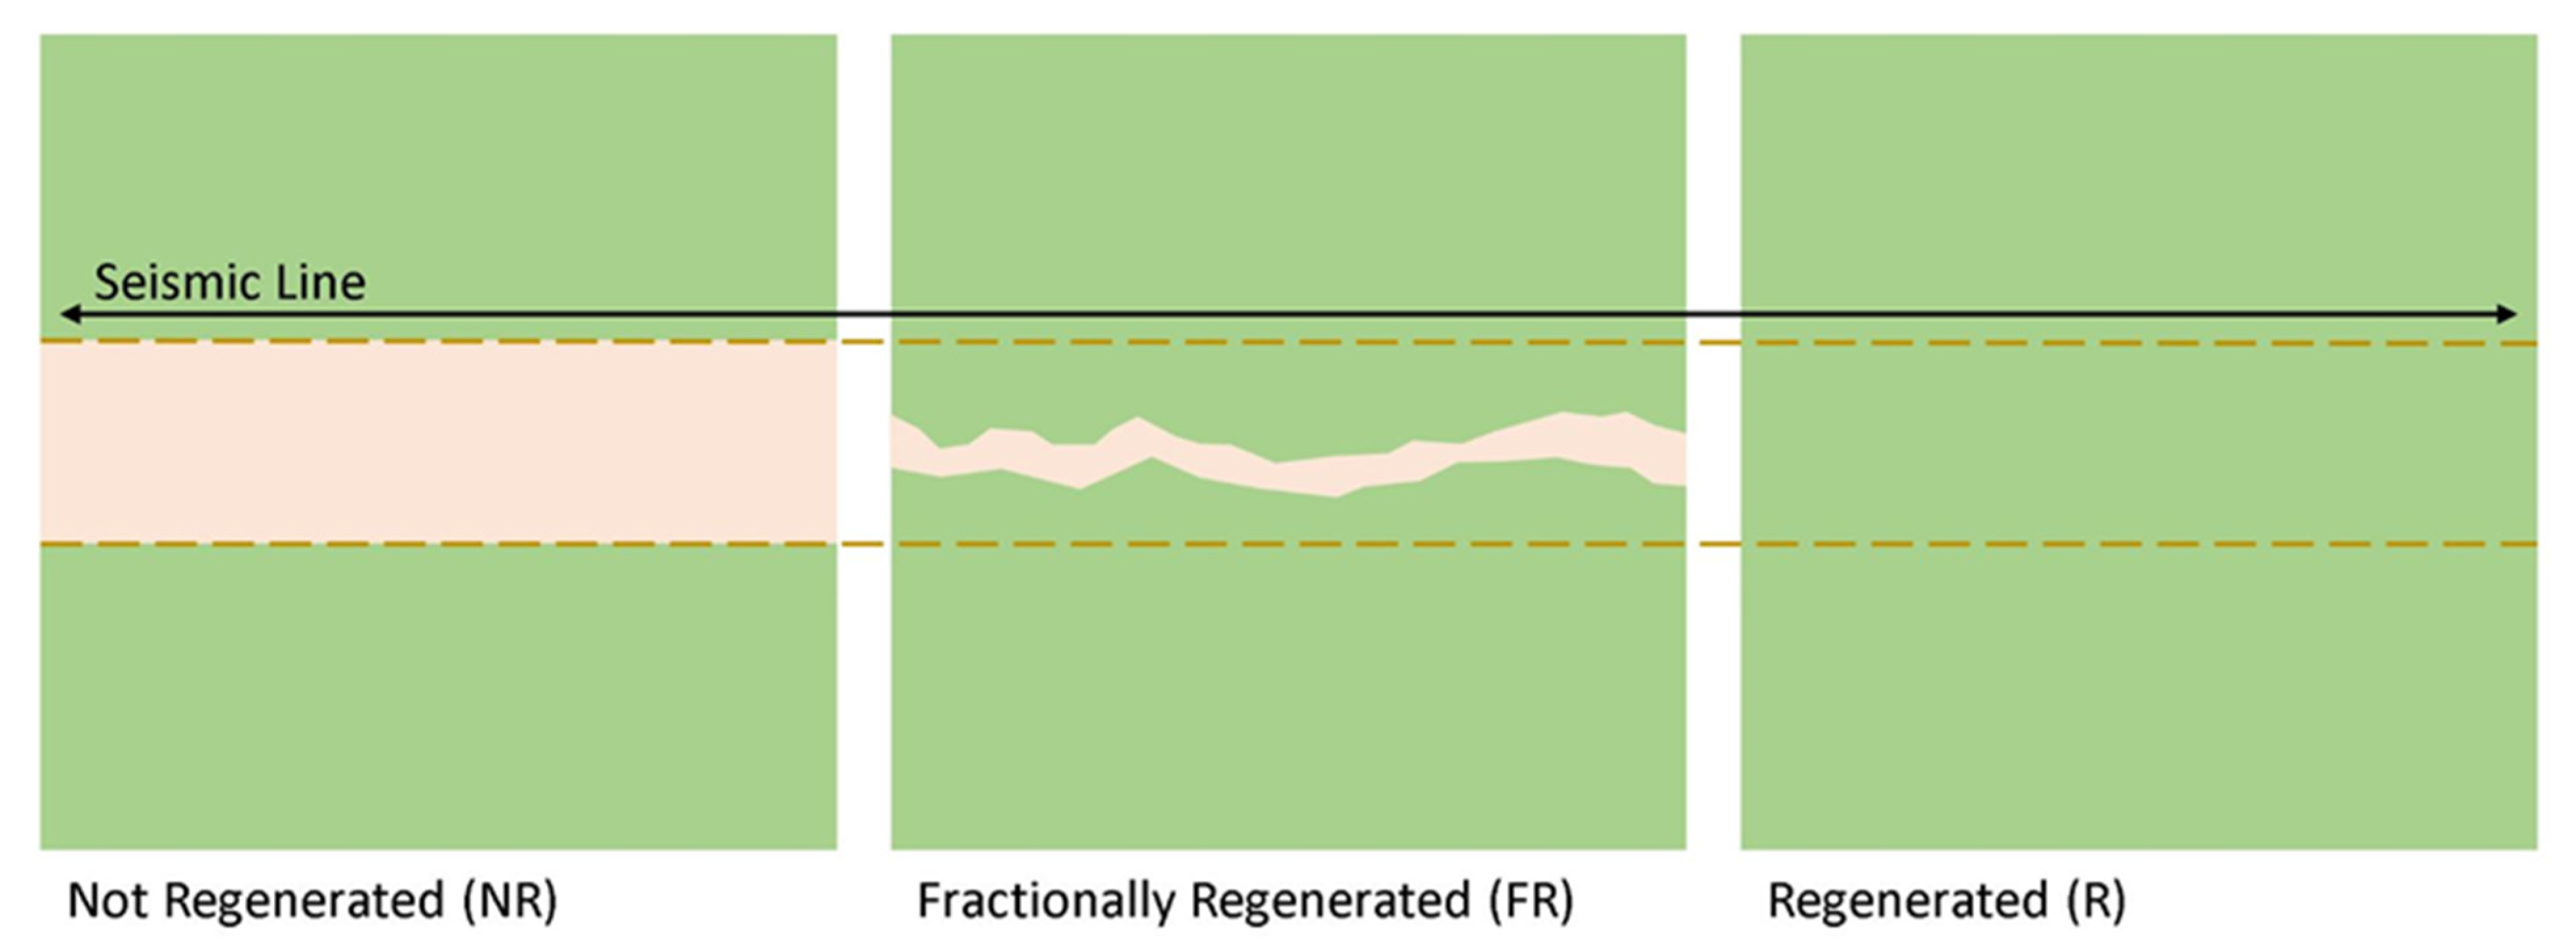
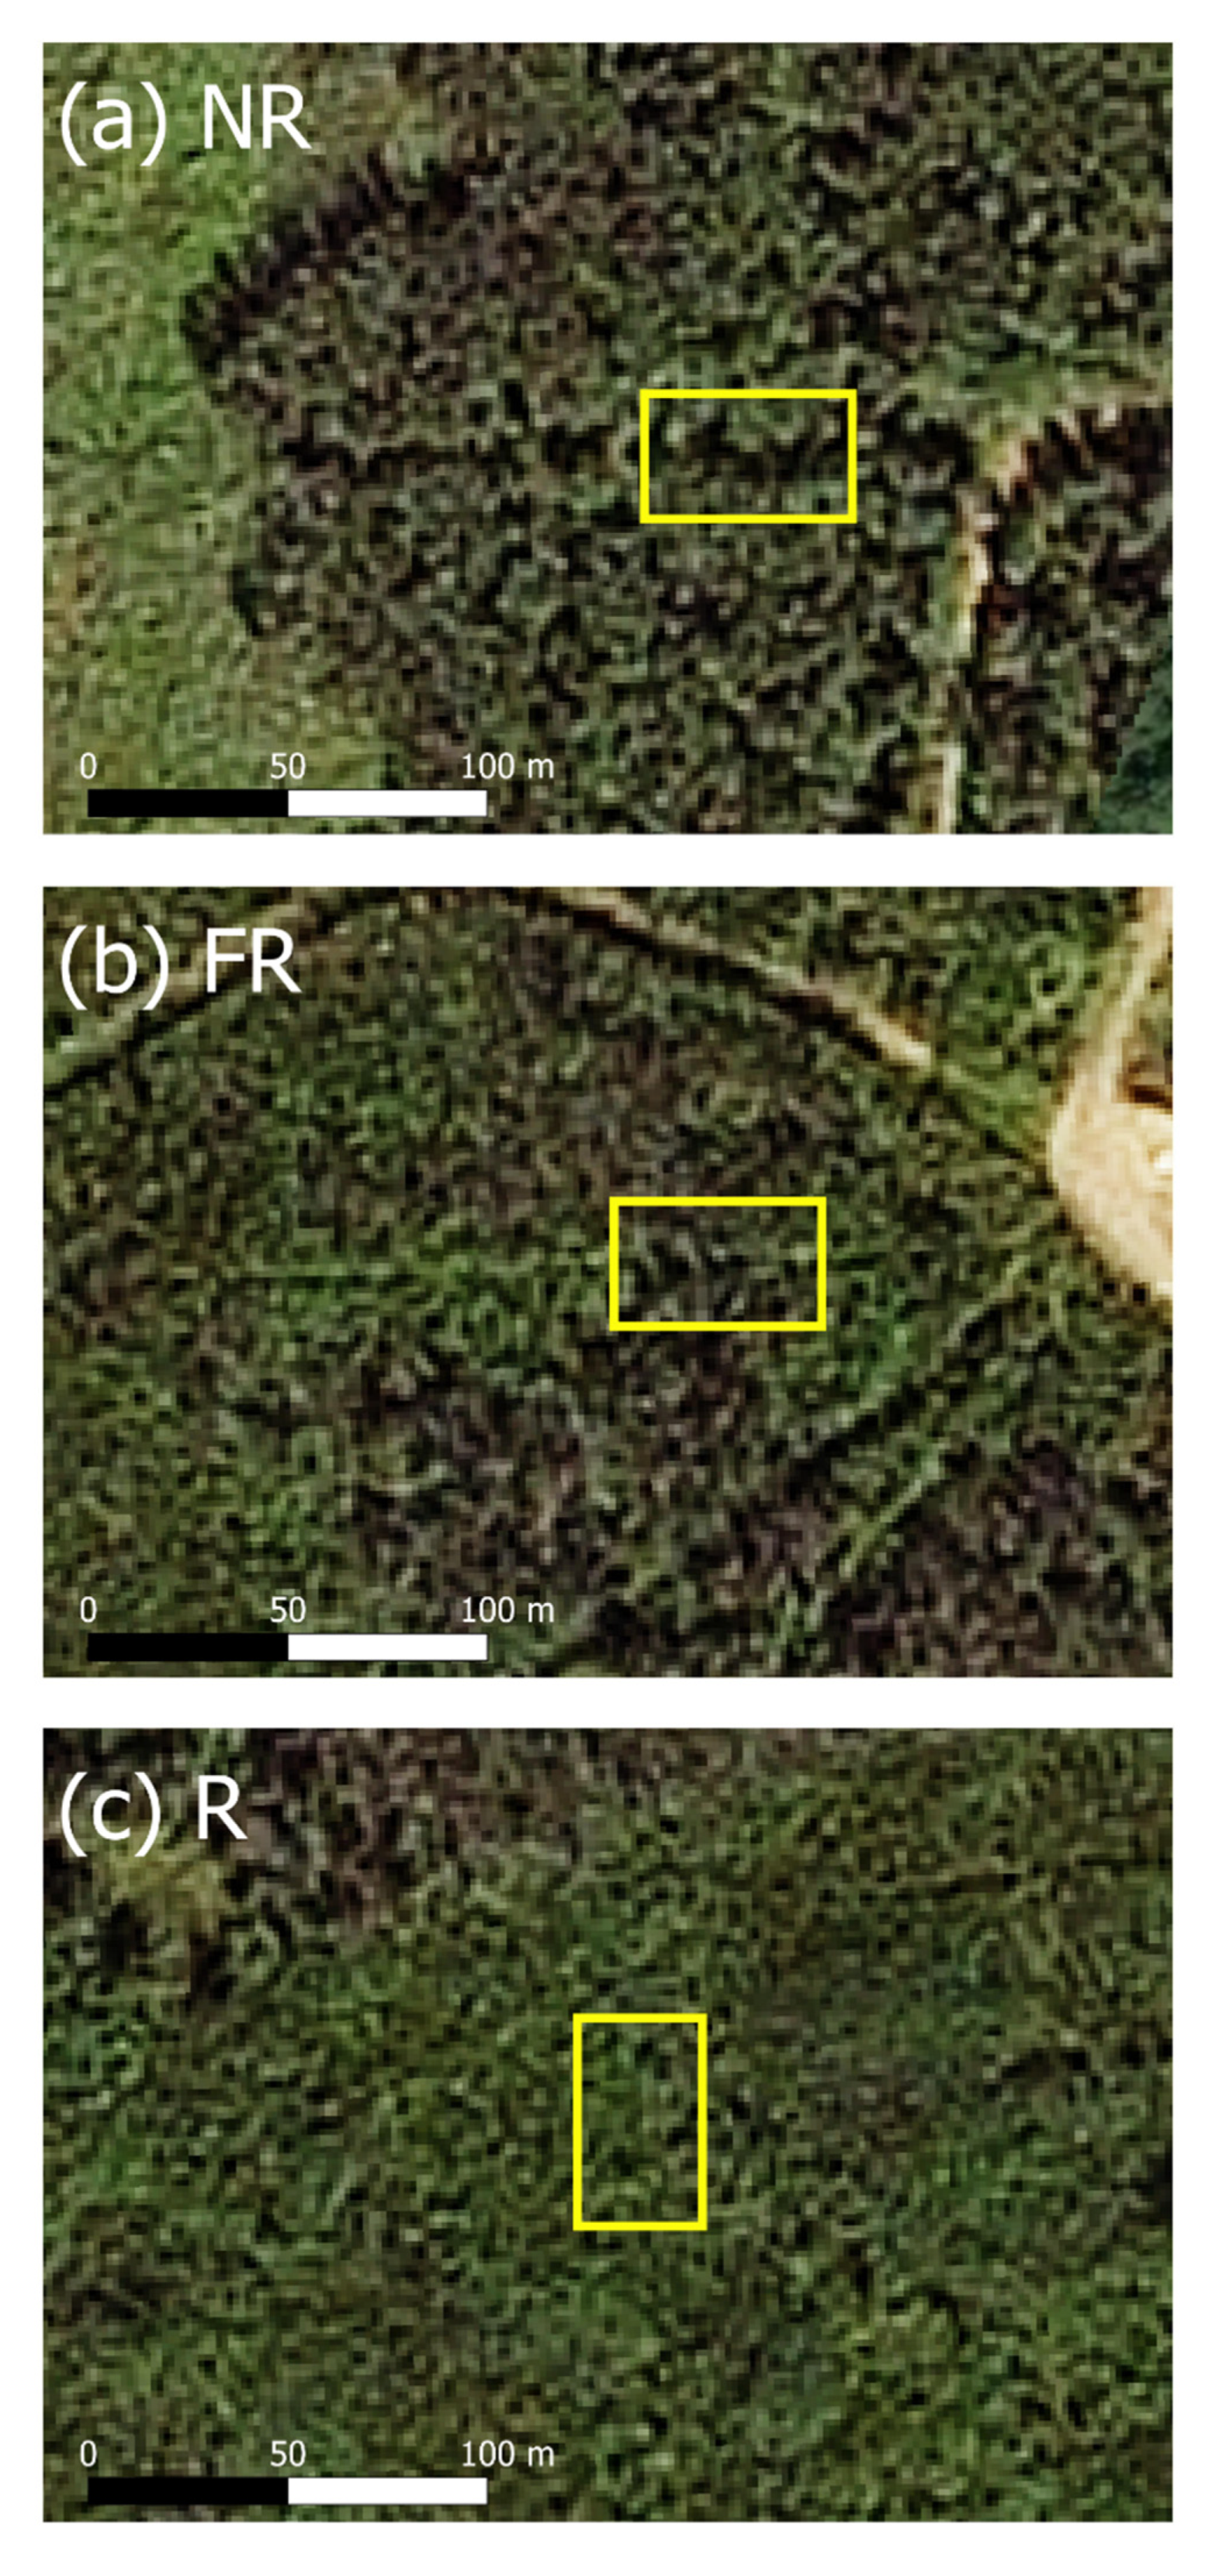
2.2. Classification of Recovery Using Satellite Imagery

Alberta Biodiversity Monitoring Institute (Edmonton, AB, Canada) (ABMI)’s human footprint inventory dataset [22] was used to identify conventional seismic lines within the study area and Derived Ecosite Phase data [23] was used to select lines in upland forests. Seismic lines selected for assessment and subsequent ground validation were within 1 km of a road and were at least 100 m from one another [24,25].
Visual assessments were performed on 55 m sections of seismic line in ArcGIS Pro 2.5.0 [26] with the most current (either 2019 or 2020) high resolution (1.5 m, suitable for 1:25,000 scale) SPOT 6/7 satellite imagery collected during the leaf-on period. Aerial photos from 2000 provided by MFP (1 m resolution) were also used to confirm the initial width of the seismic line. The visual assessments were performed on natural colour composites without the use of enhancements or band ratios. An analyst with only a basic knowledge of remote sensing classified each line segment as either NR, FR, or R, based on the proportion of the initial line width that remained distinguishable from the surrounding forest. For the purposes of this study, we defined recovery based on the ability to differentiate the linear footprint (according to texture and colour) from the vegetation growing adjacent to the line. Line segments indistinguishable from the surrounding forest were classified as R. Segments were classified as FR when <50% of the initial line width remained, but the line was still distinguishable on the landscape. Segments were classified as NR when >50% of the initial line width remained on the landscape. Figure 2 presents a schematic of each recovery classification category and Figure 3 shows examples of how each classification category appears on the satellite imagery within mature forests and cutblocks.

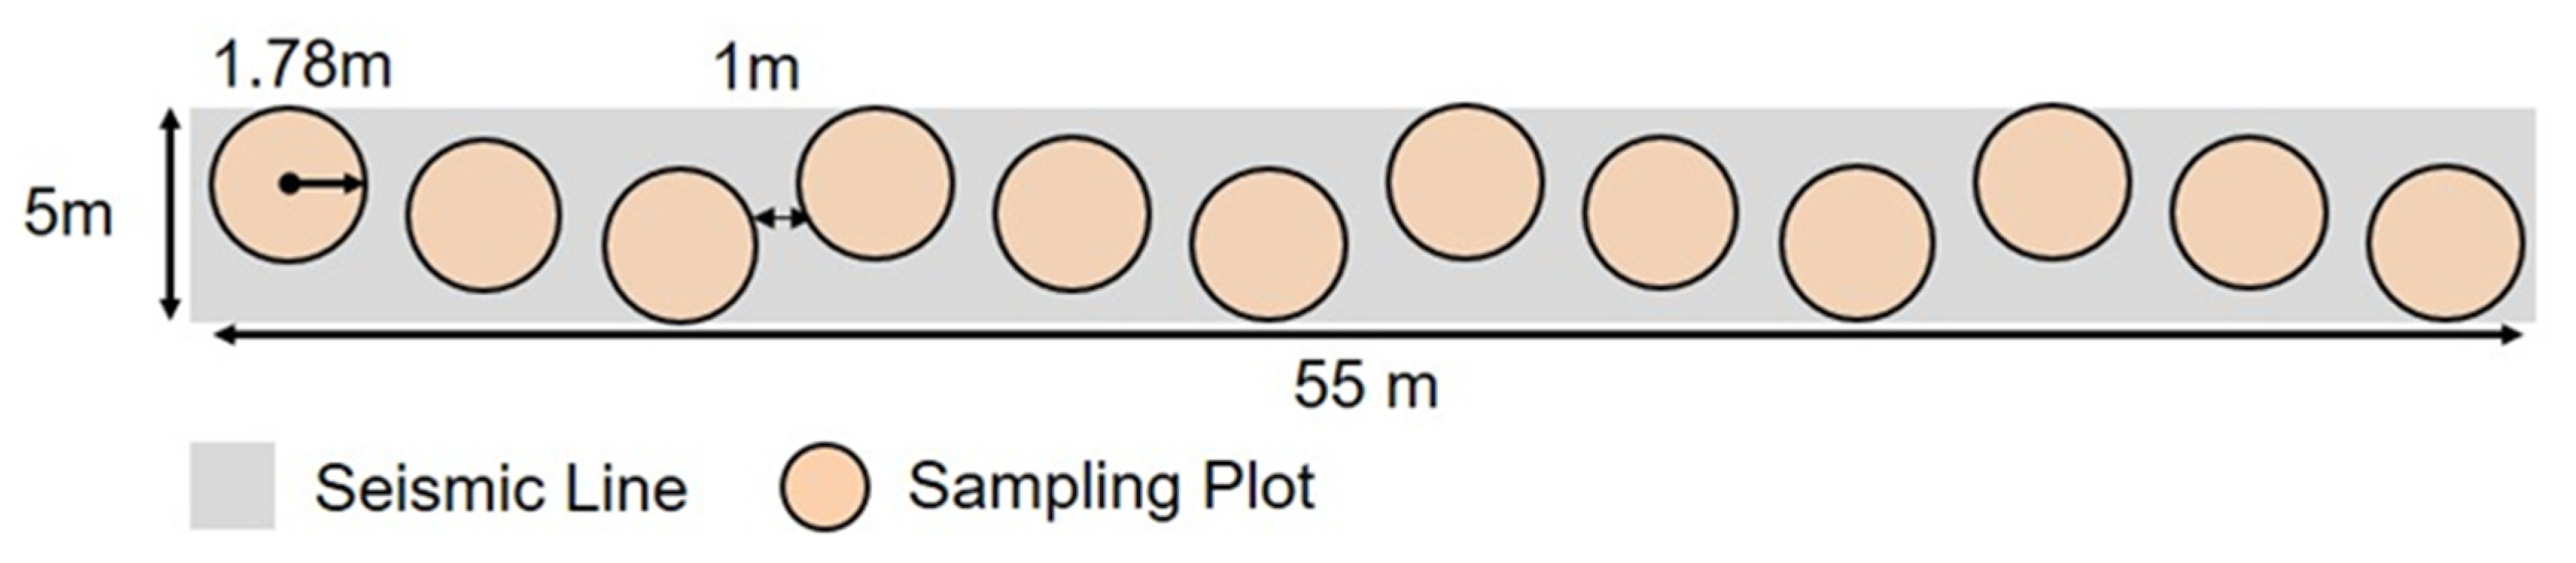
2.3. Ground Validation

Ground validation was conducted the year after the satellite imagery was taken. In total, 22 seismic line transects were ground validated: 6 classified as NR, 10 classified as FR, and 6 classified as R (Table 1).
Tree and shrub data were collected along each transect within circular plots. Transects were 55 m long by 5 m wide, and contained twelve 10 m2 circular plots, established 1 m apart in a repeating offset pattern (Figure 4). Within each circular plot, counts of individual species were recorded for all trees >1.5 m and all non-trailing shrubs. The height and diameter at breast height (DBH) were measured for all trees >1.5 m using a height pole and calipers.

2.4. Recovery Criteria

The recovery criteria used in this study were determined based on current literature and regional regulations. In Van Rensen et al.’s (2015) study, conducted in northeastern Alberta, recovery on seismic lines was defined as achieving a mean tree height of 3 m [5]. Alberta’s 2010 Reclamation Criteria for Wellsites and Associated Facilities for Forested Lands provides a minimum stem count criteria of 5000 stems ha−1 or 2000 stems ha−1 if the site is planted with merchantable species [27]. For this study, the lower density of 2000 stems ha−1 was used in combination with a minimum mean tree height of 3 m as the recovery criteria. Seismic line transects meeting both these criteria were considered ‘recovered’.

2.5. Data Analysis

To address the first objective of our study, means and standard errors were calculated for each transect based on data from the twelve circular plots. Counts were converted from stems per 10 m2 to stems ha−1. Transect mean tree heights and densities were plotted together for visual comparison with one another and the recovery criteria.
To address the second objective of determining whether tree and shrub parameters were significantly different among the three classification categories assigned based on satellite imagery interpretation, a linear mixed-effect model was used from the nlme package [28] in R [29] with a separate analysis for each response variable. Response variables included tree density, tree height, tree DBH, and shrub density. All response variable averages were taken at the circular plot level. Individual species were not analysed because species could not be identified from satellite imagery.
In the linear model for each response variable, the classification category was entered as a fixed effect and individual transect ID was included as a random effect to account for circular plots nested within transects. Where evidence of variance heterogeneity was detected between transects, the weights argument was applied using the varIdent function for data with unequal variances. Akaike information criterion (AIC) values from the model with the varIdent function were also compared to the original model as a second cross-validation of improved model fit. An analysis of variance (ANOVA) was used to evaluate the significance of the classification category on response variables. Effects were deemed significant if the p value was ≤0.05. The emmeans package was used to obtain estimated means for parameters based on models and the cld function was used to generate compact letter displays of pairwise comparisons of estimated means at a significant level of 0.05. Assumptions of normality and equality of variance were assessed graphically using plots of residuals. In some cases, square root transformations were employed to meet model assumptions and the model estimated means were inverse-transformed for reporting.

3. Results

3.1. Tree and Shrub Composition

Within the 22 transects, we recorded 1612 trees >1.5 m tall. Tree species included Betula papyrifera Marsh. (paper birch) (31%), Populus tremuloides Michx. (aspen) (24%), Pinus contorta Doug. ex Loud. (lodgepole pine) (16%), Picea glauca (Moench) Voss (white spruce) (11%), Populus balsamifera (L.) (balsam poplar) (9%), Abies balsamea (L.) Mill. (balsam fir) (7%), and Pinus mariana (Mill). B.S.P. (black spruce) (1%). The five most common non-trailing shrub species encountered were Rosa acicularis Lindl. (prickly rose) (28%), Alnus spp. (18%), Salix spp. (13%), Viburnum edule (Michx.) Raf (low-bush cranberry) (12%), and Rubus idaeus (L.) (red raspberry) (10%). Transect-level tree data, including the number of trees > 1.5 m and the percentage of coniferous and deciduous trees can be found in the Appendix A (Table A1).

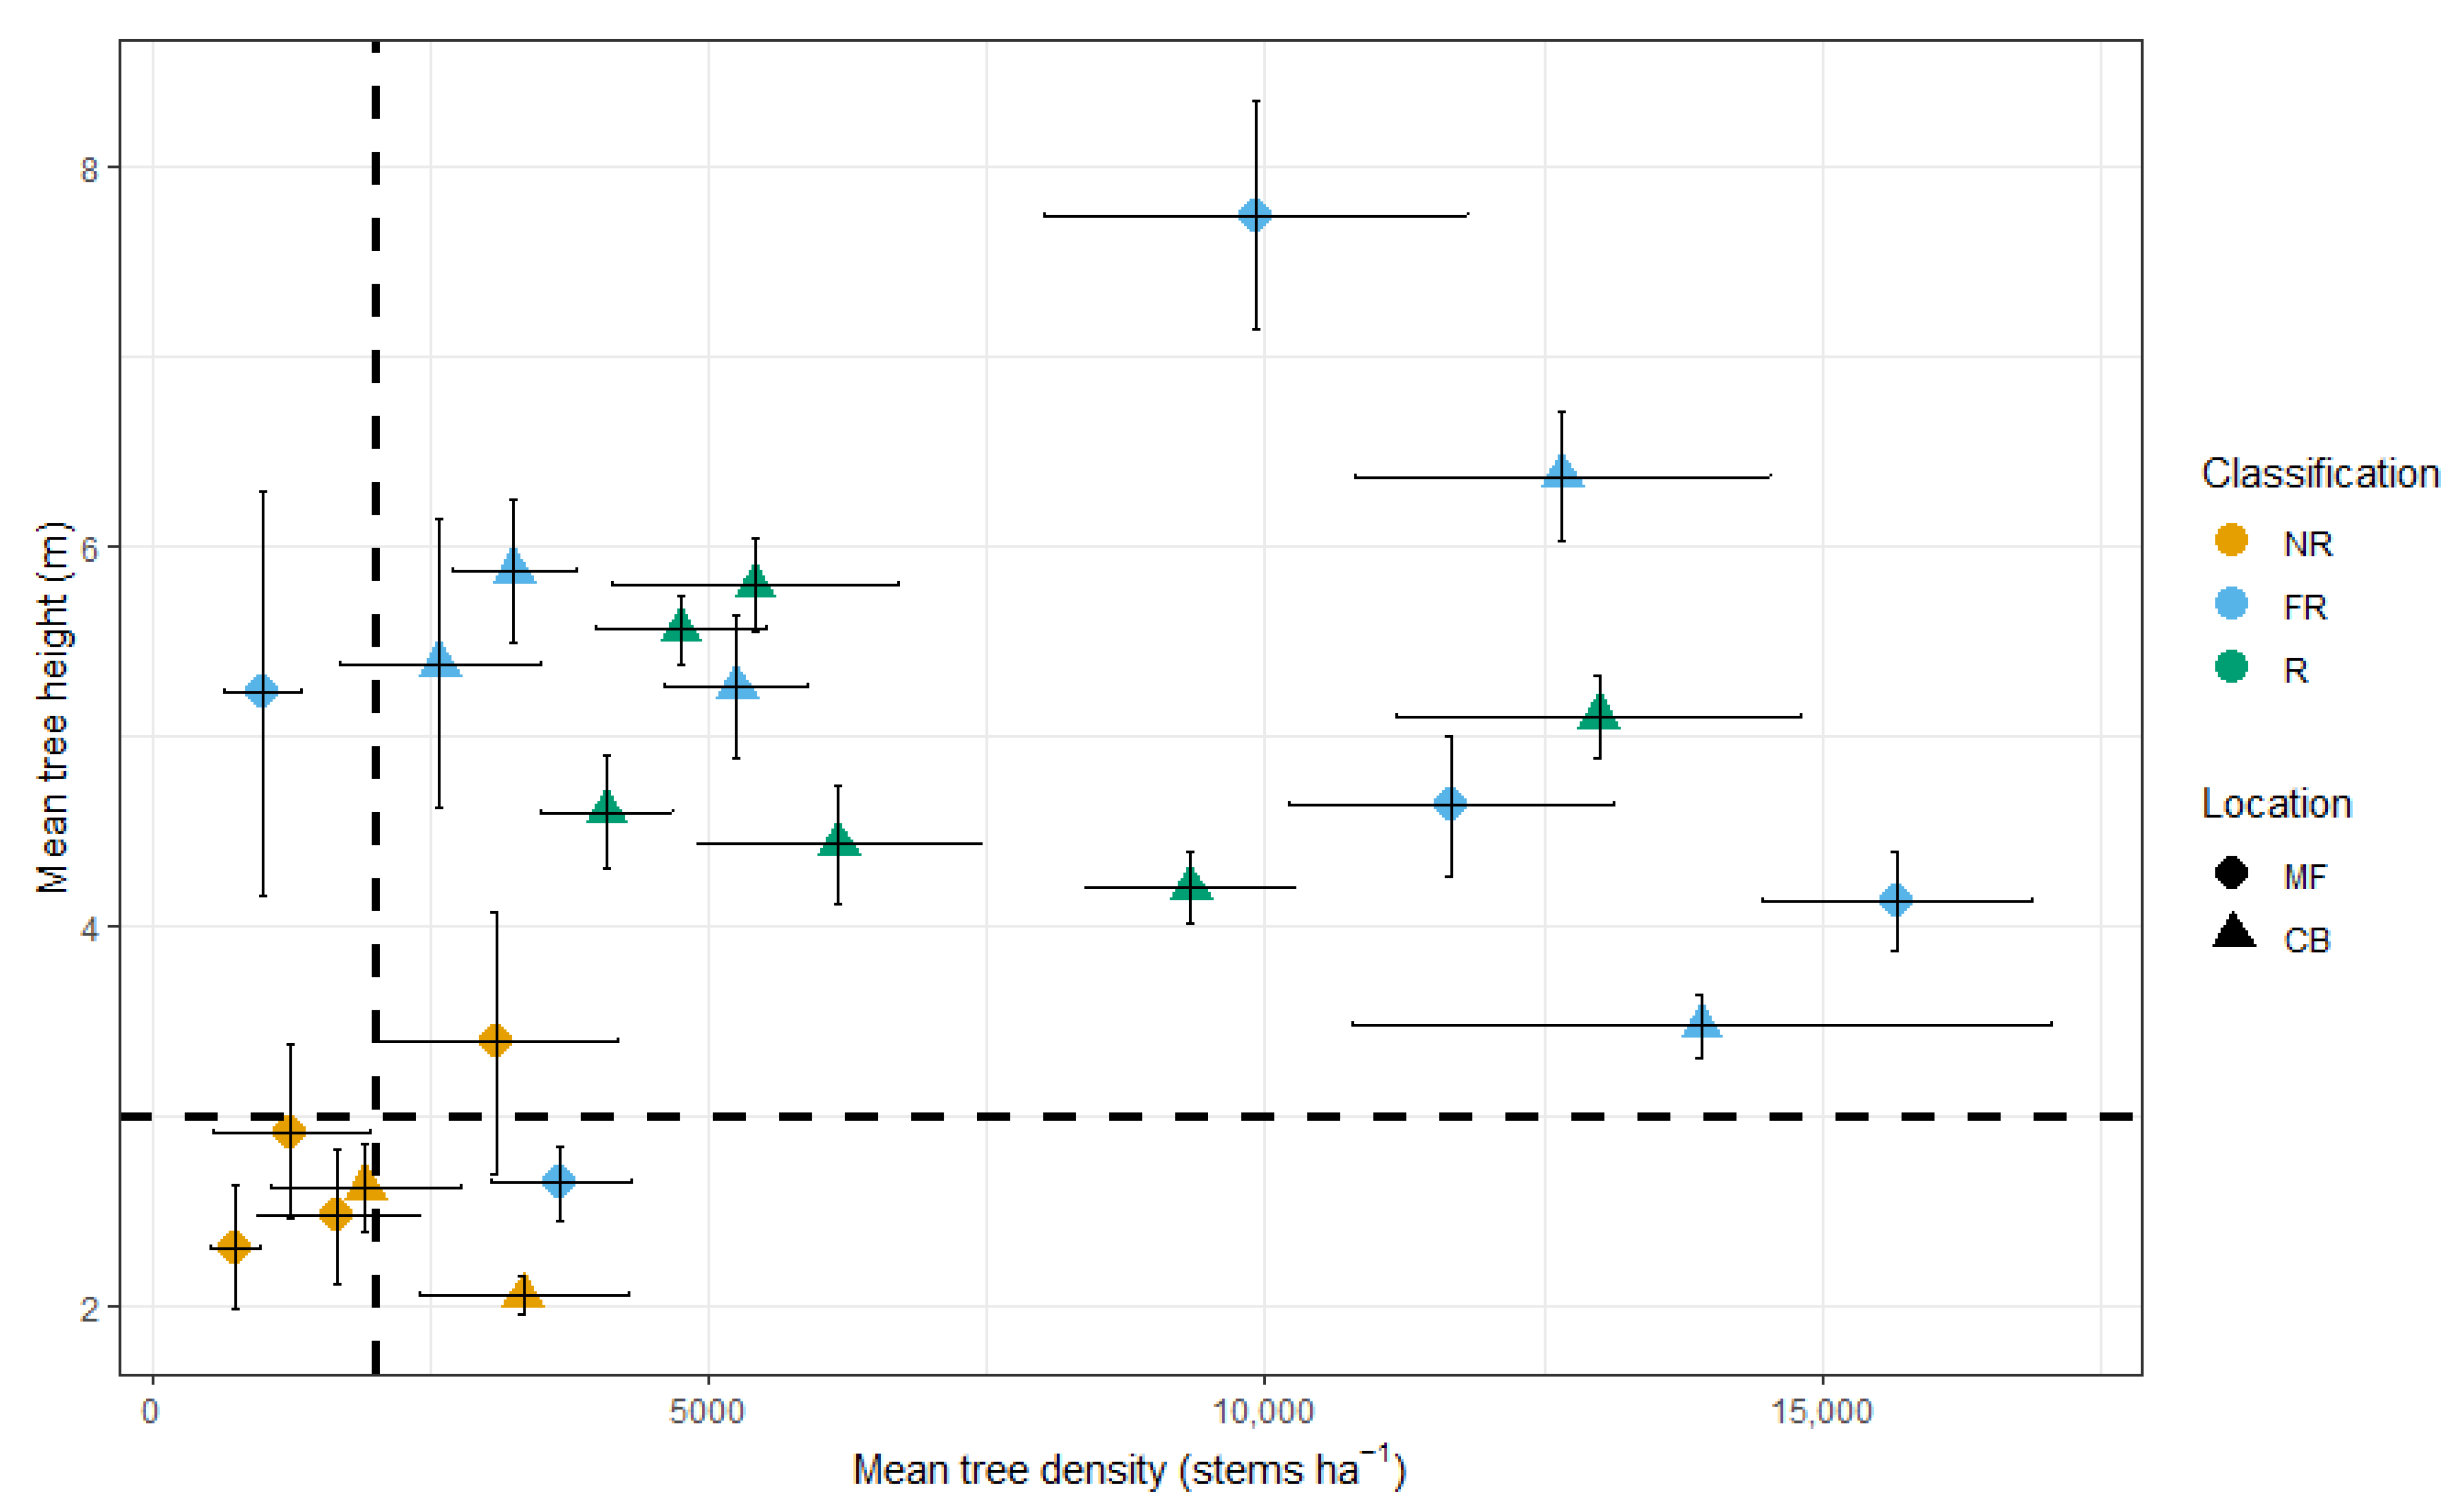
3.2. Comparing Transect Data with Recovery Criteria

The mean tree height and tree density of each transect is shown in relation to the recovery criteria of 3 m mean height and 2000 stems ha−1 density requirement (Figure 5).
All six of the transects classified as R met the recovery criteria, while eight out of the ten transects classified as FR met the criteria and only one out of the six transects classified as NR met the criteria.

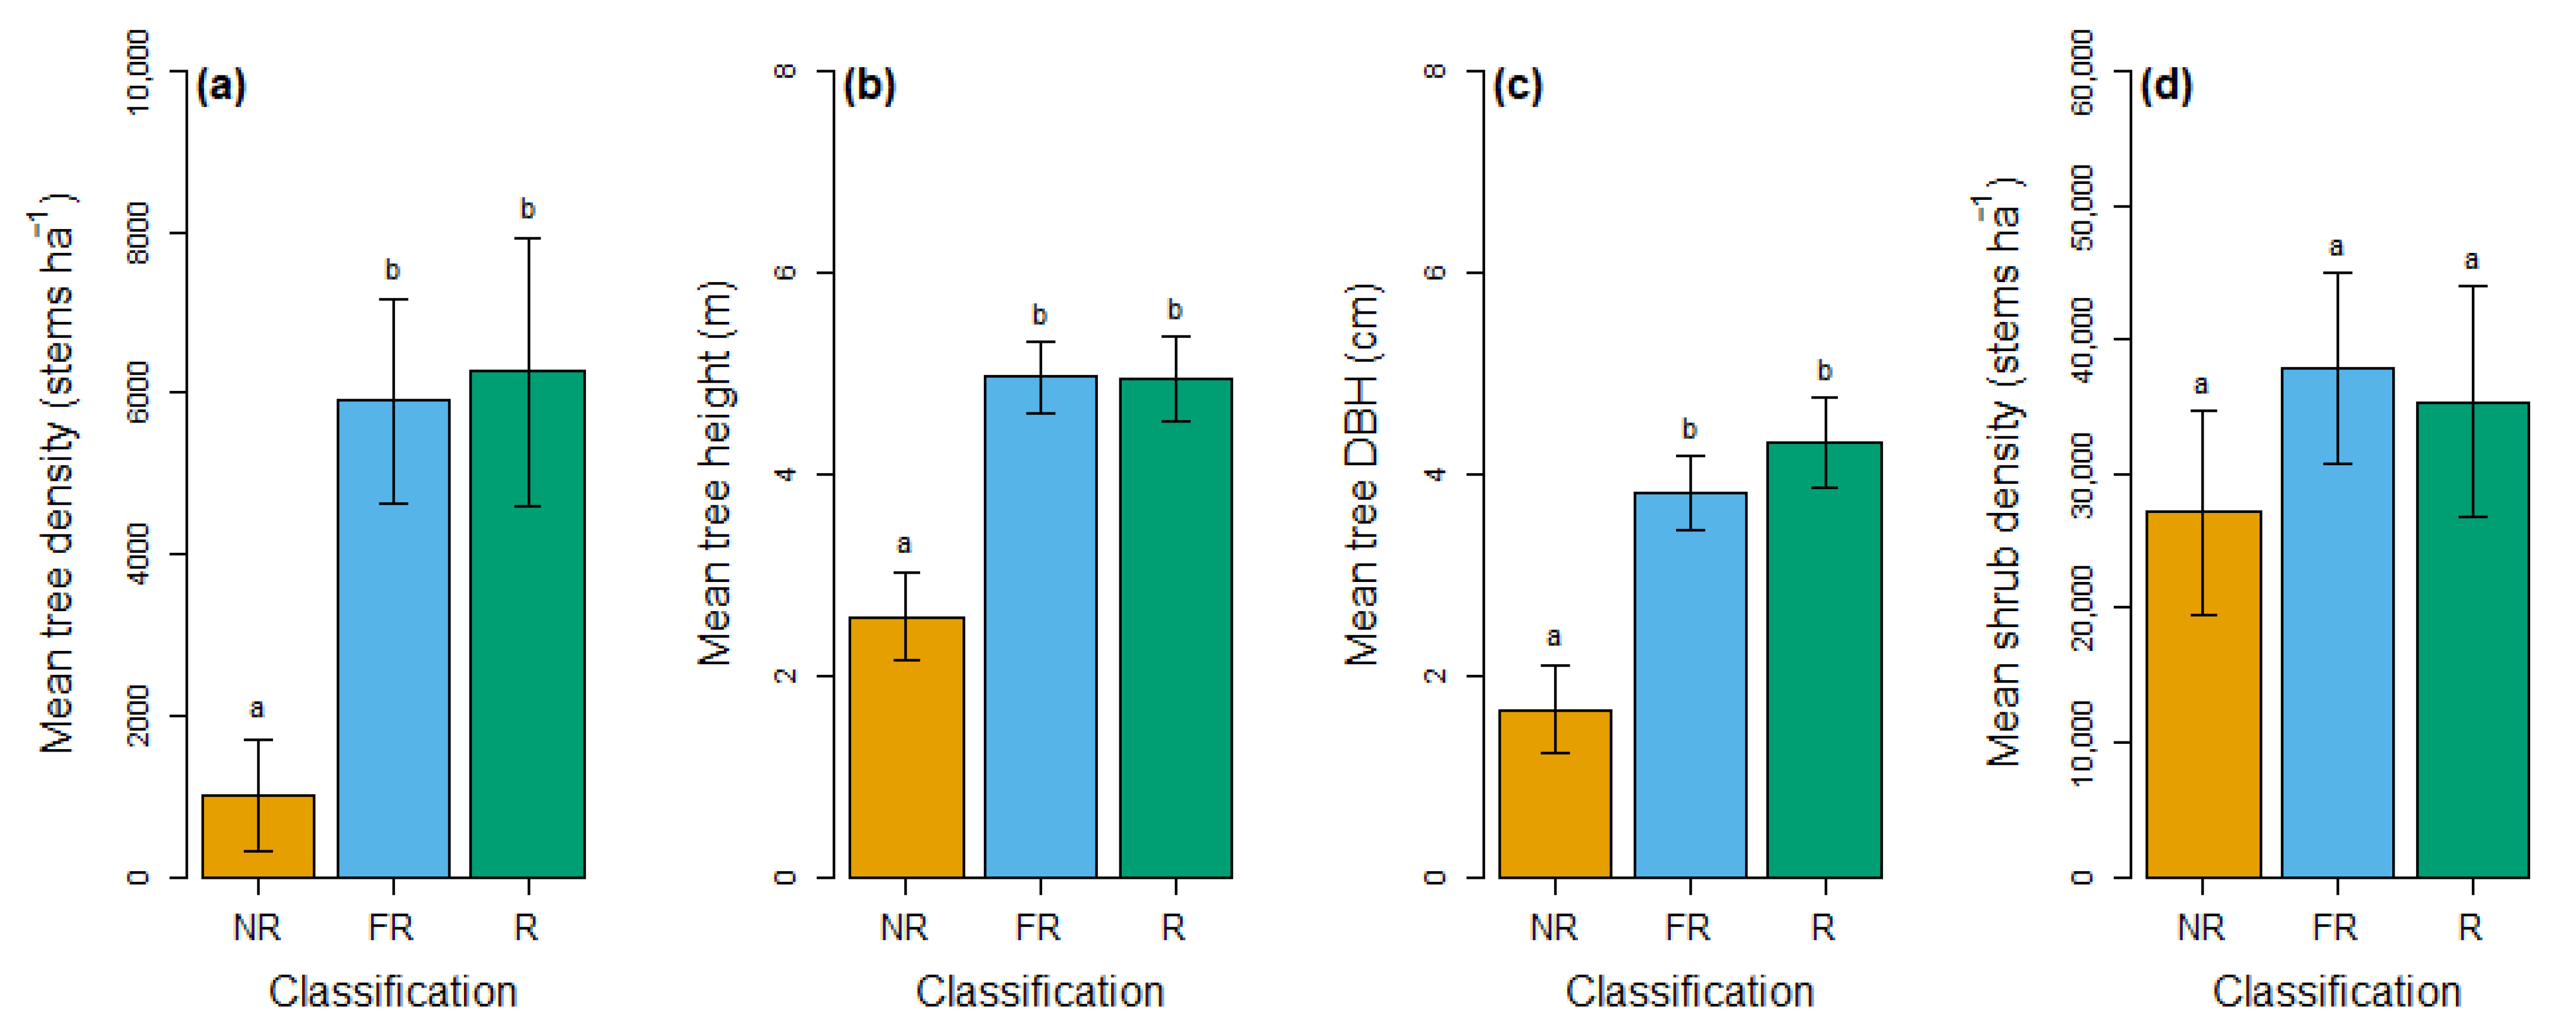
3.3. Comparing Response Variables between Classification Categories

Results from the linear mixed effect model show that the mean tree density was significantly higher on transects classified as both FR and R compared to transects classified as NR (F2,19 = 6.61; p = 0.007) (Figure 6a). Mean tree height (F2,19 = 10.64; p = 0.0008) and tree DBH (F2,19 = 10.55; p = 0.0008) were also significantly higher on transects classified as both FR and R than on transects classified as NR (Figure 6b,c). Shrub density was not significantly different (F2,19 = 0.53, p = 0.6) between the three classification categories (Figure 6d).

4. Discussion

4.1. Accuracy of Classification Categories

All transects classified as R based on satellite imagery interpretation met both height and density recovery criteria. Of those transects classified as FR, 80% met the field-measured recovery criteria, indicating that most seismic lines in this category had regenerated. Conversely, the majority of transects classified as NR (83%) did not meet the recovery criteria and had significantly lower mean tree densities, tree heights, and tree DBHs compared with the FR and R categories. The lack of statistical differences in any of the measured response variables (i.e., tree height, tree DBH, tree density, shrub density) between the FR and R categories indicates that other factors, such as shadows cast by adjacent vegetation, were likely responsible for making recovered lines more distinguishable in the satellite imagery.
Total shrub density was not significantly different across all three classification categories, indicating that shrub presence, including tall shrubs, did not contribute to the distinction made between the various classification categories in the mixedwood study area; rather, these differences were driven by differences in tree parameters. However, in a predominantly deciduous forest, it is possible that the presence of shrubs could lend the appearance of a recovered seismic line on satellite imagery, but this was not tested in our study.
There is a lack of peer-reviewed studies using visual assessment of satellite imagery to assess forest recovery; however, some work has been done to assess the accuracy of visual interpretations of satellite imagery for classifying land use and estimating forest cover [30,31]. High success rates (95%) have been reported for the identification of land use based on true colour satellite imagery with higher resolution imagery (<5 m) producing better estimates [30,31].
When considered collectively, results from this study conducted in upland mixedwood forests indicate that visual assessments of high resolution (1.5 m) satellite imagery can be used as a preliminary method to distinguish linear features on the landscape that have recovered from those that have not recovered. We also observed that seismic line regeneration occurred more uniformly across seismic lines in this study, instead of encroachment from edges as we expected in the assignment of the FR classification category (Figure 2). For these reasons, a two-tiered recovery classification system, where the FR and R categories are combined, giving simply “Recovered” and “Not Recovered” categories, would have effectively captured seismic line forest regeneration status in the study area. However, the intermediate category (FR) may still have utility in other ecosystems and could be considered in future studies. Furthermore, results from this study highlight the importance of ground validating for understanding classification categories derived from imagery.

4.2. Recovered Seismic Lines in Mature Forests

While many seismic lines in both reforested cutblocks and mature forest stands met the field-measured recovery criteria based on tree density and height parameters, it is noteworthy that only seismic lines in cutblocks (treated) were classified as R based on the imagery. Because satellite imagery is influenced by solar illumination and view angles [32], it is likely that the more visually apparent shadows from the taller adjacent forest trees make the seismic line appear more distinct on the landscape and thus increase the uncertainty when assigning recovery categories. Conversely, in cutblocks, where the trees on seismic lines are of similar age and height as the trees in the harvested area, there is no height difference between the line and its surroundings, making it indistinguishable on satellite imagery. Therefore, until trees on the seismic line reach the height of trees in the adjacent forest, the footprint of the line will likely remain distinguishable on satellite imagery and may be mistakenly categorized as FR. However, it should be noted that poor tree recovery on seismic lines in mature forests was still distinguishable in the satellite imagery assessments. A two-tiered classification system where the FR and R categories are grouped together if <50% of the initial line width remained, would better capture natural recovery in mature forests.

4.3. Limitations

While visual interpretation of imagery is simple, efficient, and requires minimal training, a disadvantage of this technique is its inherent subjectivity as different individuals may perceive colour and texture differently [30]. For detailed visual assessments of satellite imagery, multiple interpreters are recommended to calibrate for differences between them [30]; however, for purposes of providing cursory level recovery information across broad spatial areas, we believe that maintaining consistency is important and recommend that a single individual perform the assessments wherever possible, as was done in this study. It may also be possible to further develop this technique using more stringent criteria in future studies.
Another limitation of this method is that seismic line recovery is based solely on the presence of vegetation on the seismic line that is not visually distinct from the adjacent forest. This technique is based on canopy cover and does not provide any other important recovery metrics such as height, density, understory community structure, or environmental variables, making it a simplified way of evaluating recovery [33]. As such, it does not provide the whole picture of recovery and is not a substitute for field measurements; however, this method may still be useful as a tool for making high-level approximate assessments.
The evaluation of this technique is also limited by the small number of replicates ground validated: six NR transects, ten FR transects, and six R transects. Furthermore, data used in this study were collected from treated/planted seismic lines in cutblocks as well as naturally regenerating seismic lines in mature forest stands; however, classification categories did not have a balanced representation between the two site types. This was due to the lack of lines in mature forest appearing recovered as well as site access limitations (only two replicates of the NR category in cutblocks). Hence, we were unable to test the interaction effect between forest type and classification category and, while the forest type did not affect any of the response variables on its own, it is possible that interactions may be present.
Furthermore, results from this study apply to the advanced recovery of conventional seismic lines 10 to 40 years post-disturbance and within upland mixedwood forests. Application of this technique to earlier recovery or seismic lines in different ecosites may be less accurate. For example, seismic lines in ecosites with shorter and less dense vegetation may be less discernible on satellite imagery and thus appear recovered. Finally, this technique was developed for assessing conventional seismic lines and is not recommended for visual assessments of narrower (1–2 m) low-impact seismic lines which would be very difficult to observe on satellite imagery with 1.5 m resolution.

5. Conclusions

In this study, we evaluated a new method of assessing seismic line recovery using visual interpretation of satellite imagery to classify seismic lines into three broad categories: NR, FR, and R. Results from this study indicate that the presence or absence of advanced forest recovery on conventional seismic lines in upland mixedwood forests is distinguishable using visual interpretation of satellite imagery; however, an evaluation of the extent of recovery is not possible. Given the magnitude of seismic line disturbance and the growing need for restoration programs and recovery monitoring, desktop satellite imagery interpretation could be a simple and cost-effective alternative to airborne remote sensing data acquisitions for providing cursory-level approximate information about the current state of conventional seismic lines.
Future studies should encompass validating the accuracy of visual satellite imagery assessments on seismic lines in lowland forests as well as deciduous or coniferous dominated stands. We also recommend that future studies collect ‘offline’ data adjacent to the seismic line to compare species compositions on seismic lines with the adjacent forest.

Author Contributions

Conceptualization, D.D., A.S. and J.H.; methodology, A.V.D., C.J., C.D., T.F., A.S. and D.D.; formal analysis, A.V.D. and C.D.; data curation, A.V.D., C.D. and C.J.; writing—original draft preparation, A.V.D. and D.D.; writing—review and editing, A.V.D., C.J., C.D., A.S., J.H., T.F. and D.D.; supervision, D.D.; project administration, D.D.; funding acquisition, D.D. and J.H. All authors have read and agreed to the published version of the manuscript.

Funding

This research was funded by the Cumulative Effects Program funding from the Canadian Forest Service as well as a National Sciences and Engineering Research Council Industrial Research Chair for Colleges Grant, which supported the initial development of the method and A.S.’s time.

Data Availability Statement

Data underpinning the work are not available in the public domain. Please email the corresponding author for data access.

Acknowledgments

The authors would like to acknowledge the contributions to this work from Keith Wells and Steve Blanton (Manning Forest Products) as well as acknowledge Jessica Hudson, Kaitlyn Trepanier, Derek Alcorn, Kaela Walton-Sather, and Erin Laxton for their assistance in the field and thank Manning Forest Products for providing us with the imagery from 2000.

Conflicts of Interest

The authors declare no conflict of interest.

Appendix A

Table A1. Classification and number of trees > 1.5 m measured on each transect. Also percent coniferous and deciduous per transect, and percent of circular plots per transect.
Transect NumberClassificationNumber of Trees% Coniferous% Deciduous
1NR403863
2NR231387
3NR156733
4NR207030
5NR378911
6NR95644
7FR395149
8FR634159
9FR167793
10FR311387
11FR152793
12FR1197129
13FR1883466
14FR1406139
15FR12928
16FR441684
17R496535
18R652872
19R1126139
20R573268
21R1561585
22R742476

References

  1. Alberta Environment and Parks. The Alberta Human Footpring Monitoring Program: A Historical Overview of Geophysical Explotation in Alberta; Alberta Environment and Parks: Calgary, AB, Canada, 2021. [Google Scholar]
  2. Dabros, A.; Pyper, M.; Castilla, G. Seismic Lines in the Boreal and Arctic Ecosystems of North America: Environmental Impacts, Challenges, and Opportunities. Environ. Rev. 2018, 26, 214–229. [Google Scholar] [CrossRef] [Green Version]
  3. Timoney, K.; Lee, P. Environmental Management in Resource-Rich Alberta, Canada: First World Jurisdiction, Third World Analogue? J. Environ. Manag. 2001, 63, 387–405. [Google Scholar] [CrossRef] [PubMed]
  4. Lee, P.; Boutin, S. Persistence and Developmental Transition of Wide Seismic Lines in the Western Boreal Plains of Canada. J. Environ. Manag. 2006, 78, 240–250. [Google Scholar] [CrossRef] [PubMed]
  5. Van Rensen, C.K.; Nielsen, S.E.; White, B.; Vinge, T.; Lieffers, V.J. Natural Regeneration of Forest Vegetation on Legacy Seismic Lines in Boreal Habitats in Alberta’s Oil Sands Region. Biol. Conserv. 2015, 184, 127–135. [Google Scholar] [CrossRef] [Green Version]
  6. Filicetti, A.T.; Cody, M.; Nielsen, S.E. Caribou Conservation: Restoring Trees on Seismic Lines in Alberta, Canada. Forests 2019, 10, 185. [Google Scholar] [CrossRef] [Green Version]
  7. Pyper, M.; Nishi, J.; McNeil, L. Linear Feature Restoration in Caribou Habitat: A Summary of Current Practices and a Roadmap for Future Programs; Canada’s Oil Sands Innovation Alliance: Calgary, AB, Canada, 2014. [Google Scholar]
  8. Alberta Biodiversity Monitoring Institute. Prioritizing Zones for Caribou Habitat Restoration in the Canada’s Oil Sands Innovation Alliance Area; Alberta Biodiversity Monitoring Institute: Edmonton, AB, Canada, 2016. [Google Scholar]
  9. Chen, S.; McDermid, G.J.; Castilla, G.; Linke, J. Measuring Vegetation Height in Linear Disturbances in the Boreal Forest with UAV Photogrammetry. Remote Sens. 2017, 9, 1257. [Google Scholar] [CrossRef] [Green Version]
  10. Abib, T.H.; Chasmer, L.; Hopkinson, C.; Mahoney, C.; Rodriguez, L.C.E. Seismic Line Impacts on Proximal Boreal Forest and Wetland Environments in Alberta. Sci. Total Environ. 2019, 658, 1601–1613. [Google Scholar] [CrossRef] [PubMed]
  11. Barber, Q.E.; Bater, C.W.; Dabros, A.; Pinzon, J.; Nielsen, S.E.; Parisien, M.-A. Persistent Impact of Conventional Seismic Lines on Boreal Vegetation Structure Following Wildfire. Can. J. For. Res. 2021, 51, 1581–1594. [Google Scholar] [CrossRef]
  12. Alberta Biodiversity Monitoring Institute. Collaborative Landscape Data to Support Woodland Caribou Recovery Planning in Northwestern Alberta; Alberta Biodiversity Monitoring Institute: Edmonton, AB, Canada, 2021. [Google Scholar]
  13. White, J.C.; Saarinen, N.; Kankare, V.; Wulder, M.A.; Hermosilla, T.; Coops, N.C.; Pickell, P.D.; Holopainen, M.; Hyyppä, J.; Vastaranta, M. Confirmation of Post-Harvest Spectral Recovery from Landsat Time Series Using Measures of Forest Cover and Height Derived from Airborne Laser Scanning Data. Remote Sens. Environ. 2018, 216, 262–275. [Google Scholar] [CrossRef]
  14. Fromm, M.; Schubert, M.; Castilla, G.; Linke, J.; McDermid, G. Automated Detection of Conifer Seedlings in Drone Imagery Using Convolutional Neural Networks. Remote Sens. 2019, 11, 2585. [Google Scholar] [CrossRef] [Green Version]
  15. He, Y.; Franklin, S.E.; Guo, X. Narrow-Linear and Small-Area Forest Disturbance Detection and Mapping from High Spatial Resolution Imagery: A Framework. J. Appl. Remote Sens. 2009, 3, 033570. [Google Scholar] [CrossRef]
  16. QGIS Development Team. QGIS Geographic Information System, 2020. Open Source Geospatial Foundation Project. Available online: http://qgis.osgeo.org (accessed on 20 November 2020).
  17. Willoughby, M.G.; Downing, D.J.; Meijer, M. Guide to Ecological Sites of the Lower Boreal Highlands Subregion; Alberta Environment and Parks: Edmonton, AB, Canada, 2016; ISBN 9781460131695. [Google Scholar]
  18. Natural Regions Committee. Natural Regions and Subregions of Alberta; Natural Regions Committee: Edmonton, AB, Canada, 2006. [Google Scholar]
  19. Environment and Climate Change Canada. Canadian Climate Normals 1981–2010 Station Data—Manning. Available online: https://climate.weather.gc.ca/climate_normals/results_1981_2010_e.html?searchType=stnProv&lstProvince=AB&txtCentralLatMin=0&txtCentralLatSec=0&txtCentralLongMin=0&txtCentralLongSec=0&stnID=2750&dispBack=0 (accessed on 17 January 2021).
  20. Government of Alberta. Forest Management Agreement Boundaries [Map]. Available online: https://open.alberta.ca/publications/forest-management-agreement-boundaries-map#detailed (accessed on 13 December 2021).
  21. Pulse Seismic Inc. Pulse Seismic Data Map. Available online: https://map.pulseseismic.com/main.html (accessed on 9 November 2021).
  22. Alberta Biodiversity Monitoring Institute. Wall-to-Wall Human Footprint Inventory. Available online: https://abmi.ca/home/data-analytics/da-top/da-product-overview/Human-Footprint-Products/HF-inventory.html (accessed on 9 November 2021).
  23. Alberta Agriculture and Forestry. Derived Ecosite Phase v2.0. Available online: https://gda.alberta.ca/geoportal/rest/metadata/item/c76ad555f7f743cd9f6dd0d049aaf6b8/html (accessed on 9 November 2021).
  24. Dabros, A.; James Hammond, H.E.; Pinzon, J.; Pinno, B.; Langor, D. Edge Influence of Low-Impact Seismic Lines for Oil Exploration on Upland Forest Vegetation in Northern Alberta (Canada). For. Ecol. Manag. 2017, 400, 278–288. [Google Scholar] [CrossRef]
  25. Harper, K.A.; Macdonald, S.E.; Mayerhofer, M.S.; Biswas, S.R.; Esseen, P.A.; Hylander, K.; Stewart, K.J.; Mallik, A.U.; Drapeau, P.; Jonsson, B.G.; et al. Edge Influence on Vegetation at Natural and Anthropogenic Edges of Boreal Forests in Canada and Fennoscandia. J. Ecol. 2015, 103, 550–562. [Google Scholar] [CrossRef]
  26. Esri Inc ArcGIS Pro (Version 2.5). 2020. Available online: http://www.esri.com/en-us/arcgis/products-pro/overvoew (accessed on 20 November 2020).
  27. Government of Alberta. 2010 Reclamation Criteria for Wellsites and Associated Facilities for Forested Lands; Government of Alberta: Edmonton, AB, Canada, 2013.
  28. Pinheiro, J.; Bates, D.; DebRoy, S.; Sarkar, D.; R Core Team. nlme: Linear and Nonlinear Mixed Effects Models. 2020. Available online: https://CRAN.R-project.org/package=nlme (accessed on 20 November 2020).
  29. R Core Team. R: A Language and Environment for Statistical Computing; R Foundation for Statistical Computing: Vienna, Austria, 2020; Available online: http://www.R-project.org (accessed on 20 November 2020).
  30. Svatonova, H. Analysis of Visual Interpretation of Satellite Data. Int. Arch. Photogramm. Remote Sens. Spat. Inf. Sci. 2016, 41, 675–681. [Google Scholar] [CrossRef] [Green Version]
  31. Asrat, Z.; Taddese, H.; Ørka, H.O.; Gobakken, T.; Burud, I.; Næsset, E. Estimation of Forest Area and Canopy Cover Based on Visual Interpretation of Satellite Images in Ethiopia. Land 2018, 7, 92. [Google Scholar] [CrossRef] [Green Version]
  32. Holopainen, M.; Vastaranta, M.; Karjalainen, M.; Karila, K.; Kaasalainen, S.; Honkavaara, E.; Hyyppä, J. Forest Inventory Attribute Estimation Using Airborne Laser Scanning, Aerial Stereo Imagery, Radargrammetry and Interferometry-Finnish Experiences of the 3d Techniques. ISPRS Ann. Photogramm. Remote Sens. Spat. Inf. Sci. 2015, 2, 63–69. [Google Scholar] [CrossRef] [Green Version]
  33. Bayne, E.; Lankau, H.; Tigner, J. Ecologically-Based Criteria to Assess the Impact and Recovery of Seismic Lines: The Importance of Width, Regeneration, and Seismic Density; Environmental Studies Research Funds: Ottawa, ON, Canada, 2011. [Google Scholar]
Figure 1. Study area in northwestern Alberta showing seismic line transect locations and their forest type; either mature forest (blue) or cutblock (orange). Image was created using QGIS version 3.16.0 [16].
Forests 13 01022 g001
Figure 2. Schematic of each classification category on a seismic line: Not Recovered (NR), Fractionally Recovered (FR), and Recovered (R). Dashed line represents the estimated initial width from the 2000 imagery. Green = Forested/vegetated area. Beige = Not forested/vegetated.
Forests 13 01022 g002
Figure 3. Examples of the recovery classification categories: (a) Not Recovered (NR), (b) Fractionally Recovered (FR), and (c) Recovered (R) shown on satellite imagery © (2021) Airbus Defence and Space, Licensed by Planet Labs Geomatics Corp., http://geomatics.planet.com/ (accessed on 20 November 2020). The yellow rectangle marks the 55 m long sampling transect location. Image was created using QGIS version 3.16.0 [16].
Forests 13 01022 g003
Figure 4. Layout of circular plots within a transect on a seismic line.
Forests 13 01022 g004
Figure 5. Mean tree height (m) and mean tree density (stems ha−1) of each seismic line transect (n = 22). Error bars represent one standard error of the mean. Colours indicate transect classification based on satellite imagery interpretation; Not Recovered (NR), Fractionally Recovered (FR), or Recovered (R). Symbols indicate the transect location: mature forest (MF) or cutblock (CB). The horizontal dashed line indicates the recovery criterion of 3 m tree height, and the vertical dashed line indicates the recovery criterion of 2000 stems ha−1.
Forests 13 01022 g005
Figure 6. Mean tree density (trees > 1.5 m) (a), height (trees > 1.5 m) (b), DBH (trees > 1.5 m) (c), and shrub density (d), per classification category: NR (Not Recovered) (n = 6), FR (Fractionally Recovered) (n = 10), and R (Recovered) (n = 6). Error bars represent one standard error of the mean and differing letters between means indicate a significant difference (p < 0.05).
Forests 13 01022 g006
Table 1. Transect classifications (Not Recovered (NR), Fractionally Recovered (FR), and Recovered (R)) and locations.
Transect NumberClassificationLocationLatitudeLongitude
1NRCutblock57.23495−118.22692
2NRCutblock57.23493−118.22127
3NRForest57.38724−118.34757
4NRForest57.28310−118.39974
5NRForest57.22357−118.29211
6NRForest57.22713−118.28856
7FRCutblock57.38718−118.35775
8FRCutblock57.38502−118.37852
9FRCutblock57.27486−118.39337
10FRCutblock57.21760−118.29787
11FRCutblock57.38302−118.37844
12FRForest57.38699−118.42777
13FRForest57.39967−118.42777
14FRForest57.38703−118.38419
15FRForest57.22595−118.28721
16FRForest57.21947−118.25399
17RCutblock57.38719−118.35468
18RCutblock57.38708−118.37003
19RCutblock57.38541−118.37241
20RCutblock57.39985−118.41661
21RCutblock57.39784−118.42574
22RCutblock57.22610−118.28963
Publisher’s Note: MDPI stays neutral with regard to jurisdictional claims in published maps and institutional affiliations.

