Article

Thermal Characteristics and Simulation of Enzymatic Lignin Isolated from Chinese Fir and Birch

MOE Key Laboratory of Wood Material Science and Utilization, Beijing Forestry University, Beijing 100083, China
*
Author to whom correspondence should be addressed.
Forests 2022, 13(6), 914; https://doi.org/10.3390/f13060914
Submission received: 21 May 2022 / Revised: 8 June 2022 / Accepted: 9 June 2022 / Published: 11 June 2022
(This article belongs to the Section Wood Science and Forest Products)

Abstract

:
Lignin is one of the main components of the plant cell wall, and the thermal properties of in situ biomass lignin are crucial for the multi-scale modeling of biomass properties and the thermodynamic modeling of lignin. In this study, high yields of double enzymatic lignin (DEL) were successfully isolated from softwood Chinese fir (Cunninghamia lanceolate (Lamb.) Hook.) and hardwood white birch (Betula platyphylla Suk.) to represent the in situ wood lignin. Their thermal properties, including specific heat capacity, thermal conductivity, thermal stability, and thermal degradation kinetic parameters, were tested and simulated. The results showed that Chinese fir DEL has different chemical structural units and thermal properties than birch DEL. The specific heat capacities of Chinese fir DEL and birch DEL at 20 °C were 1301 and 1468 J/(kg·K), respectively, and their thermal conductivities were 0.30 and 0.32 W/(m·K). Their specific heat capacity and thermal conductivity showed a positive linear relationship over a temperature range of 20–120 °C. Chinese fir DEL had a better thermal stability and a higher carbon residue than birch DEL. The average activation energy and pre-exponential factor changed with the conversion rate, and their relationships were simulated using linear or quadratic equations in the conversion rate range of 0.02–0.60. A second-order reaction function was found to be the best mechanism function for DEL thermal degradation.

1. Introduction

Lignin is the most abundant natural phenolic polymer in the world [1]; it is also one of the main components of the plant cell wall and usually forms ether or ester linkages with hemicellulose [2]. Lignin is mainly composed of three units: p-hydroxyphenyl (H), guaiacyl (G), and syringyl (S) units. Softwood lignin is composed mainly of G units, whereas hardwood lignin is composed mainly of G and S units [3]. Lignin is particularly important for the formation of cell walls, especially in wood and bark, because it provides rigidity and is less prone to decay. Lignin can be used in bio-based materials [4,5], pharmaceutical excipients [6], resin synthesis [7], and lignin nanoparticles [8]. In addition, it can be used to manufacture carbon-based materials, such as carbon conductive materials [9] and carbon fibers [10], through high-temperature treatments.
In the past few decades, several chemical and mechanical isolation methods have been used to isolate lignins, including kraft lignin, lignosulfonate, klason lignin, and alkali lignin, but ether bond breakage, methoxy group elimination, depolymerization, and condensation reactions may occur during isolation [11], resulting in differences in the chemical structure relative to in situ wood lignin. Milled wood lignin (MWL) has little chemical structural damage and is recognized as having a structure that is closest to natural in situ lignin [12,13,14], but its yield is very low, at only 20%–30%, and this isolation method should be further developed to obtain higher yields of lignin for its physical and mechanical analysis. Cellulolytic enzyme lignin (CEL) is obtained via the combination of the enzymatic hydrolysis of cellulose with ball-milling; the chemical structure of CEL is similar to that of MWL, and yields of 75%–80% can be obtained. Chen et al. [15] modified the CEL isolation process to produce double enzymatic lignin (DEL). DEL has a higher yield than CEL and is produced using an easier process; it largely retains the original chemical structure of lignin, and it is similar to groundwood lignin. This lignin not only solves the problem of low yield, but it also has a chemical structure that is close to in situ wood lignin [16]. DEL has generally been obtained from hardwood in previous research, and whether pure DEL can also be obtained from softwood remains to be verified. It has been hypothesized that the physical and mechanical properties of hardwood DEL and softwood DEL are different, as their structural units are different, but this hypothesis should be verified.
The thermal properties of wood are very important, affecting its use in the fields of construction and materials. Thermal conductivity, specific heat capacity, and heat capacity are the key thermodynamic parameters for simulating and calculating heat and mass transfer during the processing of wood materials. These are also important thermal properties for wood processing and utilization. Thermal degradation kinetic parameters, including activation energy (Ea) and pre-exponential factor (A) provide a fundamental explanation for the thermal processing of wood, and predict the properties of the final product; the end-use temperature of wood materials depends on their thermal stability [17]. Wood is composed mainly of cellulose, hemicellulose, and lignin, and it is very important to understand the thermal properties above for every individual wood chemical component during multi-scale analysis and the simulation of wood thermal properties, and for its thermodynamic analysis. Qi et al. [17] tested and simulated the thermal conductivity, specific heat capacity, heat capacity, and thermal degradation kinetic parameters of cellulose and hemicellulose isolated from birch using mild chemicals, but these thermal properties of in situ lignin require further investigation.
The process of lignin isolation has a great influence on its properties [18]. The thermal properties of kraft lignin, alcoholysis lignin, and dioxane lignin have been investigated by a number of researchers. However, the chemical structures of these lignins differ markedly from those of in situ lignin, and therefore, they cannot be used to directly demonstrate the properties of in situ biomass lignin. The thermal stability of hardwood and softwood MWL was analyzed by Wang et al. [19], and their results showed that the thermal stability of softwood MWL was higher than that of hardwood MWL. However, the thermal conductivity and heat capacity of MWLs were not reported, as it is a challenge to obtain sufficient amounts of MWL material for these tests. The thermal properties of lignin vary among sources and isolation methods, and Jiang et al. [20] demonstrated that thermal stability and thermal degradation kinetics differed among the four types of lignin. The thermal stability of CEL was analyzed by Qin Zhao et al. [21], but other thermal properties of CEL and DEL were not reported. The yield of DEL is higher than that of CEL, and the chemical structures of both are close to those of in situ lignin; it is therefore possible to obtain sufficient amounts of DEL to analyze its thermal conductivity, heat capacity, and thermal degradation properties.
In this study, a high yield of DEL with a chemical structure similar to that of in situ wood lignin was obtained from both hardwood and softwood via the combining of double ball-milling with enzymatic hydrolysis of cellulose. We hypothesized that hardwood DEL would have a different specific heat capacity, thermal conductivity, and thermal stability than softwood DEL. FTIR and 2D-HSQC experiments were performed to identify lignin structure. High-accuracy thermal degradation kinetic parameters of DEL were calculated using the Flynn–Wall–Ozawa (FWO) and Friedman methods with a conversion rate (α) interval of 0.01, and the relationship between the degradation kinetic parameters and conversion rate was simulated.

2. Materials and Methods

2.1. Materials

The softwood Chinese fir (Cunninghamia lanceolate (Lamb.) Hook.) was obtained from Ya’an City, Sichuan Province, China, and the hardwood white birch (Betula platyphylla Suk.) was purchased from Linyi City, Shandong Province, China. Both Chinese fir and white birch were 15 years old and were crushed into wood powder with a grinder; wood powder with a size of 80–100 mesh was screened out for use in subsequent experiments. Cellulose complex enzyme (Cellic CTec3, Novozymes, Denmark; 100 FPU/mL) and analytical grade chemicals were used in this study.

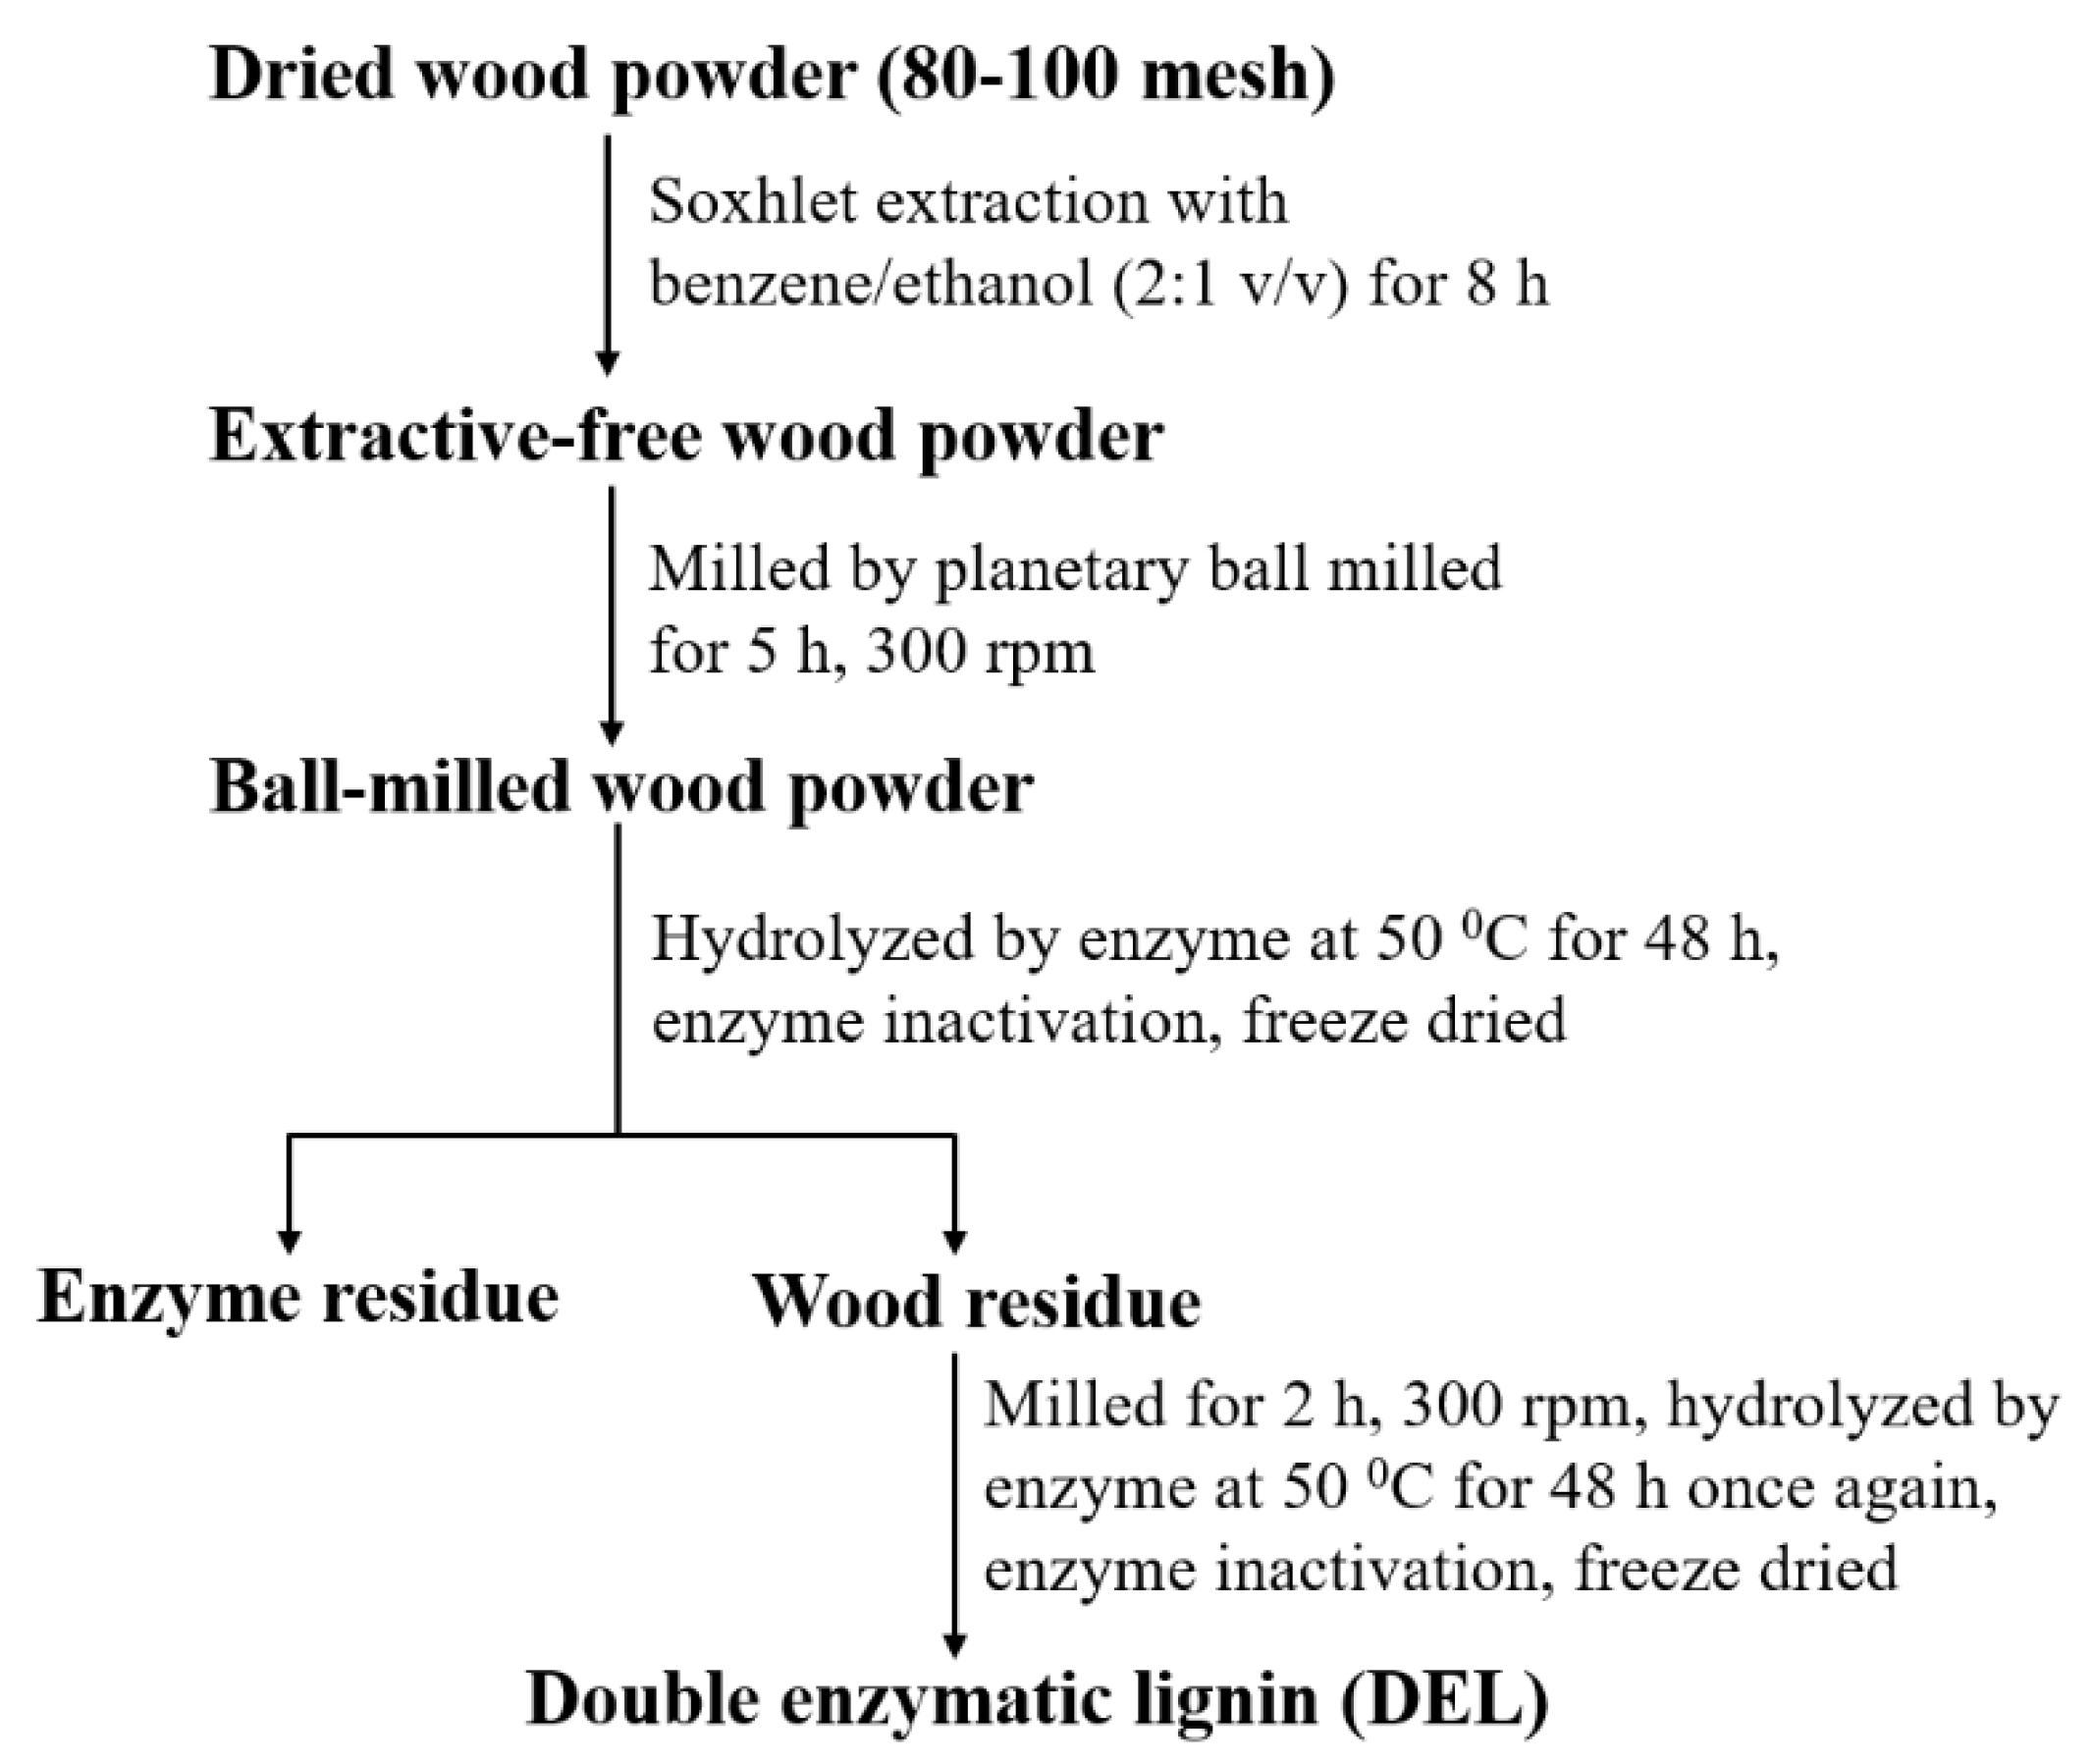
2.2. Lignin Isolation

As shown in Figure 1, the process of isolating DEL was modified based on a method described in the literature [15]. First, wood powder (80–100 mesh) from Chinese fir and birch was dried at 80 °C for at least 5 h to a constant weight. Then, the dried wood powder was extracted with a benzene alcohol mixture (benzene/alcohol = 2:1, v/v) at 97 °C for 8 h using a Soxhlet extractor to remove the extractives. After that, the extracted wood powder was air-dried overnight, followed by vacuum drying for 3 h at 80 °C. The extracted and dried wood powder was ground in a planetary ball mill at a grinding frequency of 300 rpm for an effective grinding time of 5 h. To prevent the oxidation of raw materials during ball milling, the ball mill was set to mill for 10 min and pause for 10 min. The first ball-milled wood powder samples were mixed with acetic acid buffer (pH = 4.8) at a solid-to-solution ratio of 1:20 (g/mL) to obtain a uniform solution, and liquid cellulose complex enzyme (Cellic CTec3, 100 FPU/mL) was added to form a mixed solution with a solid-to-solution ratio of 2:1 (g/mL). The mixed solution was transferred to a conical flask and placed in a shaker at 50 °C to react for 48 h. After the enzymatic hydrolysis was complete, the flask containing the mixed solution was immersed in boiling water for 10 min to inactivate the cellulose complex enzyme, then cooled to room temperature. After cooling, the sample residue was phase-separated with deactivated cellulose complex enzyme, the upper deactivated enzyme was removed, and the sample residue was washed with a large amount of distilled water, centrifuged, and freeze-dried. The enzymolysis residue after lyophilization was ball milled again, and the enzymatic hydrolysis steps above were repeated, with the effective ball milling time changed to 4 h. Finally, double enzymatic lignin was obtained after another round of lyophilization.

2.3. Fourier-Transform Infrared Spectroscopy

The chemical structure of DEL was analyzed using Fourier transform infrared spectroscopy (FTIR). The infrared spectra of lignin were obtained using the potassium bromide tablet method. The spectra in the range of 400–4000 cm−1 were scanned with a resolution of 4 cm−1, and each spectrum was scanned 36 times using a Nicolet iS20 FTIR spectrometer (Thermo Fisher Scientific Corporation, Waltham, MA, USA).

2.4. Quantitative 2D-Heteronuclear Single Quantum Coherence (2D-HSQC) NMR Spectroscopy

Approximately 50 mg DEL was dissolved in 0.5 mL DMSO-d6 (99.8% D), and 2D-HSQC experiments were performed using the Bruker standard pulse program [16,22]. The spectral widths of the 1H- and 13C-dimensions were 5000 and 20,000 Hz, respectively. The number of complex points collected was 1024 for the 1H dimension, with a loop latency of 1.5 s. The number of transients was 64 recording 256-time increments in the 13C dimension. Before the Fourier transform, the data matrix was filled to zero at 1024 points in the 13C dimension.

2.5. Heat Flow and Specific Heat Capacity Test

Following the international standard ISO 11357-2:2013 and ASTM E1269-11, the heat flow and specific heat capacity of the DEL samples were measured under a nitrogen atmosphere using differential scanning calorimetry (TA Q2000, New Castle, DE, USA). The DEL was pressed into a bulk solid with a length and width of 3 mm, and a thickness of 2 mm under 30 MPa for 15 min before the test. The samples were heated from −20 °C to 220 °C at a heating rate of 20 °C/min, and the experiment was repeated at least twice, with consistent results. The value of specific heat capacity in the temperature range of 20−120 °C was fitted using linear equations.

2.6. Thermal Conductivity Test

Following the international standard ISO 22007-2, the thermal conductivities of DEL were measured at 20, 40, 60, 80, 100, and 120 °C with a hot disk meter (TPS 2500S, Gothenburg, Sweden). The thermal conductivities of the samples were measured directly by hot disk according to the transient plane heat source method. During the test, the sample was protected by nitrogen gas. The DEL was pressed into a solid disk with a diameter of 13 mm, a thickness of 3 mm, and a density of 1.31 g/cm3 under 30 MPa. The value of the thermal conductivity in the temperature range of 20–120 °C was fitted using linear equations.

2.7. Thermogravimetric Test

The thermal stabilities of DEL were studied using thermogravimetric analysis (TA Q600, New Castle, DE, USA) in a nitrogen atmosphere. The samples (~7 mg) were heated from room temperature to 750 °C at a heating rate of 20 °C/min. The weight loss below 100 °C was set to zero mass loss to eliminate the influence of any moisture when investigating the thermal stability of the material. Each experiment was performed at least twice to ensure the repeatability and accuracy of the experiment.

2.8. Calculation and Simulation of Thermal Degradation Kinetic Parameters

The thermal degradation kinetic parameters (activation energy and pre-exponential factor) of Chinese fir DEL and birch DEL were calculated using the Flynn–Wall–Ozawa [23,24] and Friedman methods [25]; these two methods were embedded in self-developed software. This software can calculate the changing values of Ea and ln(A) over conversion rate with a high accuracy and a conversion rate interval of 0.01, and it is freely available online [26]. The optimal kinetic mechanism function (ƒ(α)) of thermal degradation was selected by comparing the value of the Coats–Redfern integral equation [27] and the Achar–Bridly–Sharp differential equation [28]. The samples (~7 mg) were heated from room temperature to 750 °C at heating rates of 5, 10, 15, 20, and 25 °C/min to obtain thermal degradation kinetic parameters. The values of Ea and ln(A) were fitted piecewise using linear or quadratic equations.

3. Results and Discussion
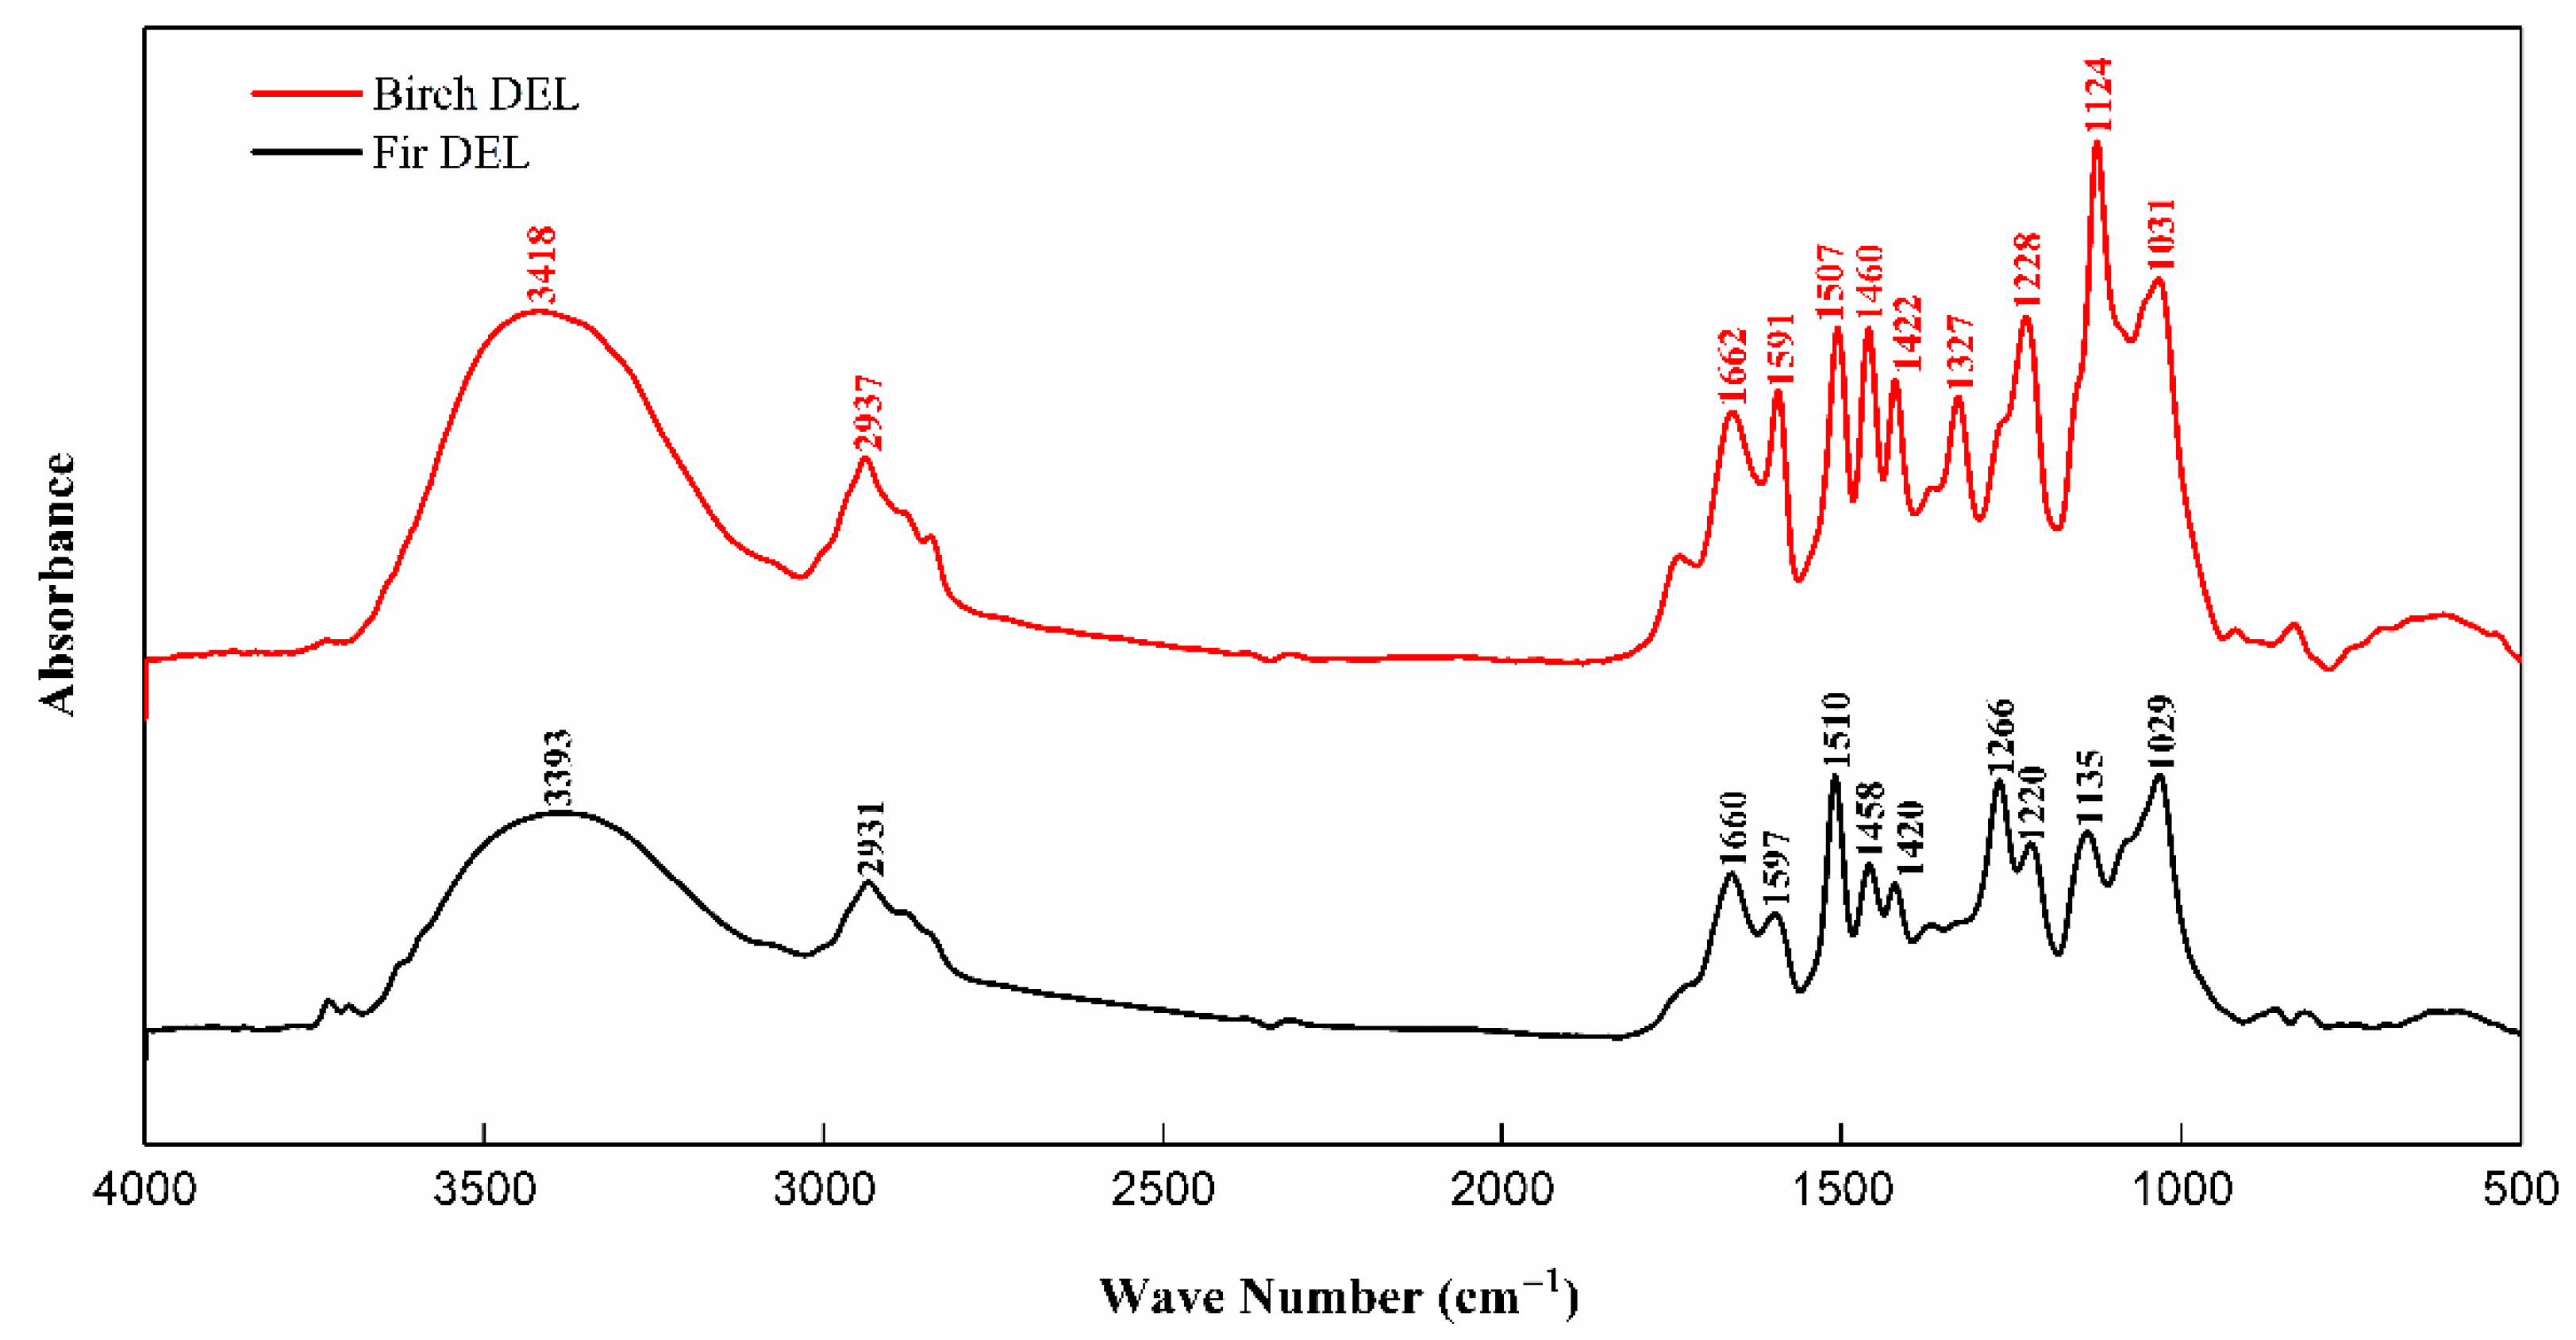
3.1. FTIR Analysis

Lignin has three alcohol monomer precursors: p-coumarol, coniferyl alcohol, and sinapyl alcohol. These three monomers form structural units in lignin macromolecules through polymerization: p-hydroxyphenyl (H), guaiac group (G), and syringyl (S), which are rich in aromatic ring structures, aliphatic and aromatic hydroxyl groups, and quinone groups and other active groups; these characteristic groups will show clear characteristic peaks in the infrared spectrum, which can used to characterize lignin. FTIR spectroscopy is an important tool for structural characterization between hardwood and softwood lignin samples.
Figure 2 shows the FTIR characteristic peaks of Chinese fir DEL and white birch DEL. The assignments of the characteristic infrared absorption peaks of Chinese fir and birch DEL are shown in Table 1. The infrared spectrum of DEL had clear characteristic peaks at 1600–1590 cm−1 and 1510–1505 cm−1, which were attributed to the skeleton vibration of aromatic rings [29]. The characteristic peaks at 1660–1665 cm−1 and 1455–1465 cm−1 were conjugated carbonyl group and C-H bending vibrations of methyl and methylene groups, respectively [30]. All these peaks are characteristic peaks of lignin.
Compared with Chinese fir DEL, birch DEL showed the typical characteristics of hardwood lignin, with a strong maximum absorption peak at 1124 cm−1, which is a vibrational peak of syringyl units (S) [31]. Chinese fir DEL showed a vibrational peak associated with guaiacol structural units (G) at 1266 cm−1 [32]. The FTIR results indicate that Chinese fir DEL, as softwood lignin, contains G units, whereas birch DEL, as hardwood lignin, contains S units, consistent with previous research [3].

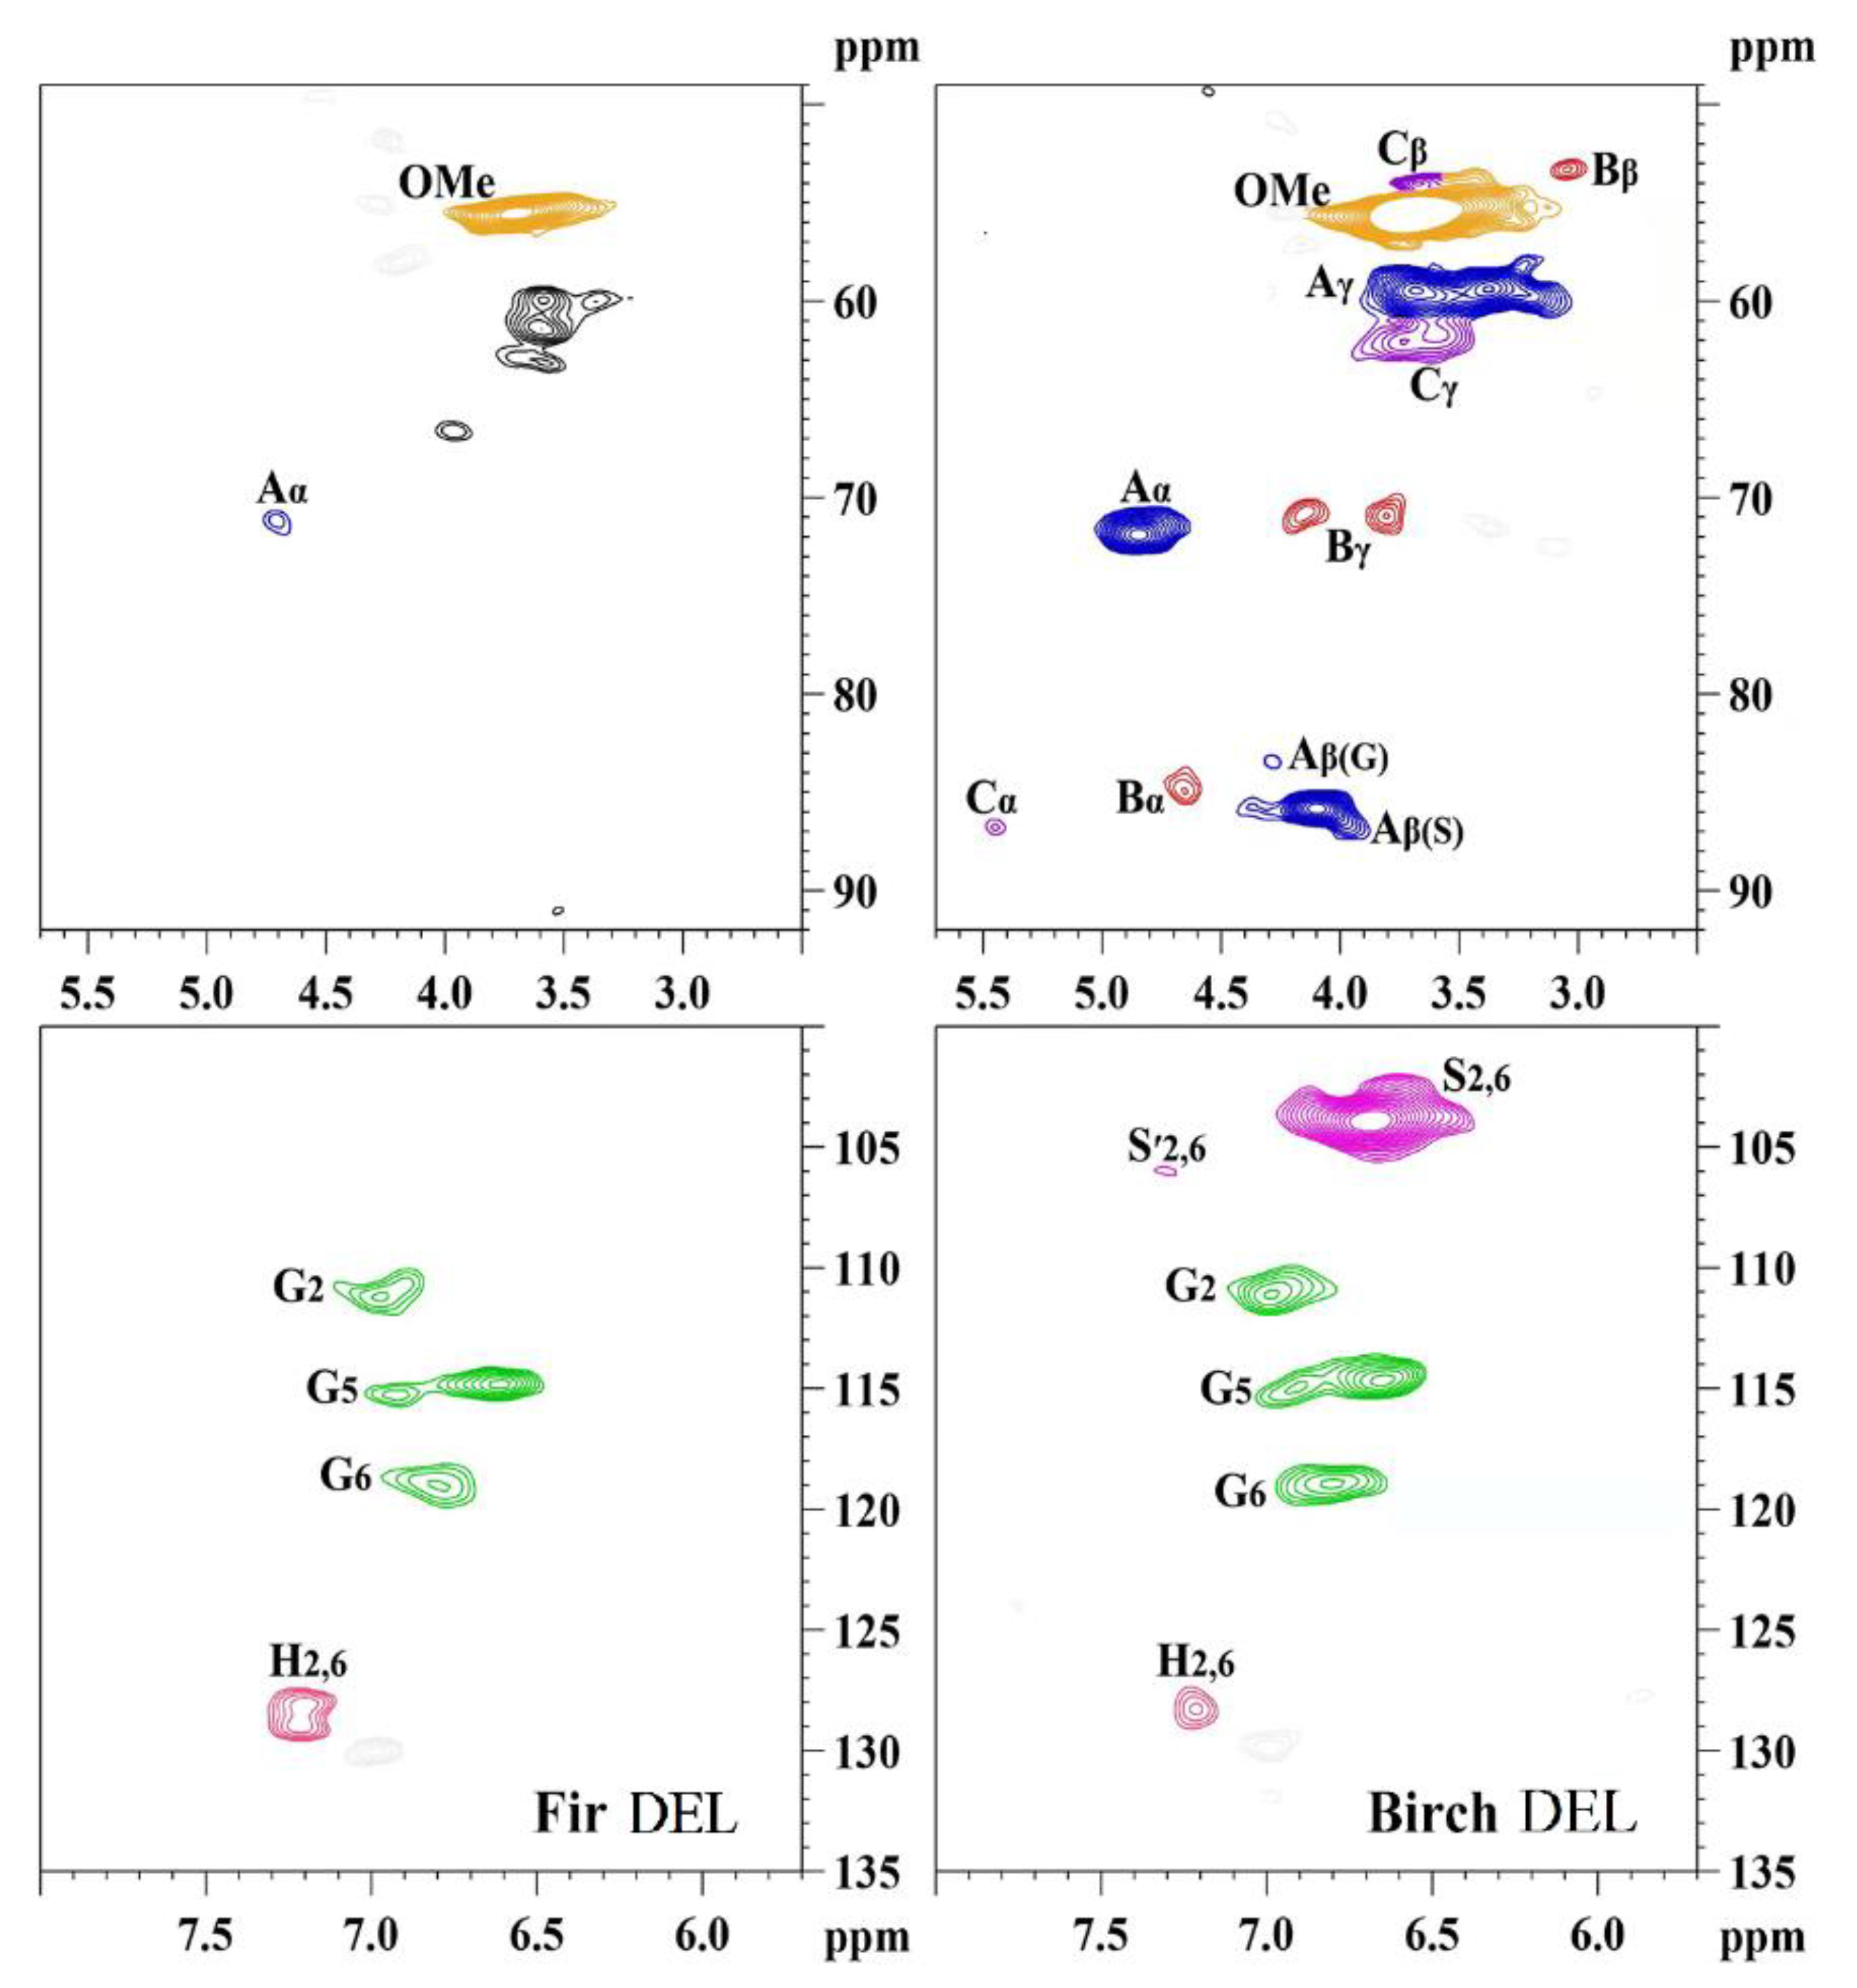
3.2. 2D-HSQC NMR Analysis

2D-HSQC NMR techniques are suitable for analyzing the detailed structural characteristics, including substructures, of isolated lignin samples [33,34], and Figure 3 shows the 2D-HSQC spectra of Chinese fir DEL and birch DEL. The two-dimensional NMR is divided into two regions, the side chain region (δCH 45–90/2.5–5.9 ppm) and the aromatic ring region/unsaturated region (δCH 100–140/6.0–7.8 ppm) [35]. In the side chain region of the 2D-HSQC spectra in Figure 3, there are clear methoxy (OMe) groups in both the Chinese fir DEL and birch DEL. However, substructures such as β-O-4 aryl ether (A), resinol (B), and phenylcoumarin (C) were more abundant in hardwood birch DEL, consistent with previous research [36].
In the aromatic ring region in Figure 3, Chinese fir DEL is mainly a guaiacol-based structure (G), whereas birch DEL is a syringyl-based (S) and guaiacol-based (G) structure. This result is consistent with the FTIR results above, and aligns with the conclusion of Kathahira et al. that softwood lignin is composed mainly of G units and hardwood lignin is composed mainly of G and S units [3]. This result also shows that DEL can be isolated from both softwood and hardwood via combining double ball-milling with the enzymatic hydrolysis of cellulose. Wang et al. [16] concluded that DEL shows the typical spectrum of natural lignin, with very little structural damage relative to in situ biomass lignin, and it can therefore be used to represent in situ lignin. In this study, the yield of Chinese fir DEL was 106.4 ± 2% and that of birch DEL was 108.3 ± 2%, and these yields are similar to previous studies [16]. Following the delignification method in Chinese national standard GBT 35818-2018, and the sugar contents of Chinese fir DEL and birch DEL were measured as 2.1 ± 3% and 1.7 ± 3%, respectively, indicating that the isolated DEL contained a very small amount of residual cellulose and hemicellulose, and that this had little effect on the DEL thermal properties.

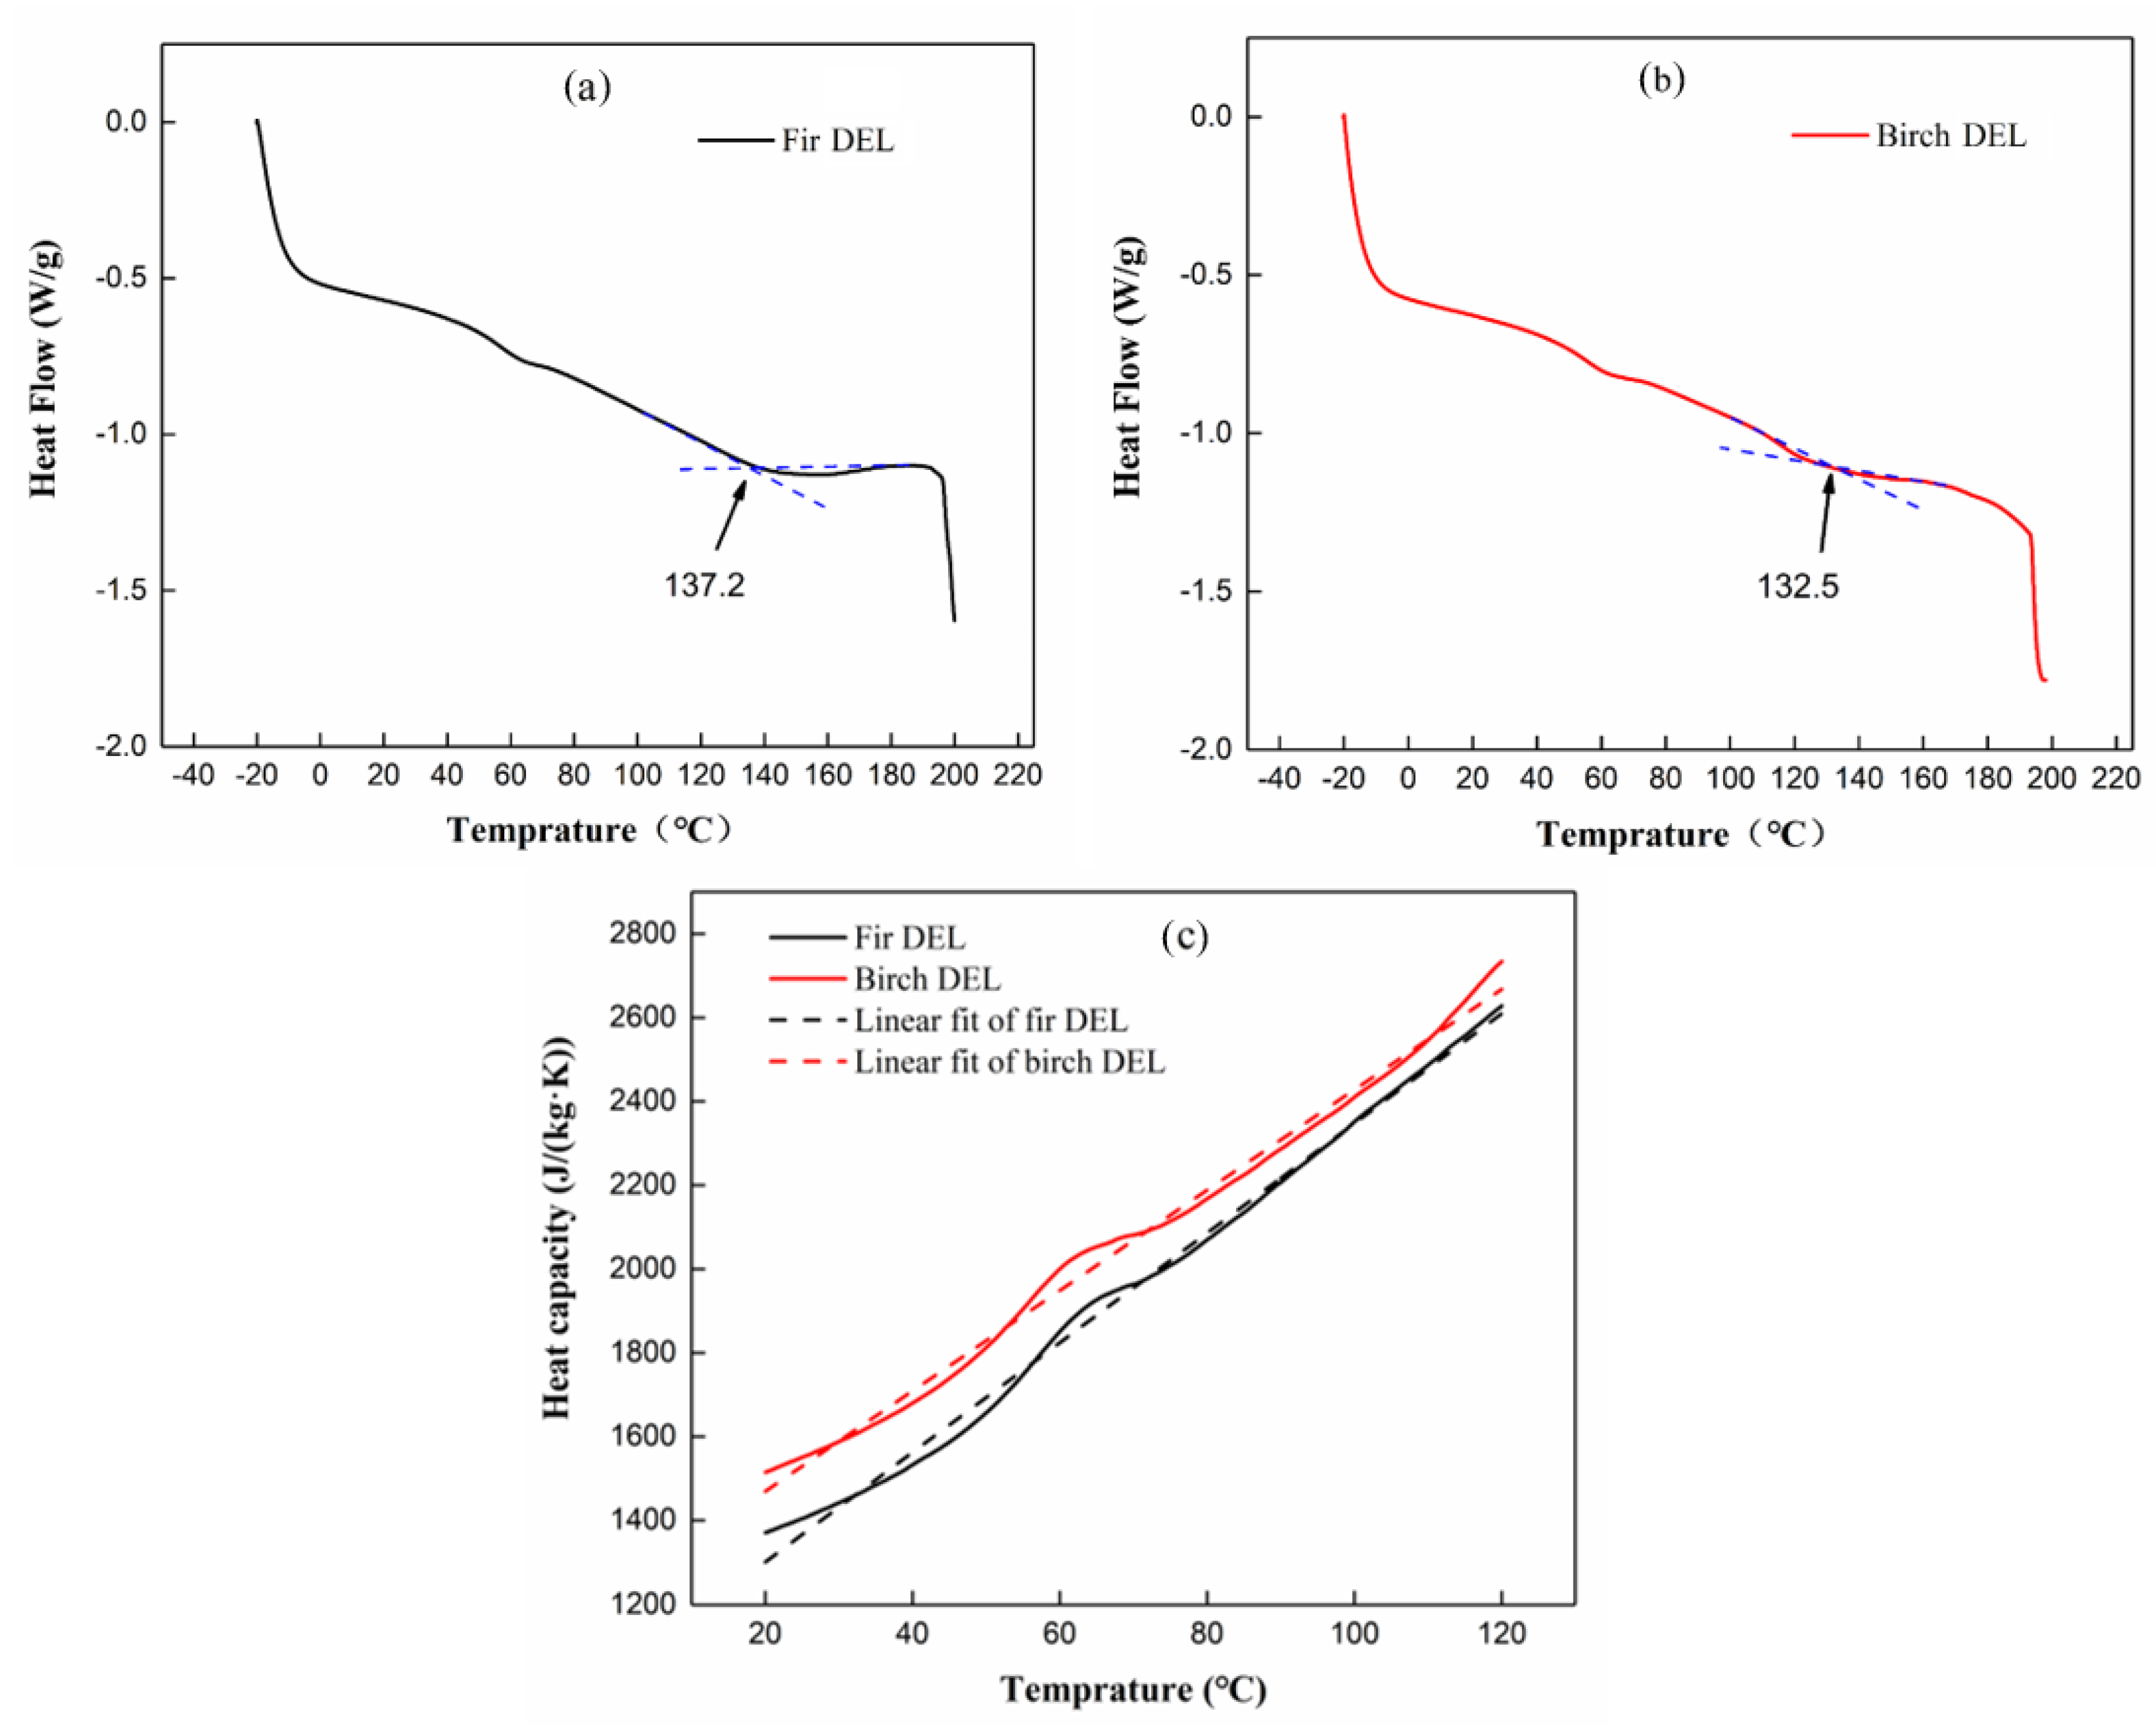
3.3. Glass Transition Temperature and Heat Capacity Analysis

Figure 4a,b show the heat flow of DEL. The glass transition temperatures (Tg) of Chinese fir DEL and birch DEL were 137.2 °C and 132.5 °C, respectively. The Tg of lignin depends on the sample source, isolation method, molecular weight, molecular weight distribution, thermal history, and other factors. The Tg of Chinese fir DEL was higher than that of birch DEL, mainly resulting from differences in their chemical structural units. An endothermic peak appeared below 100 °C in Figure 4a,b, corresponding to the removal of moisture [37]. The Tg of kraft lignin has been reported to be in the range of 100–130 °C [38]; that of commercial alkali lignin was 158 °C, organosolv lignin was 144 °C [39], and lignin sulfate was ~135 °C [40]. These obvious differences in lignin Tg value show that lignin Tg varies with the isolation method and material source, indicating that the thermal properties of kraft lignin, alkali lignin, and organosolv lignin cannot be used to describe the thermal properties of WML, DEL, or in situ wood lignin. The advantage of preparing DEL is that sufficient lignin materials that represent in situ wood lignin are easy to obtain, enabling an investigation of its thermal properties.
Figure 4c shows the specific heat capacities (Cp) of Chinese fir DEL and birch DEL. The specific heat capacity of DEL increases almost linearly with temperature. The specific heat capacity of birch DEL is higher than that of Chinese fir DEL, which may be related to their different types of structural units. In the range of 20–120 °C, the specific heat capacity can be well fitted with linear equations as follows:
Chinese fir DEL:
Cp = 13.09 (T + 273.15) − 2536.4
R2 = 0.99
Birch DEL:
Cp = 11.98 (T + 273.15) − 2043.7
R2 = 0.99
where Cp is the specific heat capacity (J/(kg·K)) and T is the temperature (°C). Figure 4c shows that a linear equation described the relationship between DEL specific heat capacity and temperature well. At room temperature (20 °C), the specific heat capacities of Chinese fir DEL and birch DEL in this study were 1301 J/(kg·K) and 1468 J/(kg·K), respectively. The specific heat capacity of sulfuric lignin was reported to be 1542 J/(kg·K) at 25 °C [40], and that of dioxane lignin was reported to be 1342 J/(kg·K) at 52.9 °C [41]. These results show that the material source and isolation method have clear effects on specific heat capacity. Qi et al. [17] measured the specific heat capacities of cellulose and hemicellulose isolated from the same type of birch used in this study. The Cp values were 1209 J/(kg·K) for cellulose and 1305 J/(kg·K) for hemicellulose, suggesting that wood lignin may have a larger specific heat capacity than wood cellulose and hemicellulose. This speculation should be further verified via a comparison of the Cp of chemical components in wood from various species.

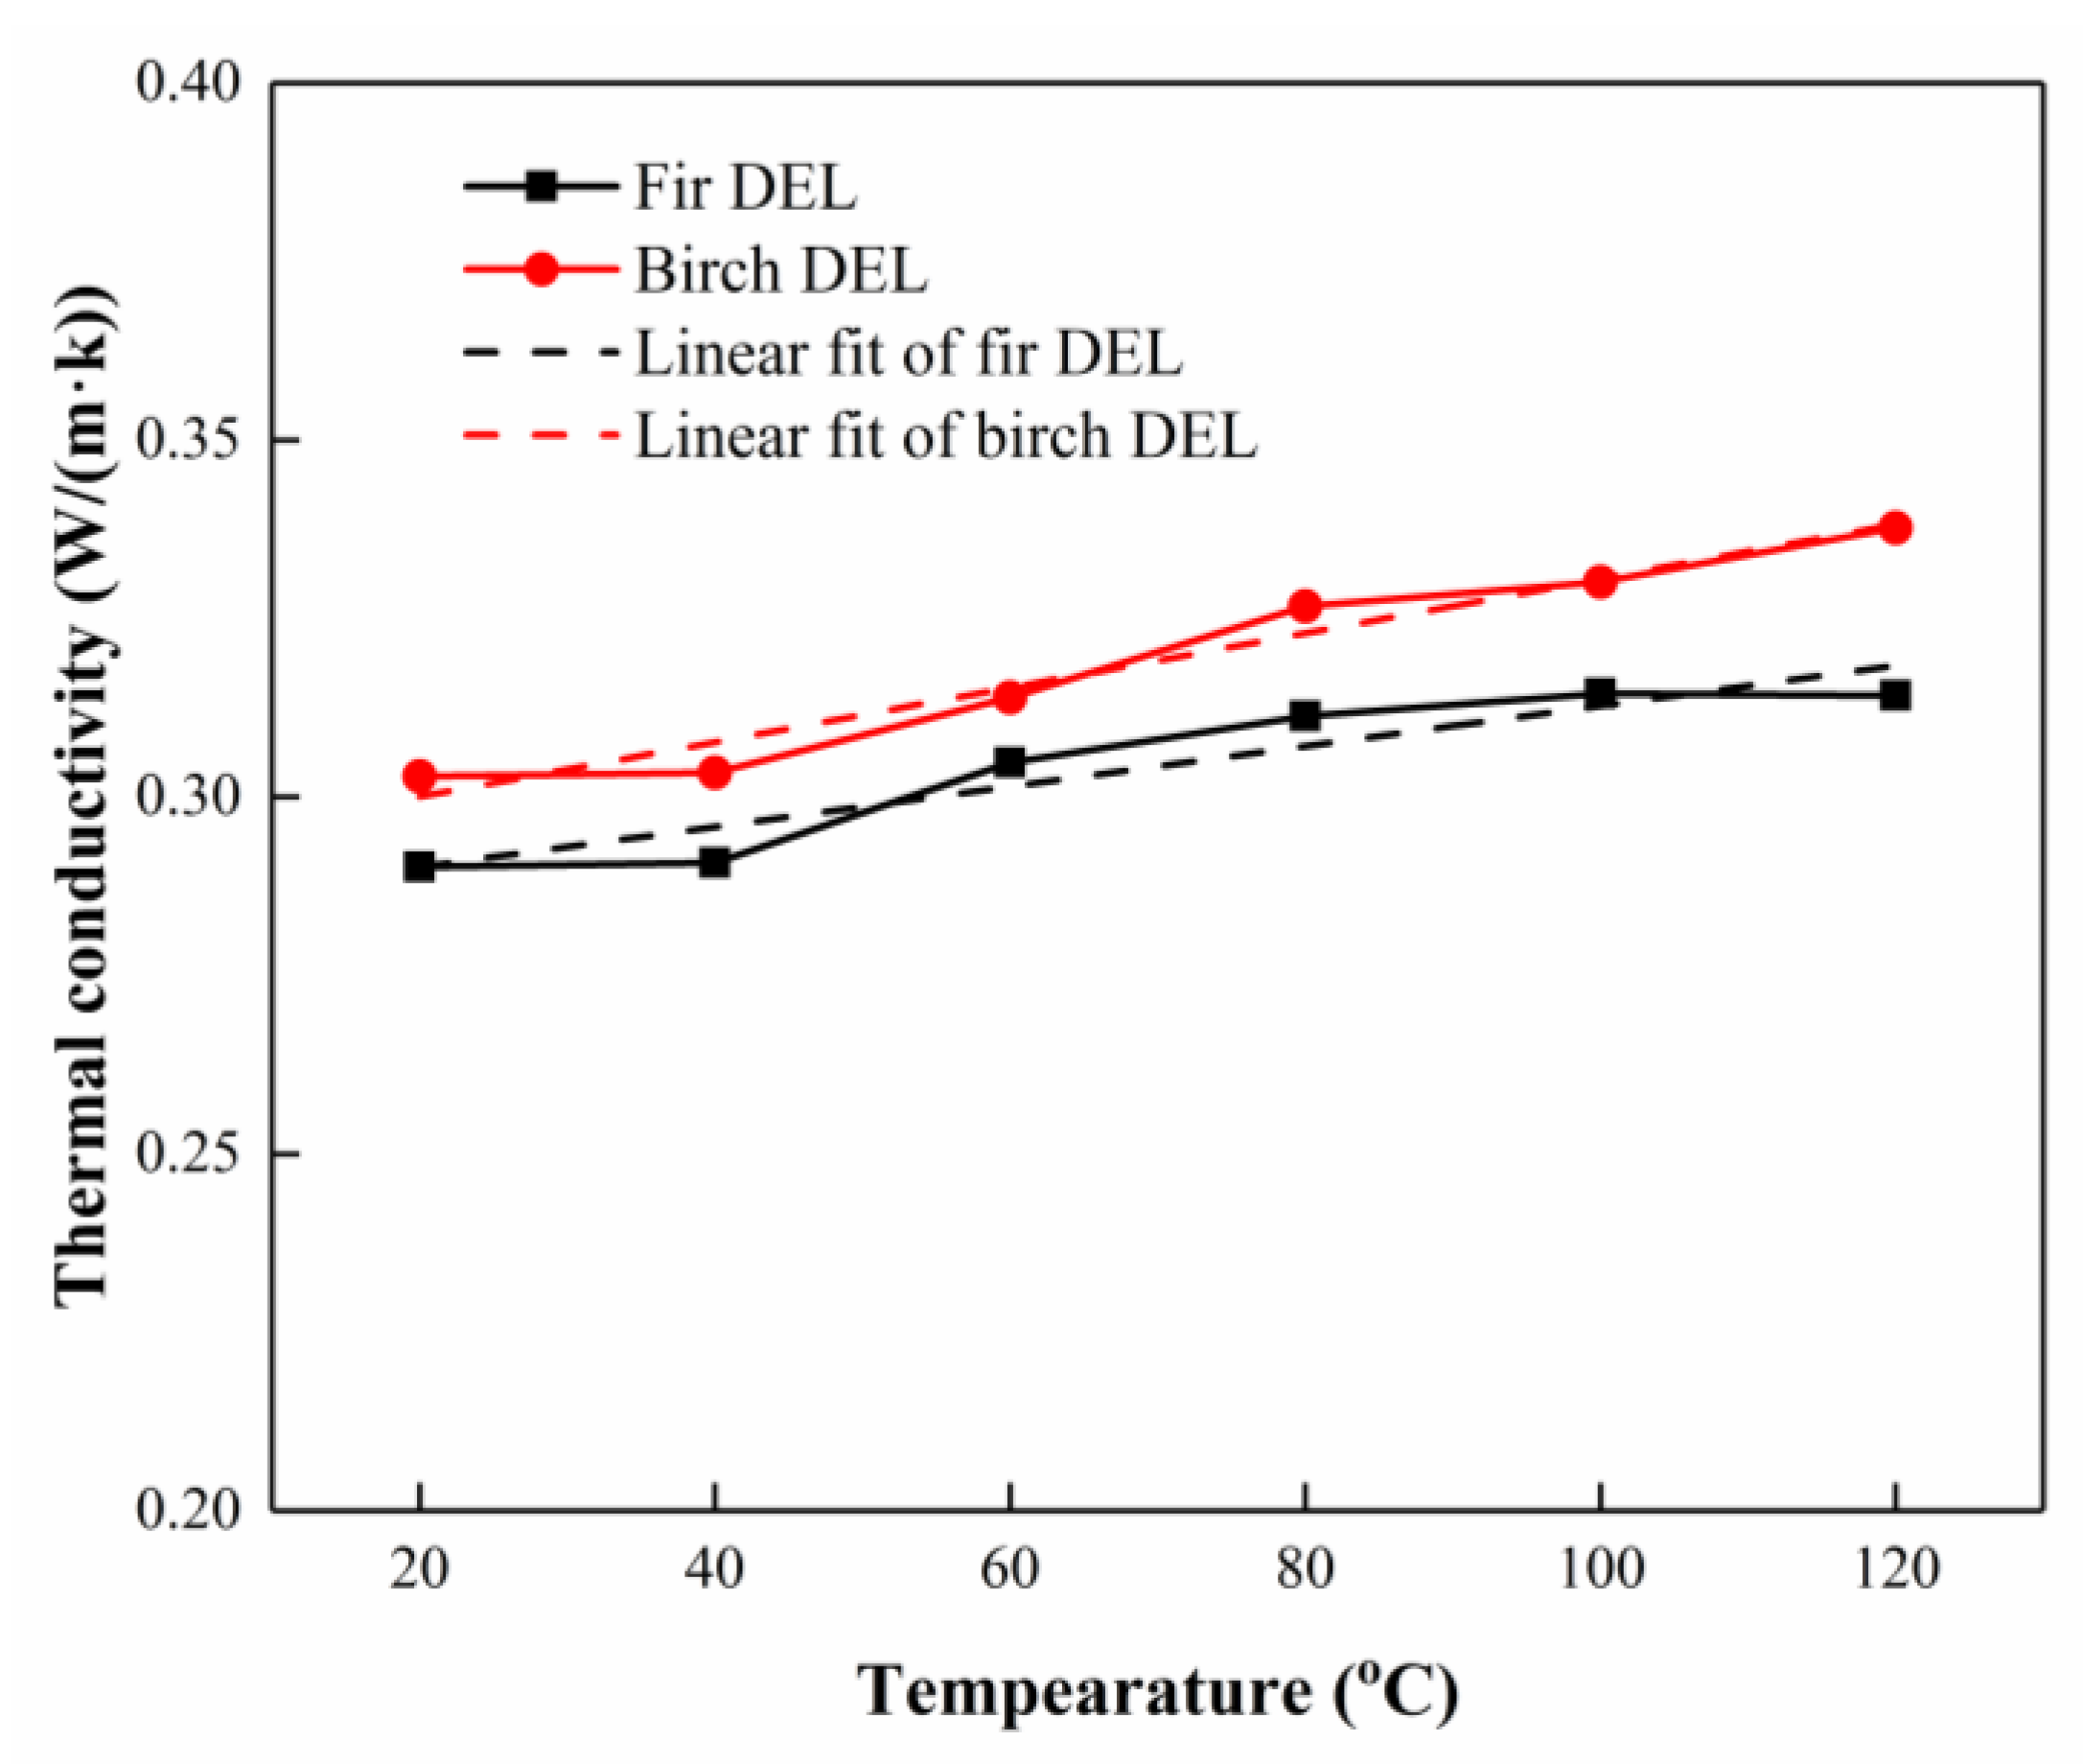
3.4. Thermal Conductivity Analysis

Figure 5 describes the thermal conductivity (λ) of Chinese fir DEL and birch DEL. In general, the thermal conductivity of lignin increases with temperature. It is difficult to test the thermal conductivity of DEL above 120 °C, as it becomes soft and cracks easily above the glass transition temperature. The thermal conductivity above 120 °C was therefore not investigated here. The thermal conductivity of birch DEL was slightly higher than that of Chinese fir DEL, with a discrepancy within 7%. In the temperature range of 20–120 °C, the thermal conductivity can be well fitted with linear equations as follows:
Chinese fir lignin:
λ = 0.0003T + 0.285
R2 = 0.88
Birch lignin:
λ = 0.0004T + 0.292
R2 = 0.96
where λ is the thermal conductivity (W/(m·K)) and T is the temperature (°C). The thermal conductivities of Chinese fir DEL and birch DEL at 20 °C were 0.29 W/(m·K) and 0.30 W/(m·K), respectively, and the thermal conductivities of these two DELs were therefore very close. The average thermal conductivity of Chinese fir DEL in the range of 20–120 °C was 0.30 W/(m·K) with a coefficient of variance (COV) of 3.7%; these values were 0.32 W/(m·K) and 4.6% for birch DEL. The thermal conductivity of lignin is rarely reported in the literature. Qi et al. [17] reported the thermal conductivities of birch cellulose and hemicellulose at 20 °C to be 0.24 W/(m·K) and 0.38 W/(m·K), respectively. Therefore, the thermal conductivity of lignin measured here fell between that of cellulose and hemicellulose.

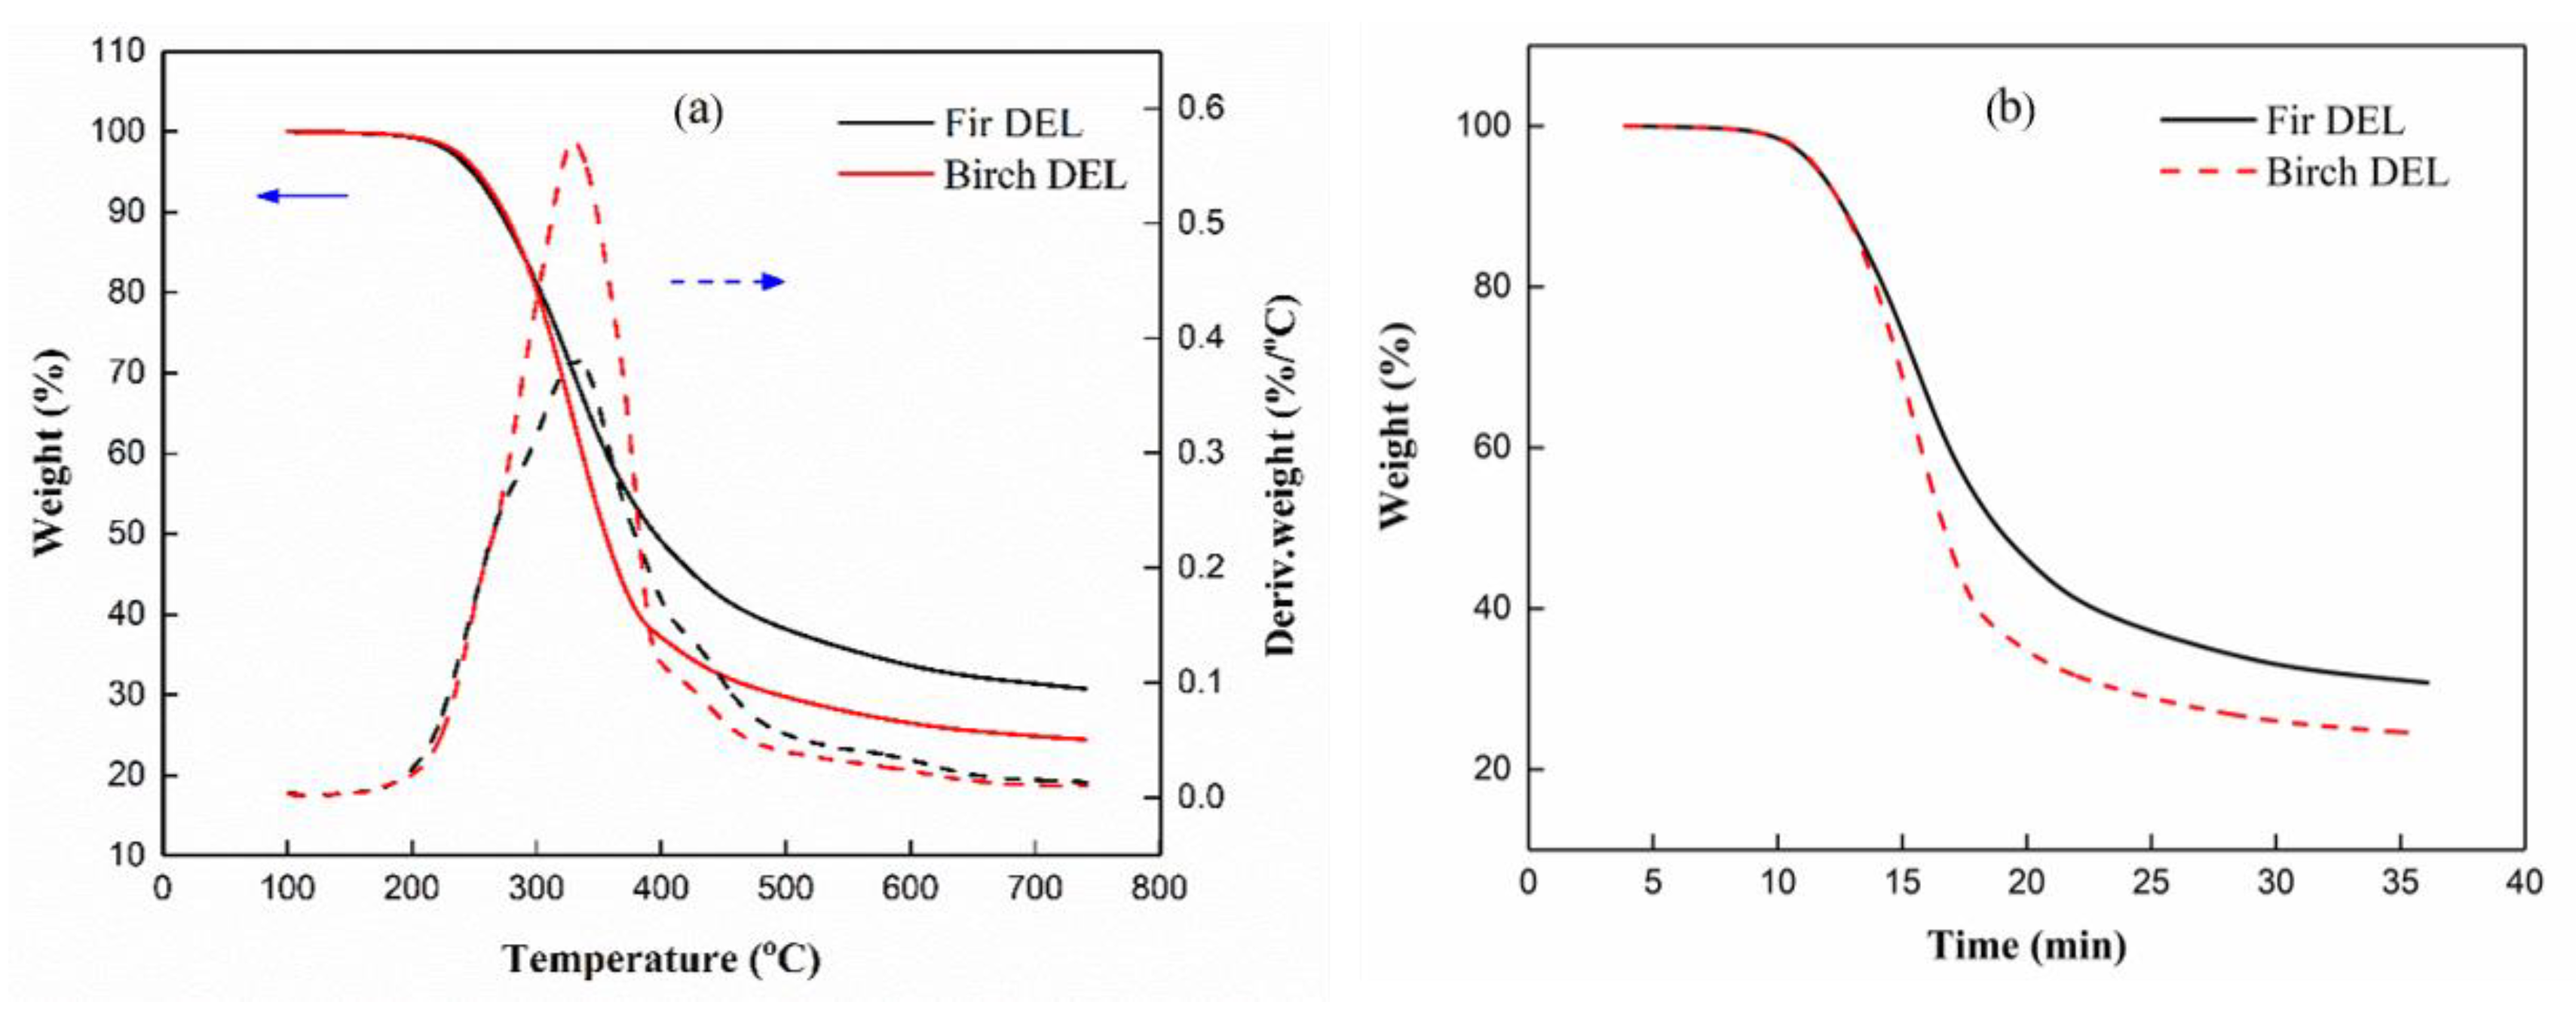
3.5. Thermal Stability Analysis

Figure 6 compares the thermal stabilities of Chinese fir DEL and birch DEL at a heating rate of 20 °C/min (Figure 6a) and at 750 °C for 30 min (Figure 6b). Chinese fir DEL had a derivative thermogravimetry (DTG) maximum peak at 332 °C, with a small shoulder peak at 435 °C, and birch DEL had a DTG maximum peak at 331 °C, with a small shoulder peak at 425 °C. The thermal degradation peak temperature was much lower than the reported DTG peak for kraft lignin at 380 °C [38]. It is reported in the literature that MWL achieves a maximum weight loss rate at 365 °C and it has a shoulder peak at 433 °C [42], and therefore, DEL has a lower DTG peak temperature than kraft lignin and MWL. The DEL began to thermally degrade at approximately 150 °C, with a very small amount (0.7%) of degradation below 200 °C, and dehydration, demethoxylation, demethylation, and decarboxylation reactions occur between the terminal groups and the branches during this stage. In the following active pyrolysis stage at 200–450 °C, the most important, poorly thermally stable β-O-4 linkage was broken, and C-C bonds and C-O bonds were further broken at a higher temperature. Above 450 °C, the material mainly exhibited a slow decomposition and carbonization of DEL primary products and residues [11].
After heating at 750 °C for 30 min, the carbon residues of Chinese fir DEL and birch DEL were 30.8% and 24.5%, respectively. Both Figure 6a,b show that Chinese fir DEL had better thermal stability than birch DEL, especially at high temperatures. This may be due to the different molecular structural units of softwood and hardwood lignin. The carbon residues of commercial alkali lignin and organic solvent lignin were reported to be 52% and 36%, respectively [39], and therefore, DEL had a much lower amount of carbon residue than these lignins.

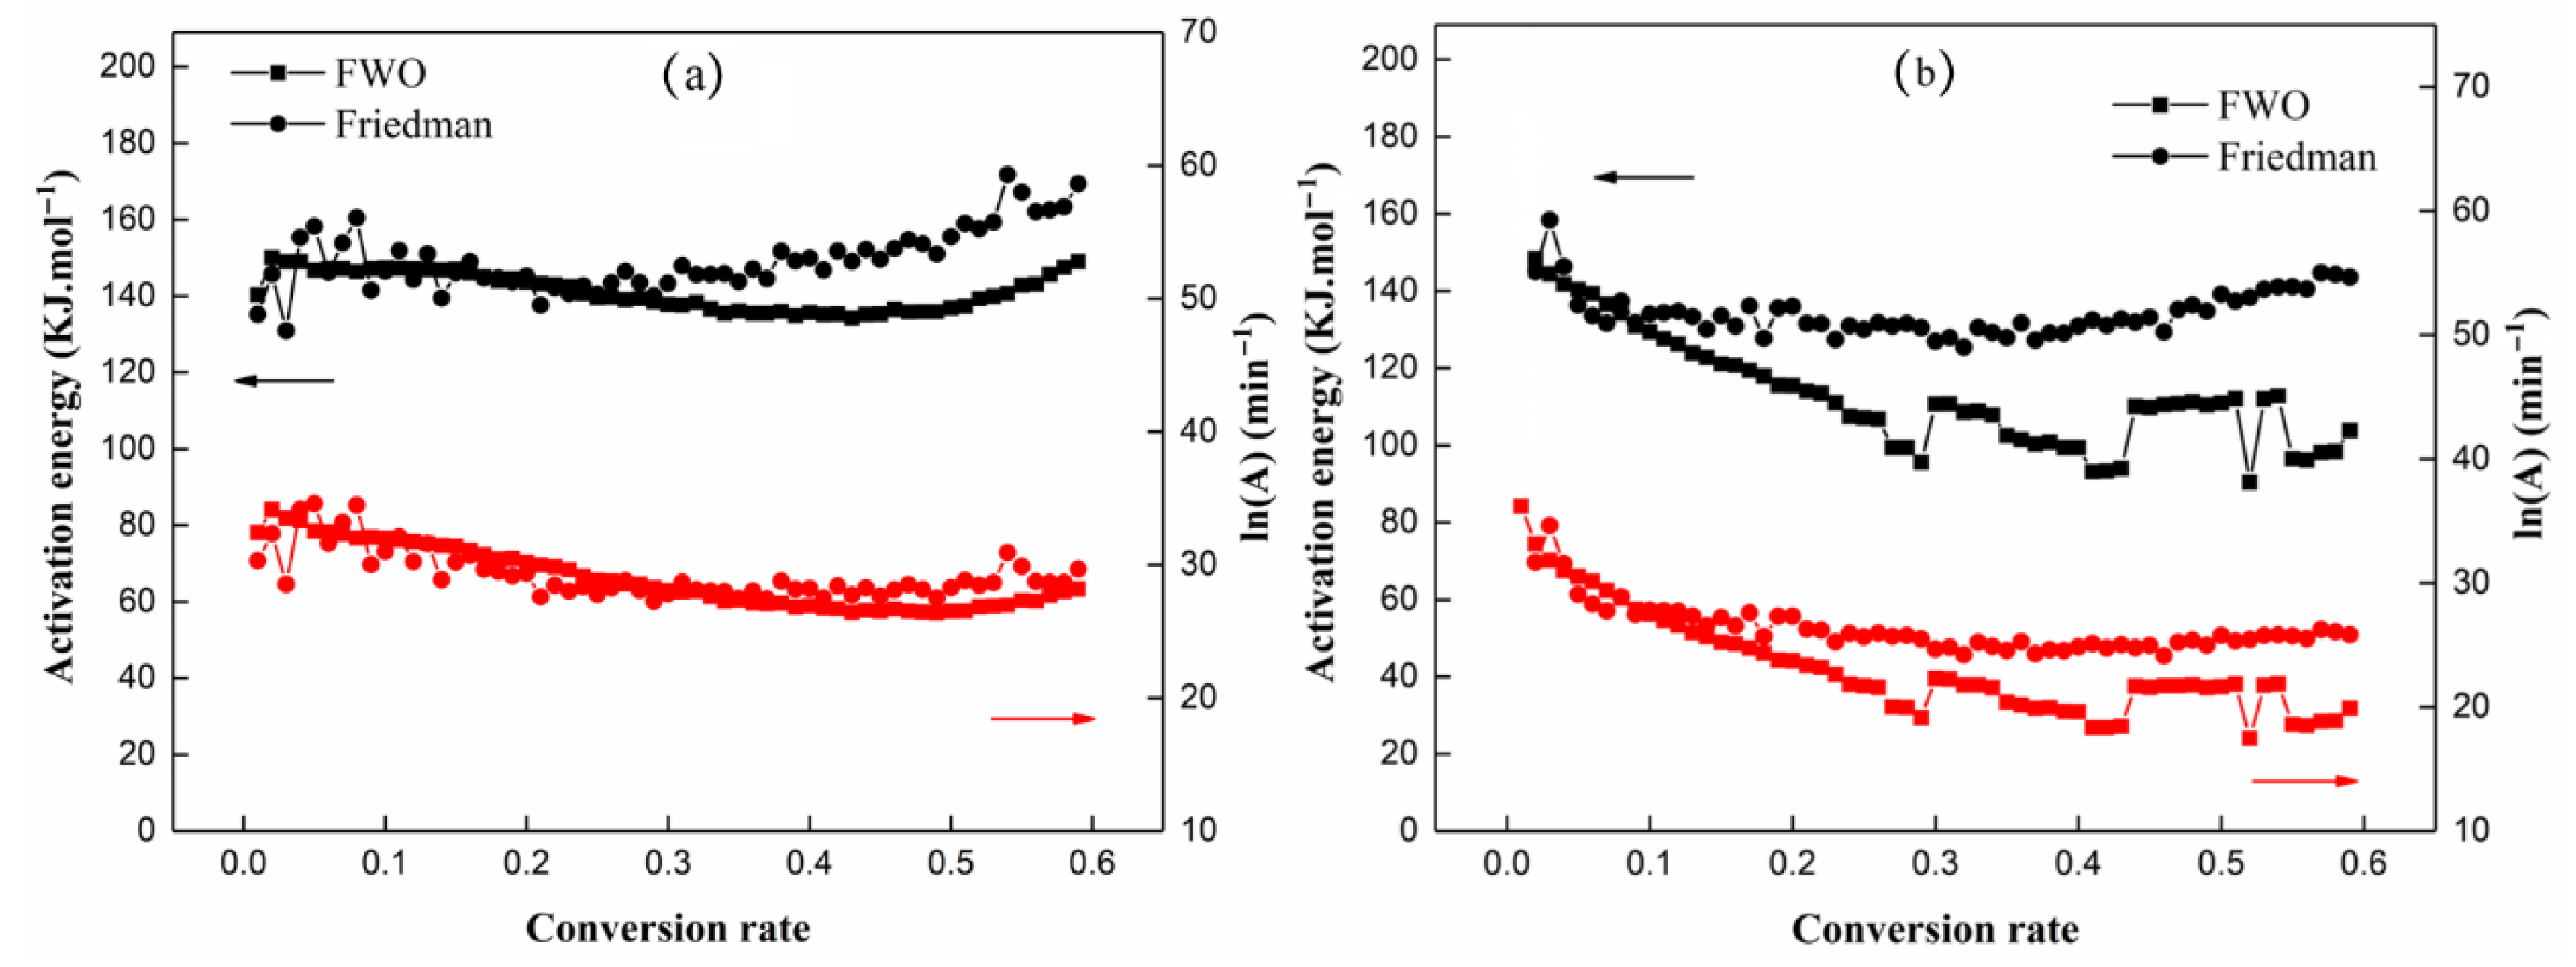
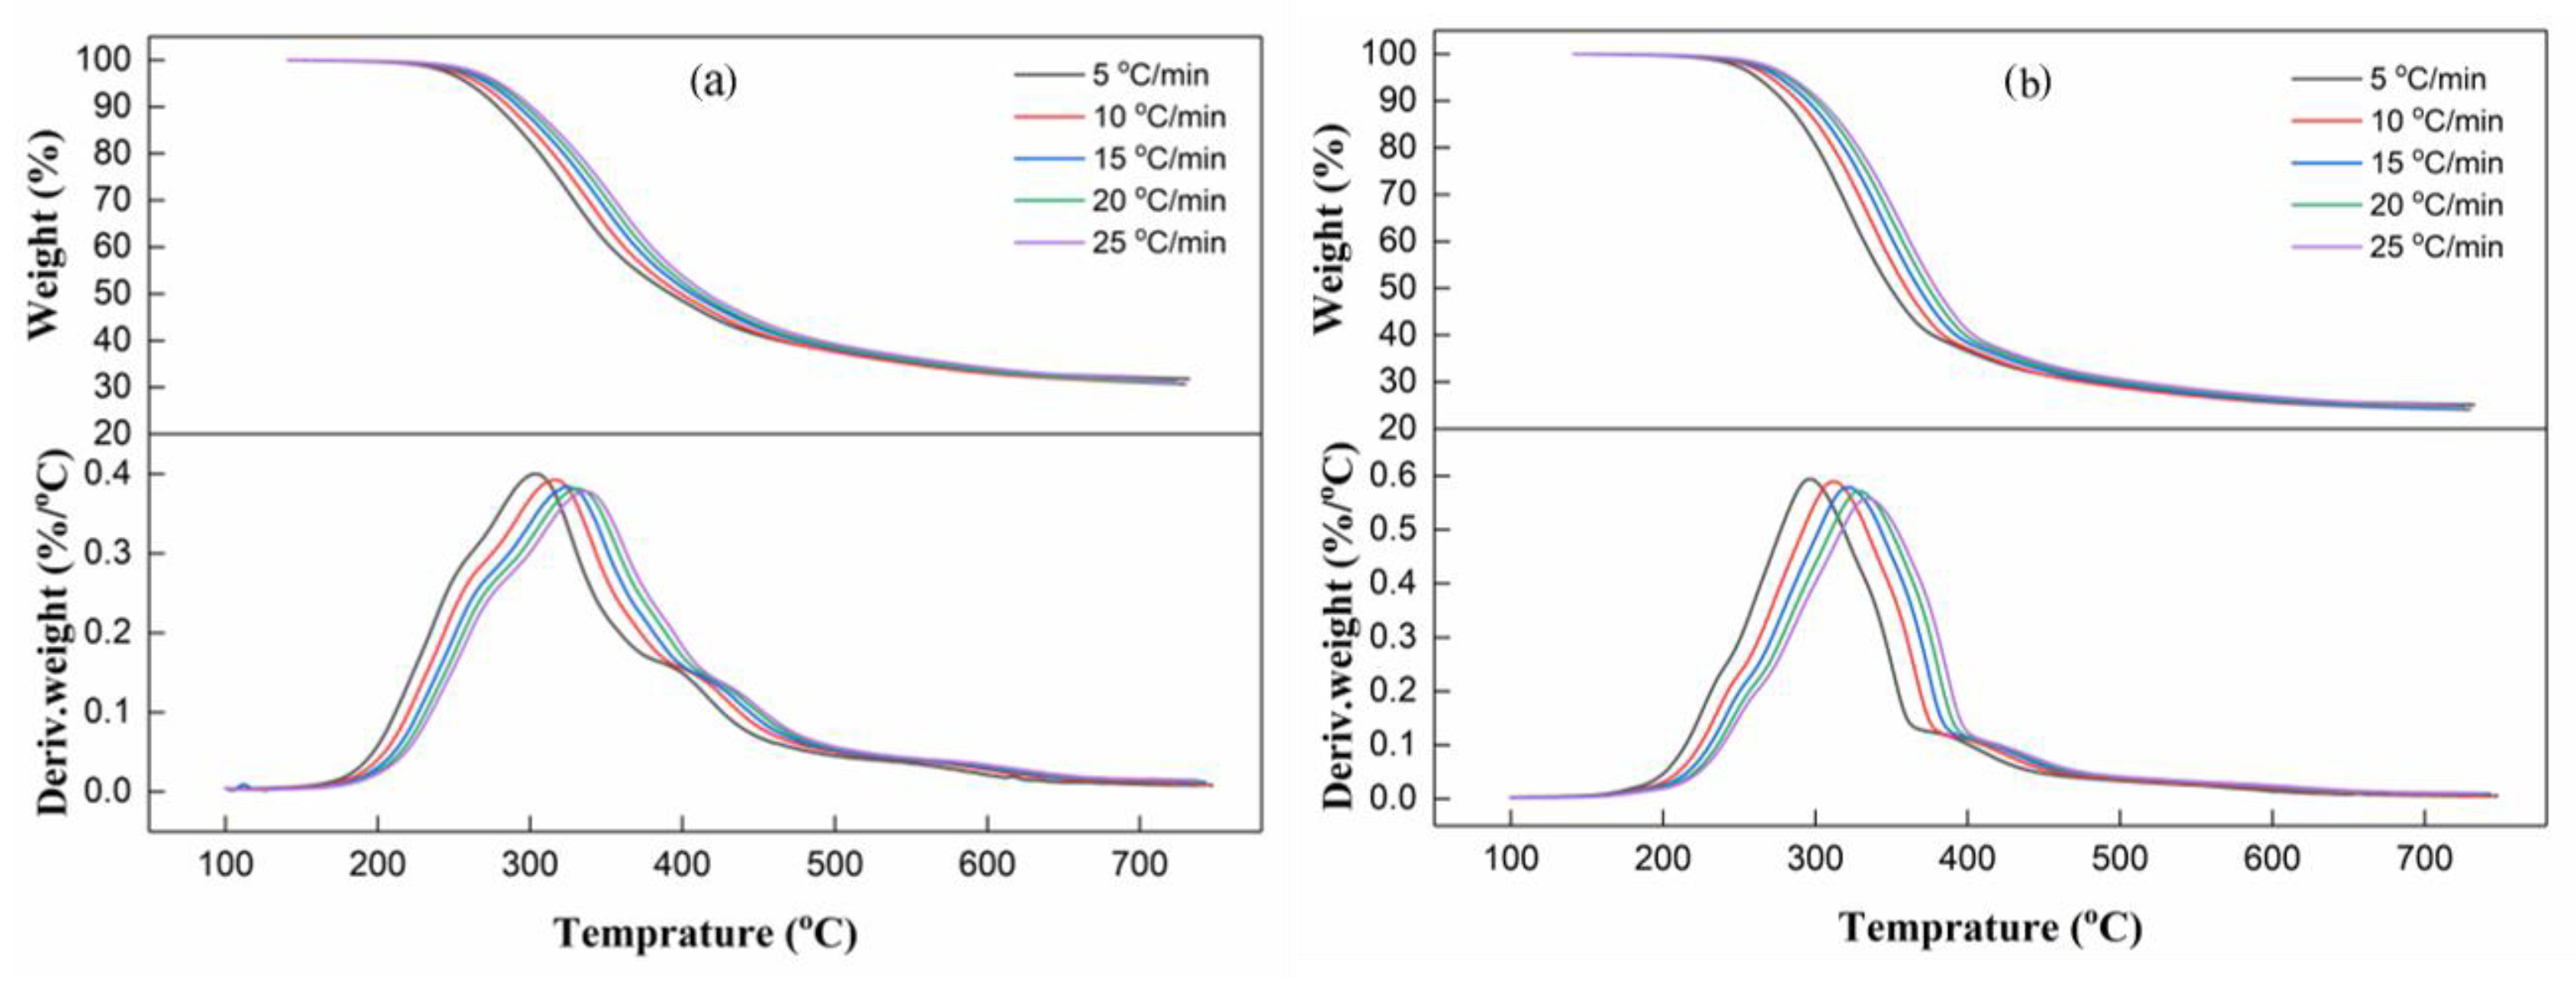
3.6. Thermal Degradation Kinetics

Thermogravimetric analysis (TG) and DTG curves of Chinese fir DEL and birch DEL at different heating rates were measured and are shown in Figure 7a,b. All TG and DTG curves shifted to the right with an increase in heating rate, because at a higher heating rate, the heat transfer from the sample surface to the core requires more time. This phenomenon is described as the temperature lag phenomenon.
The Ea and ln(A) of Chinese fir DEL and birch DEL were calculated using our own in-house software with a conversion rate interval of 0.01, which improved the calculation accuracy and efficiency, as shown in Figure 8. The activation energy and pre-exponential factor calculated using the FWO method were similar to but different from those measured using the Friedman method. The results of the FWO method were much smoother than those of the Friedman method, especially at a low conversion rate. The FWO method is an integral method that calculates the activation energy without knowing the kinetic mechanism function. By contrast, the Friedman method is a different method, and f(α) must first be set in order to obtain Ea. At the same time, the data approximation also causes the results to be unstable and fluctuate greatly [17]. Therefore, we used only the FWO method to fit Ea and ln(A) for further analysis and simulation.
Based on the changing trend of activation energy and the pre-exponential factor, the conversion rates of Chinese fir lignin and birch lignin were divided into three stages: 0.02–0.15, 0.16–0.45, and 0.46–0.60. Conversion rates above 0.6 correspond to sample temperatures above 350 °C, far above general application temperatures, and the thermal degradation kinetic parameters at conversion rates above 0.6 were therefore not investigated in this study. Figure 8a,b show the Ea and ln(A) results for Chinese fir DEL and birch DEL. Both Ea and ln(A) first decreased with increasing conversion rate and then slightly increased above a conversion rate of 0.45. An inflection point appeared at a conversion rate of approximately 0.45, indicating that the thermal degradation of small molecular weight components in Chinese fir DEL was completed at this point. In the conversion rate range of 0.02–0.60, the Ea values of Chinese fir DEL and birch DEL were in the range of 134–150 and 90–148 kJ/mol, with averages of 141.3 and 112.7 kJ/mol, respectively, and the ln(A) values were in the range of 26–34 and 17–33 min−1, with averages of 29.0 and 22.9 min−1. Table 2 lists the average Ea and ln(A) values in the conversion rate range of 0.02–0.15, 0.16–0.45, and 0.45–0.60. Both Ea and ln(A) values of Chinese fir DEL were higher than those of birch DEL. Activation energies have been reported to be 128 kJ/mol for alkaline lignin [43], 144.2 kJ/mol for hardwood organosolv lignin, 151.1 kJ/mol for hardwood klason lignin [44], and 148.7 kJ/mol for lauan WML [42]. ln(A) has been reported to be 25.68 min−1 for hardwood organosolv lignin, and 26.80 min−1 for hardwood klason lignin [44]. These obvious disparities in Ea and ln(A) among lignin types indicate that these properties are affected by lignin isolation methods and materials sources. In addition, hardwood lignin has different thermal degradation kinetic parameters than softwood lignin.
It should be noted that both Ea and ln(A) change with conversion rate, as the material is transformed by lignin dehydration, demethoxylation, demethylation, and decarboxylation reactions during the thermal degradation process. Therefore, a fixed Ea and ln(A) throughout the entire thermal degradation process oversimplifies the actual facts. Linear or quadratic equations can accurately reflect the changing trends in DEL activation energy and pre-exponential factor, and Table 1 list the simulation results. Quadratic equations were used to simulate the relationships of Ea and ln(A), with a conversion rate (α) in the α range of 0.02–0.60 as follows:
Chinese fir lignin:
Ea = 127.1α2 − 95.1α + 154.9
R2 = 0.78
ln(A) = −12.3α + 32.7
R2 = 0.83
Birch lignin:
Ea = 258.7α2 − 224.2α + 149.8
R2 = 0.80
ln(A) = 64.9α2 − 58.6α + 33.0
R2 = 0.90
For the mechanism function, a second-order reaction function produced the best fit for the thermal degradation of DEL to obtain the minimum numerical difference between the Coats–Redfern integral equation and the Achar–Bridly–Sharp differential equation. Its expression is as follows:
f(α) = (1 − α)2

4. Conclusions

High yields of double enzymatic lignin were successfully isolated from the softwood Chinese fir and the hardwood white birch using a combination of double ball-milling with the enzymatic hydrolysis of cellulose. Chinese fir DEL is mainly composed of G structural units, different from the G and S units of birch DEL. Chinese fir DEL differed from birch EDL in specific heat capacity, thermal conductivity, thermal stability, and thermal degradation kinetic parameters, and these thermal properties of the DELs clearly differed from those of kraft lignin, alkaline lignin, and organosolv lignin. The glass transition temperatures of Chinese fir DEL and birch DEL were 137.2 °C and 132.5 °C, respectively. The specific heat capacities and thermal conductivities of Chinese fir DEL and birch DEL displayed linear relationships with temperature over the 20–120 °C range, and prediction equations were fitted. Chinese fir DEL had a better thermal stability and a higher number of carbon residues than birch DEL. The activation energies and pre-exponential factors of both Chinese fir DEL and birch DEL changed with conversion rate, and their prediction equations were fitted. In the future, the mechanical properties of DEL should be investigated to expand its use in the multi-scale modeling of biomass and biomass-based composites.

Author Contributions

Writing—original draft preparation, formal analysis, J.W. (Jinyue Wang); investigation, S.H. and Z.S.; investigation and methodology, J.W. (Jialong Wen); conceptualization, methodology, supervision, and writing—review and editing, C.Q. All authors have read and agreed to the published version of the manuscript.

Funding

This research was funded by the National Natural Science Foundation of China (No. 31870536 and No. 31971589).

Institutional Review Board Statement

Not applicable.

Informed Consent Statement

Not applicable.

Data Availability Statement

The data presented in this research are available on request from the corresponding author.

Acknowledgments

The authors are grateful for the financial support of the National Natural Science Foundation of China (No. 31870536 and No. 31971589).

Conflicts of Interest

The authors declare no conflict of interest.

References

  1. Ponnusamy, V.K.; Nguyen, D.D.; Dharmaraja, J.; Shobana, S.; Banu, J.R.; Saratale, R.G.; Kumar, G. A review on lignin structure, pretreatments, fermentation reactions and biorefinery potential. Bioresour. Technol. 2019, 271, 462–472. [Google Scholar] [CrossRef] [PubMed]
  2. Chio, C.; Sain, M.; Qin, W. Lignin utilization: A review of lignin depolymerization from various aspects. Renew. Sustain. Energy Rev. 2019, 107, 232–249. [Google Scholar] [CrossRef]
  3. Kathahira, R.; Elder, T.J.; Beckham, G.T. Chapter 1: A Brief Introduction to Lignin Structure. In Lignin Valorization: Emerging Approaches; 2018; pp. 1–20. Available online: https://www.srs.fs.usda.gov/pubs/ja/2018/ja_2018_elder_002.pdf (accessed on 20 May 2022). [CrossRef] [Green Version]
  4. Abdelwahab, M.A.; Jacob, S.; Misra, M.; Mohanty, A.K. Super-tough sustainable biobased composites from polylactide bioplastic and lignin for bio-elastomer application. Polymer 2021, 212, 123153. [Google Scholar] [CrossRef]
  5. Tribot, A.; Amer, G.; Alio, M.A.; de Baynast, H.; Delattre, C.; Pons, A.; Mathias, J.D.; Callois, J.M.; Vial, C.; Michaud, P.; et al. Wood-lignin: Supply, extraction processes and use as bio-based material. Eur. Polym. J. 2019, 112, 228–240. [Google Scholar] [CrossRef]
  6. Domínguez-Robles, J.; Stewart, S.A.; Rendl, A.; González, Z.; Donnelly, R.F.; Larrañeta, E. Lignin and cellulose blends as pharmaceutical excipient for tablet manufacturing via direct compression. Biomolecules 2019, 9, 423. [Google Scholar] [CrossRef] [Green Version]
  7. Lourençon, T.V.; Alakurtti, S.; Virtanen, T.; Jääskeläinen, A.S.; Liitiä, T.; Hughes, M.; Magalhães, W.L.; Muniz, G.I.; Tamminen, T. Phenol-formaldehyde resins with suitable bonding strength synthesized from “less-reactive” hardwood lignin fractions. Holzforschung 2020, 74, 175–183. [Google Scholar] [CrossRef] [Green Version]
  8. Zhao, X.; Huang, C.; Xiao, D.; Wang, P.; Luo, X.; Liu, W.; Liu, S.; Li, J.; Li, S.; Chen, Z. Melanin-inspired design: Preparing sustainable photothermal materials from lignin for energy generation. ACS Appl. Mater. Interfaces 2021, 13, 7600–7607. [Google Scholar] [CrossRef]
  9. Wang, L.; Ago, M.; Borghei, M.; Ishaq, A.; Papageorgiou, A.C.; Lundahl, M.; Rojas, O.J. Conductive carbon microfibers derived from wet-spun lignin/nanocellulose hydrogels. ACS Sustain. Chem. Eng. 2019, 7, 6013–6022. [Google Scholar] [CrossRef] [Green Version]
  10. Svenningsson, L.; Bengtsson, J.; Jedvert, K.; Schlemmer, W.; Theliander, H.; Evenäs, L. Disassociated molecular orientation distributions of a composite cellulose–lignin carbon fiber precursor: A study by rotor synchronized NMR spectroscopy and X-ray scattering. Carbohydr. Polym. 2021, 254, 117293. [Google Scholar] [CrossRef]
  11. Leng, E.; Guo, Y.; Chen, J.; Liu, S.; Jiaqiang, E.; Xue, Y. A comprehensive review on lignin pyrolysis: Mechanism, modeling and the effects of inherent metals in biomass. Fuel 2022, 309, 122102. [Google Scholar] [CrossRef]
  12. Santos, R.B.; Capanema, E.A.; Balakshin, M.Y.; Chang, H.M.; Jameel, H. Lignin structural variation in hardwood species. J. Agric. Food Chem. 2012, 60, 4923–4930. [Google Scholar] [CrossRef] [PubMed]
  13. Yelle, D.J. Solution-state NMR analysis of hydroxymethylated resorcinol cured in the presence of crude milled-wood lignin from Acer saccharum. J. Appl. Polym. Sci. 2017, 134, 45398. [Google Scholar] [CrossRef]
  14. Björkman, A. Studies on finely divided wood. Part 1. Extraction of lignin with neutral solvents. Sven. Papp. Nord. Cellul. 1956, 59, 477–485. [Google Scholar]
  15. Chen, T.Y.; Wang, B.; Wu, Y.Y.; Wen, J.L.; Liu, C.F.; Yuan, T.Q.; Sun, R.C. Structural variations of lignin macromolecule from different growth years of Triploid of Populus tomentosa Carr. Int. J. Biol. Macromol. 2017, 101, 747–757. [Google Scholar] [CrossRef] [PubMed]
  16. Wang, H.M.; Wang, B.; Wen, J.L.; Yuan, T.Q.; Sun, R.C. Structural Characteristics of Lignin Macromolecules from Different Eucalyptus Species. ACS Sustain. Chem. Eng. 2017, 5, 11618–11627. [Google Scholar] [CrossRef]
  17. Qi, C.; Hou, S.; Lu, J.; Xue, W.; Sun, K. Thermal characteristics of birch and its cellulose and hemicelluloses isolated by alkaline solution. Holzforschung 2020, 74, 1099–1112. [Google Scholar] [CrossRef]
  18. Yu, M.; He, D.; Zhang, Y.; He, D.; Wang, X.; Zhou, J. Characterization of lignin extracted from Acanthopanax senticosus residue using different methods on UV-resistant behavior. Int. J. Biol. Macromol. 2021, 192, 498–505. [Google Scholar] [CrossRef]
  19. Wang, S.; Wang, K.; Liu, Q.; Gu, Y.; Luo, Z.; Cen, K.; Fransson, T. Comparison of the pyrolysis behavior of lignins from different tree species. Biotechnol. Adv. 2009, 27, 562–567. [Google Scholar] [CrossRef]
  20. Jiang, G.; Nowakowski, D.; Bridgwater, T. Effect of the Temperature on the Composition of Lignin Pyrolysis Products. Energy Fuels 2010, 24, 4470–4475. [Google Scholar] [CrossRef]
  21. Qin, Z.; Wang, X.D.; Liu, H.M.; Wang, D.M.; Qin, G.Y. Structural characterization of Chinese quince fruit lignin pretreated with enzymatic hydrolysis. Bioresour. Technol. 2018, 262, 212–220. [Google Scholar] [CrossRef]
  22. Wen, J.L.; Sun, S.L.; Xue, B.L.; Sun, R.C. Quantitative Structures and Thermal Properties of Birch Lignins after Ionic Liquid Pretreatment. J. Agric. Food Chem. 2012, 61, 635–645. [Google Scholar] [CrossRef] [PubMed]
  23. Flynn, J.H.; Wall, L.A. A quick, direct method for the determination of activation energy from thermogravimetric data. J. Polym. Sci. Part B Polym. Lett. 1966, 4, 4323–4328. [Google Scholar] [CrossRef]
  24. Ozawa, T. A New Method of Analyzing Thermogravimetric Data. Bull. Chem. Soc. Jpn. 1965, 38, 1881–1886. [Google Scholar] [CrossRef] [Green Version]
  25. Friedman, H.L. Kinetics of thermal degradation of char-forming plastics from thermogravimetry. Application to a phenolic plastic. J. Polym. Sci. Part C Polym. Symp. 1964, 6, 183–195. [Google Scholar] [CrossRef]
  26. Qi, C. Multi-Model and Visual Calculation Software of Thermal Degradation Kinetic Parameters for Biomass and Wood. 2018. Available online: http://js.editorbar.com (accessed on 17 January 2022).
  27. Coats, A.W.; Redfern, J. Kinetic parameters from thermogravimetric data. Nature 1964, 201, 68–69. [Google Scholar] [CrossRef]
  28. Abd El-Wahab, M.M.M. Thermal decomposition kinetics of some new unsaturated polyesters. Thermochim. Acta 1995, 256, 271–280. [Google Scholar] [CrossRef]
  29. Liu, Y.; Hu, T.; Wu, Z.; Zeng, G.; Huang, D.; Shen, Y.; He, X.; Lai, M.; He, Y. Study on biodegradation process of lignin by FTIR and DSC. Environ. Sci. Pollut. Res. 2014, 21, 14004–14013. [Google Scholar] [CrossRef]
  30. Xu, G.; Wang, L.; Liu, J.; Wu, J. FTIR and XPS analysis of the changes in bamboo chemical structure decayed by white-rot and brown-rot fungi. Appl. Surf. Sci. 2013, 280, 799–805. [Google Scholar] [CrossRef]
  31. Pandey, K.K.; Pitman, A.J. FTIR studies of the changes in wood chemistry following decay by brown-rot and white-rot fungi. Int. Biodeterior. Biodegrad. 2003, 52, 151–160. [Google Scholar] [CrossRef]
  32. Ehara, K.; Takada, D.; Saka, S. GC-MS and IR spectroscopic analyses of the lignin-derived products from softwood and hardwood treated in supercritical water. J. Wood Sci. 2005, 51, 256–261. [Google Scholar] [CrossRef]
  33. Strahan, G.D.; Mullen, C.A.; Stoklosa, R.J. Application of Diffusion-Ordered NMR Spectroscopy to the Characterization of Sweet Sorghum Bagasse Lignin Isolated After Low Moisture Anhydrous Ammonia (LMAA) Pretreatment. BioEnergy Res. 2022, 1–10. Available online: https://link.springer.com/article/10.1007/s12155-021-10385-y (accessed on 20 May 2022). [CrossRef]
  34. Heikkinen, S.; Toikka Mm Fau-Karhunen, P.T.; Karhunen Pt Fau-Kilpeläinen, I.A.; Kilpeläinen, I.A. Quantitative 2D HSQC (Q-HSQC) via suppression of J-dependence of polarization transfer in NMR spectroscopy: Application to wood lignin. J. Am. Chem. Soc. 2003, 125, 4362–4367. [Google Scholar] [CrossRef] [PubMed]
  35. Yuan, T.Q.; Sun, S.N.; Xu, F.; Sun, R.C. Characterization of lignin structures and lignin-carbohydrate complex (LCC) linkages by quantitative 13C and 2D HSQC NMR spectroscopy. J. Agric. Food Chem. 2011, 59, 10604–10614. [Google Scholar] [CrossRef]
  36. Del Rio, J.C.; Rencoret, J.; Marques, G.; Li, J.; Gellerstedt, G.; Jimenez-Barbero, J.; Gutiérrez, A.N.A. Structural characterization of the lignin from jute (Corchorus capsularis) fibers. J. Agric. Food Chem. 2009, 57, 10271–10281. [Google Scholar] [CrossRef] [PubMed] [Green Version]
  37. Vallejos, M.; Felissia, F.; Curvelo, A.; Zambon, M.D.; Ramos, L.; Area, M. Chemical and physico-chemical characterization of lignins obtained from ethanol-water fractionation of bagasse. BioResources 2011, 6, 1158–1171. Available online: https://hdl.handle.net/11336/43206 (accessed on 15 January 2022).
  38. Gregorova, A. Application of differential scanning calorimetry to the characterization of biopolymers. Applications of Calorimetry in a Wide Context-Differential Scanning Calorimetry. Isothermal Titration Calorim. Microcalorim. 2013, 3–20. Available online: https://www.intechopen.com/chapters/42247 (accessed on 20 May 2022). [CrossRef] [Green Version]
  39. Gordobil, O.; Egüés, I.; Llano-Ponte, R.; Labidi, J. Physicochemical properties of PLA lignin blends. Polym. Degrad. Stab. 2014, 108, 330–338. [Google Scholar] [CrossRef]
  40. Voitkevich, O.V.; Kabo, G.J.; Blokhin, A.V.; Paulechka, Y.U.; Shishonok, M.V. Thermodynamic properties of plant biomass components. Heat capacity, combustion energy, and gasification equilibria of lignin. J. Chem. Eng. Data 2012, 57, 1903–1909. [Google Scholar] [CrossRef]
  41. Hatakeyama, T.; Nakamura, K.; Hatakeyama, H. Studies on heat capacity of cellulose and lignin by differential scanning calorimetry. Polymer 1982, 23, 1801–1804. [Google Scholar] [CrossRef]
  42. Wang, S.; Lin, H.; Ru, B.; Sun, W.; Wang, Y.; Luo, Z. Comparison of the pyrolysis behavior of pyrolytic lignin and milled wood lignin by using TG–FTIR analysis. J. Anal. Appl. Pyrolysis 2014, 108, 78–85. [Google Scholar] [CrossRef]
  43. Damayanti Wu, H.S. Pyrolysis kinetic of alkaline and dealkaline lignin using catalyst. J. Polym. Res. 2018, 25, 1–11. [Google Scholar] [CrossRef]
  44. Jiang, G.; Nowakowski, D.J.; Bridgwater, A.V. A systematic study of the kinetics of lignin pyrolysis. Thermochim. Acta 2010, 498, 61–66. [Google Scholar] [CrossRef]
Figure 1. Isolation process of DEL from Chinese fir and birch.
Forests 13 00914 g001
Figure 2. FTIR spectra of Chinese fir DEL and birch DEL.
Forests 13 00914 g002
Figure 3. 2D-HSQC spectra of Chinese fir DEL and birch DEL.
Forests 13 00914 g003
Figure 4. (a) Heat flow of Chinese fir; (b) Heat flow of birch DEL; (c) Specific heat capacities of Chinese fir DEL and birch DEL.
Forests 13 00914 g004
Figure 5. Thermal conductivities of Chinese fir DEL and birch DEL.
Forests 13 00914 g005
Figure 6. (a) Weight losses of Chinese fir DEL and birch DEL at a heating rate of 20 °C/min; (b) Weight losses of Chinese fir DEL and birch DEL at 750 °C for 30 min. (The left arrow indicates the Y axis of the curve is on the left side, and the right arrow indicates the Y axis of the curve is on the right side).
Forests 13 00914 g006
Figure 7. (a) TG and DTG curves of Chinese fir DEL at heating rates of 5, 10, 15, 20, and 25 °C/min; (b) TG and DTG curves of birch DEL at heating rates of 5, 10, 15, 20, and 25 °C/min.
Forests 13 00914 g007
Figure 8. Activation energy and natural logarithm pre-exponential factor of (a) Chinese fir DEL and (b) birch DEL. (The left arrow indicates the Y axis of the curve is on the left side, and the right arrow indicates the Y axis of the curve is on the right side).
Forests 13 00914 g008
Table 1. Infrared characteristic absorption peaks of Chinese fir and birch DEL.
Wave Number (cm−1)Absorption Peak Assignment
3393, 3418Hydroxyl (O-H)
2931, 2937Methyl, Methylene, Methine (C-H)
1715~1710Non-conjugated carbonyl (C=O), Ester group
1660~1665Conjugated carbonyl (C=O)
1600~1590Aromatic ring (skeletal vibration)
1510–1505Aromatic ring (skeletal vibration)
1455~1465C-H bending vibrations of methyl and methylene
1420, 1422Aromatic ring (skeletal vibration)
1327Lilac Ring (C-O)
1228, 1266Ring of Guaiac (C-O)
1124Lilac Ring (C-O)
1029, 1031Secondary alcohols, Ethers (C-O bending vibrations)
830Aromatic rings (C-H bending vibrations)
Table 2. Kinetic parameters of thermal degradation of fir DEL and birch DEL at different conversion rates.
SampleParametersConversation Rates
0.020.02–0.300.31–0.450.46–0.600.02–0.60
Chinese fir ligninƒ(a) ( 1 α ) 2 1 α ( 1 α ) 2
E a average150.0147.5135.8140.1141.2
E a fitting equation −39.7a + 150.9
R2 = 0.91
239.6a2 − 200.3a + 176.9
R2 = 0.74
103.1a + 86.3
R2 = 0.91
127.1a2 − 95.1a + 154.9
R2 = 0.78
ln(A) average34.132.327.126.9729.0
ln(A) fitting equation −19.5a + 34.0
R2 = 0.98
−10.5a + 31.1
R2 = 0.91
12.9a + 20.2
R2 = 0.83
−12.3a + 32.7
R2 = 0.83
Birch ligninƒ(a) ( 1 α ) 2
E a average148.4133.4106.5105.32112.7
E a fitting equation −163.0a + 147.5
R2 = 0.96
−148.7a + 156.6
R2 = 0.93
/258.7a2 − 224.2a + 149.75
R2 = 0.84
ln(A) average33.228.621.420.422.9
ln(A) fitting equation −43.2a + 32.4
R2 = 0.96
−33.8a + 32.7
R2 = 0.94
/64.9a2 − 58.6a + 33.0
R2 = 0.90
Publisher’s Note: MDPI stays neutral with regard to jurisdictional claims in published maps and institutional affiliations.

