Article

Assessing the Resource Potential of Mountainous Forests: A Comparison between Austria and Japan

1
Department of Forest- and Soil Sciences, Institute of Silviculture, University of Natural Resources and Life Sciences, 1190 Vienna, Austria
2
Faculty of Agriculture, Shizuoka University, Oya, Shizuoka 422-8529, Japan
3
Faculty of Agriculture/Agri-Innovation Center, Iwate University, Morioka 020-8550, Japan
*
Author to whom correspondence should be addressed.
Forests 2022, 13(6), 891; https://doi.org/10.3390/f13060891
Submission received: 5 May 2022 / Revised: 31 May 2022 / Accepted: 6 June 2022 / Published: 7 June 2022
(This article belongs to the Section Forest Ecology and Management)

Abstract

:
Domestic wood production in Japan is low, and more than 60% of the wood consumed is imported. This is surprising because two-thirds of Japan’s land area is covered by forests. The dominant explanations for this low wood self-sufficiency rate are the lack of forest road infrastructure and the small-scale forest ownership structure. Austria is a country that is similar in topography and ownership structure but has a high wood self-sufficiency rate. Therefore, previous research has compared Japan to Austria. However, these studies did not address basic forest properties in much detail. This study uses national forest inventory data from both countries to assess the forest structures and utilization percentages of the annual wood increment. In contrast to the hypothesis, the results show that the two countries have similar increment rates. In contrast to former studies, the findings indicate that Japanese plantation forests have a higher timber stocking volume than Austrian forests. In Japan, the proportion of the standing volume in the 40–60-year-old age class is much higher compared to the other age classes, indicating an unbalanced growing stock. The results show that the utilization percentage is much higher in Austria (88%) than in Japan (53%). Therefore, the Japanese forest sector has a high potential to increase the harvest of wood.

1. Introduction

Japan and Austria are both mountainous countries with a high forest coverage, but their amount of harvested wood per hectare and forest structures differ greatly. Approximately 25.6 million ha, almost two-thirds of Japan’s land area, is covered by forests, 42% of which (>10 million ha) are plantations [1]. More than half of these forests are located in areas with slopes greater than 15° [2]. Austria’s forests cover 4.4 million ha [3], 75% of which are located in steep areas [2].
Because of the high demand for wood, large parts of Japan’s forests were harvested during and especially after the Second World War. This led to nationwide afforestation programs that peaked in 1953 and a second time in 1961 [4]. In the 1960s, the government liberalized wood imports to supply the growing economy. Foreign wood entered the Japanese market because it was much cheaper than domestic timber. With trade liberalization, the Japanese timber industry had to compete with the international wood market and as a result, the wood-self-sufficiency rate fell below 50% by 1969 for the first time in recent history [5]. After declining to 18.9% in 2000, the self-sufficiency rate increased to 34.8% in 2016 [6]. By 1980, local wood prices had declined to the point that many forest owners lost interest, and Japan fell into a “Forest Depression” [5]. This resulted in untended, unstable, and underutilized forests, and Japan became heavily dependent on wood imports. These unmanaged forests are no longer able to provide adequate protective, ecological, and economical forest services [7,8]. Additionally, modern afforestation efforts suffer under the high density of sika deer (Cervus nippon), Japanese serow (Capricornis crispus), and other invasive mammals [7,9], leading to high levels of browsing and the dominance of tall grasses and weeds on clear-cut sites [9]. Today, the socio-economic challenges that Japan is facing include aging forest owners [10], forest owners leaving the countryside, and a reliance on national or local government subsidies in most parts of the forestry industry [11]. As a result, investment in forest management and forest infrastructure (e.g., forest roads) is low [1,12], and only 58% of the annual timber increment is currently harvested [13]. Thus, Kuboyama et al. [14] suggested that Japan can learn how to revitalize its forestry sector by looking at and learning from Austria.
In 2015, Austrian forest owners harvested 26 million m 3 , or 88% of the annual timber increment [3]. Austria has a long history of sustainable forest management [3]. Austrian forestry is based on the concept of “careful forest utilization”, which was introduced at the beginning of the 19th century. This concept emerged after years of destructive logging to sustain the iron and salt industries as well as to accommodate growing metropolitan areas [15].
Although Austria and Japan have mainly mountainous forests [2] with a similar, small-scale forest ownership structure [1], the two countries show different trends in their wood production. Thus, understanding the bio-geophysical and socio-economic reasons for these diverging trends is important for assessing the potential future development of the forest sector, including the carbon sequestration potential for the two countries. This section briefly reviews Japanese studies that compare Austria and Japan by addressing the differences in forest road density [14,16,17,18,19] and differences in the average stocking volume: (1) Austria has a forest road density of 45 m/ha versus Japan with only 14 m/ha [14,17]; (2) the average stocking volume with 325 m 3 /ha in Austrian is much higher than in Japanese plantation forests with only 256 m 3 /ha [14]. Higher volume-per-hectare values indicate a higher volume per single tree, which will result in lower harvesting costs per m 3 . This so-called “law of mass per piece” [20] leads to lower average harvesting costs per m 3 in Austria compared to Japan. In addition, Austria was able to develop a very efficient and economically successful forest and timber supply chain industry, which is lacking in Japan [1,14].
These studies compared a few of the basic forest properties of the two countries. For example, Kuboyama et al. [14] compared the volume per hectare but did not compare increment rates or age class distribution. The differences in environmental factors, especially the mean, maximum, and minimum annual temperature and summer precipitation [21], may result in significantly different increment rates. The hypothesis is that the forests in Austria and Japan differed in the age-class distribution, increments rates, and the harvesting intensities. Thus, the potential differences in the increment rates, in combination with the differences in age-class distribution by country, may result in diverging forest resource potentials between Austria and Japan.
The purpose of this study was to investigate: (1) the forest area, the growing stock, and age-class distribution; (2) historic changes in the forest area, volume, harvest, and utilization percentage; and (3) the increment rates per age class and the related sustainable harvesting potential of major tree species within each country to enhance our understanding of why the development of the forest sector differs between Japan and Austria.

2. Materials and Methods

2.1. Data

The data for this study were obtained from the Japanese and Austrian national forest inventories and national forestry reports [3,6,13]; demand and supply information was provided by the national forest and energy agencies of each country [3,13,22].
The Japanese National Forest Inventory (JNFI) was introduced in 1999 and is organized into two parts: (1) a forest resource monitoring survey and (2) a forest planning system [12]. The forest resource monitoring survey uses a sampling system [23]. The sampling plots are established on a 4 km × 4 km grid across the country, with a total of 23,600 plots. The forest or non-forest status is determined via aerial photographs, which reduces the number to approximately 16,000 forest plots [24]. Because of accessibility issues, the number of measured plots is further reduced to 13,357 [25]. The plots are 0.1 ha in size and consist of three circular-shaped subplots with different radii (5.64 m, 11.28 m, and 17.84 m) at the same center point. The measured diameters at breast height (DBHs) are ≥1 cm in the smallest circle, ≥5 cm in the middle circle, and >18 cm in the largest circle [12]. In most countries, DBH is measured at 1.3 m height from the ground, but it is measured at 1.2 m height in Japan [26]. The trees on the plot are numbered, and the tree height, DBH, and the number of dead trees are recorded. In the second step (the forest planning system), forest registers and planning maps are created. A forest register includes forest stand information, such as DBH, tree species, age, forest type, and ownership structure. The standing volume is calculated using yield tables [12] which differ by forest ownership type. Additionally, all 47 prefectural governments have their own locally adapted yield tables [25]. The stand and yield table data are then combined with images and used to create a geographic information system that contains all the important forest stand information and ownership boundaries [12,23]. The JNFI measures multiple plot parameters, such as site and stand information and dominant species. Age information comes from the forest register, which also covers regeneration information. Shrub and herb layers, including their coverage, are determined according to [12,27].
The Austrian National Forest Inventory (ANFI) was introduced in 1961 [3]. Today, it is based on a systematic, permanent, hidden, nationwide grid design of 3.89 km × 3.89 km with a cluster of four inventory plots at each grid point (approximately 22,000 plots and 5500 clusters). Each cluster is a square (200 m × 200 m) with a plot in each corner. The permanent plots were established from 1981 to 1985 by setting up 20% of the inventory points per year. Each inventory plot is marked with a hidden iron stick [28] which was placed at the site at the beginning of the inventory process. The iron stick is hidden to eliminate the research plot bias [29] and ensures that the forest inventory is representative of the growing conditions and forest management throughout Austria. The condition of the forest was measured at each plot by using an angle count sample plot [30] and a basal area factor of 4 m 2 / h a for trees with a DBH ≥ 10.4 c m ; a fixed area plot (r = 2.6 m, area = 21.2 m 2 ) was used for trees with DBHs ranging from 5.0 to 10.4 c m . For a detailed description of the ANFI, please refer to Schieler [31] for increment calculations and to Gabler and Schadauer [32] for sample design and field instructions.

2.2. Method

For Austria, the ANFI 6 plot data recorded in 2000–2002, ANFI 7 plot data recorded in 2007–2009, as well as the ANFI 8 plot data recorded in 2016–2018, resulting in a re-measurement interval of 7–9 years [32], were used. For Japan, the JNFI second-stage plot data recorded in 2004–2008, and JNFI third-stage plot data recorded in 2009–2013, resulting in a re-measurement interval of 4–6 years, were used. For historic data, this study relied on information provided by the respective national ministries and agencies [3,6,13,33]. Japanese data from before 1999 are based on national forest register data that relied on yield tables and not on time series of field measurements. Consequently, historic Japanese data might not be as accurate as data from 1999 onward.
With these data, the forest area, forest area changes, standing volume, and standing volume changes were calculated for each country. For the changes in standing volume, the forests were split into hardwoods and softwoods to highlight which type of forest is contributing the most to total volume change. The annual increment rates are derived by comparing the volume of each plot in the second-stage JNFI and the third-stage JNFI data. The plot-based increment rates for Austria are taken from ANFI 6. Some JNFI points did not include all the parameters mentioned in the data section. Because of this lack of data, some points were excluded when calculating the increment rates. To calculate the increment, only plots for which volume had been measured twice (i.e., in the second and third stages of JNFI) were used. This resulted in the use of 9880 points out of 14,470. For Japan, the dominant tree species is defined by the national forest agency as the tree species that contributes more than 30% of the plot’s basal area. For Austria, this study defined the dominant tree species for each plot by using the tree species that contributes the most to the basal area in the plot. Most of the calculations are carried out in R Statistical Software v4.1.2. [34]. Figures were made with the software package ggplot2 v3.3.5 [35].

3. Results

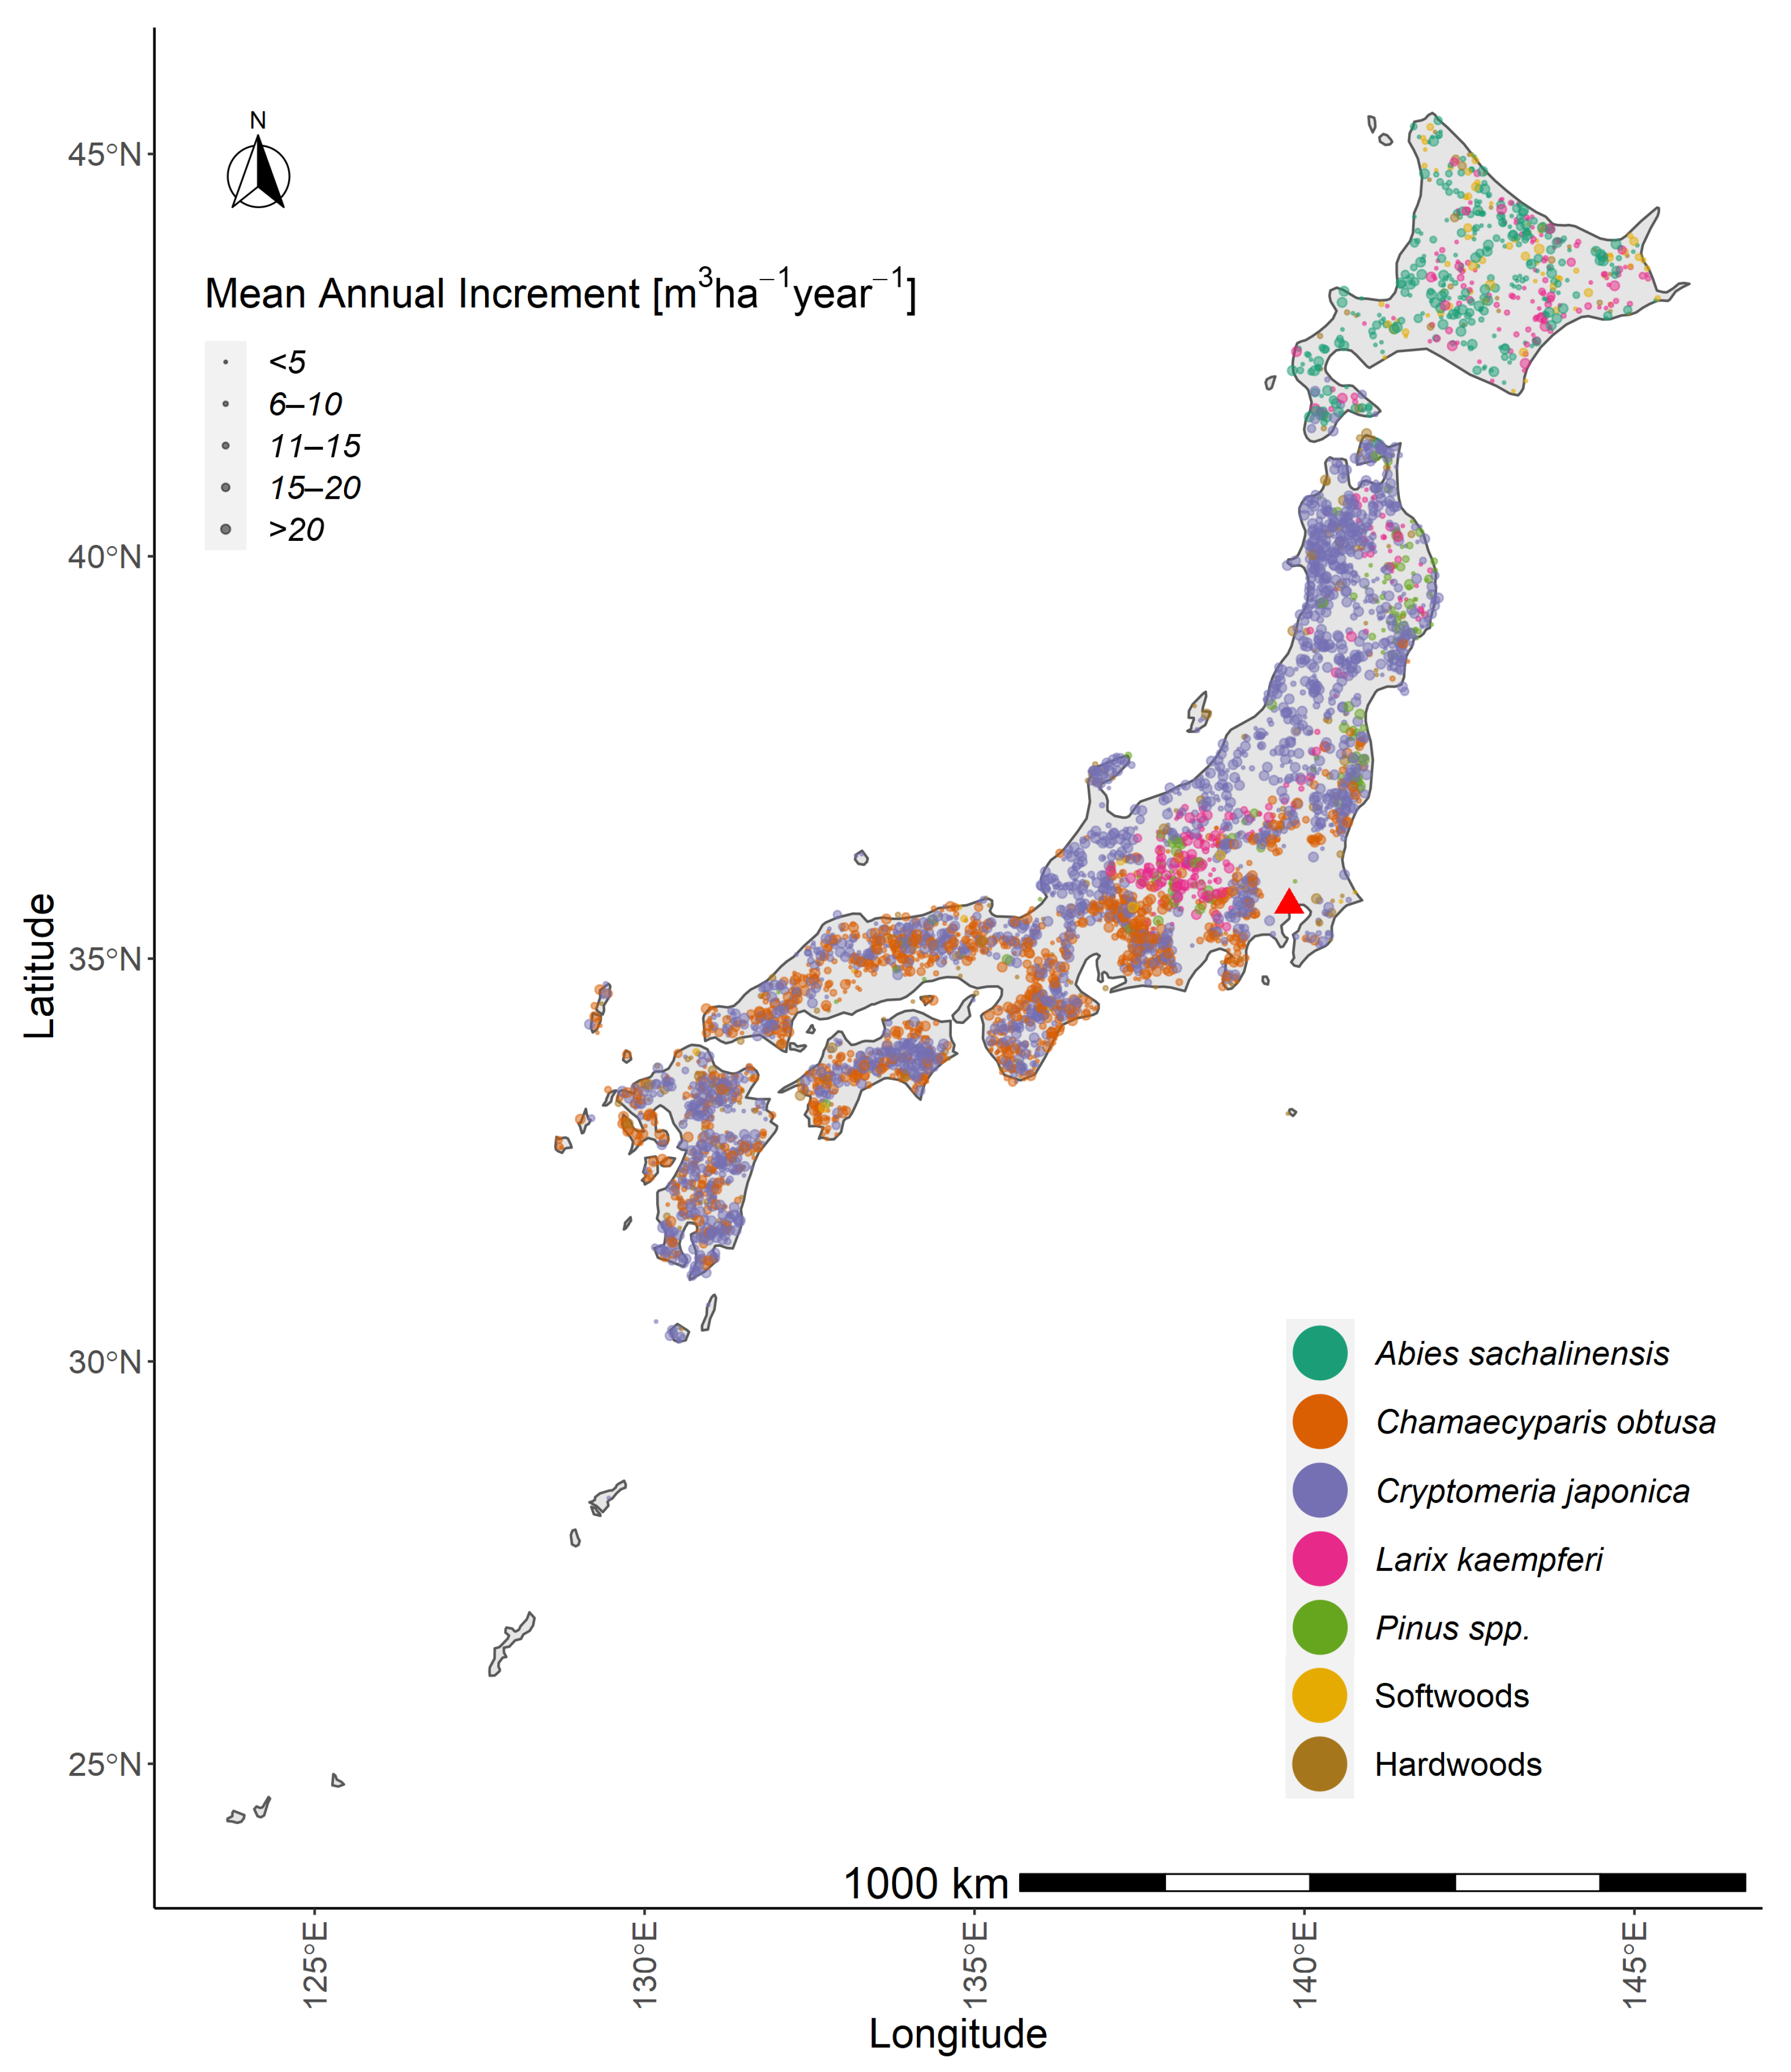
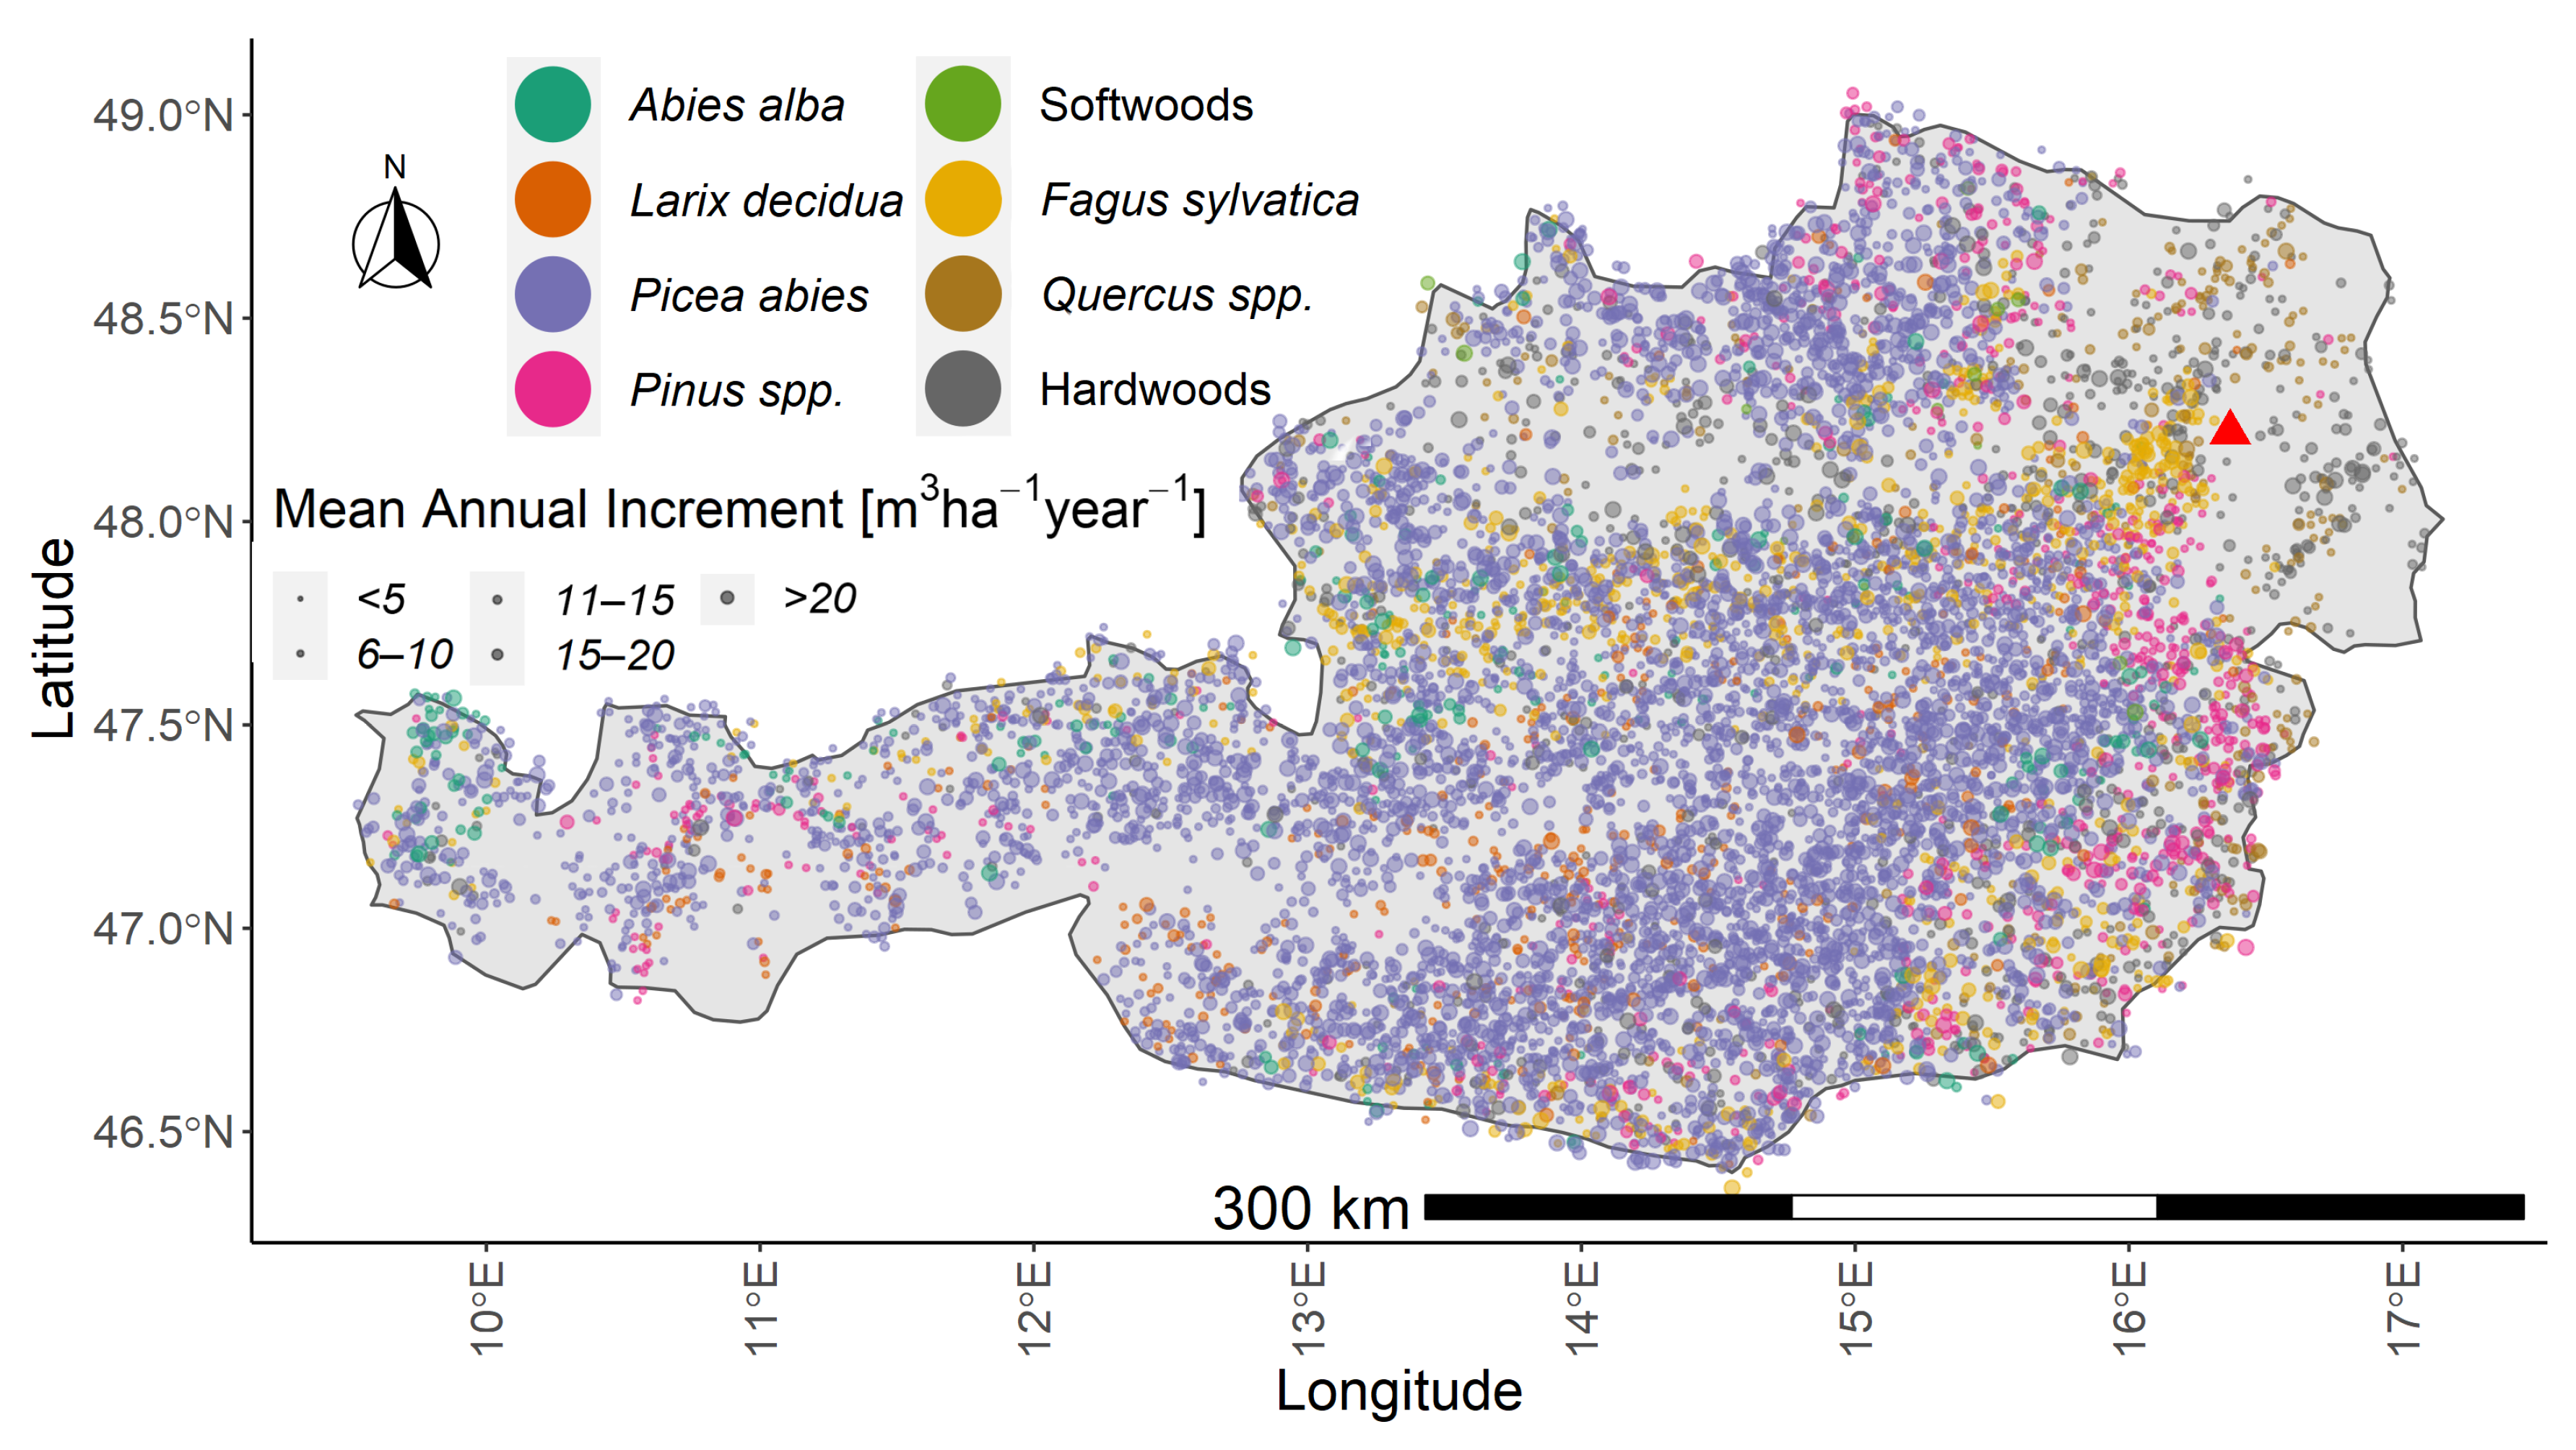
3.1. Dominant Tree Species

Japanese forests have two major softwood species, Japanese cedar (Cryptomerica japonica L.f.) and Japanese cypress (Chamaecyparis obtusa Siebold and Zucc.), also called sugi and hinoki, respectively. These two species cover large parts of the forest area and cover more than 50% of the national stocking volume (Table 1). Cryptomerica japonica is the most planted species because it exhibits higher annual increment rates than C. obtusa, and has a higher tolerance for cold temperatures [36]. As shown in Figure 1, hardwoods are very rarely planted. The most common naturally regenerating hardwood species are Quercus serrata Murray and Fagus crenata Blume. The most commonly planted species in the mountainous central region of Honshu, sometimes called the Japanese Alps, is Japanese larch (Larix kaempferi Lamb.), also known as karamatsu. Larix kaempferi stands replaced Japanese red pine (Pinus densiflora Siebold), which were damaged by pine wilt diseases [37,38]. On the northern island of Hokkaido, the coldest and snowiest part of Japan, Sakhalin fir (Abies sachalinensis F.Schmidt), L. kaempferi, and Sakhalin spruce Picea glenhii are the most commonly planted tree species.
Within Austrian forests, 60.4 % of the standing volume consists of Norway spruce (Picea abies (L.) H.Karst) (Table 1). Picea abies dominates large parts of the country, especially the mountainous regions of western and central Austria (Figure 2). Some stands dominated by European larch (Larix decidua Mill.) can be found in sub-alpine areas. Forests dominated by silver fir (Abies alba Mill.) can be found in northern Tyrol, a western Austrian province. Hardwoods grow on the southern and northern edges of the European Alps in the northeast and southeast of Austria. The Viennese Forest next to the city of Vienna mainly consists of European beech (Fagus sylvatica L.). Pinus spp. stands dominate southeastern Austria. Oaks (Quercus spp.) are the dominant tree species in northeastern Austria.

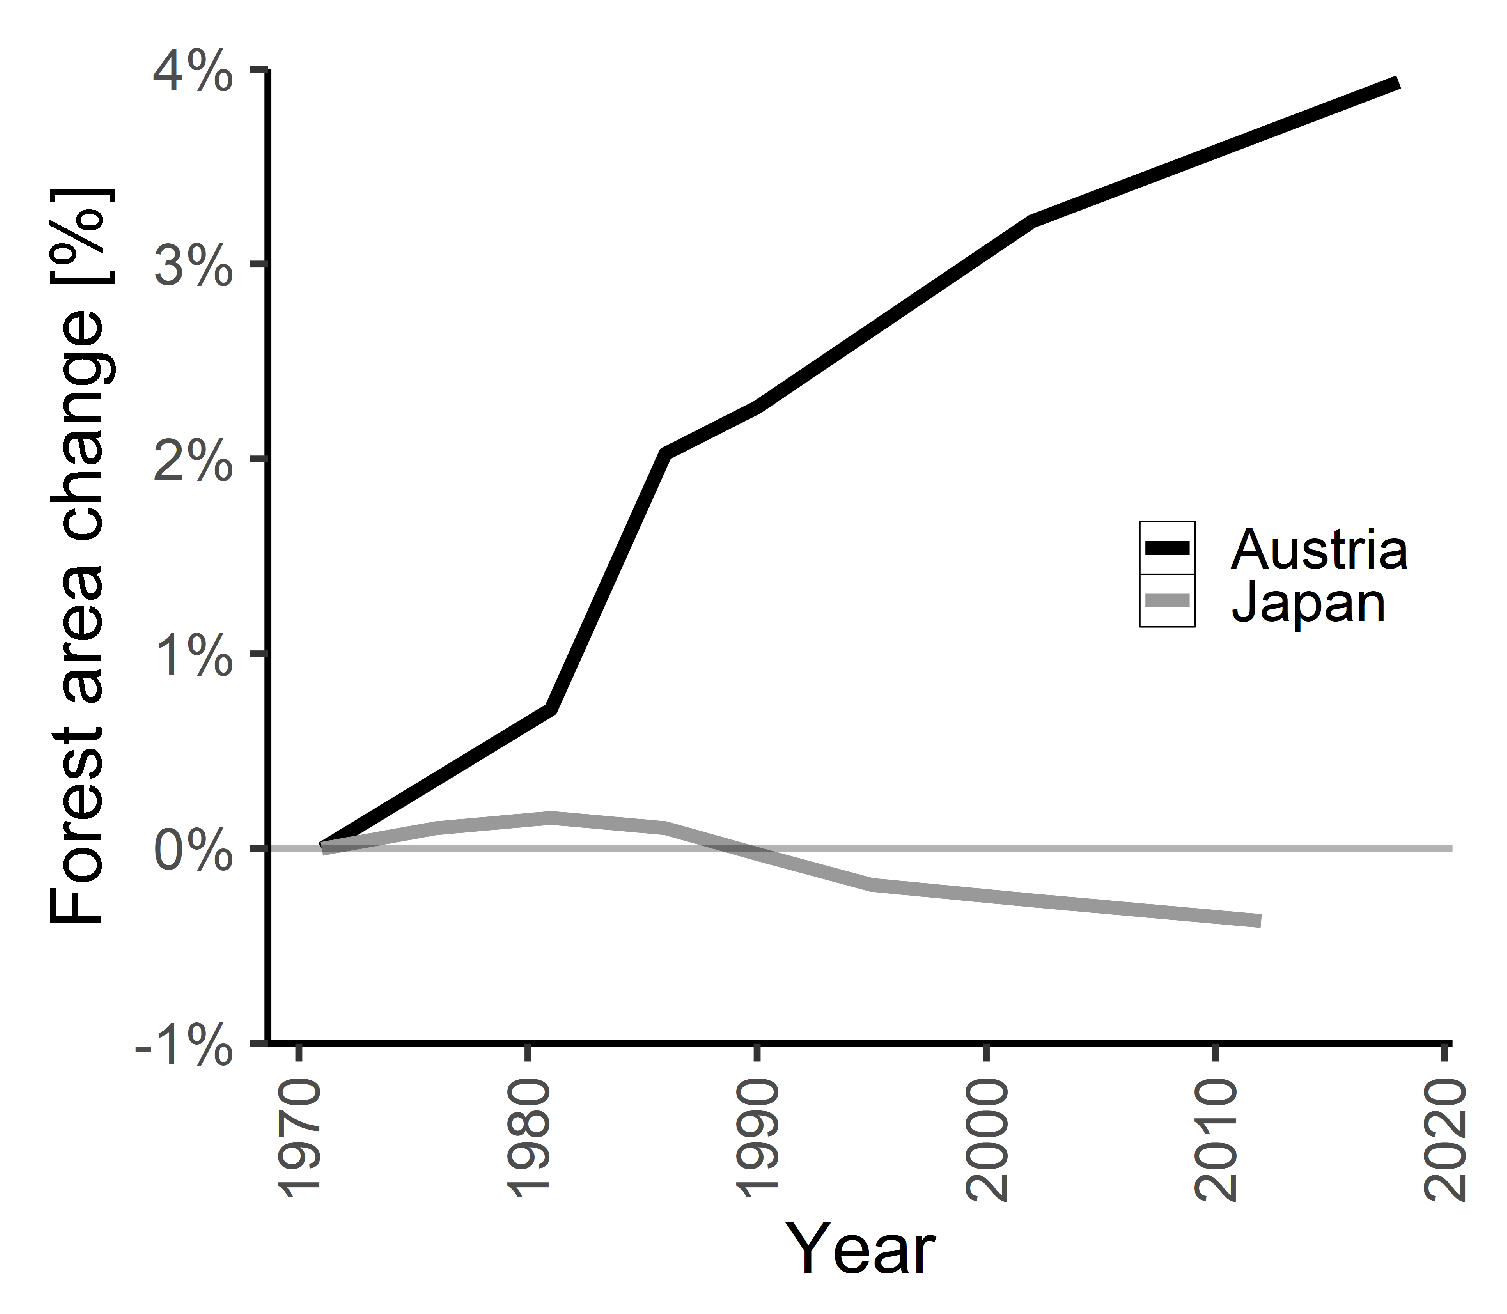
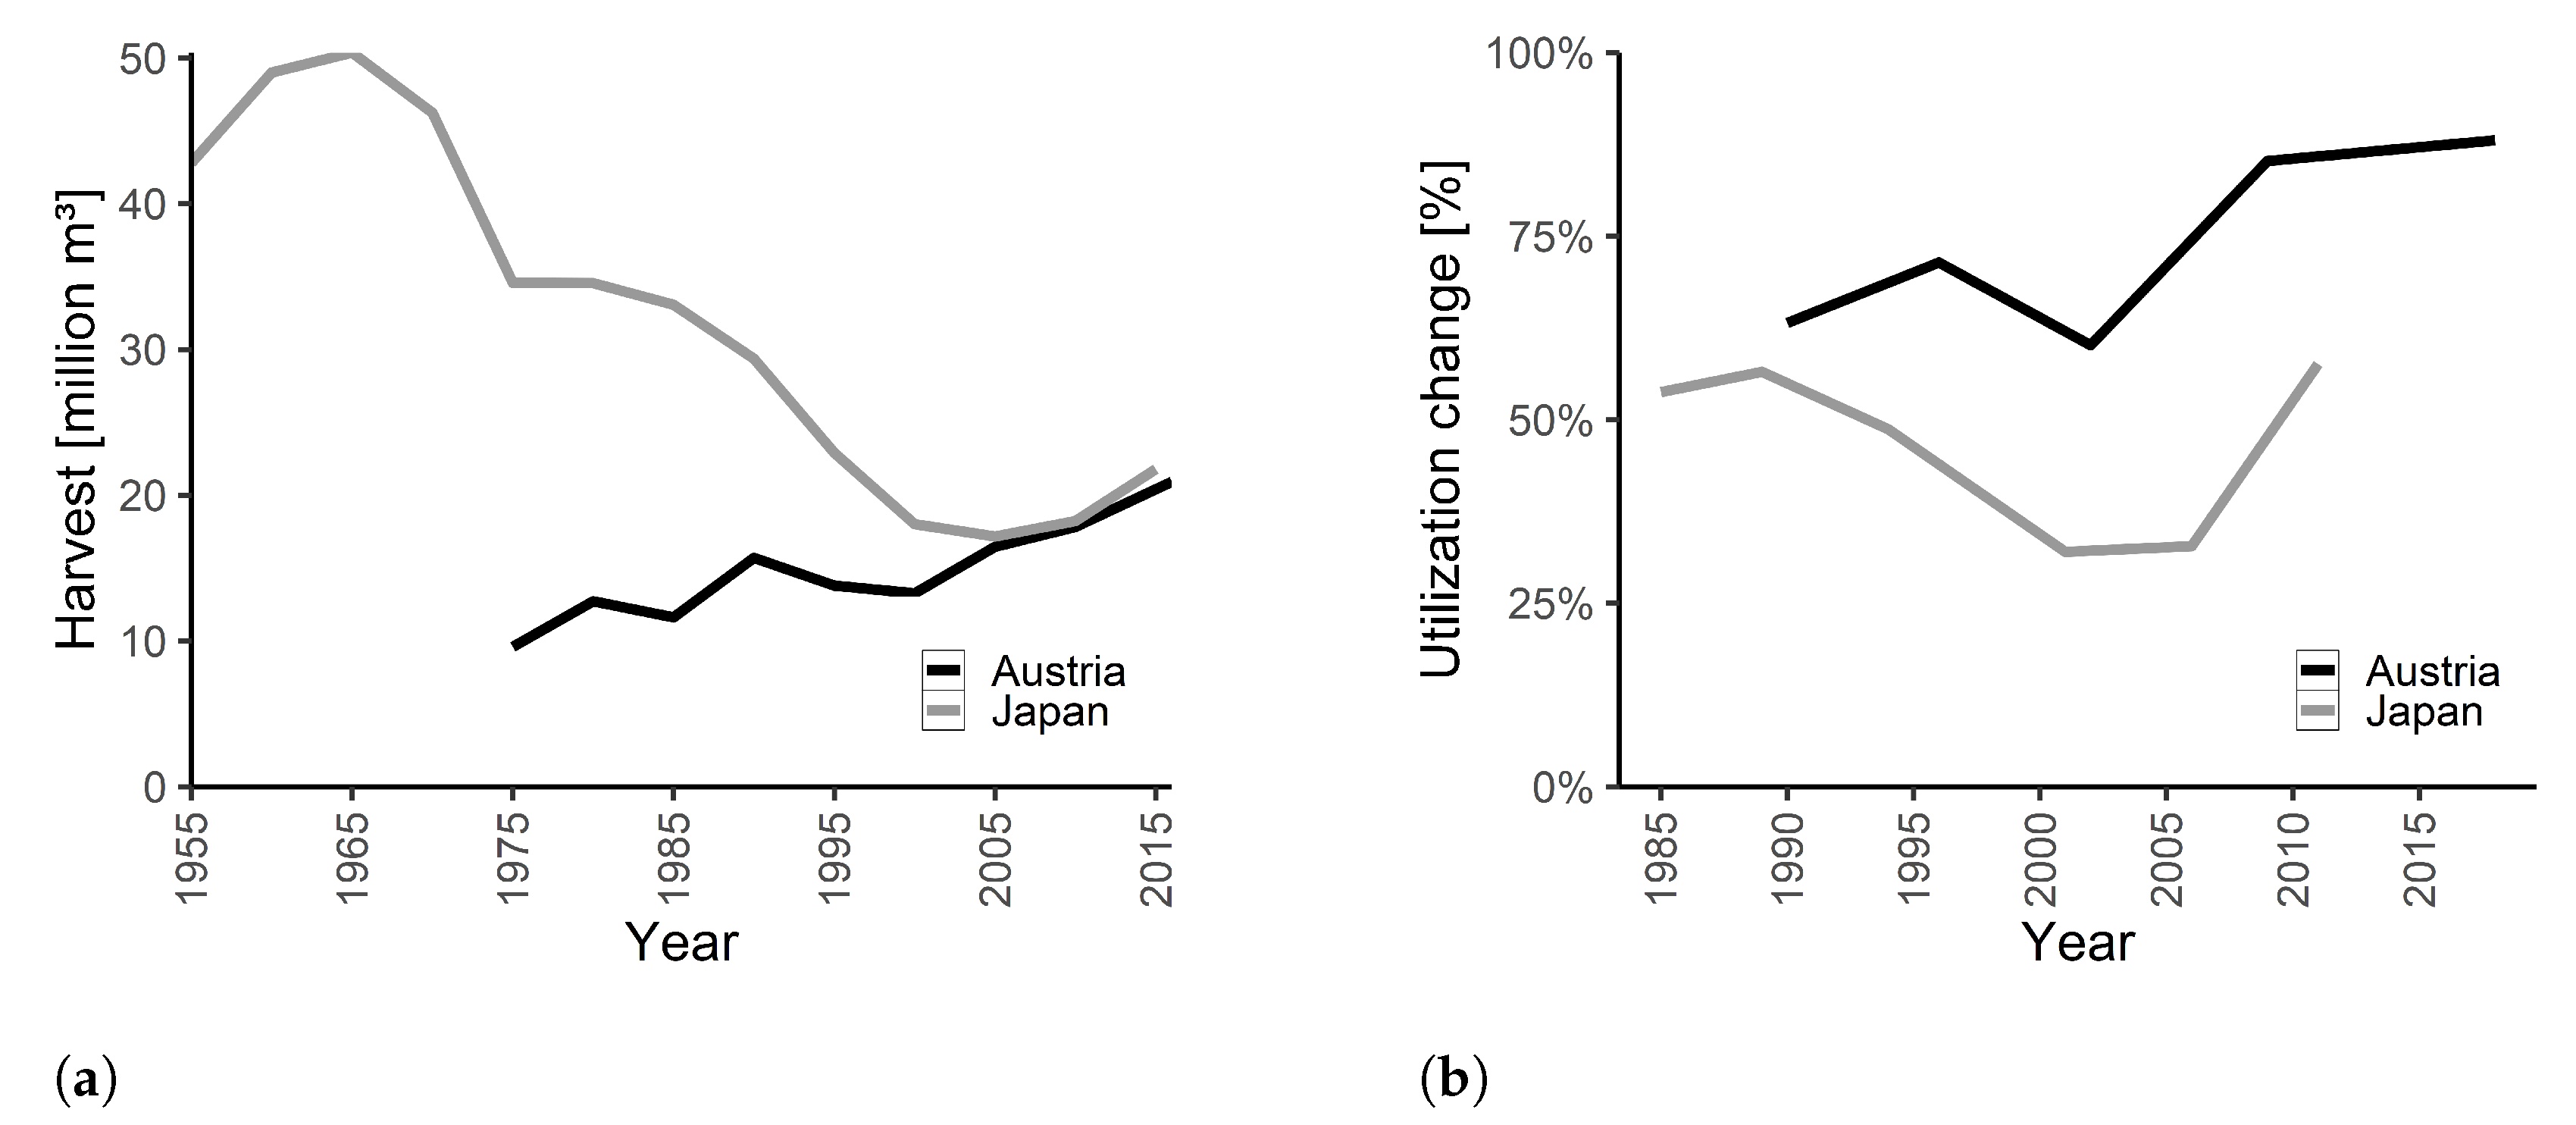
3.2. Current Forest Conditions and Historic Development

Japanese forests cover approximately 25 million ha, two-thirds of the national land area. In Austria, forests cover about 4 million ha, nearly half of the national land area. The current forest area in Austria has increased by 4% (Figure 3) compared to the forest area in 1970. In Japan, the forest area has declined by less than 1% (Figure 3) compared to the forest area in 1970.
The total standing volume has increased in both countries since the 1990s. In Austria, the total volume has changed from 0.99 billion m 3 in 1996 to 1.17 billion m 3 in 2016. In Japan, the volume has increased from 3.14 billion m 3 in 1990 to 4.9 billion m 3 in 2012, because of a large increase in softwood volume from 2.01 billion m 3 to 3.46 billion m 3 (Figure 4a) [6]. Softwood and hardwood have increased in both countries, but with some interesting differences: in Japan, softwood has increased by more than 40%, whereas in Austria, hardwood has increased by more than 40% (Figure 4b). The median volume per hectare is 393 m 3 / h a in Japanese plantation forest and 281 m 3 / h a in Austrian forests.
The total annual harvest in Japan declined from 50 million m 3 in 1965 to 17 million m 3 in 2005, resulting in a severe decline in the wood self-sufficiency rate. In 2005, only 20.5% of the demanded wood resources were produced in Japan, leading to the second-lowest self-sufficiency rate in Japan’s history after the 18.9% recorded in 2000 [6]. In Austria, the harvests increased from 9.6 million m 3 in 1975 to nearly 20.9 million m 3 in 2016 (Figure 5a). In 2018, the Austrian harvest-to-increment rate reached 88%, while in Japan, the harvest-to-increment rate declined after the late 1980s from approximately 54% to 32% in 2001, and increased to approximately 58% in 2011 (Figure 5b).

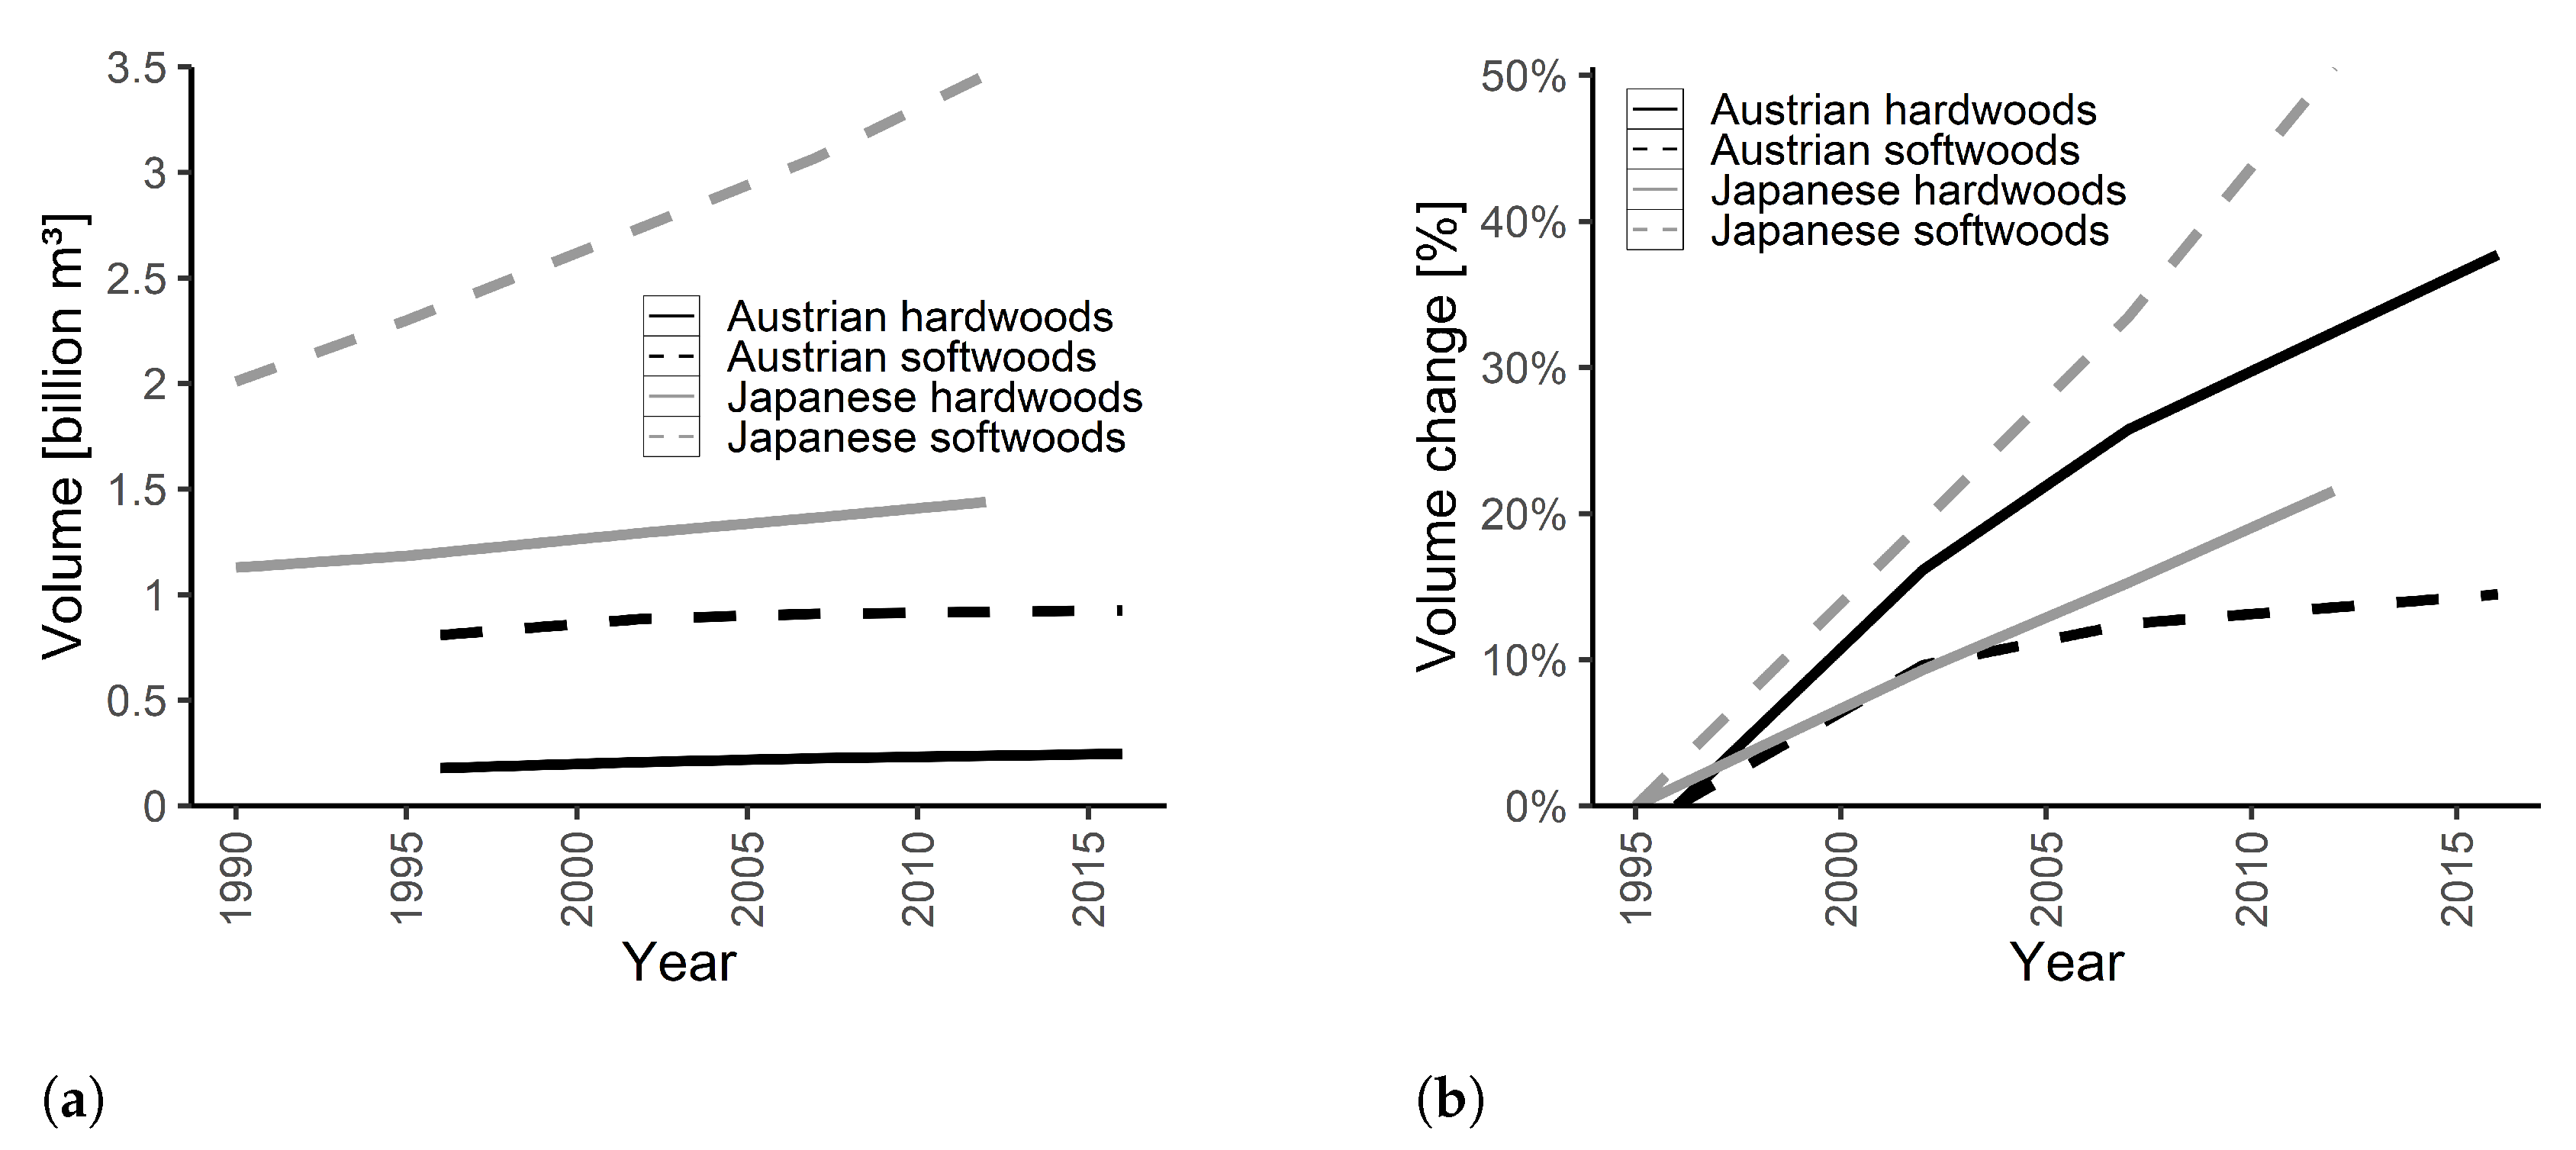
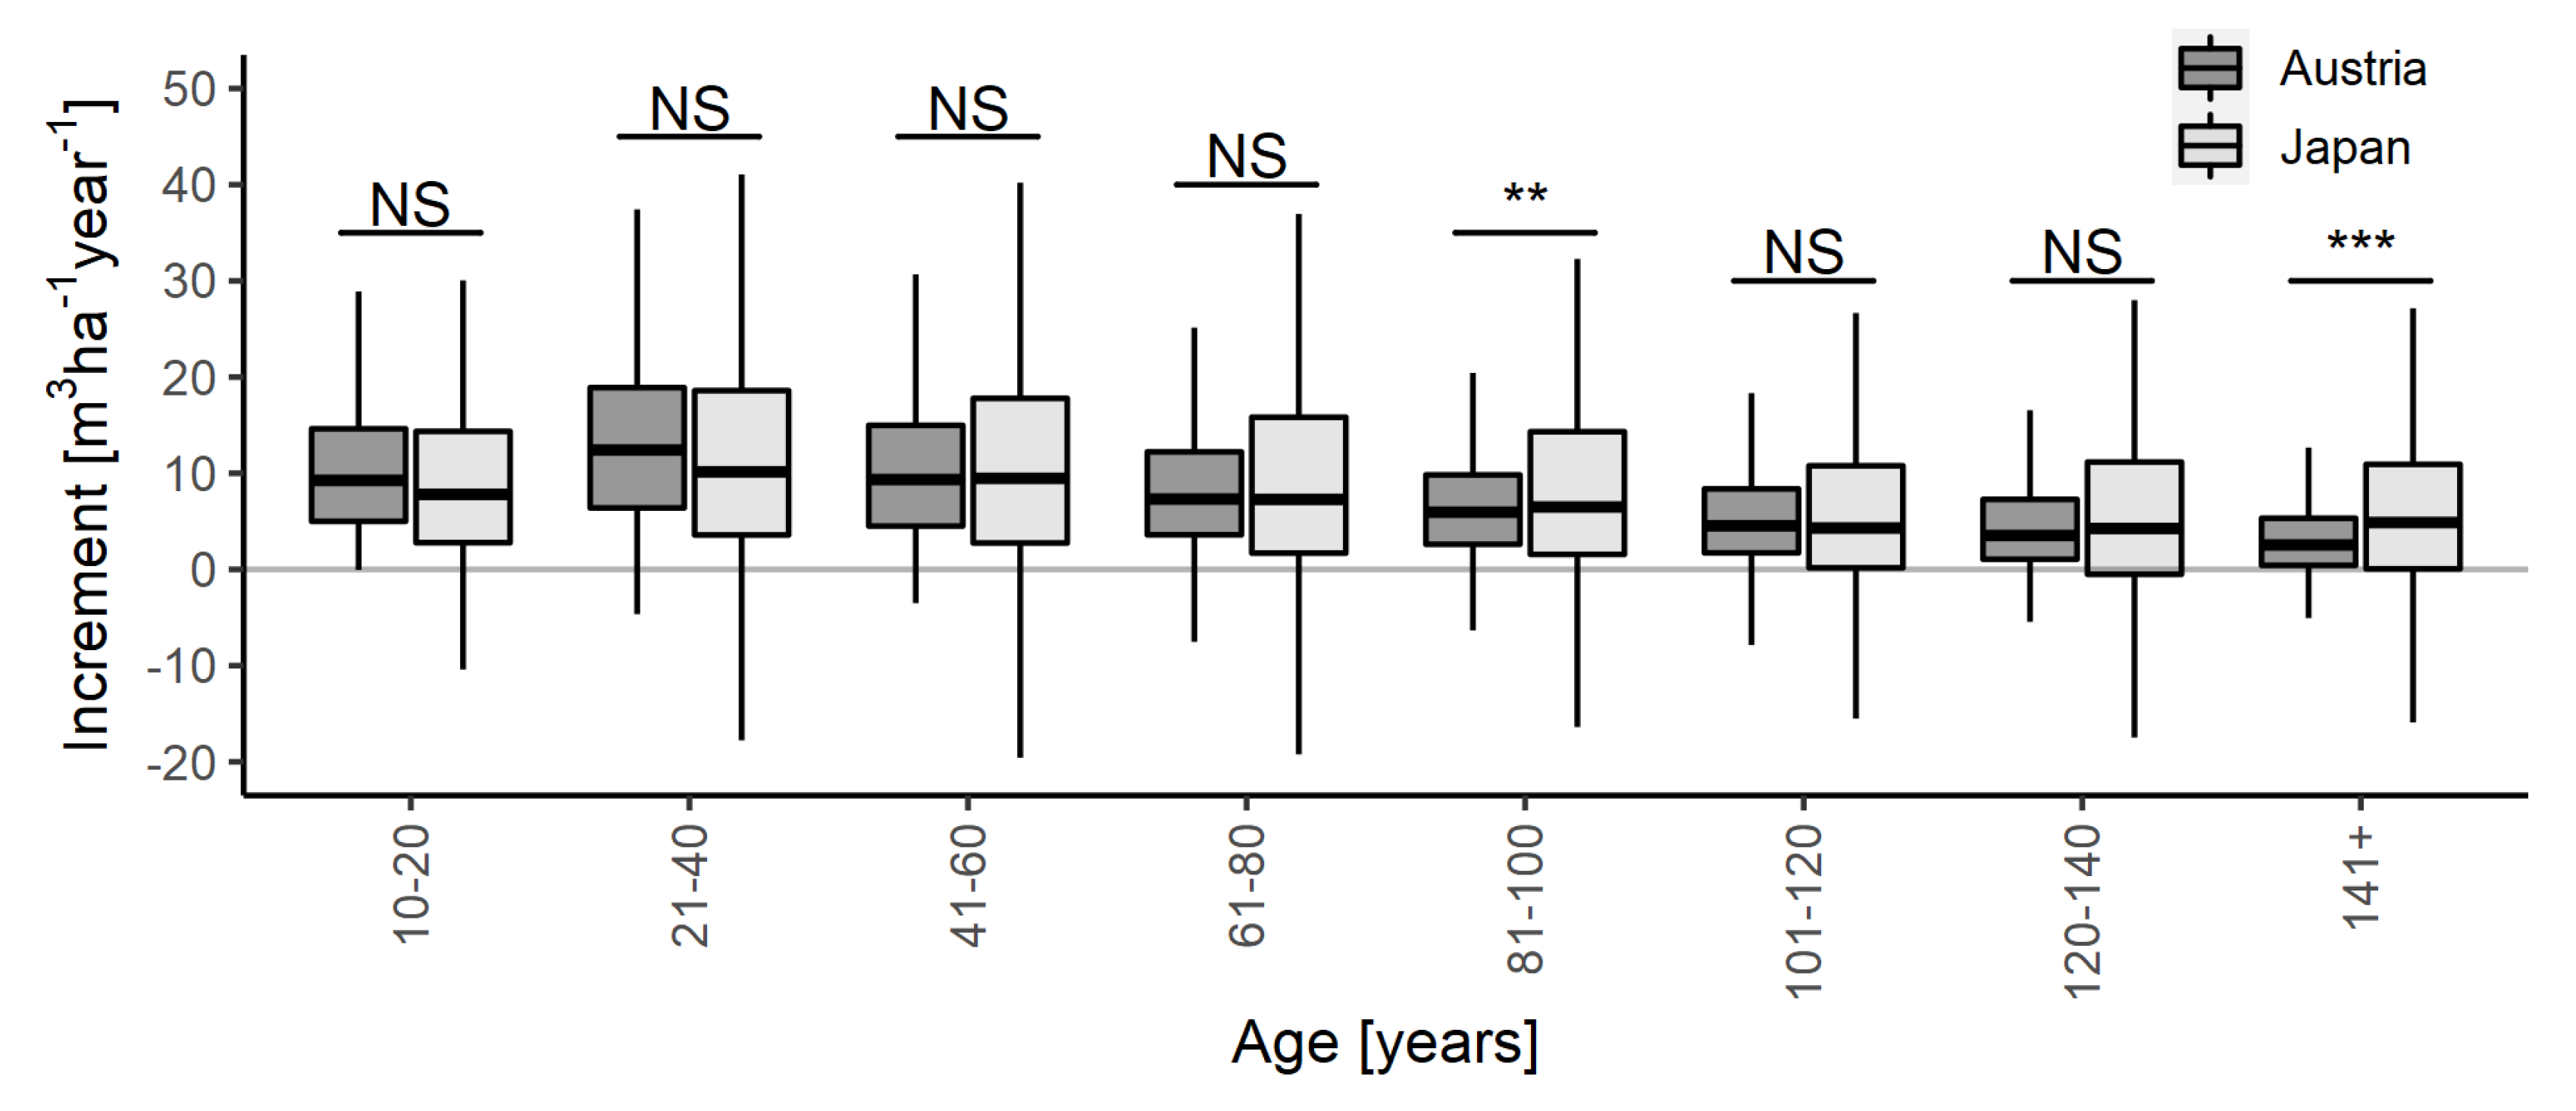
3.3. Volume Increment

As shown in Figure 6, the mean annual increment by age class in Austria ranges from 10.6 m 3 h a 1 y e a r 1 for the 10–20-year age class to 3.4 m 3 h a 1 y e a r 1 for the 141+-year age class. It peaks at 13.4 m 3 h a 1 y e a r 1 for the 21–40-year age class. In Japan, the lowest increment was 6.4 m 3 h a 1 y e a r 1 at 0–20 years (not shown in Figure 6). The increment peaked at 11.5 m 3 h a 1 y e a r 1 in the 21–40-year age class, the same as in Austria. The standard deviations in Japan ranged from 12.7 to 22.6 m 3 h a 1 y e a r 1 , whereas in Austria, they ranged from 4 to 9 m 3 h a 1 y e a r 1 . A Welch two-sample t-test revealed that the increment rates according to age class did not significantly differ by country, except for the age classes of 81–100 and 141+. In Japan, the lowest increment rates can be found in Hokkaido, as well as in the Kitakami highlands in northeast Honshu (Figure 1). In Austria, the lowest increments rates can be found in northeastern Austria and in subalpine areas (Figure 2).

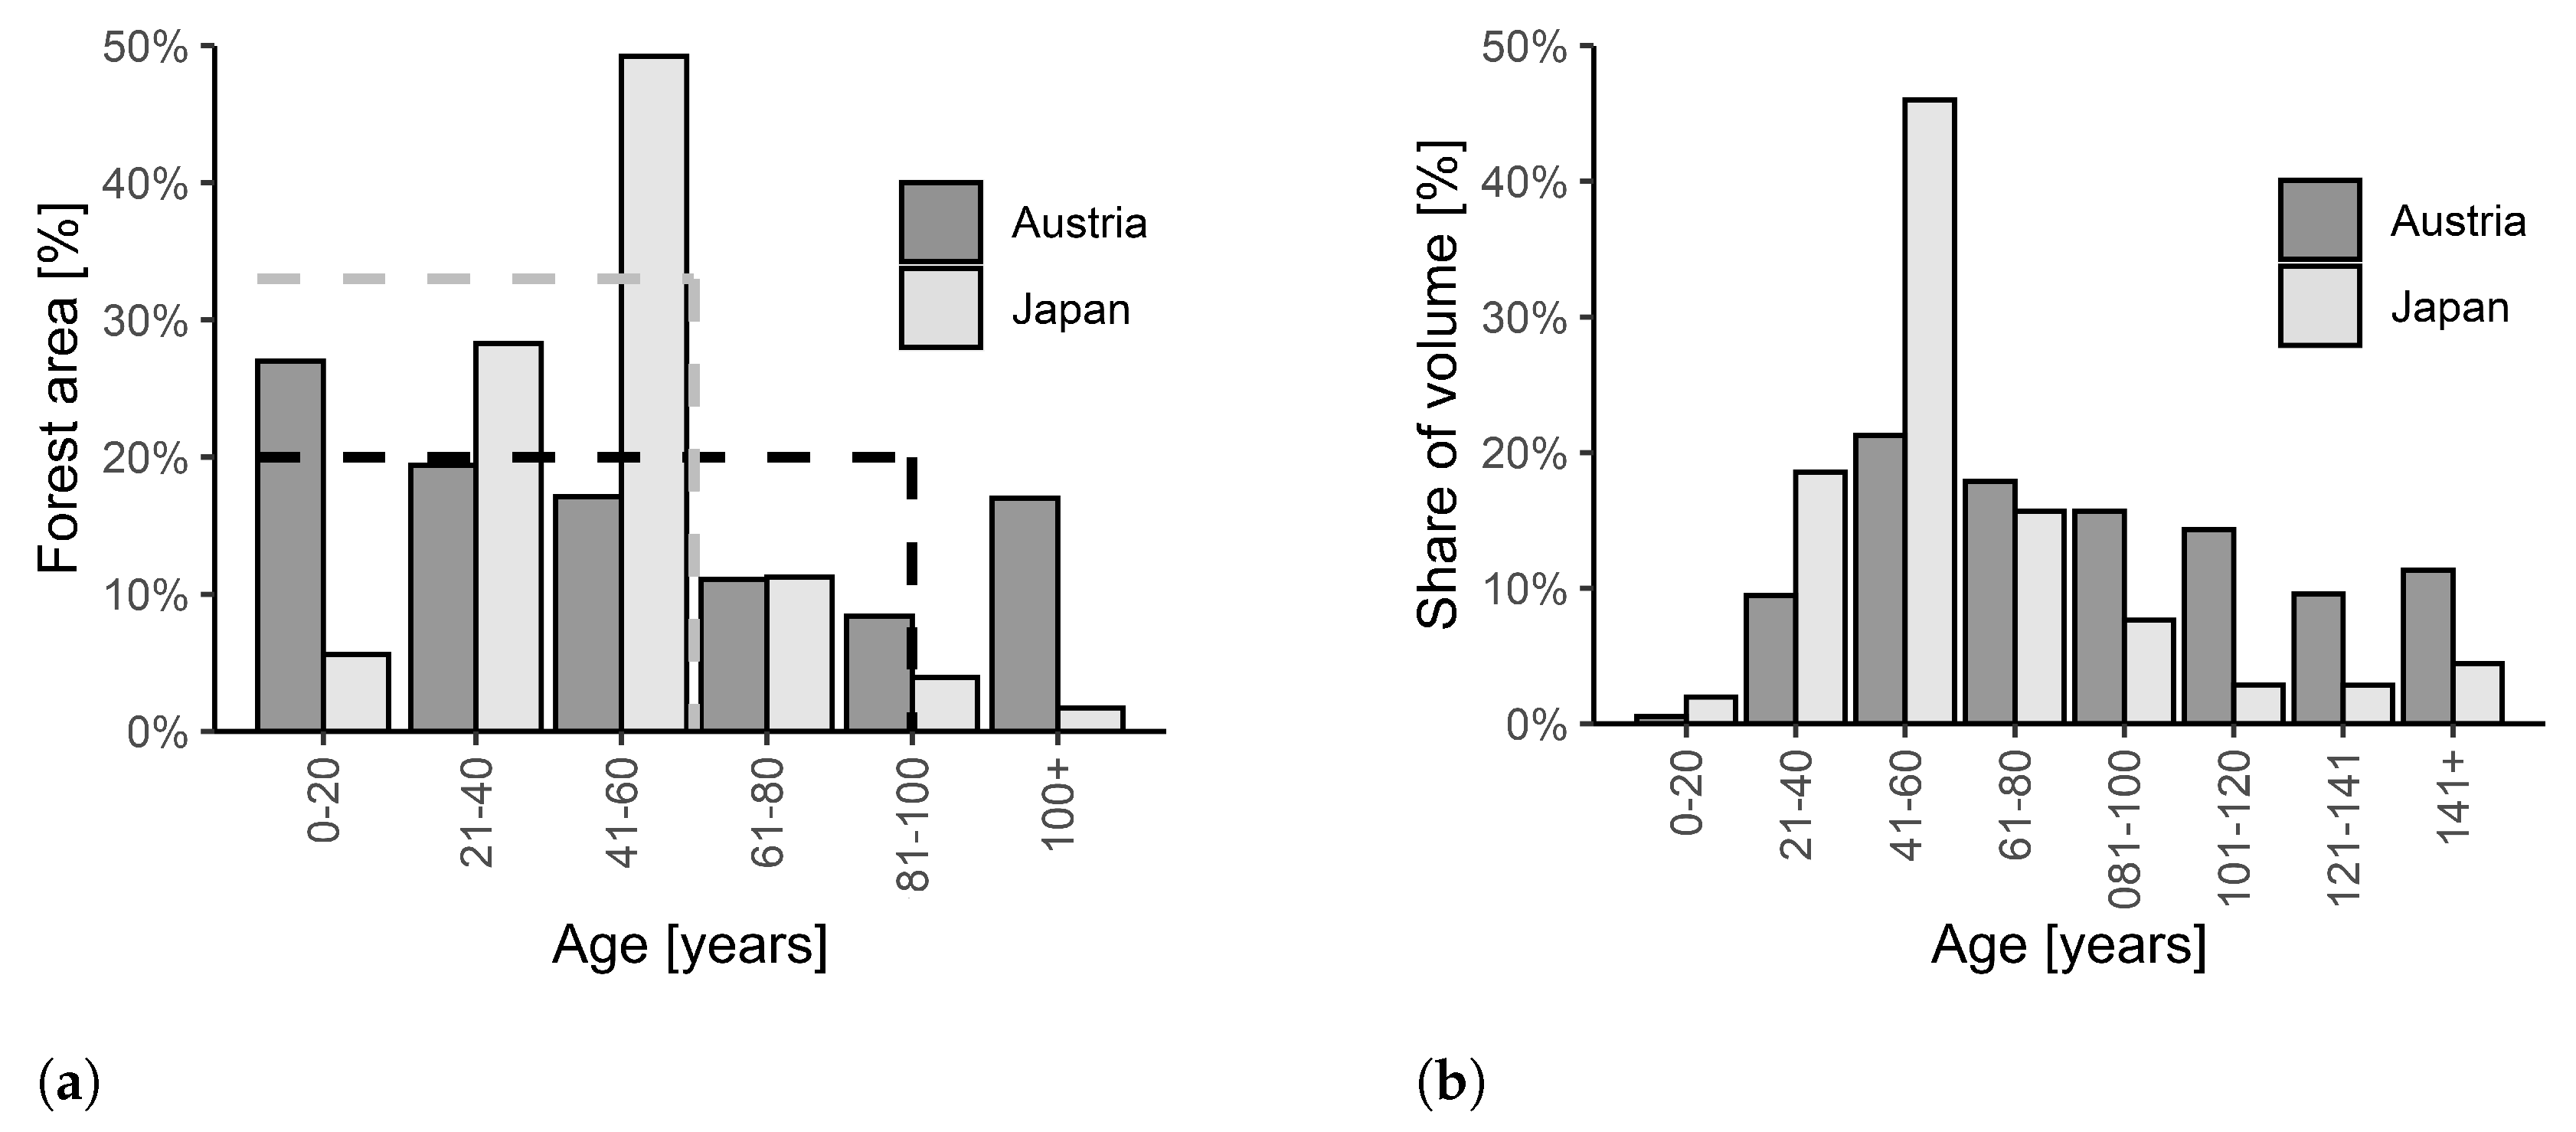
3.4. Age-Class Distribution

We then compared Japanese planted forests, which contain 59% of the total forest volume and cover 44% of the forest area with the Austrian “Ertragswald”, which indicates the intensively managed forest area and covers 80% of the Austrian forest area. Figure 7a shows the distribution of forest area by age classes for Japanese plantations and Austrian Ertragswald.
The dominant age class of the Japanese plantation forests is 41–60 years, with more than 4 million ha. This age class covers approximately 50% of the total standing timber volume (Figure 7b), which is nearly 3 billion m 3 . In Austria, the 41–60-year age class is also dominant, but only covers 20% of the total Austrian standing volume (Figure 7b). This suggests that, compared to Japan, Austrian forests have a much more balanced age-class distribution, which ensures more sustainable harvesting options.

3.5. Wood Demand and Supply

In 2018, the demand for wood in Japan reached 82.5 million m 3 . Domestic production was only 30.2 million m 3 ; 52.3 million m 3 were imported while 2.8 million m 3 were exported. Most of the imported wood was in the form of wood products, such as wood chips (21.4 million m 3 ) and sawn wood (9.4 million m 3 ) [13]. The domestic production of wood in Austria reached 25.5 million m 3 in 2018, and a total of 12.8 million m 3 was imported in the same year. Most of the imported wood consisted of sawlogs (7.5 million m 3 ) to sustain the large Austrian sawmill industry. In 2018, the sawmill industry demanded 20.6 million m 3 , 6.1 million m 3 of which were exported as sawn wood [22]. In Japan, 4993 sawmills produced 9.2 million m 3 sawn wood in 2015 [1]. In Austria, 1000 sawmills produced 10.4 million m 3 sawn wood in 2018 [22].

4. Discussion

Japan and Austria have a forest coverage of approximately 66% and 50%, respectively. Since 1970, the forest area has increased in Austria and remained relatively constant in Japan (Figure 3). Both countries have exhibited an increase in total stock, but there are distinct differences by country in the development of the stocking volume of hardwood versus softwood (Figure 4). In Austria, the increase in hardwood has resulted from the fact that sites formerly planted with softwood (P. abies) naturally regenerate with hardwoods, mainly F. sylvatica. In Japan, softwoods have increased, because the growth rates of softwood species are higher than those of hardwood species and harvesting intensity has been low (Figure 5). For example, the harvest in Japan has dropped since 1960 to a current utilization ratio (increment divided by harvest) of only 58% (Figure 5), whereas the Austrian forestry sector has continuously increased the utilization rate to more than 80%, primarily due to large investments in forest infrastructure, education, and support to promote forest management [3]. Harvesting operations in both countries are sustainable, as both utilization percentages are below 100%.
Japanese and Austrian forests are mainly located in mountainous regions, but they are in distinct climatic regions. One of the interesting questions of our study was whether there are any differences in the increment rates of Japan’s forests and the Austrian “Ertragswald”. As shown in Figure 6, the mean increment rates by age class are similar, which was surprising. Thus, low growth rates cannot be the reason for a low wood self-sufficiency rate in Japan. The median stocking volume per hectare in Japanese plantation forest is 28% higher than the stocking volume in the Austrian “Ertragswald”. These results are in contrast with the findings of Kuboyama et al. [14]. These suggested that the stocking volume per hectare in Austria is 21% higher than that in Japanese plantation forests. The different results may be explained by the fact that Kuboyama et al. [14] relied on forest resource data from the 2008 Annual Report on Trends in Forest and Forestry in Japan. Since then, high increments and low utilization percentage led to an increase in forest volume (Figure 4a).
The main commercial tree species in Austria (P. abies; Table 1) naturally regenerates, whereas C. japonica, the main species in Japan, does not [39]. The second most planted species in Japan (C. obtusa) barely regenerates under the canopy and prefers mineral soils and small gaps [40]. These ecological conditions led to a segregation between planted and natural forests in Japan, which did not happen in Austria, where major commercial tree species naturally regenerate.
In Japan, only 58% of the current annual increment (Figure 5b) is harvested. Austrian forest owners harvest 88% of the annual increment. This suggests that the forest sector in Japan has a very high harvesting potential. Increasing the harvest rate could increase the country’s self-sufficiency regarding wood, which would also create additional income for local farmers and forest companies. The growth rates for Japan were estimated with empirical models by the Japanese Forestry Agency and might be underestimated [25]. Thus, the harvesting potential could be even higher.
Within the next decade, the main silvicultural challenge within the Japanese forest sector is to achieve a balanced age structure within the forest plantations to ensure a sustained supply of forest products to the Japanese wood market, similar to that in Austria (Figure 7a). The unbalanced age-class distribution comes from large-scale afforestation efforts in the 1950s [4], with the result of more than 50% of the plantations being older than 50 years old (Figure 7b). These stands are ready to be harvested since they have reached the expected rotation length. Additional problems are that some of these forest areas lack accessibility for harvesting [8] due to the low forest road density [14,18] and that an increasing number of forest owners do not have adequate forest management knowledge [8]. Thus, further studies and initiatives within the Japanese forest sector are needed to enhance sustainable forest management by better understanding the ownership structure and developing forest road systems to provide up-to-date mechanized harvesting systems.

5. Conclusions

This study shows that Japanese forests store a large number of forest resources which would be accessible for harvesting in the near future. Annual wood increments do not significantly differ between Austria and Japan, but Austria utilizes a higher percentage of this increment. This results in a higher wood self-sufficiency rate in Austria. In Japan, actions are needed to avoid risks from over-aging stands, but also to continuously regenerate aging stands to achieve a balanced age structure. This will require investments and efforts in silvicultural management practices, infrastructure, and education, but it should result in a boost for the Japanese forest and timber industry by creating jobs and income and will increase the wood self-sufficiency rate of Japan.

Author Contributions

Conceptualization, M.L., M.N. and H.H.; formal analysis, M.L., M.N. and T.E.; investigation, M.L., K.H., M.N. and T.E.; methodology, M.L. and M.N.; resources, T.E. and M.N.; software, M.L.; validation: M.N. and T.E., data curation, T.E., M.N., K.H. and M.L.; writing—original draft preparation, M.L.; writing—review and editing, M.N., T.E., K.H. and H.H.; visualization, M.L.; supervision, H.H. All authors have read and agreed to the published version of the manuscript.

Funding

This research received no external funding.

Institutional Review Board Statement

Not applicable.

Informed Consent Statement

Not applicable.

Data Availability Statement

Additional details of the ANFI and JNFI can be obtained from the websites of the Austrian Federal Research and Training Centre for Forests (http://bfw.ac.at/rz/wi.home, accessed on 6 June 2022) and the Japanese National Forest Inventory (https://www.rinya.maff.go.jp/j/keikaku/tayouseichousa/, accessed on 6 June 2022). The English Annual Report on Forests and Forestry in Japan can be found at https://www.maff.go.jp/e/data/publish/index.html, accessed on 6 June 2022.

Acknowledgments

I would like to express my deepest thanks to Shinji Yamamoto for teaching me a lot about Japanese forestry and for taking me to Kamaishi to meet the Kamamorikumi Association of Private Forest Owners. I would also like to express my gratitude to Eduard Hochbichler and the people at the Institute of Silviculture, who gave me the possibility of traveling to Iwate University back in 2019. Finally, I would like to thank Christoph Pucher for their valuable feedback.

Conflicts of Interest

The authors declare no conflict of interest.

References

  1. FA. Annual Report on Trends in Forest and Forestry in Japan. In Summary Fiscal Year 2017; Ministry of Agriculture, Forestry and Fisheries: Tokyo, Japan, 2017. [Google Scholar]
  2. Lundbäck, M.; Persson, H.; Häggström, C.; Nordfjell, T. Global Analysis of the Slope of Forest Land. For. Int. J. For. Res. 2021, 94, 54–69. [Google Scholar] [CrossRef]
  3. BMLFUW. Sustainable Forest Management Report—Austrian Forest Report 2015; Forest Report; Austrian Federal Ministry of Agriculture, Forestry, Environment and Water Management: Vienna, Austria, 2015.
  4. Fujiwara, M. Silviculture in Japan. In Forestry and the Forest Industry in Japan; Iwai, Y., Ed.; UBC Press: Vancouver, BC, Canada, 2002; pp. 10–23. [Google Scholar]
  5. Akao, K.i. Private Forestry. In Forestry and the Forest Industry in Japan; Iwai, Y., Ed.; UBC Press: Vancouver, BC, Canada, 2002; pp. 24–40. [Google Scholar]
  6. FA. State of Japan’s Forests and Forest Management; Country Report of Japan to the Montreal Process 3; Forest Agency: Tokyo, Japan, 2019.
  7. Hein, S.; Kimura, S.; Bastian, K. Forestry and the Wood Industry in Japan—Part 2. Holz-Zentralblatt 2014, 19, 488–489. (In German) [Google Scholar]
  8. Hein, S.; Kimura, S.; Bastian, K. Forestry and the Wood Industry in Japan—Part 3. Holz-Zentralblatt 2014, 19, 515–516. (In German) [Google Scholar]
  9. Masaki, T.; Oguro, M.; Yamashita, N.; Otani, T.; Utsugi, H. Reforestation Following Harvesting of Conifer Plantations in Japan: Current Issues from Silvicultural and Ecological Perspectives. REFORESTA 2017, 3, 125–142. [Google Scholar] [CrossRef] [Green Version]
  10. Matsushita, K.; Yoshida, Y.; Senda, T. Household Composition and Aging of Forest Owners in Japan. Austrian J. For. Sci. 2017, 134, 101–139. [Google Scholar]
  11. Fuchigami, Y.; Hara, K.; Uwasu, M.; Kurimoto, S. Analysis of the Mechanism Hindering Sustainable Forestry Operations: A Case Study of Japanese Forest Management. Forests 2016, 7, 182. [Google Scholar] [CrossRef] [Green Version]
  12. Hirata, Y.; Matsumoto, M.; Iehara, T. Japanese National Forest Inventory and Its Spatial Extension by Remote Sensing. In Proceedings of the Eighth Annual Forest Inventory and Analysis Symposium, Monterey, CA, USA, 16–19 October 2006; pp. 13–17. [Google Scholar]
  13. FA. Annual Report on Trends in Forest and Forestry in Japan. In Summary Fiscal Year 2019; Ministry of Agriculture, Forestry and Fisheries: Tokyo, Japan, 2019. [Google Scholar]
  14. Kuboyama, H.; Hori, Y.; Ishizaki, R. Changes in log production and distribution structure in Austria: Focusing on small and medium-sized foresters in Styria. Jpn. For. Econ. Soc. 2012, 58, 37–47. (In Japanese) [Google Scholar] [CrossRef]
  15. Nemestothy, S.; Grabner, M. Austrian Logging: A Historical Account of the Time of Felling and Debarking, and Transportation Practices. Int. J. Wood Cult. 2021, 1, 180–195. [Google Scholar] [CrossRef]
  16. Kajiyama, K. Forestry in Finland and Austria, Connecting small-scale ownership and large-scale demand—Structural analysis of Japanese forestry in comparison with advanced European forestry areas. Hayashi Keikyo Mon. Rep. 2002, 2–20. (In Japanese) [Google Scholar]
  17. Shirai, Y. Forest Roads in Austria. J. Jpn. For. Eng. Soc. 2007, 22, 205–210. (In Japanese) [Google Scholar]
  18. FA. Annual Report on Trends in Forest and Forestry in Japan. In Summary Fiscal Year 2009; Ministry of Agriculture, Forestry and Fisheries: Tokyo, Japan, 2009. [Google Scholar]
  19. Kuboyama, H. Recent Changes in Austrian Forestry—A Comparison with Japan. For. Sci. 2013, 68, 9–12. (In Japanese) [Google Scholar] [CrossRef]
  20. Speidel, G. The Law of Mass Per Piece and Its Importance for the International Comparison of Performance in Forest Work; Schriftenreihe des Instituts für Forstliche Arbeitswissenschaft, Universität Hamburg: Reinbek, Germany, 1952. [Google Scholar]
  21. Fick, S.E.; Hijmans, R.J. WorldClim 2: New 1-Km Spatial Resolution Climate Surfaces for Global Land Areas. Int. J. Climatol. 2017, 37, 4302–4315. [Google Scholar] [CrossRef]
  22. BMLRT. Austrian Market Report 2020; Statement, Federal Ministry of Agriculture, Regions and Tourism Directorate-General III—Forestry and Sustainability: Vienna, Austria, 2020.
  23. FRDS. Brief on National Forest Inventory NFI—Japan; NFI-Brief MAR-SFM Working Paper 19/2007; Forestry Department of the Food and Agriculture Organization of the United Nations: Rome, Italy, 2007. [Google Scholar]
  24. Hirata, Y.; Hosoda, K.; Nishizono, T.; Kitahara, F.; Nagame, I.; Nakamura, M. The Japanese National Forest Inventory. In National Forest Inventories: Assessment of Wood Availability and Use; Vidal, C., Alberdi, I., Hernández, L., Redmond, J.J., Eds.; Springer International Publishing: Berlin, Germany, 2016; pp. 507–520. [Google Scholar] [CrossRef]
  25. Egusa, T.; Kumagai, T.; Shiraishi, N. Carbon Stock in Japanese Forests Has Been Greatly Underestimated. Sci. Rep. 2020, 10, 7895. [Google Scholar] [CrossRef] [PubMed]
  26. van Laar, A.; Akça, A. Forest Mensuration, 2nd ed.; Managing Forest Ecosystems; Springer: Dordrecht, The Netherlands, 2007. [Google Scholar] [CrossRef]
  27. Braun-Blanquet, J. Plant Sociology; Springer: Vienna, Austria, 1964. [Google Scholar] [CrossRef]
  28. Schieler, K.; Hauk, E. Instructions for Field Work—Austrian National Forest Inventory 2000–2002, 2001 ed.; FBVA: Vienna, Austria, 2001. (In German) [Google Scholar]
  29. Bruce, D. Yield Differences between Research Plots and Managed Forests. J. For. 1977, 75, 14–17. [Google Scholar] [CrossRef]
  30. Bitterlich, W. Angle-Count Sampling. Ph.D. Thesis, Hochschule für Bodenkultur, Vienna, Austria, 1949. [Google Scholar]
  31. Schieler, K. Incerment Calculation Methods of the Austrian National Forst Inventory. Ph.D. Thesis, University of Natural Resources and Life Sciences, Vienna, Austria, 1997. [Google Scholar]
  32. Gabler, K.; Schadauer, K. Methods of the Austrian Forest Inventory 2000/02—Origins, Approaches, Design, Sampling, Data Models, Evaluation and Calculation of Standard Error. BFW-Berichte; Schriftenreihe des Bundesforschungs- und Ausbildungszentrum für Wald: Vienna, Austria, 2008; Volume 142, pp. 1–121. [Google Scholar]
  33. BMLFUW. Data Collection for the Austrian Forest Report 2015; Forest Report; Austrian Federal Ministry of Agriculture, Forestry, Environment and Water Management: Vienna, Austria, 2015.
  34. R Core Team. R: A Language and Environment for Statistical Computing; R Foundation for Statistical Computing: Vienna, Austria, 2021. [Google Scholar]
  35. Wickham, H. Ggplot2: Elegant Graphics for Data Analysis; Springer: New York, NY, USA, 2016. [Google Scholar]
  36. Yamaya, K.; Kato, R.; Mori, M.; Goto, K. Growth Conditions of the Plantations of Chamaecyparis Obtusa and Its Silvicultural Problems in the Tohoku District, Japan. Bull. For. For. Prod. Res. Inst. Jpn. 1984, 325, 1–96. [Google Scholar]
  37. Fujimori, T. Ecological and Silvicultural Strategies for Sustainable Forest Management, 1st ed.; Elsevier: Amsterdam The Netherlands; New York, NY, USA, 2001. [Google Scholar]
  38. Futai, K. Pine Wilt in Japan: From First Incidence to the Present. In Pine Wilt Disease; Zhao, B.G., Futai, K., Sutherland, J.R., Takeuchi, Y., Eds.; Springer: Tokyo, Japan, 2008; pp. 5–12. [Google Scholar] [CrossRef]
  39. Savill, P. Cryptomeria japonica (Thunb. Ex L.f.) D.Don Japanese Red Cedar, or Sugi: Silviculture and Properties. Q. J. For. 2015, 109, 97–102. [Google Scholar]
  40. Yamamoto, S.I. Regeneration Ecology of Chamaecyparis obtusa and Chamaecyparis pisifera (Hinoki and Sawara Cypress), Japan. In Coastally Restricted Forests; Laderman, A.D., Ed.; Biological Resources Managment Series; Oxford University Press: Oxford, UK, 1998; pp. 101–110. [Google Scholar]
Figure 1. Dominant tree species in plantation forests in Japan. Jittering was applied to the points to reduce overlapping. Other hardwood species and softwood species were pooled into “hardwoods” and “softwoods”. The sizes of the circles show the approximate mean annual increment per plot. Data are from the Japanese National Forest Inventory (2013). The red triangle indicates Tokyo.
Forests 13 00891 g001
Figure 2. Dominant species in Austria. Jittering was applied to the points to reduce overlapping. Other hardwood species and softwood species were pooled into “hardwoods” and “softwoods”. The sizes of the circles show the approximate mean annual increment per plot. Data are from the Austrian National Forest Inventory (2009). The red triangle indicates Vienna.
Forests 13 00891 g002
Figure 3. Change in forest area since 1970 according to data from the Austrian National Forest Inventory (2018), BMLFUW (2015), and Forest Agency (2017).
Forests 13 00891 g003
Figure 4. Total volume (a) and volume change since 1995 (Japan) and 1996 (Austria) (b) of hardwoods and softwoods according to data from the Austrian National Forest Inventory (1996, 2002, 2009, 2018) and Forest Agency (2019b).
Forests 13 00891 g004
Figure 5. The total harvest (a) and forest utilization percentage (harvest divided by increment) (b) according to data from the Austrian National Forest Inventory (1996, 2002, 2009, 2018) and Forest Agency (2019a, 2019b).
Forests 13 00891 g005
Figure 6. Increment according to age class. Mean increments were tested (Welch two-sample t-test) for significant differences in the same age class between Austria and Japan (NS: p > 0.05, ** p ≤ 0.01, *** p ≤ 0.001). Trees younger than 10 years old were excluded because DBHs smaller than 5 cm are not measured in the ANFI. The black line that divides the box into two parts represents the median. The ends of the box show the lower (bottom) and upper (top) quartiles. The vertical lines show the lowest and highest values, excluding potential outliers. Data are from the Austrian National Forest Inventory (2002, 2009) and Japanese National Forest Inventory (2007, 2011).
Forests 13 00891 g006
Figure 7. Percentage of forest area (planted forests and Ertragswald) according to age class (a) and the percentage of volume of all forests according to age class (b). Dotted lines in (a) show the perfect distribution for Cryptomeria japonica in Japan and Picea abies in Austria. Data are from the Austrian National Forest Inventory (2018) and Japanese National Forest Inventory (2013).
Forests 13 00891 g007
Table 1. Tree species and their respective percentage of the total national standing volume. Data are from the Austrian National Forest Inventory (2018) and Japanese National Forest Inventory (2013).
Species in
Austria
English/Japanese NameVolume
(%)
   Picea abies (L.) H.Karst.Norway spruce60.4
   Fagus sylvatica L.European beech10.0
   Larix decidua Mill.European larch6.6
   Pinus sylvestris L.Scots pine6.2
   Abies alba Mill.Silver fir4.4
   Other softwoods1.4
   Other hardwoods11
Japan
   Cryptomeria japonica L.f.Sugi35.7
   Chamaecyparis obtusa Siebold and Zucc.Hinoki15.2
   Abies sachalinensis F.SchmidtTodomatsu6.2
   Pinus densiflora SieboldAkamatsu5.0
   Quercus serrata MurrayKonara5.5
   Fagus crenata BlumeBuna4.2
   Larix kaempferi Lamb.Karamatsu3.9
   Quercus crispula BlumeMizunara3.1
   Other softwoods3.0
   Other hardwoods18.2
Publisher’s Note: MDPI stays neutral with regard to jurisdictional claims in published maps and institutional affiliations.

