
Analysis of Forest Landscape Preferences and Emotional Features of Chinese Forest Recreationists Based on Deep Learning of Geotagged Photos


Abstract
1. Introduction
2. Case Sites and Datasets
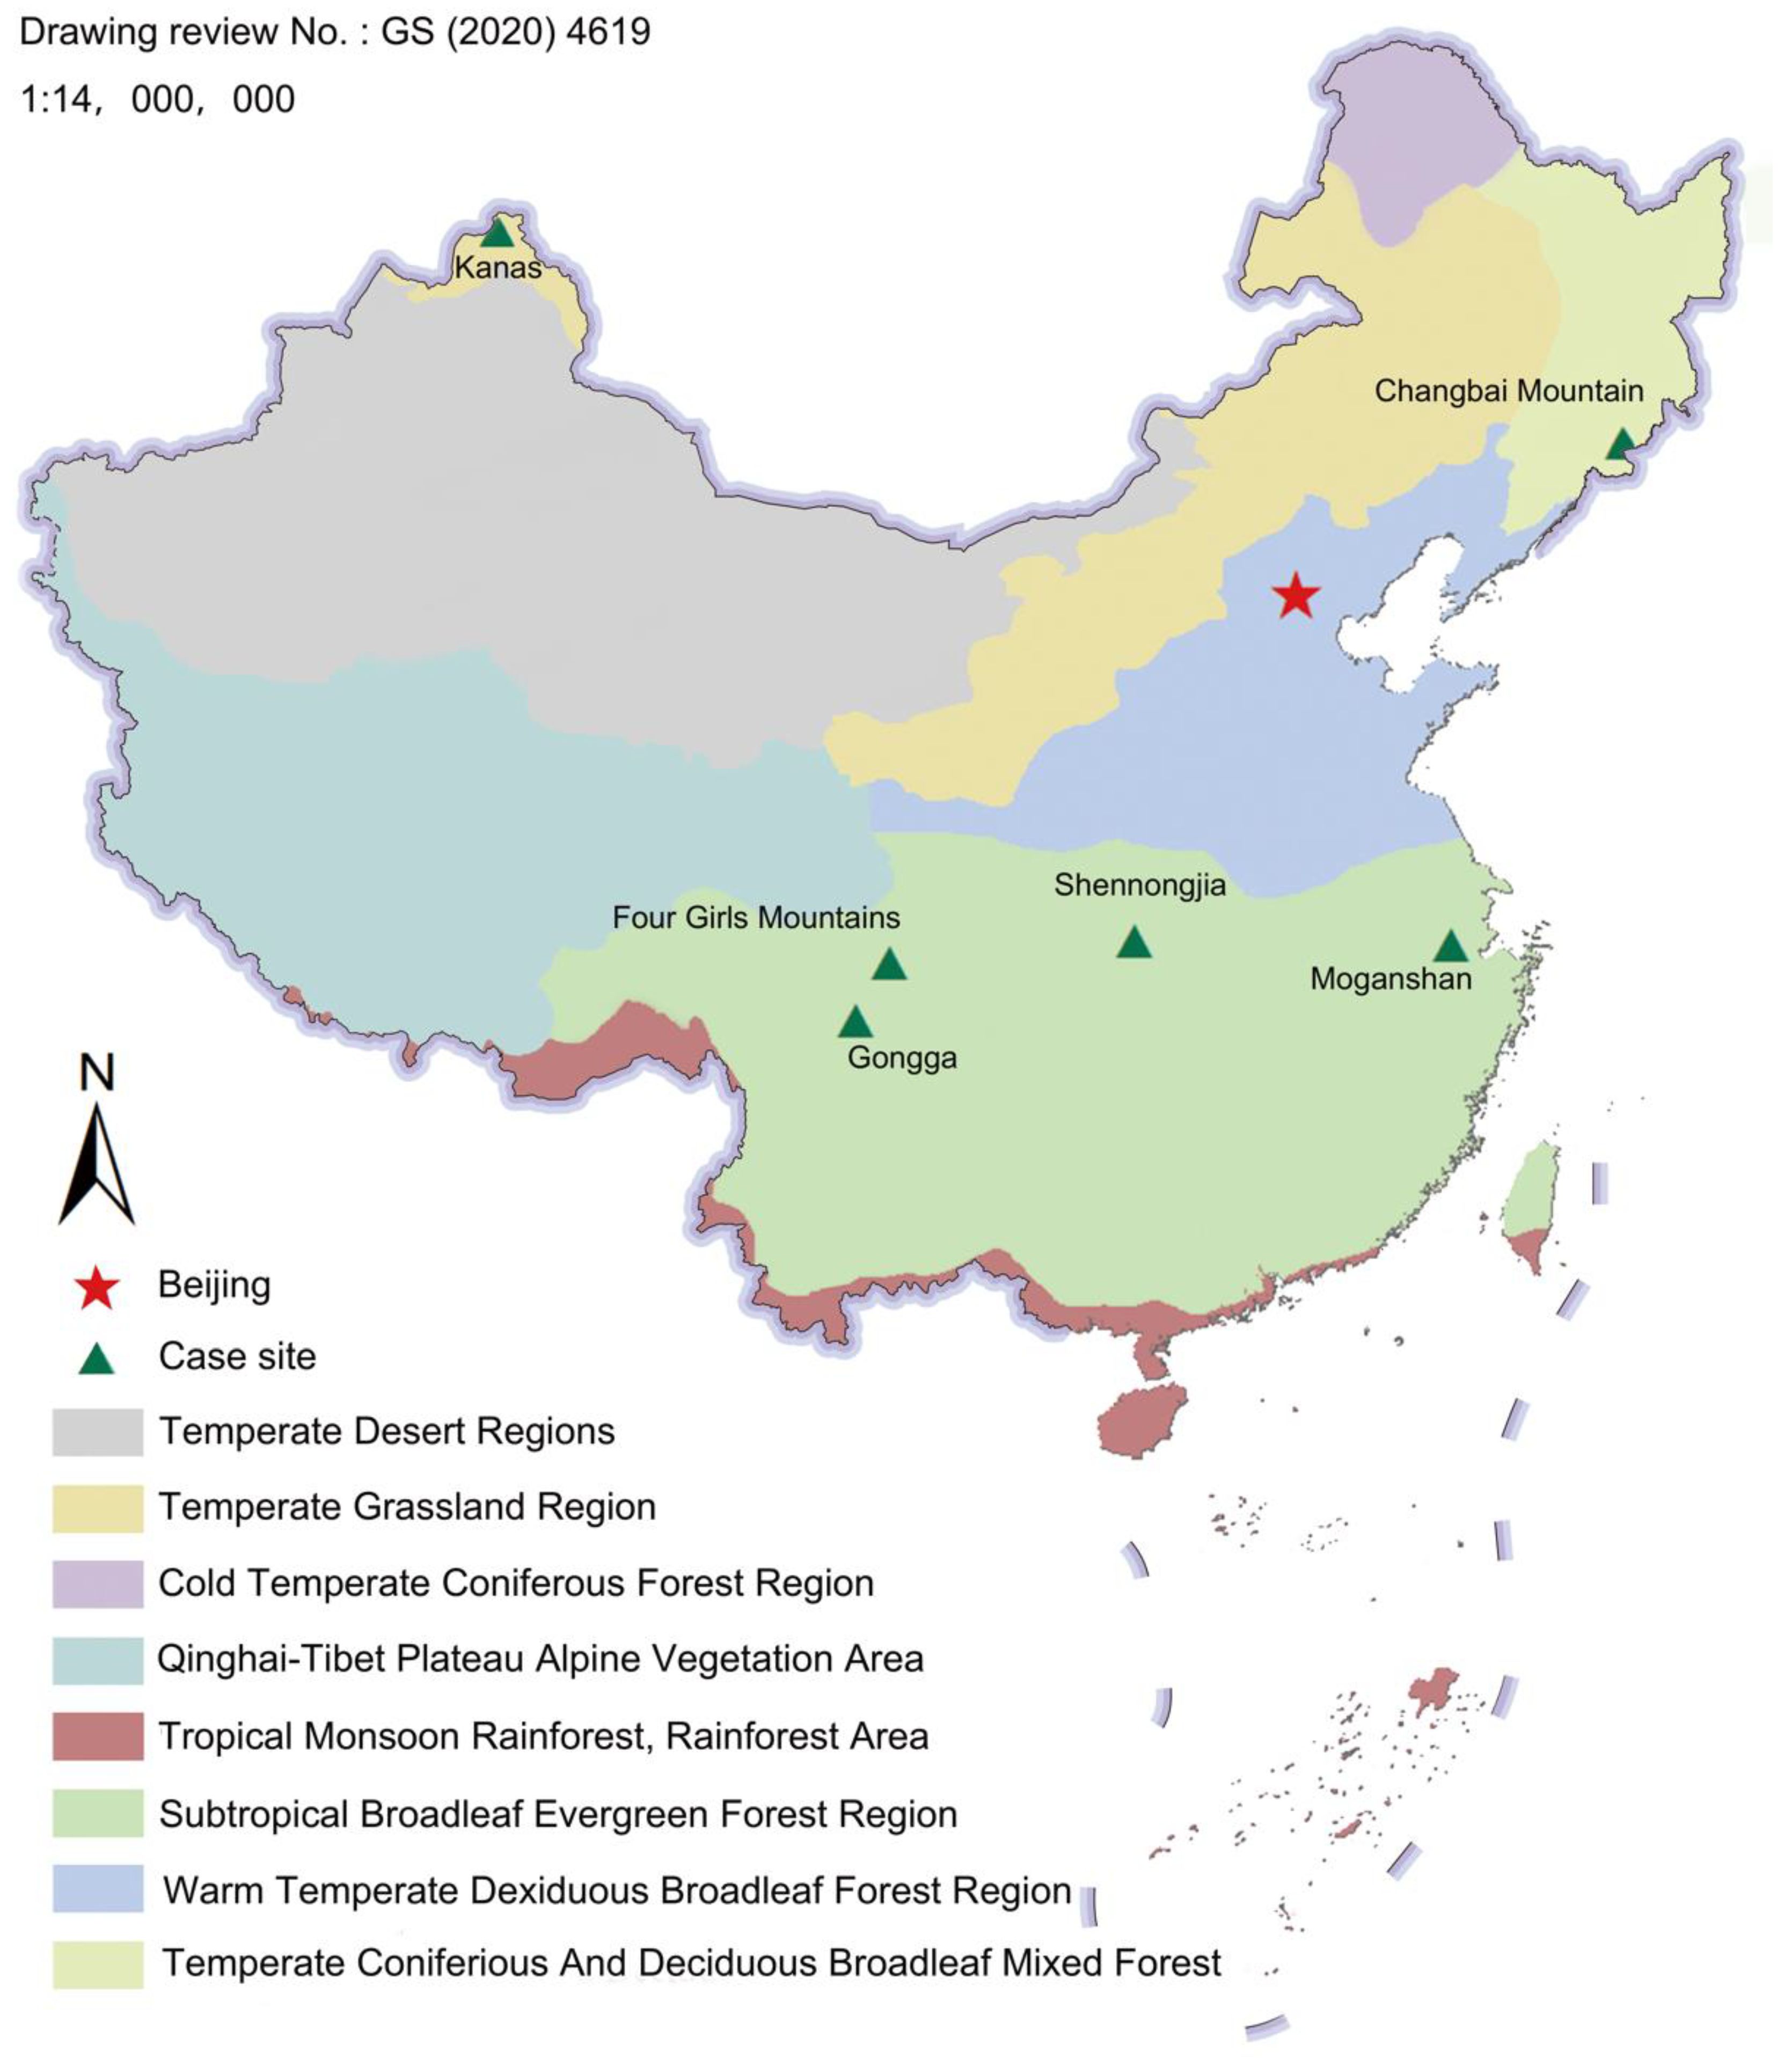
2.1. Case Sites
2.2. Datasets
3. Methods
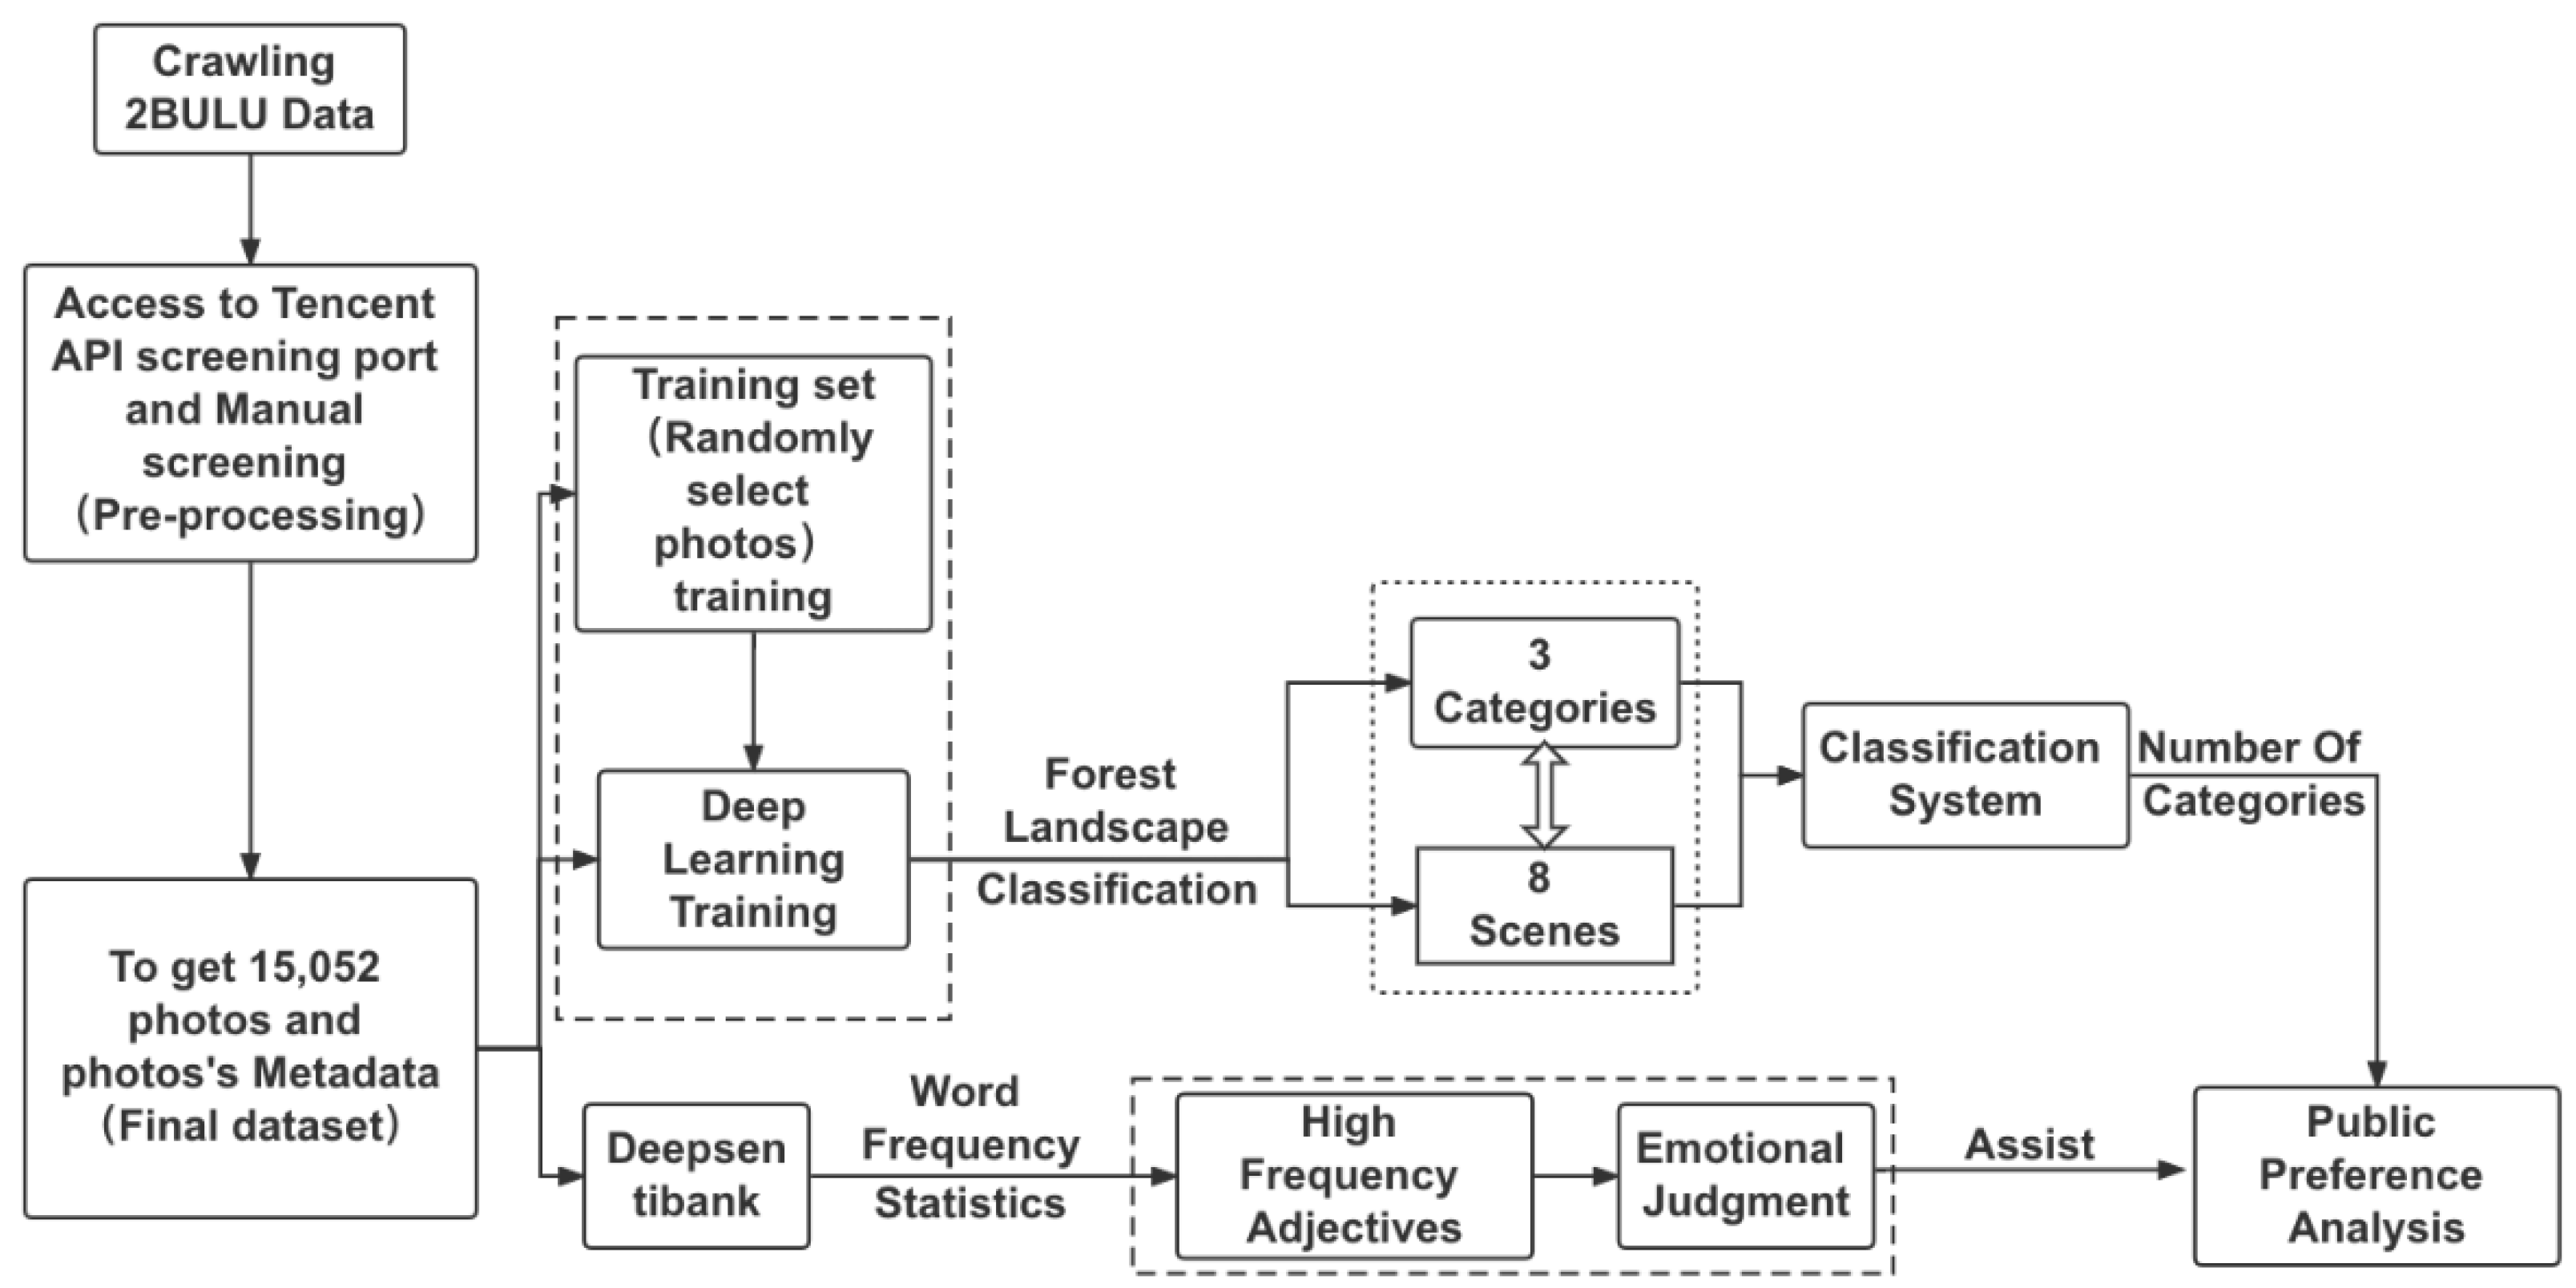
3.1. Research Flow
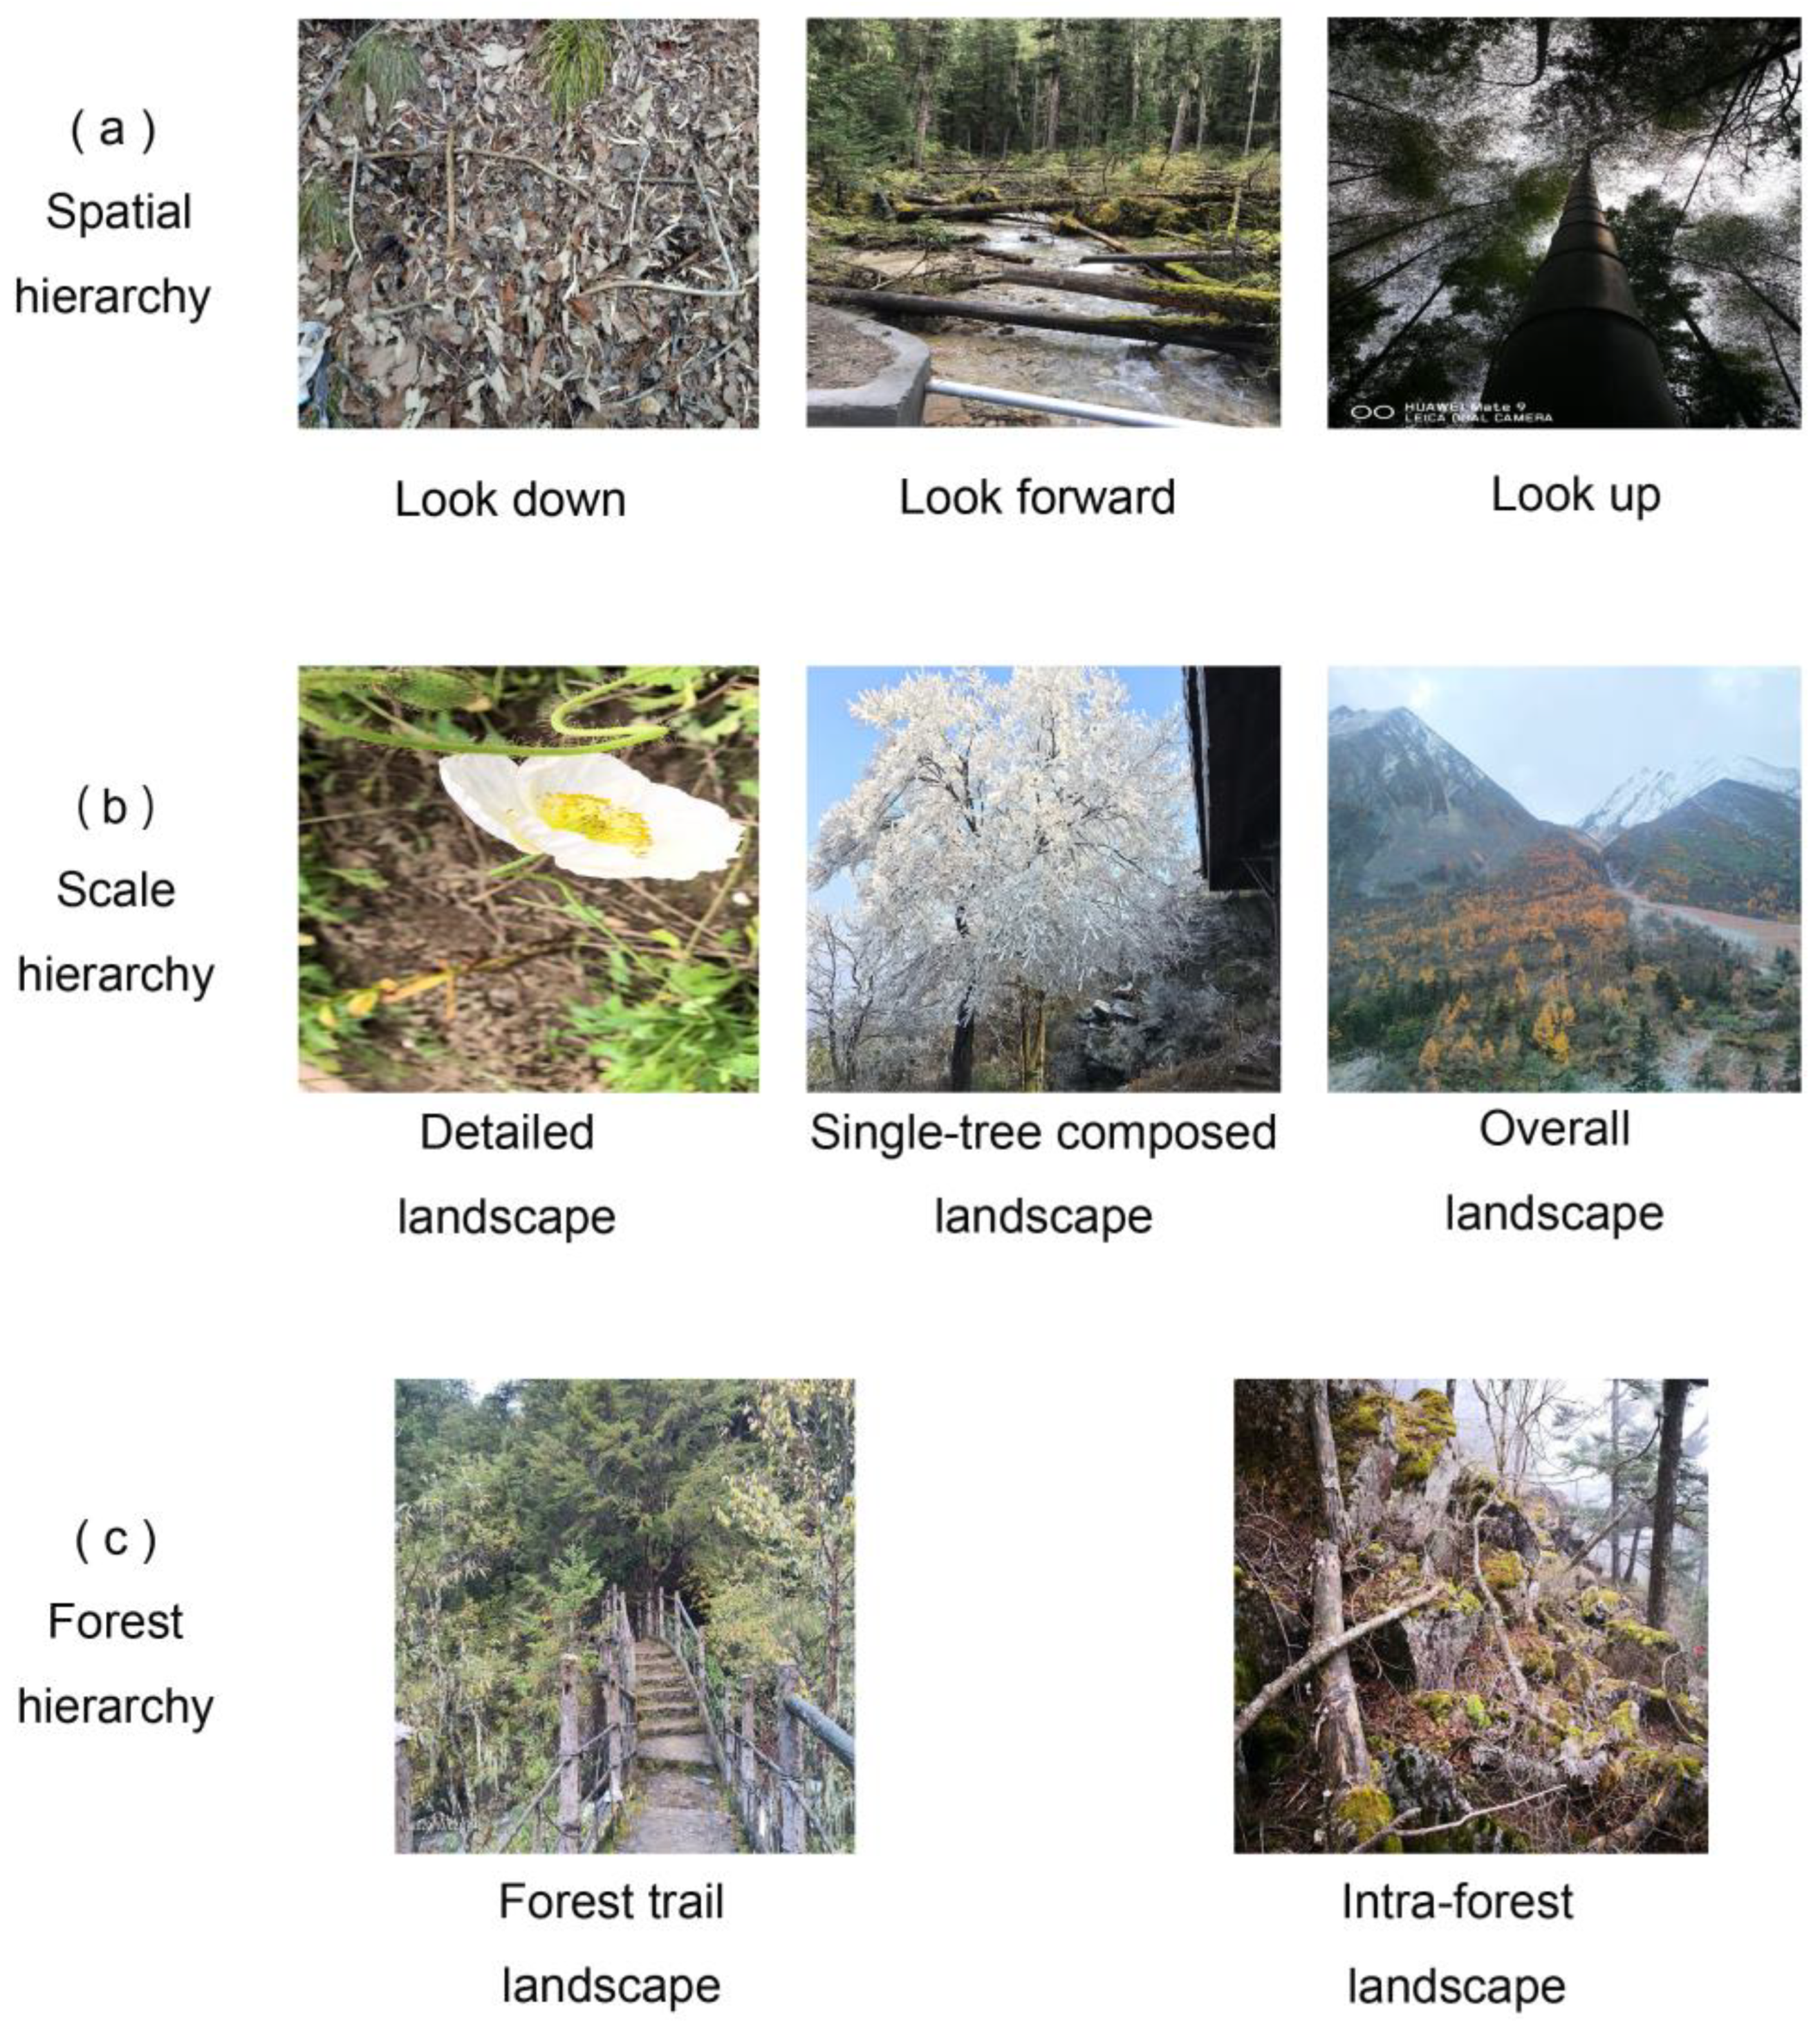
3.2. Forest Landscape Photo Classification
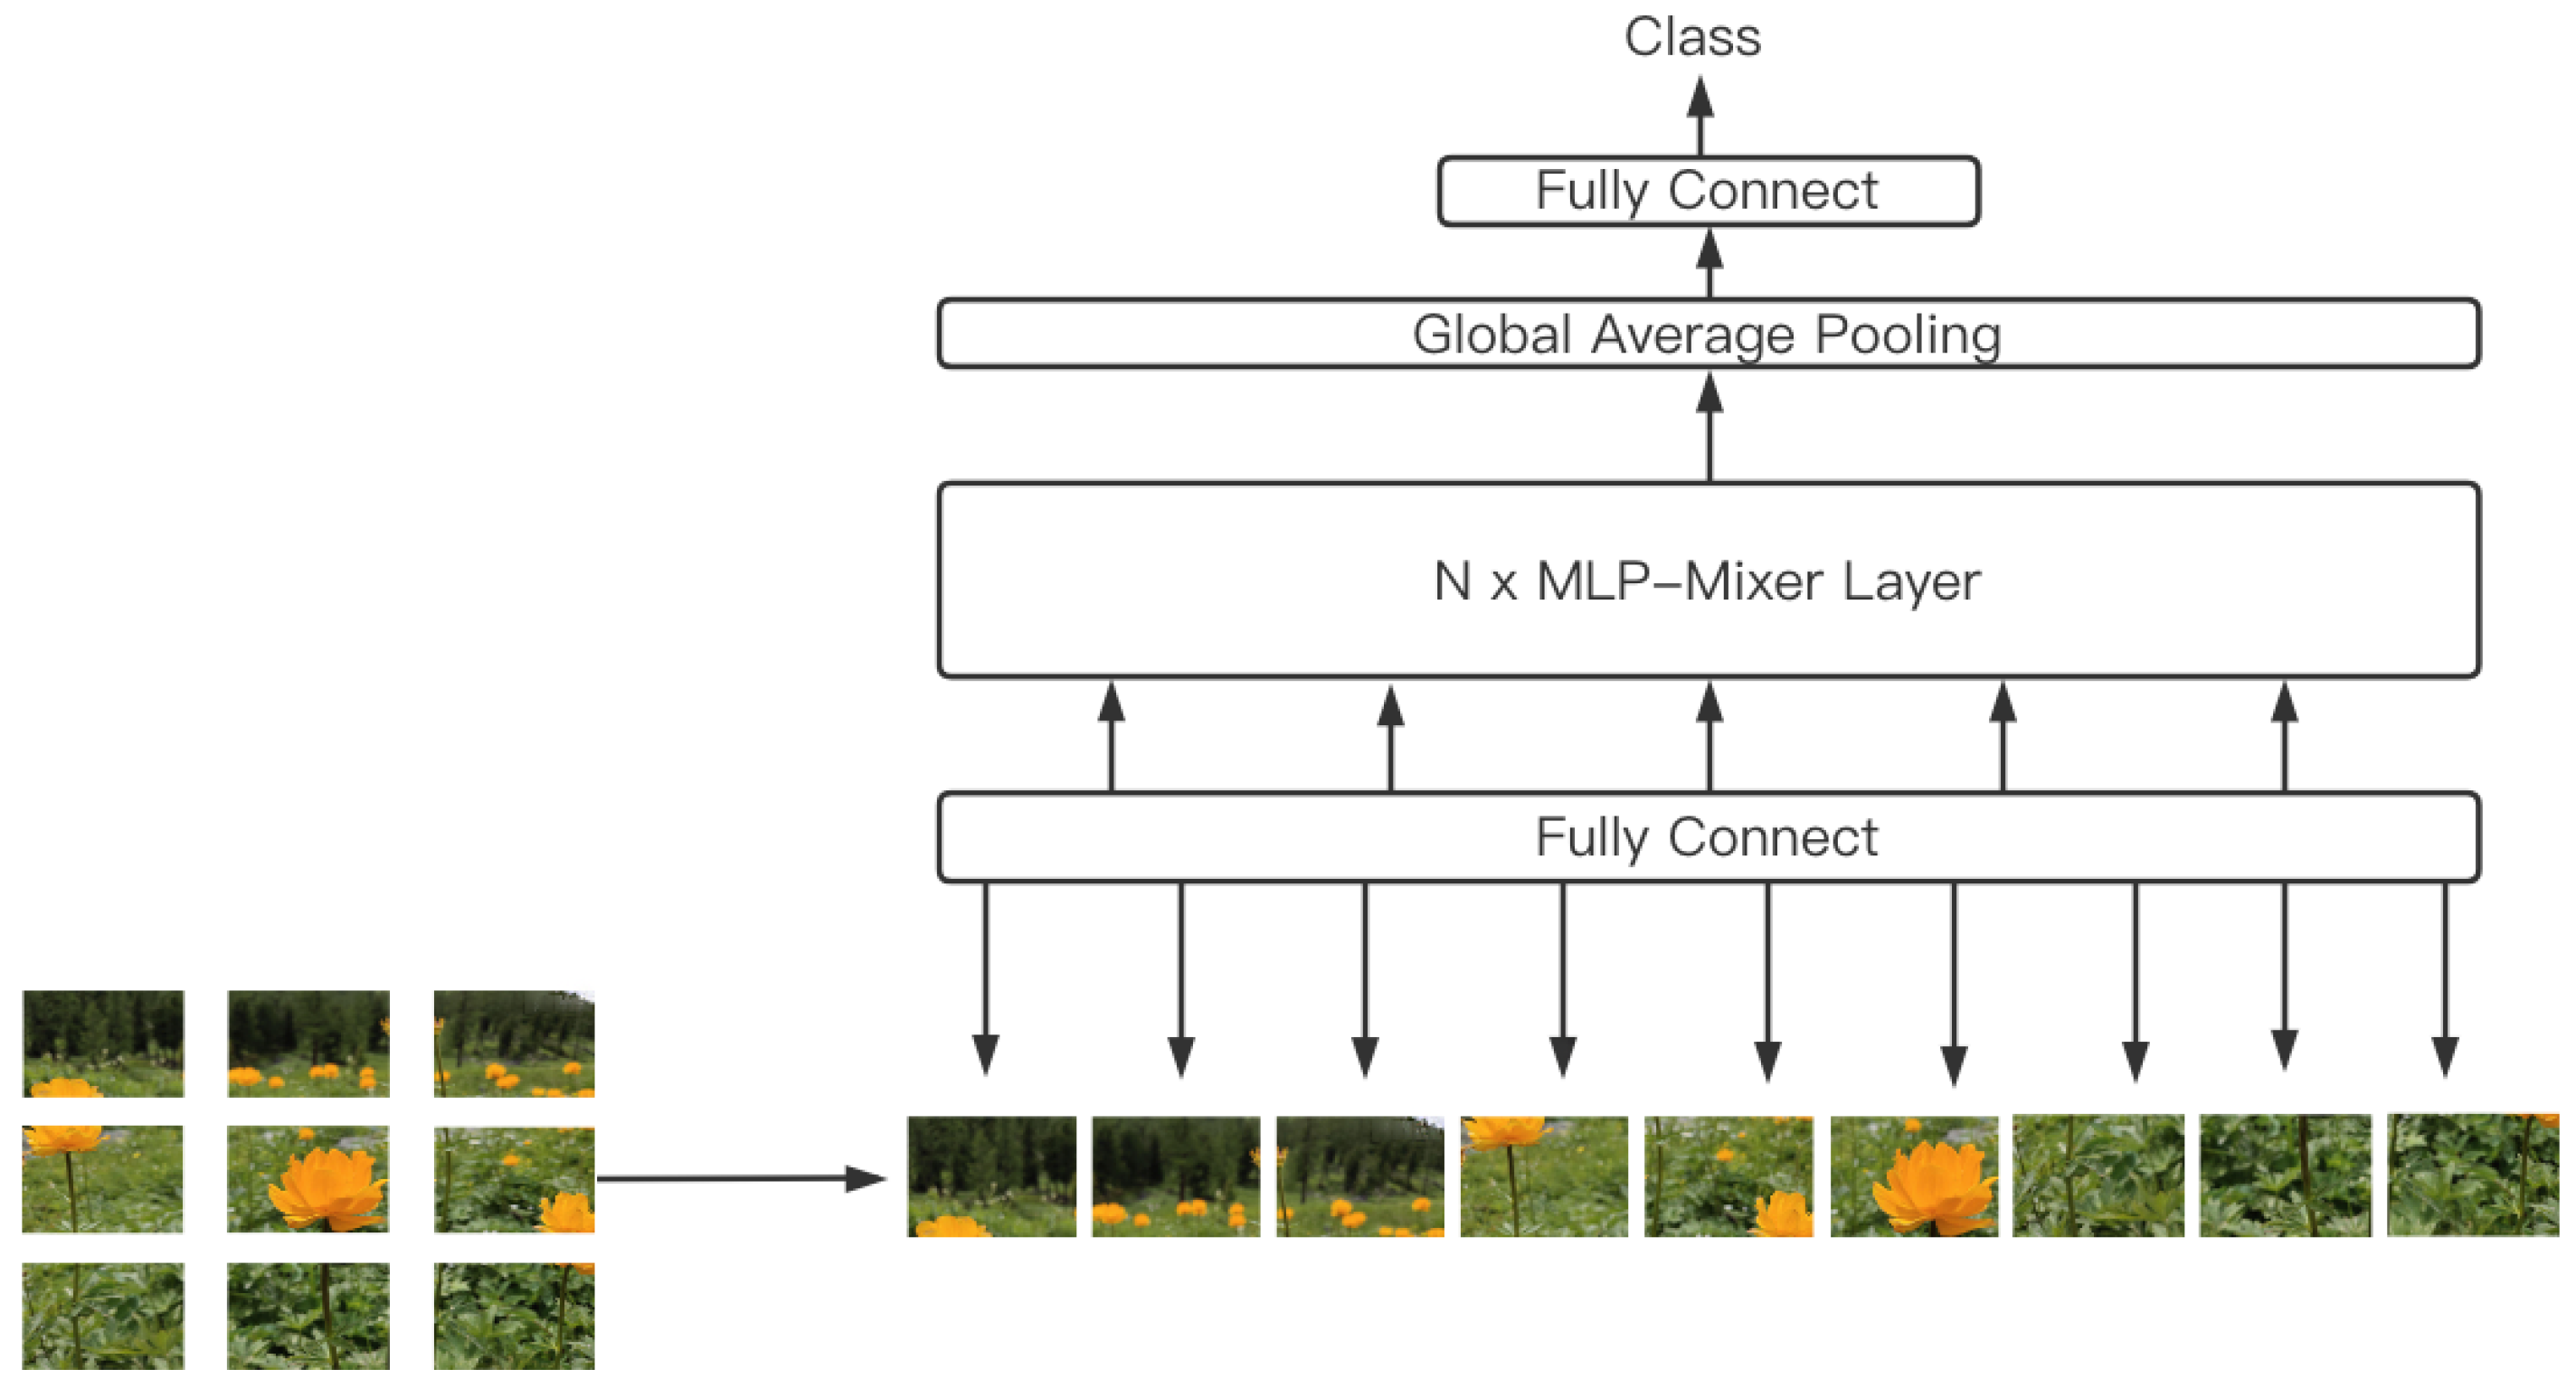
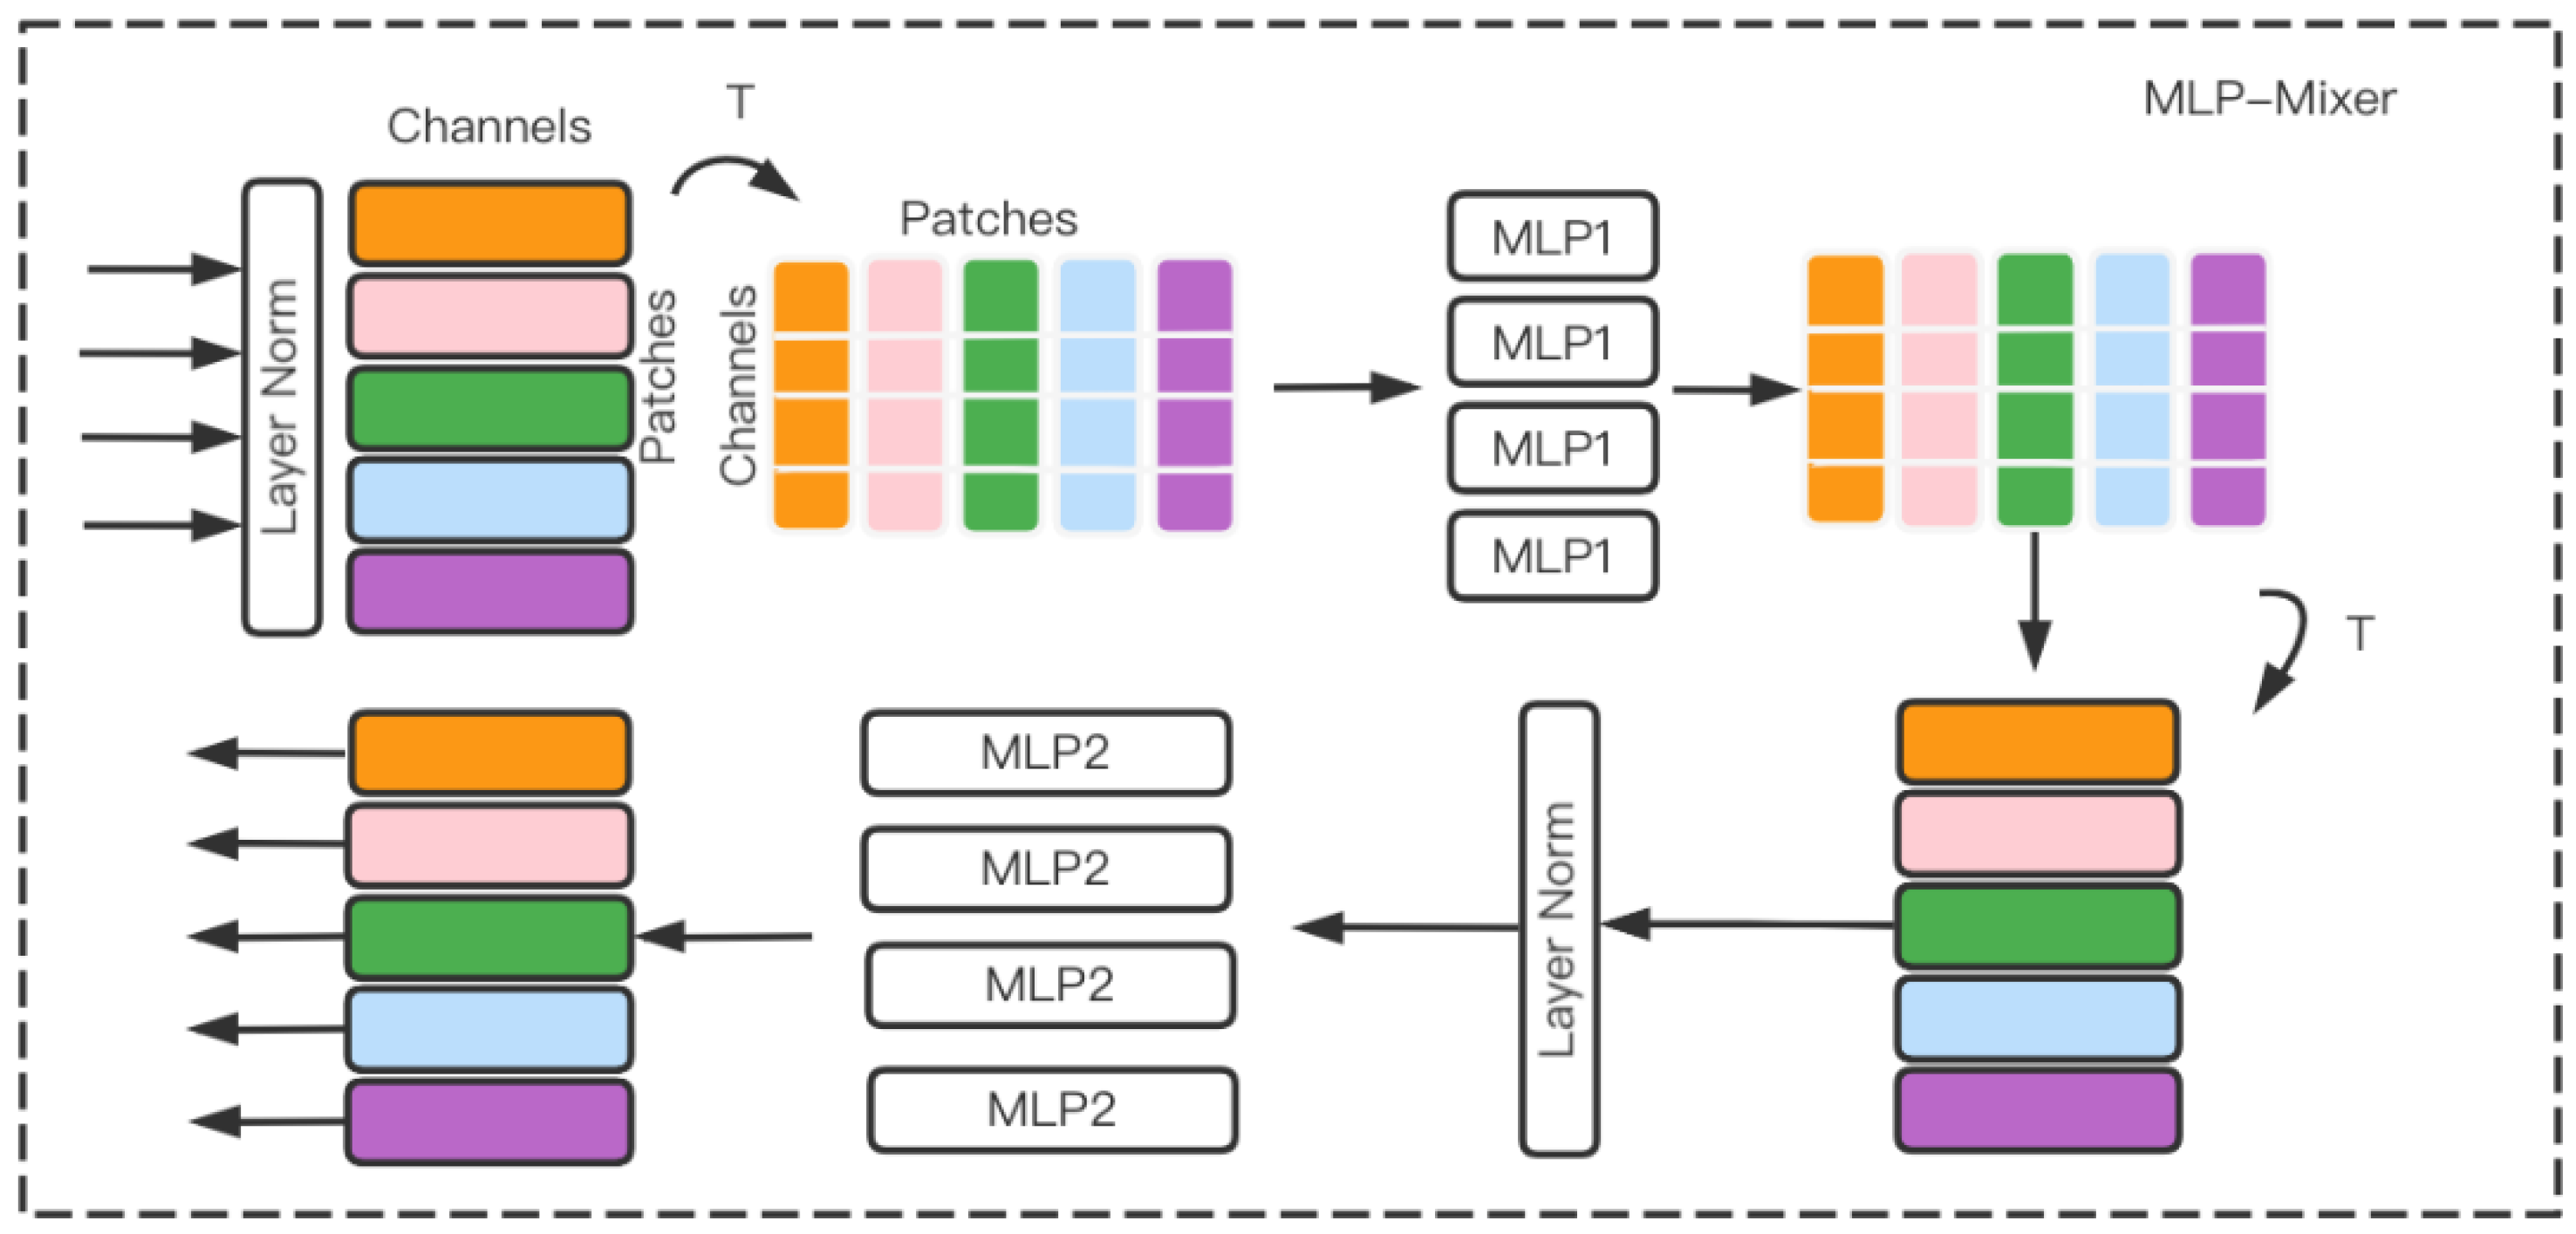
3.3. MLP-Mixer Model
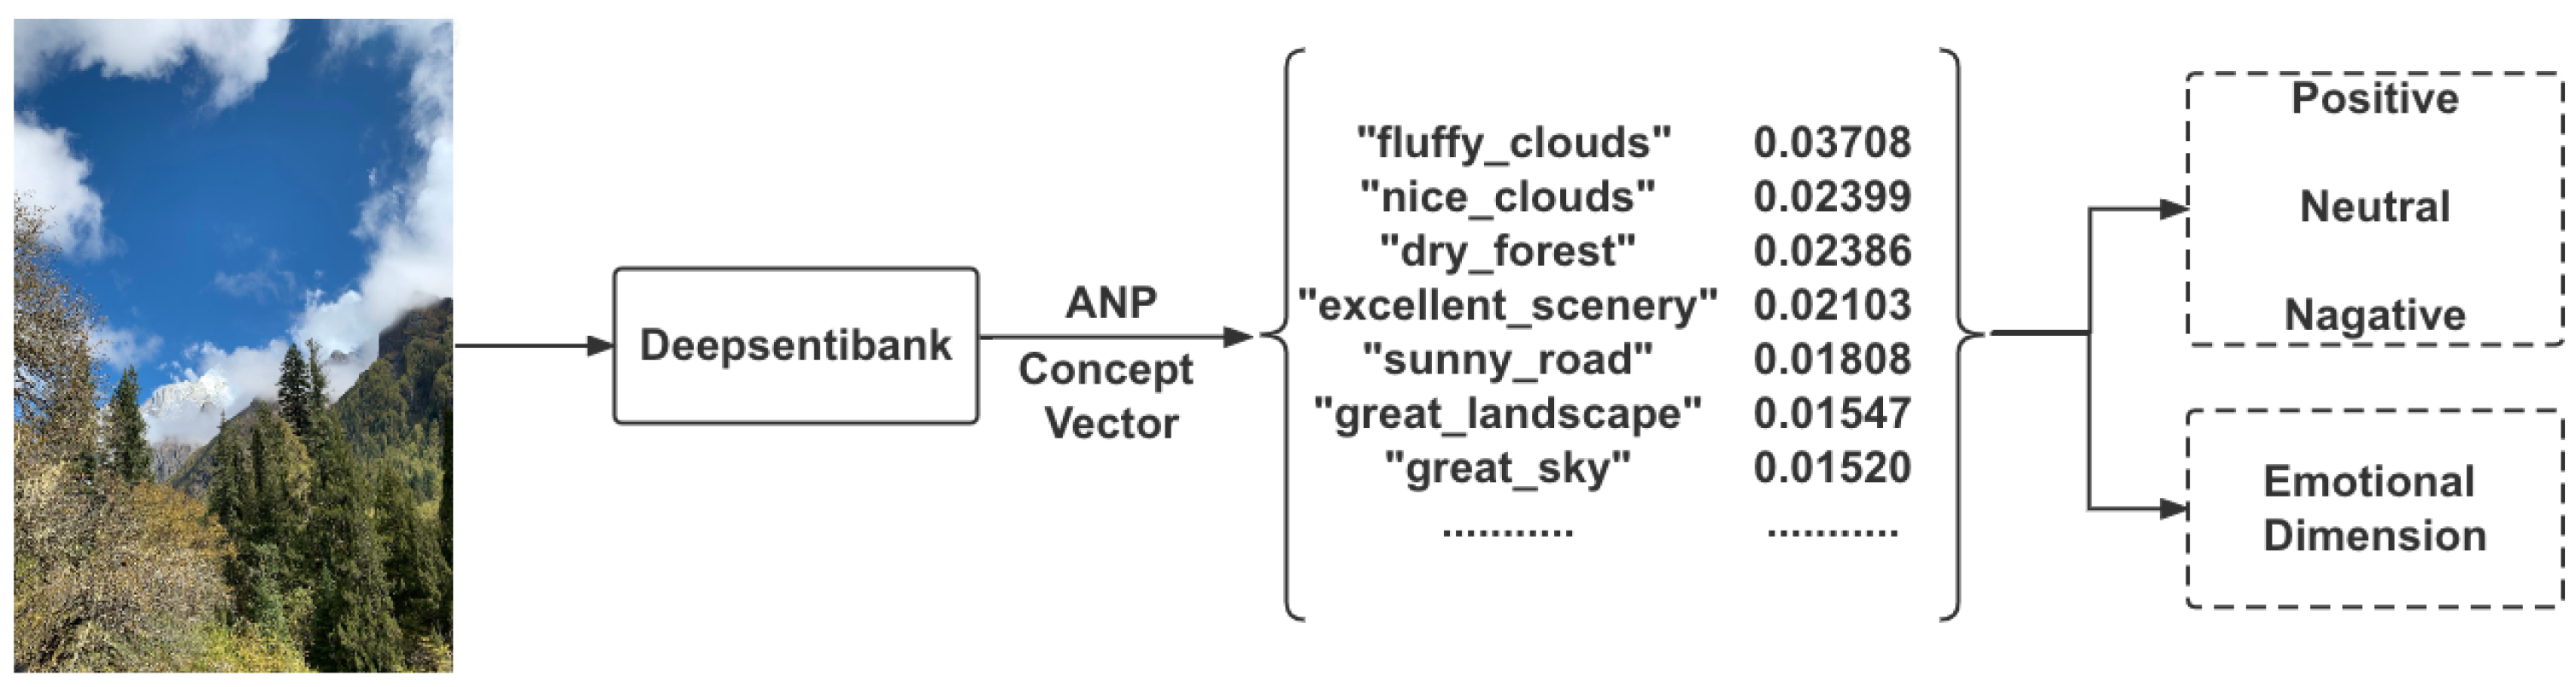
3.4. Deepsentibank
4. Results
4.1. MLP-Mixer Model Classification Results
4.2. Deepsentibank Sentiment Analysis
4.2.1. Emotional High-Frequency Word Analysis
4.2.2. Emotional Dimension Analysis
5. Discussion and Conclusions
5.1. Discussion
5.1.1. Preference Characteristics of Different Forest Landscape Categories
5.1.2. Emotional Characteristics Contained in Forest Landscape Photographs
5.1.3. Shortcomings and Outlook
5.2. Conclusions
Author Contributions
Funding
Institutional Review Board Statement
Informed Consent Statement
Data Availability Statement
Acknowledgments
Conflicts of Interest
References
- Salisch, H.V. Forstästhetik; Springer: Berlin/Heidelberg, Germany, 1911. [Google Scholar]
- Baskent, E.Z. Controlling spatial structure of forested landscapes: A case study towards landscape management. Landsc Ecol 1999, 14, 83–97. [Google Scholar] [CrossRef]
- Deng, S.; Yan, J.; Guan, Q.; Katoh, M. Short-term effects of thinning intensity on scenic beauty values of different stands. J. For. Res. 2012, 18, 209–219. [Google Scholar] [CrossRef]
- Gong, L.; Zhang, Z.; Xu, C. Developing a Quality Assessment Index System for Scenic Forest Management: A Case Study from Xishan Mountain, Suburban Beijing. Forests 2015, 6, 225–243. [Google Scholar] [CrossRef]
- Hunziker, M.; Kienast, F. Potential impacts of changing agricultural activities on scenic beauty—A prototypical technique for automated rapid assessment. Landsc. Ecol. 2004, 14, 161–176. [Google Scholar] [CrossRef]
- Nilsson, K.; Sangster, M.; Gallis, C.; Hartig, T.; Vries, S.D.; Seeland, K.; Schipperijn, J. Forests, trees and human health. J. Adven. Edu. Outdoor Learn. 2012, 12, 95–97. [Google Scholar] [CrossRef]
- Nordh, H.; Hagerhall, C.M.P.; Holmqvist, K. Tracking Restorative Components: Patterns in Eye Movements as a Consequence of a Restorative Rating Task. Landsc. Res. 2013, 38, 101–116. [Google Scholar] [CrossRef]
- Zhou, S.; Gao, Y.; Zhang, Z.; Zhang, W.; Meng, H.; Zhang, T. Visual Behaviour and Cognitive Preferences of Users for Constituent Elements in Forest Landscape Spaces. Forests 2022, 13, 47. [Google Scholar] [CrossRef]
- Robinette, G.O. Plants, People, and Environmental Quality: A Study of Plants and Their Environmental functions; Department of the Interior, National Park Service: Washington, WA, USA, 1972; p. 51.
- Jianwen, W. Forests—A vValuable Resource for Wild Play (Foreign Forest Play Use). Guangdong Landsc. Archit. 1981, 16–21. (In Chinese). Available online: https://www.cnki.com.cn/Article/CJFDTOTAL-GDYL198102003.htm (accessed on 12 May 2022).
- Lundmark, L.; Müller, D.K. Vilka är ute i Naturen? Delresultat från en Nationell enkät om Friluftsliv och Naturturism i Sverige (Who Visits Nature? Results from a Nationwide Questionnaire Study of Outdoor Life and Nature Tourism in Sweden); Fredman, P., Karlsson, S.-E., Romild, U., Sandell, K., Eds.; Report No. 1; Forskningsprogrammet friluftsliv i förändring: Östersund, Sweden, 2008. [Google Scholar]
- The 13th Five-Year Plan National Forest Tourism Tourist Volume Reached 7.5 Billion_Data Highlights_Chinese Government Website. Available online: http://www.gov.cn/shuju/2021-01/19/content_5580910.htm (accessed on 27 February 2022).
- Misgav, A.; Amir, S. Integration of Visual Quality Considerations in Development of Israeli Vegetation Management Policy. Environ. Manag. 2001, 27, 845–857. [Google Scholar] [CrossRef]
- Edwards, D.; Jay, M.; Jensen, F.S.; Lucas, B.; Marzano, M.; Montagné, C.; Peace, A.; Weiss, G. Public preferences for structural attributes of forests: Towards a pan-European perspective. For. Policy Econ. 2012, 19, 12–19. [Google Scholar] [CrossRef]
- Edwards, D.; Jay, M.; Jensen, F.; Lucas, B.; Marzano, M. Public Preferences for Silvicultural Attributes of European Forests; Technical Report from the EU FP6 Integrated Project EFORWOOD–Tools for Sustainability Impact Assessment of the Forestry-Wood Chain; European Forest Institute: Joensuu, Finland, 2014. [Google Scholar]
- Oku, H.; Fukamachi, K. The differences in scenic perception of forest visitors through their attributes and recreational activity. Landsc. Urban Plan. 2006, 75, 34–42. [Google Scholar] [CrossRef]
- Wilkes-Allemann, J.; Hanewinkel, M.; Pütz, M. Forest recreation as a governance problem: Four case studies from Switzerland. Eur. J. For. Res. 2017, 136, 511–526. [Google Scholar] [CrossRef]
- Filyushkina, A.; Agimass, F.; Lundhede, T.; Strange, N.; Jacobsen, J.B. Preferences for variation in forest characteristics: Does diversity between stands matter? Ecol. Econ. 2017, 140, 22–29. [Google Scholar] [CrossRef]
- Pastorella, F.; Giacovelli, G.; De Meo, I.; Paletto, A. People’s preferences for Alpine forest landscapes: Results of an internet-based survey. J. For. Res. 2017, 22, 36–43. [Google Scholar] [CrossRef]
- Weller, P.; Elsasser, P. Preferences for forest structural attributes in Germany—Evidence from a choice experiment. For. Policy Econ. 2018, 93, 1–9. [Google Scholar] [CrossRef]
- Christou, E. Examining Hotel Managers’ Acceptance of Web 2.0 in Website Development: A Case Study of Hotels in Hong Kong. Business 2016, 75–88. [Google Scholar] [CrossRef]
- Yang, L. Why do we take pictures?—A study on clustering museum visitors based on their motivation for taking photographs. Chinese Mus. 2018, 7. (In Chinese). Available online: https://www.cnki.com.cn/Article/CJFDTotal-GBWG201803014.htm (accessed on 12 May 2022).
- Balomenou, N.; Garrod, B. Photographs in tourism research: Prejudice, power, performance and participant-generated images. Tour. Manag. 2019, 70, 201–217. [Google Scholar] [CrossRef]
- Chalfen, R.M. Photograph’s role in tourism Some unexplored relationships. Ann. Tour. Res. 1979, 6, 435–447. [Google Scholar] [CrossRef]
- James, A. Travel photography: A methodological approach. Ann. Tour. Res. 1988, 15, 134–158. [Google Scholar] [CrossRef]
- Urry, J.; Larsen, J. The Tourist Gaze 3.0, 3rd ed.; Sage Publications: New York, NY, USA, 2011; ISBN 978-1-84920-376-0. [Google Scholar]
- Kim, S.O.; Lee, C.H.; Shelby, B.O. Utilization of Photographs for Determining Impact Indicators for Trail Management. Environ. Manag. 2003, 32, 282–289. [Google Scholar] [CrossRef] [PubMed]
- Wilkins, E.J.; Wood, S.A.; Smith, J.W. Uses and Limitations of Social Media to Inform Visitor Use Management in Parks and Protected Areas: A Systematic Review. Environ. Manag. 2021, 67, 120–132. [Google Scholar] [CrossRef] [PubMed]
- Conti, E.; Lexhagen, M. Instagramming nature-based tourism experiences: A netnographic study of online photography and value creation. Tour Manag. Perspect 2020, 34, 100650. [Google Scholar] [CrossRef]
- Jia, Y.Q.; Zhang, Y.J. Preliminary Study of Photographic Behavior of the Tourist—Based on the contrast of the photographic tourist and the mass tourist. J. Cent. S. Univ. For. Technol. 2012, 6, 5. (In Chinese) [Google Scholar] [CrossRef]
- Angradi, T.R.; Launspach, J.J.; Debbout, R. Determining preferences for ecosystem benefits in Great Lakes Areas of Concern from photographs posted to social media. J. Great Lakes Res. 2018, 44, 340–351. [Google Scholar] [CrossRef]
- Lee, H.; Seo, B.; Koellner, T.; Lautenbach, S. Mapping cultural ecosystem services 2.0—Potential and shortcomings from unlabeled crowd sourced images. Ecol. Indic. 2019, 96, 505–515. [Google Scholar] [CrossRef]
- Oteros-Rozas, E.; Martín-López, B.; Fagerholm, N.; Bieling, C.; Plieninger, T. Using social media photos to explore the relation between cultural ecosystem services and landscape features across five European sites. Ecol. Indic. 2018, 94, 74–86. [Google Scholar] [CrossRef]
- Pastur, G.J.M.; Peri, P.L.; Lencinas, M.V.; García-Llorente, M.; Martín-López, B. Spatial patterns of cultural ecosystem services provision in Southern Patagonia. Landsc. Ecol. 2015, 31, 383–399. [Google Scholar] [CrossRef]
- Zhao, Y.; Wang, G.; Tang, C.; Luo, C.; Zeng, W.; Zha, Z.J. A Battle of Network Structures: An Empirical Study of CNN, Transformer, and MLP. arXiv 2021, arXiv:2108.13002. [Google Scholar]
- Zhang, K.; Chen, Y.; Li, C. Discovering the tourists’ behaviors and perceptions in a tourism destination by analyzing photos’ visual content with a computer deep learning model: The case of Beijing—ScienceDirect. Tour. Manag. 2019, 75, 595–608. [Google Scholar] [CrossRef]
- Kim, J. Transfer Learning of a Deep Learning Model for Exploring Tourists’ Urban Image Using Geotagged Photos. ISPRS Int. J. Geo. Inf. 2021, 10, 137. [Google Scholar] [CrossRef]
- Deng, N.; Liu, J.; Niu, Y.; Ji, W.X. Different perceptions of Beijing’s destination images from tourists: An analysis of Flickr photos based on deep learning method. Resour. Sci. 2019, 41, 416–429. (In Chinese) [Google Scholar] [CrossRef][Green Version]
- Deng, N.; Liu, J. Where did you take those photos? Tourists’ preference clustering based on facial and background recognition. J. Destin. Mark. Manag. 2021, 21, 100632. [Google Scholar] [CrossRef]
- Payntar, N.D.; Hsiao, W.L.; Covey, R.A.; Grauman, K. Learning Patterns of Tourist Movement and Photography from Geotagged Photos at Archaeological Heritage Sites in Cuzco, Peru. Sociology 2020, 82, 104165. [Google Scholar] [CrossRef]
- Cho, N.; Kang, Y.; Yoon, J.; Park, S. Classification of Tourist Photo for Intelligent Tourism Service. Comput. Sci. 2019, 19, 84–101. [Google Scholar] [CrossRef]
- Kim, D.; Kang, Y.; Park, Y.; Kim, N.; Lee, J. Understanding tourists’ urban images with geotagged photos using convolutional neural networks. Spat. Inf. Res. 2019, 28, 241–255. [Google Scholar] [CrossRef]
- Wilkins, E.J.; Van Berkel, D.; Zhang, H.; Dorning, M.A.; Beck, S.M.; Smith, J.W. Promises and pitfalls of using computer vision to make inferences about landscape preferences: Evidence from an urban-proximate park system. Landsc. Urban Plan. 2022, 219, 104315. [Google Scholar] [CrossRef]
- Runge, C.A.; Hausner, V.H.; Daigle, R.M.; Monz, C.A. Pan-Arctic analysis of cultural ecosystem services using social media and automated content analysis. Environ. Res. Commun. 2020, 2, 075001. [Google Scholar] [CrossRef]
- China’s Forest Coverage Rate 22.96%_Forestry and Grassland Resources_State Forestry and Grassland Administration Government Website. Available online: https://www.forestry.gov.cn/main/65/20190620/103419043834596.html (accessed on 30 April 2022).
- Zhou, H.; Wang, F. Research on structure characteristics of the inter-provincial tourist flow spatial network in China based on the modified gravity model. Geogr. Res. 2020, 39, 669–681. (In Chinese) [Google Scholar] [CrossRef]
- About “2BULU”—“2BULU” Outdoor Network. Available online: https://www.2bulu.com/about/about_us.htm (accessed on 21 April 2022).
- Wei, X.; Zhou, G.; Yu, S. A preliminary study of forest landscape classification systems. South Cent. For. Surv. Plann. 1997, 16, 5. (In Chinese) [Google Scholar]
- White, M.P.; Smith, A.T.; Humphryes, K.; Pahl, S.; Snelling, D.; Depledge, M.H. Blue space: The importance of water for preference, affect, and restorativeness ratings of natural and built scenes. J. Environ. Psychol. 2010, 30, 482–493. [Google Scholar] [CrossRef]
- Schirpke, U.; Tappeiner, G.; Tasser, E.; Tappeiner, U. Using conjoint analysis to gain deeper insights into aesthetic landscape preferences. Ecol. Indic. 2019, 96, 202–212. [Google Scholar] [CrossRef]
- Tieskens, K.; Zanten, B.T.; van Schulp, C.J.E.; Verburg, P.H. Aesthetic appreciation of the cultural landscape through social media: An analysis of revealed preference in the Dutch river landscape. Landsc. Urban Plan. 2018, 177, 128–137. [Google Scholar] [CrossRef]
- Chen, X.; Wang, Y. An analytic study on forest beauty—mostly on form beauty of forest plants. Sci. Silvae Sin. 2001, 37, 122–130. (In Chinese) [Google Scholar]
- Sun, C.; Shrivastava, A.; Singh, S.; Gupta, A. Revisiting Unreasonable Effectiveness of Data in Deep Learning Era. In Proceedings of the 16th IEEE International Conference on Computer Vision (ICCV), Venice, Italy, 22–29 October 2017. [Google Scholar] [CrossRef]
- Tolstikhin, I.O.; Houlsby, N.; Kolesnikov, A.; Beyer, L.; Zhai, X.; Unterthiner, T.; Yung, J.; Steiner, A.; Keysers, D.; Uszkoreit, J.; et al. MLP-Mixer: An all-MLP Architecture for Vision. In Proceedings of the Advances in Neural Information Processing Systems, Virtual, 6–14 December 2021; Ranzato, M., Beygelzimer, A., Dauphin, Y., Liang, P.S., Vaughan, J.W., Eds.; Curran Associates, Inc.: New York, NY, USA, 2021; Volume 34, pp. 24261–24272. [Google Scholar]
- Richter, K.-F.; Winter, S. Citizens as Database: Conscious Ubiquity in Data Collection. Comput. Sci. 2011, 6849, 445–448. [Google Scholar] [CrossRef]
- Hull, R.B.; Stewart, W. The Landscape Encountered and Experienced While Hiking. Environ. Behav. 1995, 27, 404–426. [Google Scholar] [CrossRef]
- Chen, T.; Borth, D.; Darrell, T.; Chang, S.F. DeepSentiBank: Visual Sentiment Concept Classification with Deep Convolutional Neural Networks. arXiv 2014, arXiv:1410.8586. [Google Scholar]
- Stepchenkova, S.; Zhan, F. Visual destination images of Peru: Comparative content analysis of DMO and user-generated photography. Tour. Manag. 2013, 36, 590–601. [Google Scholar] [CrossRef]
- Fan, M.; Zhang, H.; Chen, Y. Spatiotemporal analysis of visual tourism images in Inner Mongolia from the perspective of tourists. J. Arid. Land Resour. Environ. 2020, 34, 194–200. (In Chinese) [Google Scholar]
- Russell, J.A. A circumplex model of affect. J. Pers. Soc. Psychol. 1980, 39, 1161–1178. [Google Scholar] [CrossRef]
- Petrova, E.G.; Mironov, Y.V.; Aoki, Y.; Matsushima, H.; Ebine, S.; Furuya, K.; Petrova, A.; Takayama, N.; Ueda, H. Comparing the visual perception and aesthetic evaluation of natural landscapes in Russia and Japan: Cultural and environmental factors. Prog. Earth Planet. Sci. 2015, 2, 6. [Google Scholar] [CrossRef]
- Zhang, T.; Zhang, W.; Meng, H.; Zhang, Z. Analyzing Visitors’ Preferences and Evaluation of Satisfaction Based on Different Attributes, with Forest Trails in the Akasawa National Recreational Forest, Central Japan. Forests 2019, 10, 431. [Google Scholar] [CrossRef]
- Agimass, F.; Lundhede, T.; Panduro, T.E.; Jacobsen, J.B. The choice of forest site for recreation: A revealed preference analysis using spatial data. Ecosyst. Serv. 2018, 31, 445–454. [Google Scholar] [CrossRef]
- You, S.; Zheng, Q.; Chen, B.; Xu, Z.; Lin, Y.; Gan, M.; Zhu, C.; Deng, J.; Wang, K. Identifying the spatiotemporal dynamics of forest ecotourism values with remotely sensed images and social media data: A perspective of public preferences. J. Clean. Prod. 2022, 341, 130715. [Google Scholar] [CrossRef]
- Gao, Y.; Zhang, T.; Sasaki, K.; Uehara, M.; Jin, Y.; Qin, L. The spatial cognition of a forest landscape and its relationship with tourist viewing intention in different walking passage stages. Urban For. Urban Green. 2021, 58, 126975. [Google Scholar] [CrossRef]
- Abildtrup, J.; Garcia, S.; Olsen, S.B.; Stenger, A. Spatial preference heterogeneity in forest recreation. Ecol. Econ. 2013, 92, 67–77. [Google Scholar] [CrossRef]
- Akay, A.E.; Pak, M.; Yenilmez, N.; Demirbağ, H. Aesthetic Evaluations of Forest Road Templates. Int. J. Nat. Eng. Sci. 2007, 1, 65–68. [Google Scholar]
- Zhang, F.; Zhou, B.; Liu, L.; Liu, Y.; Fung, H.H.; Lin, H.; Ratti, C. Measuring human perceptions of a large-scale urban region using machine learning. Landsc. Urban Plan. 2018, 180, 148–160. [Google Scholar] [CrossRef]
- Clemens, J.; Swaffield, S.R.; Wilson, J. Landscape and Associated Environmental Values in the Roadside Corridor: A Selected Literature Review; Lincoln University: Canterbury, New Zealand, 2010. [Google Scholar]
- Oku, H.; Fukamachi, K. The Relationships between Experienced Landscape Types and People’s Visiting Forms on a Trail in a Forest. J. Korea Soc. Comput. Inform. 1999, 63, 587–592. [Google Scholar] [CrossRef]
- Oku, H.; Fukamachi, K. Occurrence pattern of landscape experience during forest recreation. J. Jpn. For. Soc. 2003, 85, 63–69. [Google Scholar] [CrossRef]
- Kasetani, T.; Okumura, K.; Yoshida, S.; Takayama, N.; Kagawa, T. Differences in the Physiological and Psychological Effects of Walking in Various Satoyama Landscapes. Environ. Sci. 2007, 70, 569–574. [Google Scholar] [CrossRef]
- Silvennoinen, H.; Alho, J.M.; Kolehmainen, O.; Pukkala, T. Prediction models of landscape preferences at the forest stand level. Landsc. Urban Plan. 2001, 56, 11–20. [Google Scholar] [CrossRef]
- Foltête, J.-C.; Ingensand, J.; Blanc, N. Coupling crowd-sourced imagery and visibility modelling to identify landscape preferences at the panorama level. Landsc. Urban Plan 2020, 197, 103756. [Google Scholar] [CrossRef]
- Wu, J.; Yuanyuan, X.; Jianlan, R.; Jie, Z.; Weilong, S.; Mengyu, L.; Bohong, P. Progress and Geographical Response on Landscape Preference. Sci. Geogr. Sin. 2021, 41, 656–663. [Google Scholar] [CrossRef]
- Carvalho-Ribeiro, S.M.; Lovett, A.A. Is an attractive forest also considered well managed? Public preferences for forest cover and stand structure across a rural/urban gradient in northern Portugal. For. Policy Econ. 2011, 13, 46–54. [Google Scholar] [CrossRef]
- Arnberger, A.; Ebenberger, M.; Schneider, I.E.; Cottrell, S.; Schlueter, A.C.; Ruschkowski, E.; von Venette, R.C.; Snyder, S.A.; Gobster, P.H. Visitor Preferences for Visual Changes in Bark Beetle-Impacted Forest Recreation Settings in the United States and Germany. Environ. Manag. 2017, 61, 209–223. [Google Scholar] [CrossRef]
- Buhyoff, G.J.; Wellman, J.D.; Daniel, T.C. Predicting scenic quality for mountain pine beetle and western spruce budworm damaged forest vistas. For. Sci. 1982, 28, 827–838. [Google Scholar] [CrossRef]
- Ryan, R. The influence of landscape preference and environmental education on public attitudes toward wildfire management in the Northeast pine barrens (USA). Landsc. Urban Plan 2012, 107, 55–68. [Google Scholar] [CrossRef]
- Gill, N.; Dun, O.; Brennan-Horley, C.R.; Eriksen, C. Landscape Preferences, Amenity, and Bushfire Risk in New South Wales, Australia. Env. Manag. 2015, 56, 738–753. [Google Scholar] [CrossRef]
- Helman, A.C.; Kelly, M.C.; Rouleau, M.; Dickinson, Y.L. Preferences for Northern Hardwood Silviculture among Family Forest Owners in Michigan’s Upper Peninsula. J. For. 2020, 119, 113–129. [Google Scholar] [CrossRef]
- Nielsen, A.B.; Heyman, E.; Richnau, G. Liked, disliked and unseen forest attributes: Relation to modes of viewing and cognitive constructs. J. Environ. Manag. 2012, 113, 456–466. [Google Scholar] [CrossRef] [PubMed]
- Ding, N.; Zhong, Y.; Li, J.; Xiao, Q. Study on selection of native greening plants based on eye-tracking technology. Sci. Rep. 2022, 12, 1092. [Google Scholar] [CrossRef] [PubMed]
- Gao, Y.; Zhang, T.; Zhang, W.; Meng, H.; Zhang, Z. Research on visual behavior characteristics and cognitive evaluation of different types of forest landscape spaces. Urban For. Urban Green. 2020, 54, 126788. [Google Scholar] [CrossRef]
- Russell, J.A.; Pratt, G. A Description of the Affective Quality Attributed to Environments. J. Pers. Soc. Psychol. 1980, 38, 311–322. [Google Scholar] [CrossRef]
- Singh, S.N.; Donavan, D.T.; Mishra, S.K.; Little, T.D. The latent structure of landscape perception: A mean and covariance structure modeling approach. J. Environ. Psychol. 2008, 28, 339–352. [Google Scholar] [CrossRef]
- Gobster, P.H.; Nassauer, J.I.; Daniel, T.C.; Fry, G. The shared landscape: What does aesthetics have to do with ecology? Landsc. Ecol. 2007, 22, 959–972. [Google Scholar] [CrossRef]
- Lôpez-Santiago, A.C.; Oteros-Rozas, E.; Martin-Lopez, B.; Plieninger, T.; Martin, G.; González, J.A. Esther Using visual stimuli to explore the social perceptions of ecosystem services in cultural landscapes: The case of transhumance in Mediterranean Spain. Ecol. Soc. 2014, 19, 27. [Google Scholar] [CrossRef]
- Strauss, E.D.; Schloss, K.B.; Palmer, S.E. Color preferences change after experience with liked/disliked colored objects. Psychon. Bull. Rev. 2013, 20, 935–943. [Google Scholar] [CrossRef]
- Gundersen, V.; Stange, E.; Kaltenborn, B.P.; Vistad, O.I. Public visual preferences for dead wood in natural boreal forests: The effects of added information. Landsc. Urban Plan 2017, 158, 12–24. [Google Scholar] [CrossRef]
- Sahraoui, Y.; Clauzel, C.; Foltête, J.-C. Spatial modelling of landscape aesthetic potential in urban-rural fringes. J. Environ. Manag. 2016, 181, 623–636. [Google Scholar] [CrossRef] [PubMed]
- Yoshimura, N.; Hiura, T. Demand and supply of cultural ecosystem services: Use of geotagged photos to map the aesthetic value of landscapes in Hokkaido. Ecosyst. Serv. 2017, 24, 68–78. [Google Scholar] [CrossRef]
- Youssoufi, S.; Foltête, J.-C. Determining appropriate neighborhood shapes and sizes for modeling landscape satisfaction. Landsc. Urban Plan 2013, 110, 12–24. [Google Scholar] [CrossRef]
- Herzog, T.R.; Bosley, P.J. Tranquility and preference as affective qualities of natural environments. J. Environ. Psychol. 1992, 12, 115–127. [Google Scholar] [CrossRef]
- Real, E.; Arce, C.; Sabucedo, J.-M. Classification of landscapes using quantitative and categorical data, and prediction of their scenic beauty in north-western spain. J. Environ. Psychol. 2000, 20, 355–373. [Google Scholar] [CrossRef]
- Marwijk, R.; van Elands, B.H.M.; Kampen, J.K.; Terlouw, S.; Pitt, D.G.; Opdam, P. Public Perceptions of the Attractiveness of Restored Nature. Restor. Ecol. 2011, 20, 773–780. [Google Scholar] [CrossRef]
- Liang, X.; Fan, L.; Loh, Y.P.; Liu, Y.; Tong, S. Happy Travelers Take Big Pictures: A Psychological Study with Machine Learning and Big Data. arXiv 2017, arXiv:1709.07584. [Google Scholar]
- Bubalo, M.; Zanten, B.T.; van Verburg, P.H. Crowdsourcing geo-information on landscape perceptions and preferences: A review. Landsc. Urban Plan. 2019, 184, 101–111. [Google Scholar] [CrossRef]
- Crampton, J.W.; Graham, M.; Poorthuis, A.; Shelton, T.; Stephens, M.; Wilson, M.W.; Zook, M. Beyond the Geotag: Situating “Big Data” and Leveraging the Potential of the Geoweb. Cartogr. Geogr. Inf. Sci. 2013, 40, 130–139. [Google Scholar] [CrossRef]
- Li, L.; Goodchild, M.F.; Xu, B. Spatial, temporal, and socioeconomic patterns in the use of Twitter and Flickr. Cartogr. Geogr. Inf. Sci. 2013, 40, 61–77. [Google Scholar] [CrossRef]
- Kim, J.; Son, Y. Assessing and mapping cultural ecosystem services of an urban forest based on narratives from blog posts. Ecol. Indic. 2021, 129, 107983. [Google Scholar] [CrossRef]
- Liu, Y.; Hu, M.; Zhao, B. Interactions between forest landscape elements and eye movement behavior under audio-visual integrated conditions. J. For. Res. 2019, 25, 21–30. [Google Scholar] [CrossRef]
- Liu, Y.; Hu, M.; Zhao, B. Audio-visual interactive evaluation of the forest landscape based on eye-tracking experiments. Urban For. Urban Green. 2019, 46, 126476. [Google Scholar] [CrossRef]


| Adj | Frequency | Adj | Frequency |
|---|---|---|---|
| classic | 9337 | broken | 2326 |
| cute | 8312 | delicious | 2196 |
| sweet | 7441 | warm | 2186 |
| colorful | 7102 | hot | 2122 |
| sexy | 6482 | gorgeous | 2033 |
| funny | 6022 | young | 1698 |
| amazing | 5138 | christian | 1481 |
| empty | 4524 | pretty | 1407 |
| super | 4328 | happy | 1395 |
| tiny | 3837 | evil | 1342 |
| awesome | 3459 | upset | 1305 |
| yummy | 3128 | shiny | 1215 |
| fresh | 2867 | energetic | 1209 |
| ugly | 2657 | icy | 1173 |
| strong | 2500 | tired | 1142 |
| dirty | 2486 | clean | 1098 |
| adorable | 2484 | nasty | 1027 |
| traditional | 2424 | favorite | 1022 |
| Emotional Tendency | Frequency | Proportion |
|---|---|---|
| Positive | 82,872 | 74.06% |
| Neutral | 12,911 | 11.54% |
| Negative | 16,122 | 14.41% |
| Type | Frequency | Proportion |
|---|---|---|
| Pleased | 51,262 | 45.81% |
| Excited | 16,167 | 14.45% |
| Happy | 11,310 | 10.11% |
| Delightful | 7441 | 6.65% |
| Sad | 6117 | 5.47% |
| Relaxed | 5622 | 5.02% |
| Depressing | 3837 | 3.43% |
| Miserable | 2657 | 2.37% |
| Satisfied | 2500 | 2.23% |
| Calm | 1481 | 1.32% |
| Afraid | 1342 | 1.20% |
| Bored | 1142 | 1.02% |
| Annoying | 1027 | 0.92% |
Publisher’s Note: MDPI stays neutral with regard to jurisdictional claims in published maps and institutional affiliations. |
© 2022 by the authors. Licensee MDPI, Basel, Switzerland. This article is an open access article distributed under the terms and conditions of the Creative Commons Attribution (CC BY) license (https://creativecommons.org/licenses/by/4.0/).
Share and Cite
Zeng, X.; Zhong, Y.; Yang, L.; Wei, J.; Tang, X. Analysis of Forest Landscape Preferences and Emotional Features of Chinese Forest Recreationists Based on Deep Learning of Geotagged Photos. Forests 2022, 13, 892. https://doi.org/10.3390/f13060892
Zeng X, Zhong Y, Yang L, Wei J, Tang X. Analysis of Forest Landscape Preferences and Emotional Features of Chinese Forest Recreationists Based on Deep Learning of Geotagged Photos. Forests. 2022; 13(6):892. https://doi.org/10.3390/f13060892
Chicago/Turabian StyleZeng, Xitong, Yongde Zhong, Lingfan Yang, Juan Wei, and Xianglong Tang. 2022. "Analysis of Forest Landscape Preferences and Emotional Features of Chinese Forest Recreationists Based on Deep Learning of Geotagged Photos" Forests 13, no. 6: 892. https://doi.org/10.3390/f13060892
APA StyleZeng, X., Zhong, Y., Yang, L., Wei, J., & Tang, X. (2022). Analysis of Forest Landscape Preferences and Emotional Features of Chinese Forest Recreationists Based on Deep Learning of Geotagged Photos. Forests, 13(6), 892. https://doi.org/10.3390/f13060892