3. Results and Discussion
The first step was to examine the multicollinearity threats by correlating the variables in the model. This is common PDA practice.
Table 3 presents the correlation matrix.
This table reveals that there were no significantly correlated variables, all of which exceeded the threshold of 0.8. Hence, there was no threat of multicollinearity.
The presence of autocorrelation was tested for all variables through Born and Breitung [
40] tests. The only variable with the presence of first-order autocorrelation was GDP. In this way, the estimation of the coefficients was consistent, but the standard errors were not. This variable was included in the first estimation model to examine if the GDP had a significant influence on the leverage.
The next step was to examine the applicability of Equations (1) and (2).
Table 4 presents the results for the FE and RE equations.
Table 3 clearly reveals the significance of each of the models. The RE model (4) was not significant (
p-value = 0.29). For this reason, we adopted FE as the appropriate model. The results were derived by using the Windmeijer correction to produce robust error terms to avoid heteroscedasticity. In this case, the Hausman test was complementary and presented a
p-value of 0.000. Under H0, the difference in coefficients was not systematic, which confirmed the applicability of the FE models. This analysis could be elaborated by performing a comprehensive analysis of Equations (1) and (2). The results of Equation (1) are presented in
Table 5.
The results in
Table 4 indicate that enterprise specifics were the most significant FE source. GDP was not a significant variable. Thus, in compliance with autocorrelation, GDP was removed from subsequent analyses. In addition, some of the dummies (Bulgaria and Slovakia) were omitted due to multicollinearity. The slopes of the curves were significant for liquidity (ln
LIQ) and the size (ln
SIZE) of the enterprises. In this context, the dominant factor for leverage in this model was the size (ln
SIZE) of each enterprise,
β3 = 0.954. According to the essence of the model, the company size increased the leverage effect with a constant elasticity of 0.954. This result is consistent with the findings of Singh [
21], Rajan and Zingales [
41], Flannery and Rangan [
42], Antoniou et al. [
43], Jovanovic [
19], Bourke [
44], and Chatterjee and Eyigungor, B. [
45]. The liquidity of the enterprises was a less statistically significant factor (
p = 0.024) for leverage and was weaker than ln
SIZE. Moreover, a negative relationship was observed between leverage and the liquidity with a constant elasticity of
β2 = −0.104. The results for liquidity were consistent with those of Šarlija and Harc [
46] and Susanti et al. [
15]. Time did not influence the enterprises’ capital structures or leverage levels. However, the countries were characterised by multicollinearity, and it was not clear whether the country specifics influenced the differences in leverage observed between enterprises under this model. The enterprise individual parameters had a particular focus on the strongest factors for the appearance of FE, rather than random ones. The model suggests an individual intercept for each enterprise. To clarify the individual FE values, we calculated the model again, while omitting insignificant variables. The results are presented in
Table 6.
Here, the results revealed that the significance of the factors increased after omitting the insignificant variables from previous models. Additionally, the marginal effects of liquidity and size were corrected. It should also be underlined that the elasticity of leverage according to the enterprise size was found to be 0.64, while that according to liquidity was 0.104. Thus, if the model above is appropriate, the forest enterprises in all three countries increased the leverage effect by 64%. Increasing leverage size by 1% and maintaining high liquidity resulted in a decrease in financial leverage by 10.4%. All these results are valid if the FEs are presented in errors and hence in the constant term of Equation (1). If differences appeared in the relationship between the independent variables and financial leverage, then this influence would appear in the slopes of the curves. The results under this assumption using Equation (2) are outlined in
Table 6. Indeed, these results were produced by experimenting with different variants of Equation (2).
The results in
Table 7 indicate that the statistical significance of the coefficients significantly decreased. Considering these results, the only significant factor was found to be the size of the enterprise. The corrections of the slope coefficients were not significant. The pooled tests for significance that we applied in post estimation showed that, in general, the variables were significant. However, it is obvious from the table that all the enterprises could be classified as exceptions [
35], which means that this model is not appropriate. The squared R is high (0.998) due to the higher quantity of variables included in the model. For these reasons, we sought another possible model with the highest individual significance among coefficients to avoid the assumptions related to exceptions in some of the enterprises. This model is presented in
Table 8.
In relation to model (2) with the dummies,
Table 8 clarifies the results. These results suggest the improvement of the models and provide approximately correct assumptions about the nature of the genesis of leverage. These results are consistent with previous research, such as Chipeta and Mbululu [
47], Bastos et al. [
48], Camara [
49], and Dincergok and Yalciner [
50]. In addition, liquidity was retained with a negative sign on the border of significance. However, all corrections of size were negative, which reveals the individual elasticities of leverage with respect to the size of each forest enterprise.
The negative elasticity of leverage with respect to liquidity means that the debt of the forest enterprises is necessary for the procurement of current assets. Moreover, the bigger the size of the enterprise, the better capabilities the enterprise has to finance its economic activities. It should be stressed that size is a typical reason for forest enterprises to be very confident with their credit use.
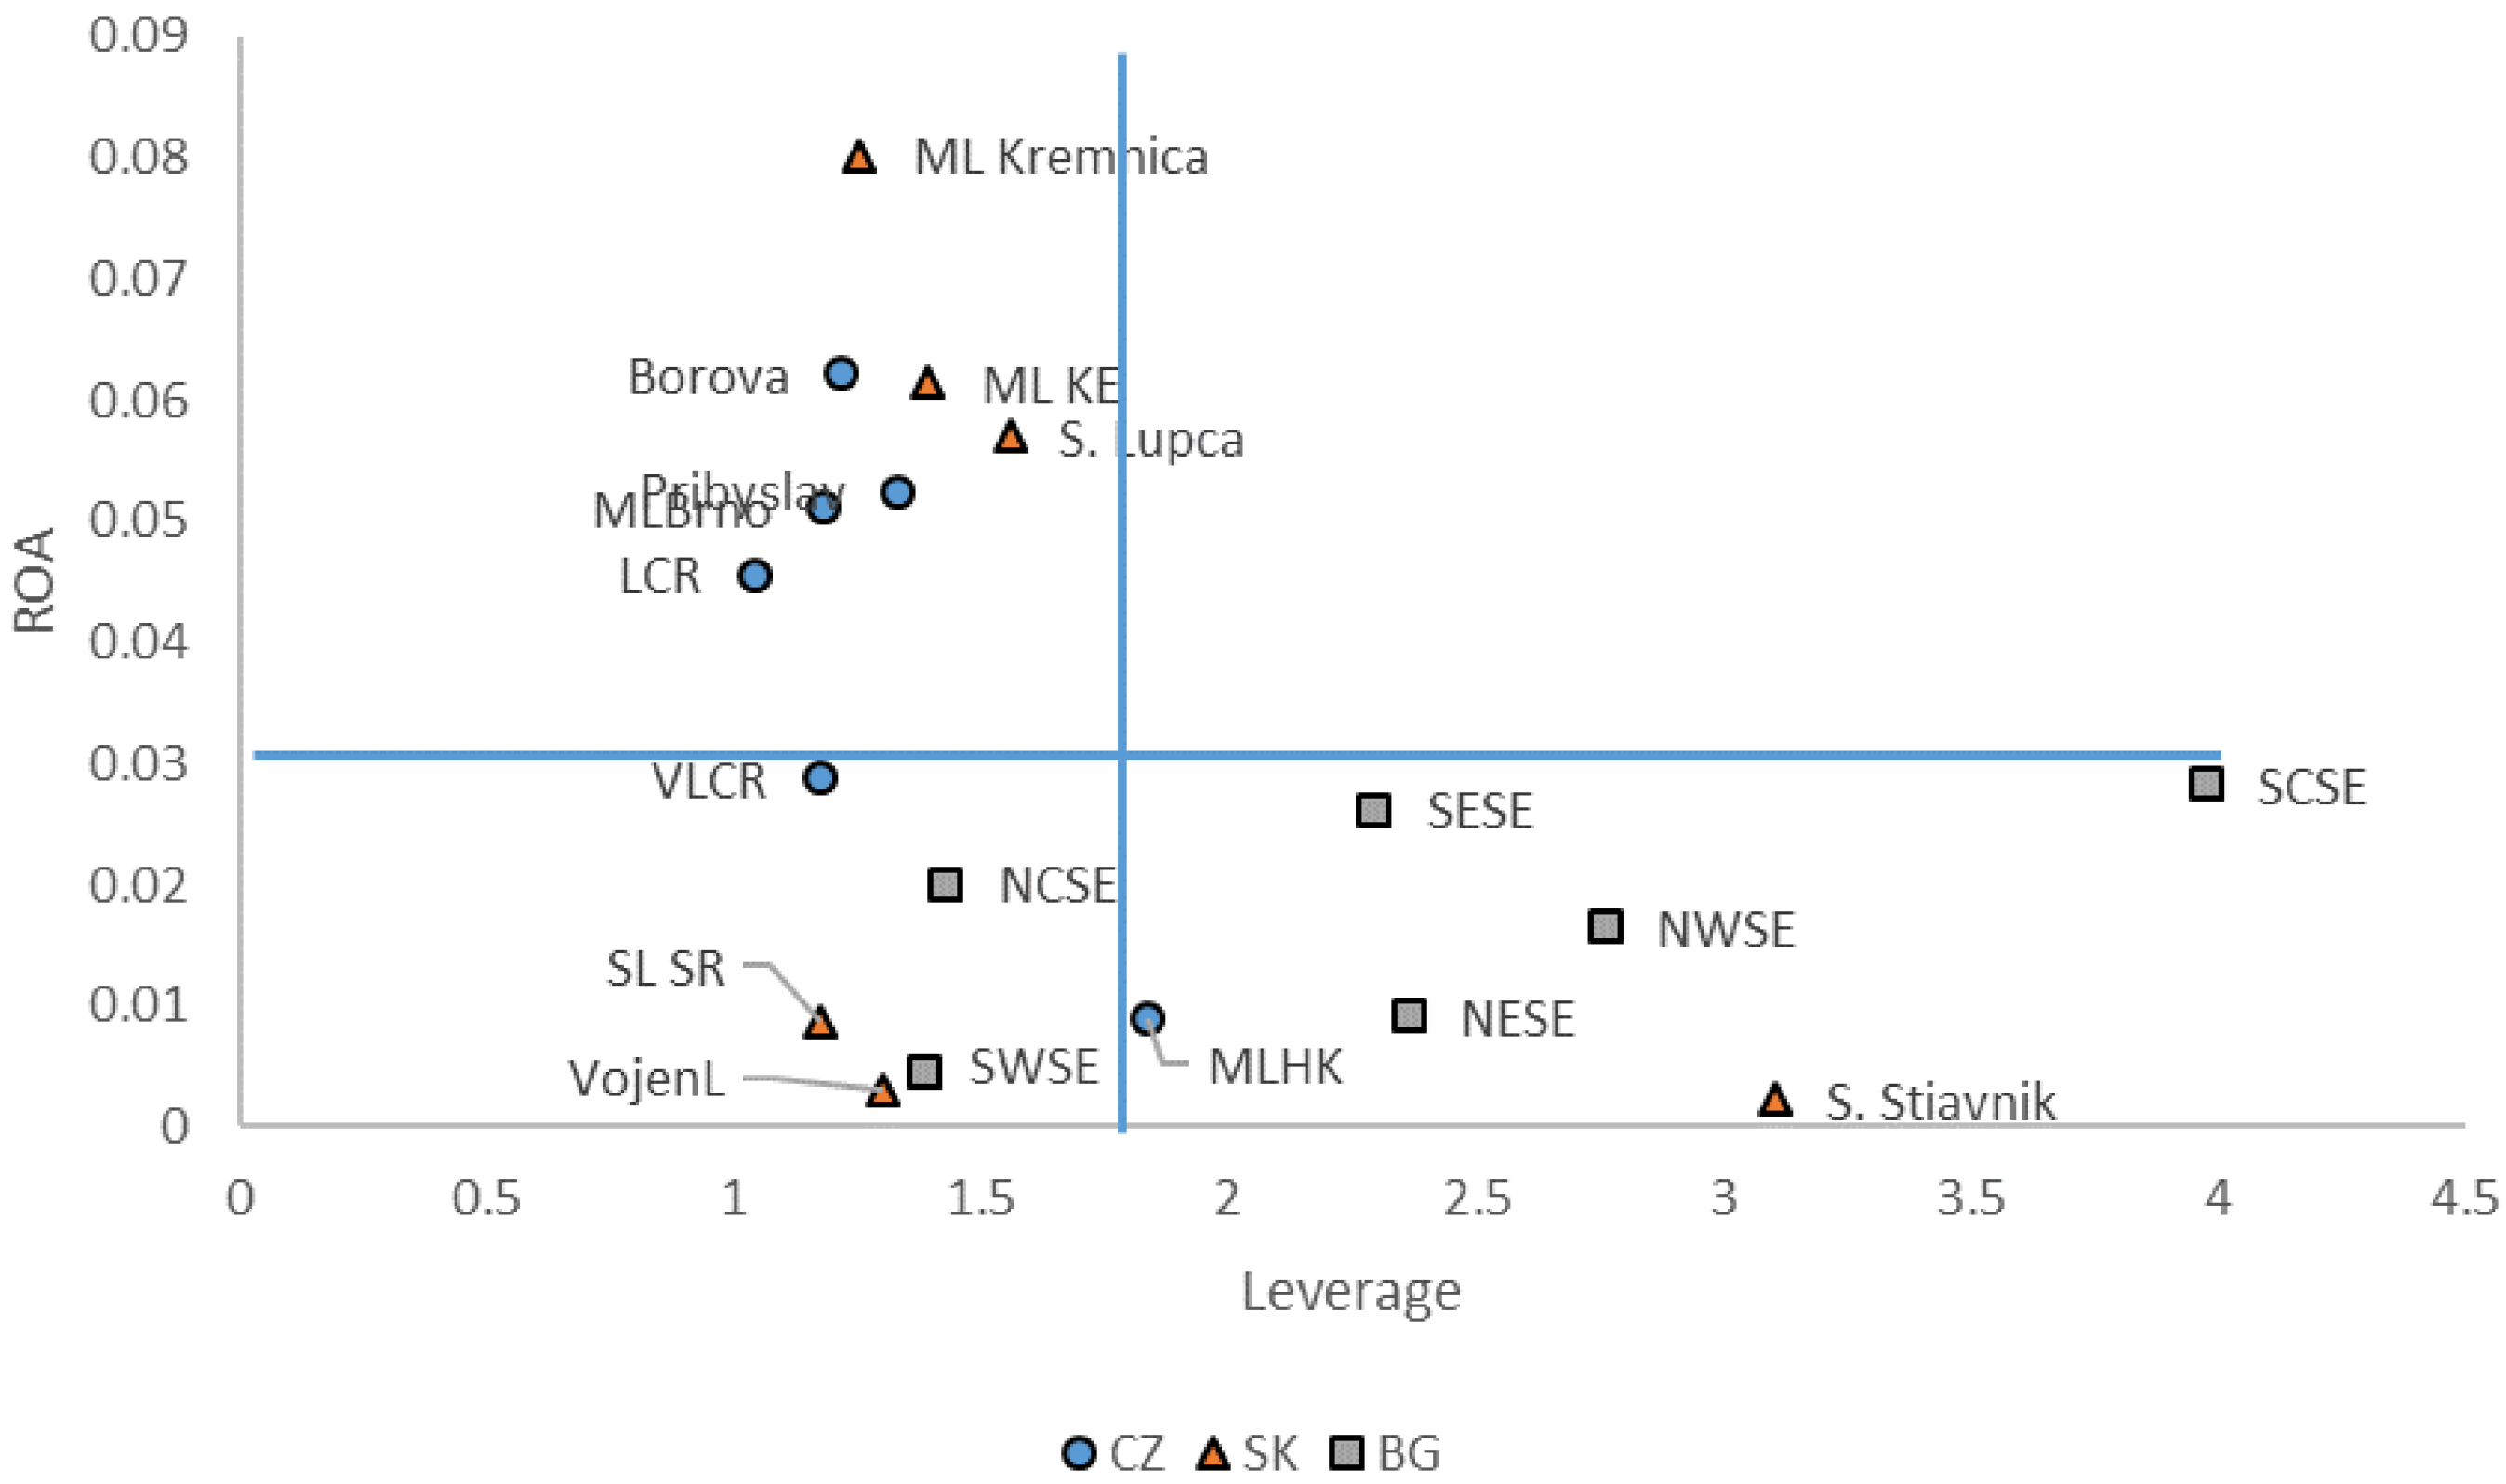
In the current research, the classification of forest enterprises was elaborated by the grouping presented in
Figure 1 and
Figure 2, as well as the individual slopes of leverage with respect to size. The Czech enterprises were characterised by the second highest average slope coefficient (elasticity) for size (0.603; estimated by Equation (5)) and the highest standard deviation (0.0.93). In this context, the forest enterprises managed to achieve a high
ROA with low indebtedness for the period of research. Furthermore, these enterprises were confident in their understanding that a larger size is more suitable for external financing. For all enterprises included in this research, the elasticity of leverage by liquidity (
LIQ) was negative and equal to −0.105. The results for the size elasticities of the investigated samples of enterprises are presented in
Table 9.
The equations in
Table 9 and the resulting tables for other enterprises show the elasticity of the financial leverage for each enterprise. Based on these findings, the enterprise with the steepest slope in
SIZE was Borova with a coefficient of 0.696. Most of the Czech enterprises were characterized by a high
ROA, with only two exceptions: MLHK and VLCR. MLHK had a steeper
SIZE slope and high leverage, while VLCR had a similar slope coefficient and low leverage. The leverage level is not directly connected to the propensity to borrow. On the other hand, three enterprises, Borova, MHLK, and VLCR, were exceptions among the main group of Czech enterprises and presented low leverage, low indebtedness, and high return on assets (
ROA).
According to the results, the Slovak enterprises were not very different from the Czech ones, but had a lower deviation value of 0.059. Moreover, the slopes of Slovak enterprises were the highest among the set of enterprises (0.612), but the difference was quite small. Their main group consisted of enterprises with low
ROAs. These enterprises were characterised by low leverage and small indebtedness, without any exceptions. One of the enterprises, S. Stiavnik, had a comparatively steep
SIZE slope and high leverage. Indeed, three of the Slovak enterprises had higher
SIZE slope coefficients than the Czech ones, but the value of
γ3 +
γ7 for the Borova (a Czech enterprise) slope was the steepest. Hence, Slovak enterprises were more willing to borrow in the case of a bigger size. The elasticities for the Slovak enterprises are presented in
Table 10.
The Bulgarian forest enterprises were the most homogenous according to the
SIZE slope, with an average slope of 0.571. The standard deviation was 0.040, which reveals the functional similarities among all Bulgarian enterprises. The major group was characterised by a high indebtedness, low
ROA, and high leverage. On the contrary, the size was not an important factor in accruing loans. The North Central State Enterprise and the North-East State Enterprise had high indebtedness and leverage below the mean values. There is a possible negative relationship between leverage and indebtedness. This relationship could be attributed to the fact that the Bulgarian enterprises are state-owned. For every euro received as a debt, the State subsidises the enterprises, which then improve their equity alongside the amount of their loans.
Table 11 presents the elasticities for the Bulgarian enterprises.
Here, the slopes are more evenly distributed. When the Slovak and Czech enterprises approach a lower size and begin to be financed by loans, the Bulgarian enterprises comfortably wait for governmental help. In addition, the relationship between elasticity and size was negative and almost linear, unlike enterprises in the other two countries, where the relationship was power-like.
These results provide interesting information on the elasticities of leverage in each country. Despite the observed differences, values ranged from 42.9% to 69.6%. Moreover, differences in the average values for each country were very slight. It can be hypothesised that the elasticity of leverage with respect to enterprise size is about 60% among the investigated countries.
The results of this paper are in line with those of previous research. According to the research conducted by Koksal and Orman [
51], industry types that reflect a number of specifics may be an important determinant of firms’ capital structures. In addition, the findings of Viszlai [
24], who analysed state-owned forest enterprises in Slovakia, indicated that forest enterprises use external sources for financing in very low proportions. Moreover, small- and medium-sized forestry enterprises are considered by banks to be risky due to their seasonality, insufficient financial histories, or lack of appropriate liability [
52]. The works by Amraoui et al. [
53] and Feudjo et al. [
54] reflect the specifics of every country that affect choices of capital structure. The authors concluded that macroeconomic factors have no impact on the leverage levels of firms, so debt decisions are completely related to firms’ specifics. Apart from the above-mentioned determinants, the size of a company represents a determinant that might have an impact on capital structure and is often synonymous with self-financing [
55]. Additionally, the outcome of our research is similar to a study conducted by Khan [
56], who also indicated
ROA as an insignificantly important factor. Self-financing is also possible along the entire wood supply chain if enterprises implement contemporary approaches for the production of wood-based products that can improve material management and production efficiency.


 ,
, 


