Abstract
The main driver of the Carpathian landscape is the process of natural forest succession on the semi-natural meadows unique to the region. Moreover, these semi-natural mountain meadows contribute to ecosystem services, although increasing forest areas are recommended by current international policy agendas. The purpose of this study was to examine the impact of natural forest succession in the Polish part of Carpathian on changes in soil organic carbon and assess the influence of different soil properties on organic carbon content across three land uses. Soil samples were taken from 10 transects consisting of semi-natural mountain meadow, natural successional forest and old-growth forest, selected in three Polish Carpathian national parks. Measurements of organic carbon, dissolved organic carbon, microbial properties, such as microbial respiration, and enzyme activities were made; additionally, biochemical indicators were calculated. To describe the influence of measured soil parameters and calculated indicators of soil organic carbon changes, the organic carbon dependent variable regression equations across all studied soils and for the individual land use and examined layers were evaluated. The overall regression equation indicated that changes in organic carbon general to all investigated soils depended on microbial biomass carbon content, microbial quotient, dissolved organic carbon content and metabolic quotient. The regression models obtained for the individual land use variants and soil layers explained 77% to 99% of the variation in organic carbon. Results showed that natural forest succession caused a decrease in microbial biomass carbon content, and successional forest soils characterized less efficient use of organic substrates by microbial biomass.
1. Introduction
European mountain areas are characterized by the high diversity of habitats resulting from natural conditioning as well as human activity. The Carpathian Mountains are the largest, longest and most fragmented mountain chain in Europe. Moreover, this mountain chain is characterized by a high variety of relief, with intra-mountainous regions, depressions, sub-mountain hills and lowlands. These, along with altitudes exceeding 2500 m, contribute to the magnificent landscape of the Carpathians [1].
Semi-natural mountain meadows are an integral part of the Carpathian landscape [2]. In recent times, however, less-productive and inconveniently located grasslands are being increasingly abandoned [3] due to socio-economic changes in the Carpathians. Following abandonment, overgrowing of these unique meadows by the surrounding forest has begun to progress. The negative and positive effects of these land-use changes and continuous natural forest succession in the Polish part of Carpathians are a debatable issue, especially in the context of carbon sequestration and climate changes. In any case, semi-natural mountain meadows have a great contribution to ecosystem services. These areas provide food, e.g., hay for sheep; regulating services, e.g., water regulation, preventing soil erosion and carbon sequestration; supporting services, such as primary production and water cycling; and cultural services, e.g., tourism and contributing to the overall landscape. Moreover, it is well known that land-cover changes influence carbon cycling in the soil. Thus, the Polish part of the Carpathian Mountains is an appropriate study area to assess changes in the soil carbon cycle during natural forest succession.
The importance of such studies was highlighted by Garcia-Pausas et al. [3], who stated that woody plants can significantly influence carbon balance, but the size of this effect is still unknown. Moreover, soils contain more than twice the carbon found in the atmosphere [4]; thus, even a little change in soils may greatly influence the carbon balance. Many authors [5,6,7] have reported the impact of land-use changes on organic carbon content in soil. Nevertheless, land-use changes simultaneously may cause carbon sequestration or carbon dioxide emission. Restoring grasslands, forest or other native vegetation on former croplands increases soil organic carbon content [4]. However, there is still a lack of knowledge covering the impact of natural processes, such as forest succession on soil organic carbon.
Some of the main factors that influence soil organic carbon changes are biotic properties, consisting mainly of the quantity and quality of carbon inputs into soil. These factors work together with climatic variables and abiotic soil factors to regulate carbon dynamics in soils [8]. Natural forest succession processes in the Carpathian make it possible to distinguish different kinds of carbon inputs, such as easily decomposed grass in meadows, fresh fall from young, successional trees and the constant supply of fresh litter during the climax stage of a forest. As such, studies on soil organic carbon changes in a changing mountain environment may be particularly useful.
Soil is a dynamic environment in which accumulation and decomposition of organic matter continuously occur. Two crucial processes leading to transformation of soil organic matter are mineralization and humification. According to Kandeler et al. [9], microorganisms play an important role in organic matter decomposition, especially mineralization, mainly via respiratory processes. Measurement of soil heterotrophic respiration, referring to the production of CO2 from microbial respiration [10], is simply a method to describe overall soil conditions, as well as the activity of the microbial community in soil [11]. This process has an essential contribution to carbon cycling and the global carbon budget by releasing carbon dioxide from the soil to the atmosphere [12].
Studies on soil heterotrophic and autotrophic respiration were used to predict soil carbon processes and below-ground carbon sequestration in successional forests [13]. Microbial soil respiration was also broadly used in the studies to monitor changes between different land-use areas, such as grasslands converted to cornfields [14], wheat fields, vineyards and cherry farms [15], or natural forest, arable lands, citrus gardens and paddy fields [16], but studies on natural soil-respiration changes in land-use transformation are very rare. Soil heterotrophic respiration is usually used in combination with other indicators, such as microbial biomass carbon as an indicator of soil quality. Some authors [17,18] have highlighted the importance of quantifying soil microbial activity parameters as indicators enhancing the evaluation of changes in land use.
Additionally, other parameters, such as metabolic quotient, microbial quotient and mineralization quotient, have been evaluated to monitor the changes in soil quality connected with soil organic carbon cycle [16,19,20]. The metabolic quotient was used as an index of microbial efficiency in utilizing the available resources [18], as well as an indicator of the degree of substrate limitation for soil microbes [21]. The microbial quotient reflects the microbial biomass contribution to soil organic carbon and also indicates the fraction of recalcitrant organic matter in the soil [20]. Moreover, the microbial quotient was characterized as an indicator of further changes in organic matter during land-use alterations [22]. The mineralization quotient expresses the fraction of total organic carbon mineralized during the incubation time [20] and was used as an indicator of condition stability of chemical, biochemical and microbiological properties [16], as well as being characterized as an indicator of the efficiency of micro-flora in metabolizing soil organic carbon [23]. Nevertheless, Mganga et al. [19] defined the mineralization quotient as the most sensitive indicator of land-use change from natural ecosystem to agroecosystem.
These parameters are widely used in research as responsive indicators of soil quality, which may help to explain ecological processes of the environment [24]. Thus, in this study, metabolic quotient, microbial quotient, mineralization quotient and chosen microbial soil properties were used as the indicators to help assess and explain soil organic carbon changes during the natural forest succession in the Polish part of Carpathians. The purposes of this study were to (i) examine the impact of natural forest succession on the soil organic carbon content, (ii) assess the differences of measured soil properties and biochemical indicators in semi-natural mountain meadows, natural succession forest and old-growth forest and (iii) investigate the soil properties and biochemical parameters affecting soil organic carbon content across changing land uses.
2. Materials and Methods
2.1. Research Area
The study area was located in the Carpathian Mountains, covering the southern part of Poland. Soil samples were collected from the three Polish Carpathian national parks—Pieniny National Park (PNP), Bieszczady National Park (BdNP) and Magura National Park (MNP)—which are located in different parts of the Polish Carpathians (Figure 1).
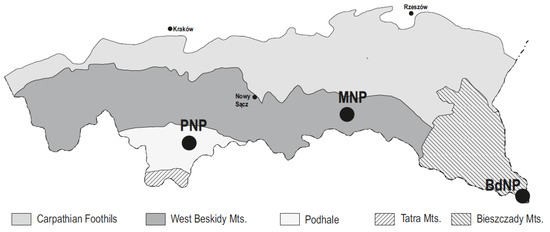
Figure 1.
The location of the examined national parks in the Polish part of the Carpathian Mountains. BdPN—Bieszczady National Park, MNP—Magura National Park, PNP—Pieniny National Park.
The Carpathian Mountains are characterized by diversity of geological cover; in the PNP, one of the dominant parent materials are rocks of sandstone–shale series with an admixture of carbonate binder [25], whilst the BdNP and MNP soils were formed on the Carpathian Flysch with the dominance of sandstones, mudstones and shales [26]. Almost all of the investigated soils of PNP, BdNP and MNP were classifiable as cambisols with a varied trophicity (dystric and eutric cambisols) (Table 1) and were classified as loamy [27]. The basic soil properties of examined soil depended mainly on location. The highest content of total nitrogen and higher pH values were found in PNP compared to BdNP and MNP. However, BdNP characterized the highest C:N ratio [27].

Table 1.
Location of the study areas and soil units at the area of the transects according to World Reference Base for Soil Resources (WRB) classification (IUSS Working Group WRB, 2015).
2.2. Sampling Scheme
In each national park, three (PNP, MNP) or four (BdNP) transects consisting of semi-natural meadow, natural succession forest and old-growth forest were chosen (Table 1). These areas were chosen based on the historical data about land use of the study area and available satellite maps covering the study area.
The semi-natural meadows occur at sites whose natural vegetation is forest and were created as a result of forest clearing during the colonization of the Polish part of Carpathians in the 13th and 14th centuries. Over centuries, the semi-natural meadows were used for agriculture, especially pasture activity. They are formed mostly by native species of perennial plants, which have spread across the landscape because of human activity [28]. The natural succession forests are areas covered by 25–70-year-old forest and were created by overgrowing abandoned meadows. They are formed by different successional tree species and are dominated by Fagus sylvatica L. (common beech). The old-growth forests are areas covered by more than 150-year-old forests. The study old-growth forest stands belong to a Dentario glandulosae-Fagetum (Carpathian beech forest) forest habitat.
In each of the selected areas (semi-natural meadow, succession forest, and old-growth forest) in each of 10 study transects, five soil samples from both 0–10 cm and 10–20 cm soil layers were taken. Soil samples were collected using a metal five-centimetre-diameter core.
2.3. Laboratory Analyses
In the laboratory, fresh soil samples were sieved with a 2 mm mesh, and a portion of each soil sample was kept at −21 °C prior to laboratory analysis. One week prior to the analyses, soil samples were preincubated at a temperature of 25 °C and a soil moisture value equal to 40–60% water holding capacity was achieved. The rest of each soil sample was air-dried and also sieved with a 2 mm mesh.
Microbial respiration, microbial biomass carbon (MBC), dissolved organic carbon (DOC), dehydrogenase activity (DHA) and invertase activity (INV) were assessed in the fresh soil samples. Microbial respiration was estimated by the incubation method. First, 10 g of fresh soil was placed into a 100 mL vial containing a small beaker of 3 mL 0.5 M NaOH as a carbon dioxide trap. Next, the vial with the fresh soil/NaOH beaker was hermetically closed for a three-day sampling period. Incubation took place at a constant temperature of 25 °C. After the three-day sampling period, the vial was opened and the carbon dioxide evolved from soil was quantified by titration with 0.05 M HCl after the addition of 2 mL of BaCl2. After this, the vial was opened and ventilated for four days. Blank samples, i.e., vials containing only beakers with NaOH, were used to assess carbon dioxide trapped during incubation from the air closed in the vials and during handling. The microbial respiration measurements were repeated once a week for five weeks.
MBC was evaluated using a fumigation–extraction method [29]. DOC content was measured following extraction using 5 mM CaCl2 (soil:CaCl2 ratio 1:10) and filtered by 0.45 µm. MBC and DOC were measured using the dry combustion method with a Euro Thermo TOC-TN 1200 (Landsmeer, The Netherlands). DHA levels were assessed using the method presented by Casida et al. [30], while INV activity was determined as previously described Frankenberger and Johanson [31]. Enzyme activities were measured using a Shimadzu UV-1800 (Kyoto, Japan) spectrophotometer. In air-dried soil samples, the content of total organic carbon (Corg) according to the oxidation and reduction Tiurin method was measured [32].
2.4. Calculations and Statistical Analyses
Based on the first-order kinetic model of microbial respiration (Cm = C0(1 − e−kt)), the calculated cumulative value of mineralized carbon during incubation time (35 days) (Cm), potentially mineralizable carbon (C0) and rate constant (k) were estimated [33].
Based on the obtained results of microbial parameters and carbon content, the following biochemical indicators were calculated: (1) metabolic quotient (qCO2), expressing the ratio of microbial respiration (C-CO2) to soil microbial biomass carbon (MBC) (qCO2 = C-CO2/MBC) [34]; (2) the microbial quotient (qMIC), representing the quotient of soil microbial biomass carbon (MBC) and total organic carbon content (Corg) (qMIC = MBC/Corg); and (3) the mineralization quotient (qM), estimated as the ratio of cumulative respiration (CR5weeks) and total organic carbon content (Corg) (qM = CR5weeks/Corg) [16].
Statistical analyses were performed using Statistica 13.0 software. Means and standard errors were estimated for individual land-use variants (meadow, succession forest and old-growth forest) for both the 0–10 cm and 10–20 cm layers. To describe the influence of measured soil parameters and calculated indicators of soil organic carbon changes, the Corg dependent variable regression equations across all studied soils and for the individual land-use and examined layers were evaluated. Moreover, differences in examined soil properties and calculated indicators for the different land-use variants and soil layers were assessed using a one-way ANOVA post hoc Tuckey’s test at a significance level of p = 0.05.
3. Results
3.1. Total Organic Carbon and Labile Carbon
The mean Corg content slightly increased from semi-natural meadow soils (MS) to succession forest soils (SS) to old-growth forest soils (FS) in the 0–10 cm layer, while, in the 10–20 cm layer, SS had the lowest Corg and FS the highest. Across all land uses the content of Corg in the 0–10 cm layer was significantly higher compared to the 10–20 cm layer. (Figure 2). In the 0–10 cm layer, the lowest DOC values were found in SS and the highest in FS, while, in the 10–20 cm layer, the mean DOC content increased from MS to SS (Figure 2). SS had the lowest MBC content in both examined layers, but only in the 10–20 cm layer was the MBC significantly higher in MS compared to SS (Figure 2).
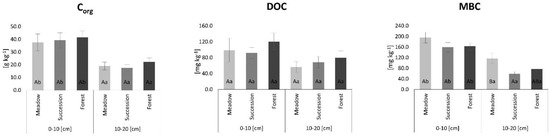
Figure 2.
Content of total organic carbon (Corg), dissolved organic carbon (DOC) and microbial biomass carbon (MBC) in soils. The lowercase letters indicate differences between examined soil layers for individual land-use variants, while uppercase letters show differences between land-use variants separately for the 0–10 and 10–20 cm soil layers (Tukey post hoc test, p < 0.05). Standard error is reported as bars.
3.2. Microbial Activity
Enzyme activity patterns differed depending on the examined enzyme (Figure 3). DHA decreased from MS to SS to FS in the 0–10 cm layer but had the highest mean values for MS and the lowest for SS in the 10–20 cm layer. FS had the highest INV activity and SS the lowest activity in both the 0–10 and 10–20 cm layers (Figure 3).
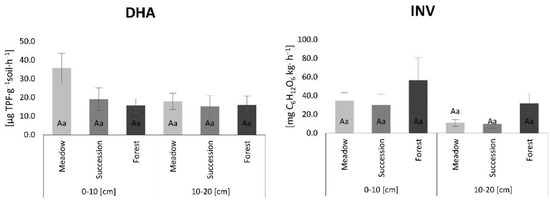
Figure 3.
Dehydrogenase activity (DHA) and invertase activity (INV) results. The lowercase letters indicate differences between examined layers for individual land-use variants, while uppercase letTable 0 and 10–20 cm layers (Tukey post hoc test, p < 0.05). Standard error is reported as bars.
The mean microbial respiration ranged from 0.09 mg CO2 g soil−1 24 h−1 (FS, 0–10 cm, 5th week) to 1.57 mg CO2 g soil−1 24 h−1 (MS, 0–10 cm, 1st week). Overall, the microbial respiration values decreased with the incubation period. In the 0–10 cm layer, SS had the highest microbial respiration values in almost all incubation weeks, except the first week. In the 10–20 cm layer, over the first three weeks, the highest microbial respiration values were found in SS; however, in the fourth and fifth weeks, the highest values were noted in MS (Figure 4).
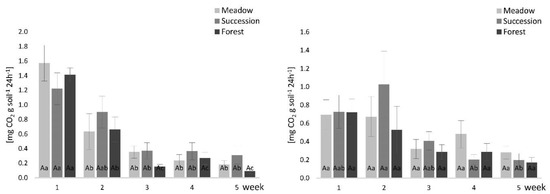
Figure 4.
Soil respiration results for the (a) 0–10 cm and the (b) 10–20 cm soil layers. The lowercase letters indicate differences between individual weeks in the same land-use variants, while uppercase letters show differences between land-use variants for individual weeks (Tukey post hoc test, p < 0.05). Standard error is reported as bars.
The calculated values of mineralized carbon during the incubation time (Cm) and potentially mineralizable carbon pools (C0) did not differ significantly between individual land-use variants as layers (Table 2). However, in the 0–10 cm layer, the mean Cm and C0 values were the highest in SS and the lowest in FS. Meanwhile, in the 10–20 cm layer, the highest Cm and C0 mean values were found in SS and MS, respectively. In contrast, the first-order rate constant of labile pool mineralization (k) was significantly lower in MS and SS compared to FS in the 0–10 cm layer (Table 2).
Table 2.
Mean and standard error values of cumulative value of mineralized carbon during incubaTable 35 days (Cm), potentially mineralizable carbon (C0) and rate constant (k) results. The lowercase letters indicate differences between examined soil layers for individual land-use variants, while uppercase letters show differences between land-use variants separately for the 0–10 and 10–20 cm soil layers (Tukey post hoc test, p < 0.05). Standard error is reported behind “±”.
3.3. Biochemical Indicators
The calculated values of the biochemical indicators slightly depended on land use and soil layer (Table 3). The qCO2 mean value was almost two times higher in SS compared to MS and FS in the 10–20 cm layer. Mean qMIC decreased from MS to SS to FS in both examined soil layers; significant differences were found between soils in the 10–20 cm layer. Mean qM slightly decreased from MS to FS in the 0–10 cm layer, whereas in the 10–20 cm layer the qM mean value in SS was about 47% higher compared to FS. Moreover, the mean values of qCO2 and qM in the 0–10 cm layer of SS were significantly lower than the 10–20 cm layer (Table 3).
Table 3.
Mean and standard error values of metabolic quotient (qCO2), microbial quotient (qMIC) and mineralization quotient (qM) results. The lowercase letters indicate differences between examined soil layers for individual land-use variants, while uppercase letters show differences between land-use variants separately for the 0–10 and 10–20 cm soil layers (Tukey post hoc test, p < 0.05). Standard error is reported behind “±”.
3.4. Parameters Affecting Soil Organic Carbon Content
The overall regression equation indicated that the soil organic carbon content, across all studied soils, depended on MBC, qMIC, DOC and qCO2 values, according to the equation:
The obtained model explained 83% of the variance in the dependent variable, and the standard error of estimation was 7.5. Nevertheless, when we took into consideration the regression equations for individual land-use variants, we can state that different microbial parameters and biogeochemical indexes shaped Corg content depending on land cover and soil layer. Comparing the regression models for meadow, succession forest and old-growth forest soil for both examined layers, it was noted that the models for different land-use variants clearly differed between MS, SS and FS for the 0–10 cm layer, while, in the 10–20 cm layer, Corg MS and FS depended on the same parameters (Table 4). The regression models explained 77% to 99% of the variation in Corg in the individual land-use variants and soil layers.
Table 4.
Total organic carbon (Corg) dependent variable regression for individual examined land-use and soil layer variants.
4. Discussion
4.1. Impact of Natural Forest Succession on Soil Organic Carbon
Land-use change is one of the main factors influencing the organic carbon cycle. Many studies, Bell et al., Liu et al., Luo et al., Mganga et al. [19,35,36,37], highlighted the importance of land-use conversion on soil organic carbon dynamics. Moreover, such changes in land cover and land use can have a significant impact on global carbon pools and fluxes [38]. While, here, only a slight increase in Corg during natural forest succession was noted, this was also confirmed in a previous study [39]. However, according to estimations, even a marginal (0.01% annually) increase in Corg content in soil via carbon sequestration may easily offset annual rises in the atmospheric carbon dioxide [40]. Thus, even small changes may play an important role in carbon dynamics, carbon cycle and carbon sequestration at both the local and global scale.
Natural succession is the default management strategy for the abandonment of agricultural lands, which influence both aboveground and belowground carbon accumulation [41]. Moreover, natural forest succession increases forested areas, which are considered an important soil organic carbon pool. Forest soils contain almost half of the total organic carbon in terrestrial ecosystems [42] and play a crucial role in the context of carbon sequestration; therefore, increasing forest areas is recommended by current international policy agendas. On the other hand, overgrowth of highly valuable semi-natural meadows in Polish national parks in the Carpathian Mountains, caused by a continuous process of natural forest succession, can decrease biodiversity and cause the disappearance of unique mountain landscapes [43,44]. The differences in meadow and forest ecosystem stability compared to succession forests has been highlighted in previous studies [39,45]. However, the present study showed a greater similarity of Corg changes in MS and FS in the 0–10 cm layer, while, in the 10–20 cm layer, the factors shaping Corg in MS and SS were the same. Such results may confirm that the 0–10 cm soil layer is more susceptible to changes along land-use and land cover changes, such as natural forest succession.
4.2. The Soil Properties and Biochemical Parameters Affecting Soil Organic Carbon Content across Changing Land Uses
The influence of studied soil properties and calculated parameters on Corg across all land uses in the Polish Carpathians was more differential in the 0–10 cm layer compared to the 10–20 cm soil layer. Forests and grasslands are assumed to be stable ecosystems, playing a crucial role in carbon sequestration and the carbon cycle. Moreover, grasslands, through photosynthesis, capture about 20% of the CO2 released to the atmosphere annually [46]. Thus, the regression results of our study showed that the content of Corg in FS and MS in the 0–10 cm layer is determined by some similar parameters. The positive impact of DHA in the regression model of Corg in MS and FS highlights an important role of microbial activity in shaping the organic carbon pool in such ecosystems. Maini et al. [47] related that DHA levels vary in soils of different land uses with the addition of organic residues on the soil surface. However, Błońska et al. [48] found a large amount of component of nutrient cycling in the initial stages of organic matter decomposition in forest systems, which resulted in higher DHA levels. Meanwhile, in the 0–10 cm layer of SS, the INV level had significant influence on the Corg content. Invertase is one of the most important enzymes in the soil carbon cycle and is related to the transformation and decomposition of soil organic carbon by hydrolyzing carbohydrates to sugars and oligomers that are suitable for uptake by plants and microbes [49].
The positive influence of INV and MBC on Corg, as well as the fact that the lowest mean values of these parameters were found in SS, may indicate that the presence and activity of microorganisms in such a constantly changing environment is the limiting factor for Corg changes in succession land use. According to Souza et al. [50], the ability of microbial biomass to convert organic carbon under stress is reduced, resulting in decreased qMIC levels. Natural forest succession caused the deterioration of conditions for microbial growth, which was confirmed by the decrease in qMIC from MS to FS, as well as the negative impact of qMIC in the regression of Corg in SS and FS. In contrast, Susyan et al. [51] noted an increase in qMIC levels within secondary forest succession. However, Insam and Domsch [52] reported declining qMIC in open-pit mine soils under forest succession, which indicated decreasing Corg availability due to progressive accumulation of recalcitrant humic material. Additionally, Corg in the 0–10 cm layer for MS and FS was significantly influenced by mineralization parameters (qM and Cm), which may also confirm the higher stability of such ecosystems.
Bakhshandeh et al. [16] used qM as an indicator of chemical, biochemical and microbiological soil properties’ stability. Meanwhile, here, natural forest succession influenced an increase in Cm and C0 content in the 0–10 cm layer, which indicated faster mineralization of organic matter in SS compared to FS and MS. According to Moscatelli et al. [33], lower values of Cm and C0 demonstrate lower respiration rates and the presence of a smaller fraction of organic carbon available for mineralization. Nevertheless, the rate constant of labile pool mineralization in SS was significantly lower compared to FS. Similarly, Jiang et al. [53] found the highest k values in forest land compared to other land-use types.
Conversely, in the 10–20 cm layer, the influence of natural forest succession on organic carbon changes was inconsiderable; especially in the MS and SS, the same parameters defined the Corg content in regression models. However, the qCO2, which is a frequently used indicator of ecosystem development and soil disturbance [54], was the most important parameter that influenced Corg changes in Carpathian soils, especially in the 10–20 cm layer. SS had the highest qCO2; similar results were presented by Susyan et al. [51], who found the highest qCO2 values in succession stages on the arable lands. Susyan et al. [51] also stated that the lack of a decline in qCO2 values during forest succession confirmed simultaneous changes in microbial biomass and respiration activity. The MS and FS in the Carpathians had a higher microbial efficiency in utilizing the available resources, which was related to the lower qCO2 [19].
Additionally, lower qCO2 in MS and FS may reflect the higher stability of organic substrates by the presence of microbial biomass [55]. However, the highest qCO2 in SS was related to the lowest MBC, especially in the 10–20 cm layer. Such results are in agreement with Umarov et al. [56], who showed an increase in microbial biomass carbon content during the first 17 years after secondary forest succession, which then gradually decreased and remained at a quite constant level after 24 years of succession. Nevertheless, Susyan et al. [51] stated that microbial biomass increase could be related to increasing input and accumulation of organic carbon during forest succession, and, in disagreement with our results, they noted an increase in microbial biomass carbon along succession. Likewise, Mganga et al. [19] found lower qM values in the natural ecosystem in the Mt. Kilimanjaro region compared to arable land, which was associated with lower ratios of easily mineralizable organic matter to stable organic matter in soils under natural vegetation. These findings are in accord with our results obtained for FS, expressed by the qM values and regression models.
5. Conclusions
Despite no significant differences in the content of Corg between semi-natural meadow, succession and old-growth forest, the natural forest succession in the Polish Carpathian Mountains influences the type and the rate of the Corg decomposition and transformation. The obtained results have shown that the natural forest succession caused a decrease in MBC content, especially in the 10–20 cm layer. Moreover, SS characterized less efficient use of organic substrates by microbial biomass compared to MS and FS, expressed by qCO2.
Overall, across all studied soils, the significant impact on Corg had MBC, qMIC, qCO2 and DOC. The obtained model explained 83% of the variance in Corg. Meanwhile, the content of Corg in the individual land-use variants and depths was shaped by different biochemical factors depending on land use and soil layer. In the 0–10 cm soil layer, the differences between MS and SS, and FS and SS were more distinct, while the changes in Corg in MS and FS were determined by similar properties. Meanwhile, in the 10–20 cm layer in MS and SS, the Corg content was shaped by the same parameters.
The insight into Corg changes confirmed the findings that meadows and forests are stable ecosystems that were formed over hundreds of years, while successional processes are dynamic continuously changing ecosystems—ecotone zones. The stability of meadow and forest ecosystems is an important issue in the context of carbon sequestration and climate change. Taking into account the problems of decision makers managing protected areas, such as national parks, it would be appropriate to protect the semi-natural mountain meadows to preserve their biodiversity and the ecosystem services they provide, which are important globally, but even more at the local scale.
Author Contributions
Conceptualization, J.S., A.J. and T.Z.; methodology, J.S. and A.J.; software, not applicable; validation, J.S. and A.J.; formal analysis, J.S. and A.J.; investigation, J.S.; resources, J.S.; data curation, J.S.; writing—original draft preparation, J.S.; writing—review and editing, A.J. and T.Z.; visualization, J.S.; supervision, A.J. and T.Z.; funding acquisition, T.Z. All authors have read and agreed to the published version of the manuscript.
Funding
This research was funded by Statutory financial support of Ministry of Science and Higher Education RP Department of Soil Science and Agrophysics [010013-D011 in 2021] University of Agriculture in Krakow.
Data Availability Statement
The data presented in this study are available on request from the corresponding author.
Acknowledgments
We wish to thank Cambridge Proofreading team for reading the manuscript and for language corrections.
Conflicts of Interest
The authors declare no conflict of interest.
References
- Cheval, S.; Birsan, M.V.; Dumitrescu, A. Climate variability in the Carpathian Mountains Region over 1961–2010. Glob. Planet. Change 2014, 118, 85–96. [Google Scholar] [CrossRef]
- Tokarczyk, N. Forest encroachment on temperate mountain meadows—Scale, drivers, and current research directions. Geogr. Pol. 2017, 90, 463–480. [Google Scholar] [CrossRef]
- Garcia-Pausas, J.; Romanyà, J.; Montané, F.; Rios, A.I.; Taull, M.; Rovira, P.; Casals, P. Are Soil Carbon Stocks in Mountain Grasslands Compromised by Land-Use Changes? In High Mountain Conservation in a Changing World; Catalan, J., Ninot, J.M., Mercè, A.M., Eds.; Springer Open: Geneva, Switzerland, 2017; pp. 207–249. [Google Scholar]
- Smith, P. Land use change and soil organic carbon dynamics. Nutr. Cycl. Agroecosyst. 2008, 81, 169–178. [Google Scholar] [CrossRef]
- Guo, L.; Gifford, R. Soil carbon stocks and land use change: A meta analysis. Glob. Change Biol. 2002, 8, 345–360. [Google Scholar] [CrossRef]
- Martín, J.A.; Álvaro-Fuentes, J.; Gonzalo, J.; Gil, C.; Ramos-Miras, J.J.; Grau Corbí, J.M.; Boluda, R. Assessment of the soil organic carbon stock in Spain. Geoderma 2016, 264, 117–125. [Google Scholar] [CrossRef] [Green Version]
- Nadal-Romero, E.; Cammeraat, E.; Pérez-Cardiel, E.; Lasanta, T. Effects of secondary succession and afforestation practices on soil properties after cropland abandonment in humid Mediterranean mountain areas. Agric. Ecosyst. Environ. 2016, 228, 91–100. [Google Scholar] [CrossRef] [Green Version]
- Luo, Z.; Feng, W.; Luo, Y.; Baldock, J.; Wang, E. Soil organic carbon dynamics jointly controlled by climate, carbon inputs, soil properties and soil carbon fractions. Glob. Change Biol. 2017, 23, 4430–4439. [Google Scholar] [CrossRef] [PubMed]
- Kandeler, E.; Stemmer, M.; Gerzabek, M.H. Role of Microorganisms in Carbon Cycling in Soils. In Microorganisms in Soils: Roles in Genesis and Functions; Buscot, F., Varma, A., Eds.; Springer: Berlin/Heidelberg, Germany; New York, NY, USA, 2005; pp. 139–158. [Google Scholar]
- Yazdanpanah, N.; Mahmoodabadi, M.; Cerdà, A. The impact of organic amendments on soil hydrology, structure and microbial respiration in semiarid lands. Geoderma 2016, 266, 58–65. [Google Scholar] [CrossRef]
- Józefowska, A.; Pietrzykowski, M.; Woś, B.; Cajthaml, T.; Frouz, J. Relationships between respiration, chemical and microbial properties of afforested mine soils with different soil texture and tree species: Does the time of incubation matter. Eur. J. Soil Biol. 2017, 80, 102–109. [Google Scholar] [CrossRef]
- Xu, M.; Shang, H. Contribution of soil respiration to the global carbon equation. J. Plant Physiol. 2016, 203, 16–28. [Google Scholar] [CrossRef]
- Huang, W.; Han, T.; Liu, J.; Wang, G.; Zhou, G. Changes in soil respiration components and their specific respiration along three successional forests in the subtropics. Funct. Ecol. 2016, 30, 1466–1474. [Google Scholar] [CrossRef]
- Mukumbuta, I.; Shimizu, M.; Hatano, R. Short-term land-use change from grassland to cornfield increases soil organic carbon and reduces total soil respiration. Soil Tillage Res. 2019, 186, 1–10. [Google Scholar] [CrossRef]
- Khanghahi, M.Y.; Murgese, P.; Strafella, S.; Crecchio, C. Soil biological fertility and bacterial community response to land use intensity: A case study in the Mediterranean Area. Diversity 2019, 11, 211. [Google Scholar] [CrossRef] [Green Version]
- Bakhshandeh, E.; Hossieni, M.; Zeraatpisheh, M.; Francaviglia, R. Land use change effects on soil quality and biological fertility: A case study in northern Iran. Eur. J. Soil Biol. 2019, 95, 103119. [Google Scholar] [CrossRef]
- Bastida, F.; Moreno, J.L.; Hernández, T.; García, C. Microbiological activity in a soil 15 years after its devegetation. Soil Biol. Biochem. 2006, 38, 2503–2507. [Google Scholar] [CrossRef]
- Toh, F.A.; Ndam, L.M.; Angwafo, T.E.; Christopher, N. Effect of Land Use Management Patterns on Mineralization Kinetics of Soil Organic Carbon in Mount Bambouto Caldera Area of Cameroon. Open J. Soil Sci. 2020, 10, 391–409. [Google Scholar] [CrossRef]
- Mganga, K.Z.; Razavi, B.S.; Kuzyakov, Y. Land use affects soil biochemical properties in Mt. Kilimanjaro region. CATENA 2016, 141, 22–29. [Google Scholar] [CrossRef]
- Moscatelli, M.C.; Lagomarsino, A.; Marinari, S.; De Angelis, P.; Grego, S. Soil microbial indices as bioindicators of environmental changes in a poplar plantation. Ecol. Indic. 2005, 5, 171–179. [Google Scholar] [CrossRef]
- Dilly, O.; Munch, J.C. Ratios between estimates of microbial biomass content and microbial activity in soils. Biol. Fertil. Soils 1998, 27, 374–379. [Google Scholar] [CrossRef]
- Nsabimana, D.; Haynes, R.; Wallis, F. Size, activity and catabolic diversity of the soil microbial biomass as affected by land use. Appl. Soil Ecol. 2004, 26, 81–92. [Google Scholar] [CrossRef]
- Francaviglia, R.; Renzi, G.; Ledda, L.; Benedetti, A. Organic carbon pools and soil biological fertility are affected by land use intensity in Mediterranean ecosystems of Sardinia, Italy. Sci. Total Environ. 2017, 599–600, 789–796. [Google Scholar] [CrossRef] [PubMed]
- Novak, E.; Carvalho, L.A.; Santiago, E.F.; Portilho, I.I.R. Chemical and microbiological attributes under different soil cover. Cerne 2017, 23, 19–30. [Google Scholar] [CrossRef]
- Niemyska-Łukaszuk, J.; Miechówka, A.; Zaleski, T. The soils of Pieniny National Park and their threats. Pieniny Przyroda Człowiek 2002, 90, 79–90. [Google Scholar]
- Skiba, S.; Drewnik, M.; Klimek, M. Pokrywa glebowa parków narodowych w polskich Karpatach. Przyroda Człowiek Bóg 2004, 1, 115–125. [Google Scholar]
- Sokołowska, J.; Józefowska, A.; Zaleski, T. Humus horizon development during natural forest succession process in the Polish Carpathians. J. Mt. Sci. 2022, 19, 647–661. [Google Scholar] [CrossRef]
- Zarzycki, J.; Korzeniak, J. Meadows in the Polish Carpathians—Present state, changes and preservation prospects. Rocznik Bieszczadzkie 2013, 21, 18–34. [Google Scholar]
- Voroney, P.; Brookes, P.C.; Beyaert, R.P. Soil microbial biomass C, N P and S. In Soil Sampling and Methods of Analysis; Carter, M.R., Gregorich, E., Eds.; Lewis Publ. CRC Press: Boca Raton, FL, USA, 2007; pp. 637–642. [Google Scholar]
- Casida, L.E.; Klein, D.A.; Santoro, T. Soil dehydrogenase activity. Soil Sci. 1964, 98, 371–376. [Google Scholar] [CrossRef]
- Frankenberger, W.T.; Johanson, J.B. Factors affecting invertase activity in soils. Plant Soil 1983, 74, 313–323. [Google Scholar] [CrossRef]
- Kabała, C.; Karczewska, A. Metodyka Analiz Laboratoryjnych Gleb i Roślin, 8th ed.; INoGOOE, UP: Wrocław, Poland, 2017. [Google Scholar]
- Moscatelli, M.C.; Di Tizio, A.; Marinari, S.; Grego, S. Microbial indicators related to soil carbon in Mediterranean land use systems. Soil Tillage Res. 2007, 97, 51–59. [Google Scholar] [CrossRef]
- Mondini, C.; Bigot, G.; Sinicco, T.; Mosetti, D. Biochemical indicators of soil fertility in vineyards with different conservative management systems. BIO Web Conf. 2019, 13, 04009. [Google Scholar] [CrossRef]
- Liu, M.; Liu, M.; Li, P.; Yang, J.; Wang, J.; Chang, Q. Variations in soil organic carbon decompositions of different land use patterns on the tableland of Loess Plateau. Environ. Sci. Pollut. Res. 2020, 27, 4337–4352. [Google Scholar] [CrossRef] [PubMed]
- Bell, S.; Barriocanal, C.; Terrer, C.; Rosell-Melé, A. Management opportunities for soil carbon sequestration following agricultural land abandonment. Environ. Sci. Policy 2020, 108, 104–111. [Google Scholar] [CrossRef]
- Luo, Z.; Viscarra Rossel, R.A.; Shi, Z. Distinct controls over the temporal dynamics of soil carbon fractions after land use change. Glob. Change Biol. 2020, 26, 4614–4625. [Google Scholar] [CrossRef] [PubMed]
- Ramesh, T.; Bolan, N.S.; Kirkham, M.B.; Wijesekara, H.; Kanchikerimath, M.; Srinivasa Rao, C.; Sandeep, S.; Rinklebe, J.; Ok, Y.S.; Choudhury, B.U.; et al. Soil organic carbon dynamics: Impact of land use changes and management practices: A review. Adv. Agron. 2019, 156, 1–107. [Google Scholar]
- Sokołowska, J.; Józefowska, A.; Woźnica, K.; Zaleski, T. Succession from meadow to mature forest: Impacts on soil biological, chemical and physical properties—Evidence from the Pieniny Mountains, Poland. Catena 2020, 189, 104503. [Google Scholar] [CrossRef]
- Lal, R. Societal value of soil carbon. J. Soil Water Conserv. 2014, 69, 186A–192A. [Google Scholar] [CrossRef] [Green Version]
- Silver, W.L.; Ostertag, R.; Lugo, A.E. The potential for carbon sequestration through reforestation of abandoned tropical agricultural and pasture lands. Restor. Ecol. 2000, 8, 394–407. [Google Scholar] [CrossRef]
- Mayer, M.; Prescott, C.E.; Abaker, W.E.A.; Augusto, L.; Cécillon, L.; Ferreira, G.W.D.; James, J.; Jandl, R.; Katzensteiner, K.; Laclau, J.P.; et al. Influence of forest management activities on soil organic carbon stocks: A knowledge synthesis. For. Ecol. Manag. 2020, 466, 118127. [Google Scholar] [CrossRef]
- Szwagrzyk, J. Sukcesja leśna na gruntach porolnych; stan obecny, prognozy i wątpliwości. Sylwan 2004, 4, 53–59. [Google Scholar]
- Wolski, J. Trwałość krajobrazu wiejskiego na przykładzie przekształceń zbiorowisk roślinnych bieszczadzkiej “krainy dolin” w ciągu ostatnich 150 lat. Chrońmy Przyrodę Ojczystą 2009, 65, 441–448. [Google Scholar]
- Zaleski, T.; Bodziarczyk, J.; Wężyk, P.; Gąsiorek, M.; Hawryło, P.; Józefowska, A.; Kajdas, B.; Mazurek, R.; Szostak, M.; Wanic, T.; et al. Wpływ Naturalnej Sukcesji leśnej na Właściwości Gleb w Strefie Ekotonowej (Między Lasem i łąką) w Pienińskim Parku Narodowym—Wstępne Wyniki Badań. 2018, Volume 20, pp. 3–20. Available online: https://www.pieninypn.pl/mfiles/1408/28/0/z/Pien15_s003-20_Zaleski_internet.pdf (accessed on 5 April 2022).
- Follett, F.; Kimble, J.M. The Potential of U.S. Grazing Lands to Sequester Carbon and Mitigate the Greenhouse Effect, 1st ed.; Publisher: CRC Press Boca Raton, Florida, 2001. [Google Scholar]
- Maini, A.; Sharma, V.; Sharma, S. Assessment of soil carbon and biochemical indicators of soil quality under rainfed land use systems in North Eastern region of Punjab, India. Carbon Manag. 2020, 11, 169–182. [Google Scholar] [CrossRef]
- Błońska, E.; Kacprzyk, M.; Spólnik, A. Effect of deadwood of different tree species in various stages of decomposition on biochemical soil properties and carbon storage. Ecol. Res. 2017, 32, 193–203. [Google Scholar] [CrossRef] [Green Version]
- Wan, S.; Xia, J.; Liu, W.; Niu, S. Photosynthetic overcompensation under nocturnal warming enhances grassland carbon sequestration. Ecology 2009, 90, 2700–2710. [Google Scholar] [CrossRef] [PubMed] [Green Version]
- Souza, R.C.; Hungria, M.; Cantão, M.E.; Vasconcelos, A.T.R.; Nogueira, M.A.; Vicente, V.A. Metagenomic analysis reveals microbial functional redundancies and specificities in a soil under different tillage and crop-management regimes. Appl. Soil Ecol. 2015, 86, 106–112. [Google Scholar] [CrossRef]
- Susyan, E.A.; Wirth, S.; Ananyeva, N.D.; Stolnikova, E.V. Forest succession on abandoned arable soils in European Russia—Impacts on microbial biomass, fungal-bacterial ratio, and basal CO2 respiration activity. Eur. J. Soil Biol. 2011, 47, 169–174. [Google Scholar] [CrossRef]
- Insam, H.; Domsch, K.H. Relationship between soil organic carbon and microbial biomass on chronosequences of reclamation sites. Microb. Ecol. 1988, 15, 177–188. [Google Scholar] [CrossRef]
- Jiang, L.; He, Z.; Liu, J.; Xing, C.; Gu, X.; Wei, C.; Zhu, J.; Wang, X. Elevation gradient altered soil C, N, and P Stoichiometry of pinus taiwanensis forest on Daiyun Mountain. Forests 2019, 10, 1089. [Google Scholar] [CrossRef] [Green Version]
- Saviozzi, A.; Levi-Minzi, R.; Cardelli, R.; Riffaldi, R. A comparison of soil quality in adjacent cultivated, forest and native grassland soils. Plant Soil 2001, 233, 251–259. [Google Scholar] [CrossRef]
- Pinzari, F.; Trinchera, A.; Benedetti, A.; Sequi, P. Use of biochemical indices in the mediterranean environment: Comparison among soils under different forest vegetation. J. Microbiol. Methods 1999, 36, 21–28. [Google Scholar] [CrossRef]
- Umarov, M.M.; Kurakov, A.V.; Stepanov, A.L. Microbial Transformation of Nitrogen in Soil; GEOS: Moscow, Russia, 2007. [Google Scholar]
Publisher’s Note: MDPI stays neutral with regard to jurisdictional claims in published maps and institutional affiliations. |
© 2022 by the authors. Licensee MDPI, Basel, Switzerland. This article is an open access article distributed under the terms and conditions of the Creative Commons Attribution (CC BY) license (https://creativecommons.org/licenses/by/4.0/).