Article

Phenology Is Associated with Genetic and Stem Morphotype Variation in European Beech (Fagus sylvatica L.) Stands

by
Rūta Kembrytė
1,*,
Darius Danusevičius
1,
Virgilijus Baliuckas
2 and
Jurata Buchovska
2
1
Institute of Forest Biology and Silviculture, Vytautas Magnus University, K. Donelaičio Str. 58, 44248 Kaunas, Lithuania
2
Forestry Institute, Lithuanian Research Centre for Agriculture and Forestry, Liepu Str. 1, 53101 Kaunas, Lithuania
*
Author to whom correspondence should be addressed.
Forests 2022, 13(5), 664; https://doi.org/10.3390/f13050664
Submission received: 10 March 2022 / Revised: 9 April 2022 / Accepted: 12 April 2022 / Published: 25 April 2022
(This article belongs to the Section Genetics and Molecular Biology)

Abstract

:
We studied the associations between the stem quality, phenology, and genetic structure by genotyping the phenotypic variation at 15 genomic SSR makers of 208 mature European beech trees in four artificially established stands in Lithuania. The genetic differentiation among the stands was significant (DEST = 0.029**). The stand NOR1 of Carpathian origin significantly differed from the remaining three stands of Bavarian origin at the highest 0.001 significance level. In most of the stands, the early flushing trees were of significantly worse stem quality. Within each of the stands, the Bayesian clustering identified 2 to 3 genetic groups, among which the differentiation was markedly stronger than between the stands (DEST 0.095*** to 0.142***). The genetic groups differed markedly in stem quality and phenology as well as inbreeding levels. We conclude that (a) the genetic structuring in European beech stands strongly depends on non-random mating owing to phenology variation among the relative groups, (b) due to strong relationship among phenology, adaptedness and stem morphotype, this genetic variation is reflected by the stem morphotype.

1. Introduction

The global warming causes the natural ranges of forest trees shifting northwards [1,2]. One of such species that both naturally and artificially crossed over the southern border of Lithuania is European beech (Fagus sylvatica L.) [3]. To secure sustainable spreading of newly emerging forest trees species, it important to understand their adaptive properties and genetic structures governing the genetic variation within the stands [4,5,6]. Forest trees such as European beech possess large within-population diversity in both genomic and phenotype traits such as phenology or stem morphotype [7,8]. The stem morphotype of a tree is an important trait for commercial forestry. Forked, curvy trees are devaluated by almost 100% of the straight and single stemmed trees, e.g., [9]. Inferior morphotypes of forest trees often reflect low adaptation due to inappropriate transfer of provenances or the effects of environmental stressors [10], which have notably intensified with the rapid advance of the global warming [11]. To obtain deeper qualifications for improving the adaptability of the future forests, it is important to investigate the major causes for the stem morphotype variation of forest trees, especially for the broadleaves such as European beech. The problem we address in our study is to identify the genetic characterization for the variation in stem morphotype of adult trees in regular forest stands of European beech by the aid of DNA markers.
Tree forks are considered as structural defects inheritance of which varies depending on a complex of factors [12]. Basically, there are three main sets of the factors affecting the tree stem morphotypes of the broadleaved trees in the northerly forests: (a) the genetically controlled endogenic factors such as the phenology rhythm and the associated frost damage, (b) the endogenetic apical dominance phenomenon, both under genetic and environmental control [13,14], and (b) exogenic biotic and abiotic factors of a stochastic nature, usually independent of the genotype, i.e., variation in tree spacing and growth towards the light, pest and game browsing damage, wind/snow breaks and gravitation control disturbances due to wind induced leaning or planting errors, e.g., [12,15,16].
The phenology rhythm of forest trees is among the most studied phenomena associated with the adaptedness in both conifers [17] and broadleaves [10,18]. Unsuitable phenology rhythm to the local cold climate may lead to repeated events of stem forking and spike knots [4,19]. The later being an outcompeted fork presently remaining as a thick branch attached with a sharp angle to the main stem. Early growth onset in spring usually leads to spring frost damage especially in climax forest tree species such as European beech [20]. On the other hand, late growth cessation results in autumn frost or winter cold injury [21]. Owing to the adaptive significance, the phenology rhythm and frost hardness traits are highly heritable in northerly forest tree species [8,22,23]. Geneflow balances the natural selection in forest trees and maintains high within-population diversity in phenology traits [10]. This phenology diversity, in turn, may be associated with stem forking and so morphotype [24].
In the northern hemisphere, forest tree species have a dormancy period with endogenic (internally inhibited) and exogenic (externally inhibited) dormancy stages [25]. Chilling periods of several weeks or more are required to break the endogenic into the exogenic dormancy stage, followed by effective temperature accumulation for budburst [25,26]. Relatively higher chilling temperatures and temperature fluctuations during the cold period led to early loss of the exogenic dormancy, which leads to dehardening of shoots and may cause direct frost damage to the apical meristems or lead to disturbances in apical dominance (both may cause stem forking) [26,27,28]. Apical dominance describes the ability to maintain single stem by an earlier elongation of the terminal bud over the axillary buds on the leader shoot [29]. The leader shoot dominates and slows down the elongation of other shoots [30]. Plants evolved the apical dominance phenomenon as the control mechanism to ensure that bud outgrowth occurs after decapitation, allowing the plant to complete its life cycle [31]. Plants with strong apical dominance grow very upright, with one dominant central axis, as for example spruces. Plants with low apical dominance grow as shrubs, which are indicated as ‘decurrent’ [32]. When apical bud is damaged or lost, the auxin IAA is no longer produced. Lower auxin concentration breaks the dormancy of lateral buds and produce new shoots from lateral buds [31]. A relative ratio of auxin and cytokinin controls the level of apical dominance [31]. Presumably, due to external stressors such as high chilling or temperature fluctuations during buildup of dormancy, the concerted action of the hormones may be disturbed. This disturbance causes latent stage of the terminal buds or simultaneous flushing of terminal and auxiliary buds, in both cases leading to multistemed, curvy or hooked trees [14].
The apical meristems of trees are often damaged by caterpillars, weevils, bark beetles, midges, aphids, or scale insects [33,34]. The buds and shoots of Fagus sylvatica trees can be damaged by Lymantria monachal and Calliteara pudibunda [35]. The insect damage affects stem quality of the trees by damaging the terminal or lateral shoots, epecially at young age [34] The leader shoot also can be damaged by human activities or herbivory such as deer, red deer, moose, European hare [30].
The overstory light conditions may frequently affect stem quality of young trees in the understory. For example, European beech can tolerate shadowing and grow in weak light conditions [36]. Due to weak light, European beech trees develop in a peculiar way. The tree grows thin, upright, bearing practically no branches and it exhibits a small flat crown, because of the drooped terminal part of the trunk and the last lateral axis formed [12].
In south-western Lithuania, European beech was introduced by German foresters already in the 18th century from various parts of the former German state [37,38]. Immediately south-west of Lithuania lays the present-day Kaliningrad region (earlier a German province of Eastern Prussia), which is a mild seaside lowland ideally fit for European beech [39]. Here situation with European beech is unclear—which stands spread naturally from the nearby natural ranges (some 50–100 km southwards) and which could have been artificially established [40]. Therefore, European beech in Lithuania likely is of rather diverse origin, which may adversely affect phenology and stem quality of new European beech forests due to variable transfer effect [19,41]. DNA markers revealed rather distinct genepools of European beech in the northern regions of its natural range [42,43].
A common approach to estimate which of the above introduced factors has the strongest effect on the stem morphotype are common garden experiments, where the trees are planted in regular spacing, replicated over seemingly uniform site. However, such trials usually do not reach mature stages close to rotation age. An efficient approach is to use DNA markers for identification of the genetic groups and sibling relationships in natural stands and associate these genetic data with the morphotype measurements, e.g., [4].
The objectives of the study where to (a) compare the stem quality of four Lithuanian European beech stands originating from different regions in Europe and (b) to assess the genetic background for low stem quality (adaptedness) by studying the associations between the stem quality, phenology, genetic groups, and genetic diversity of the genetic groups. The genetic groups were determined by DNA genotyping of the sampled trees.

2. Materials and Methods

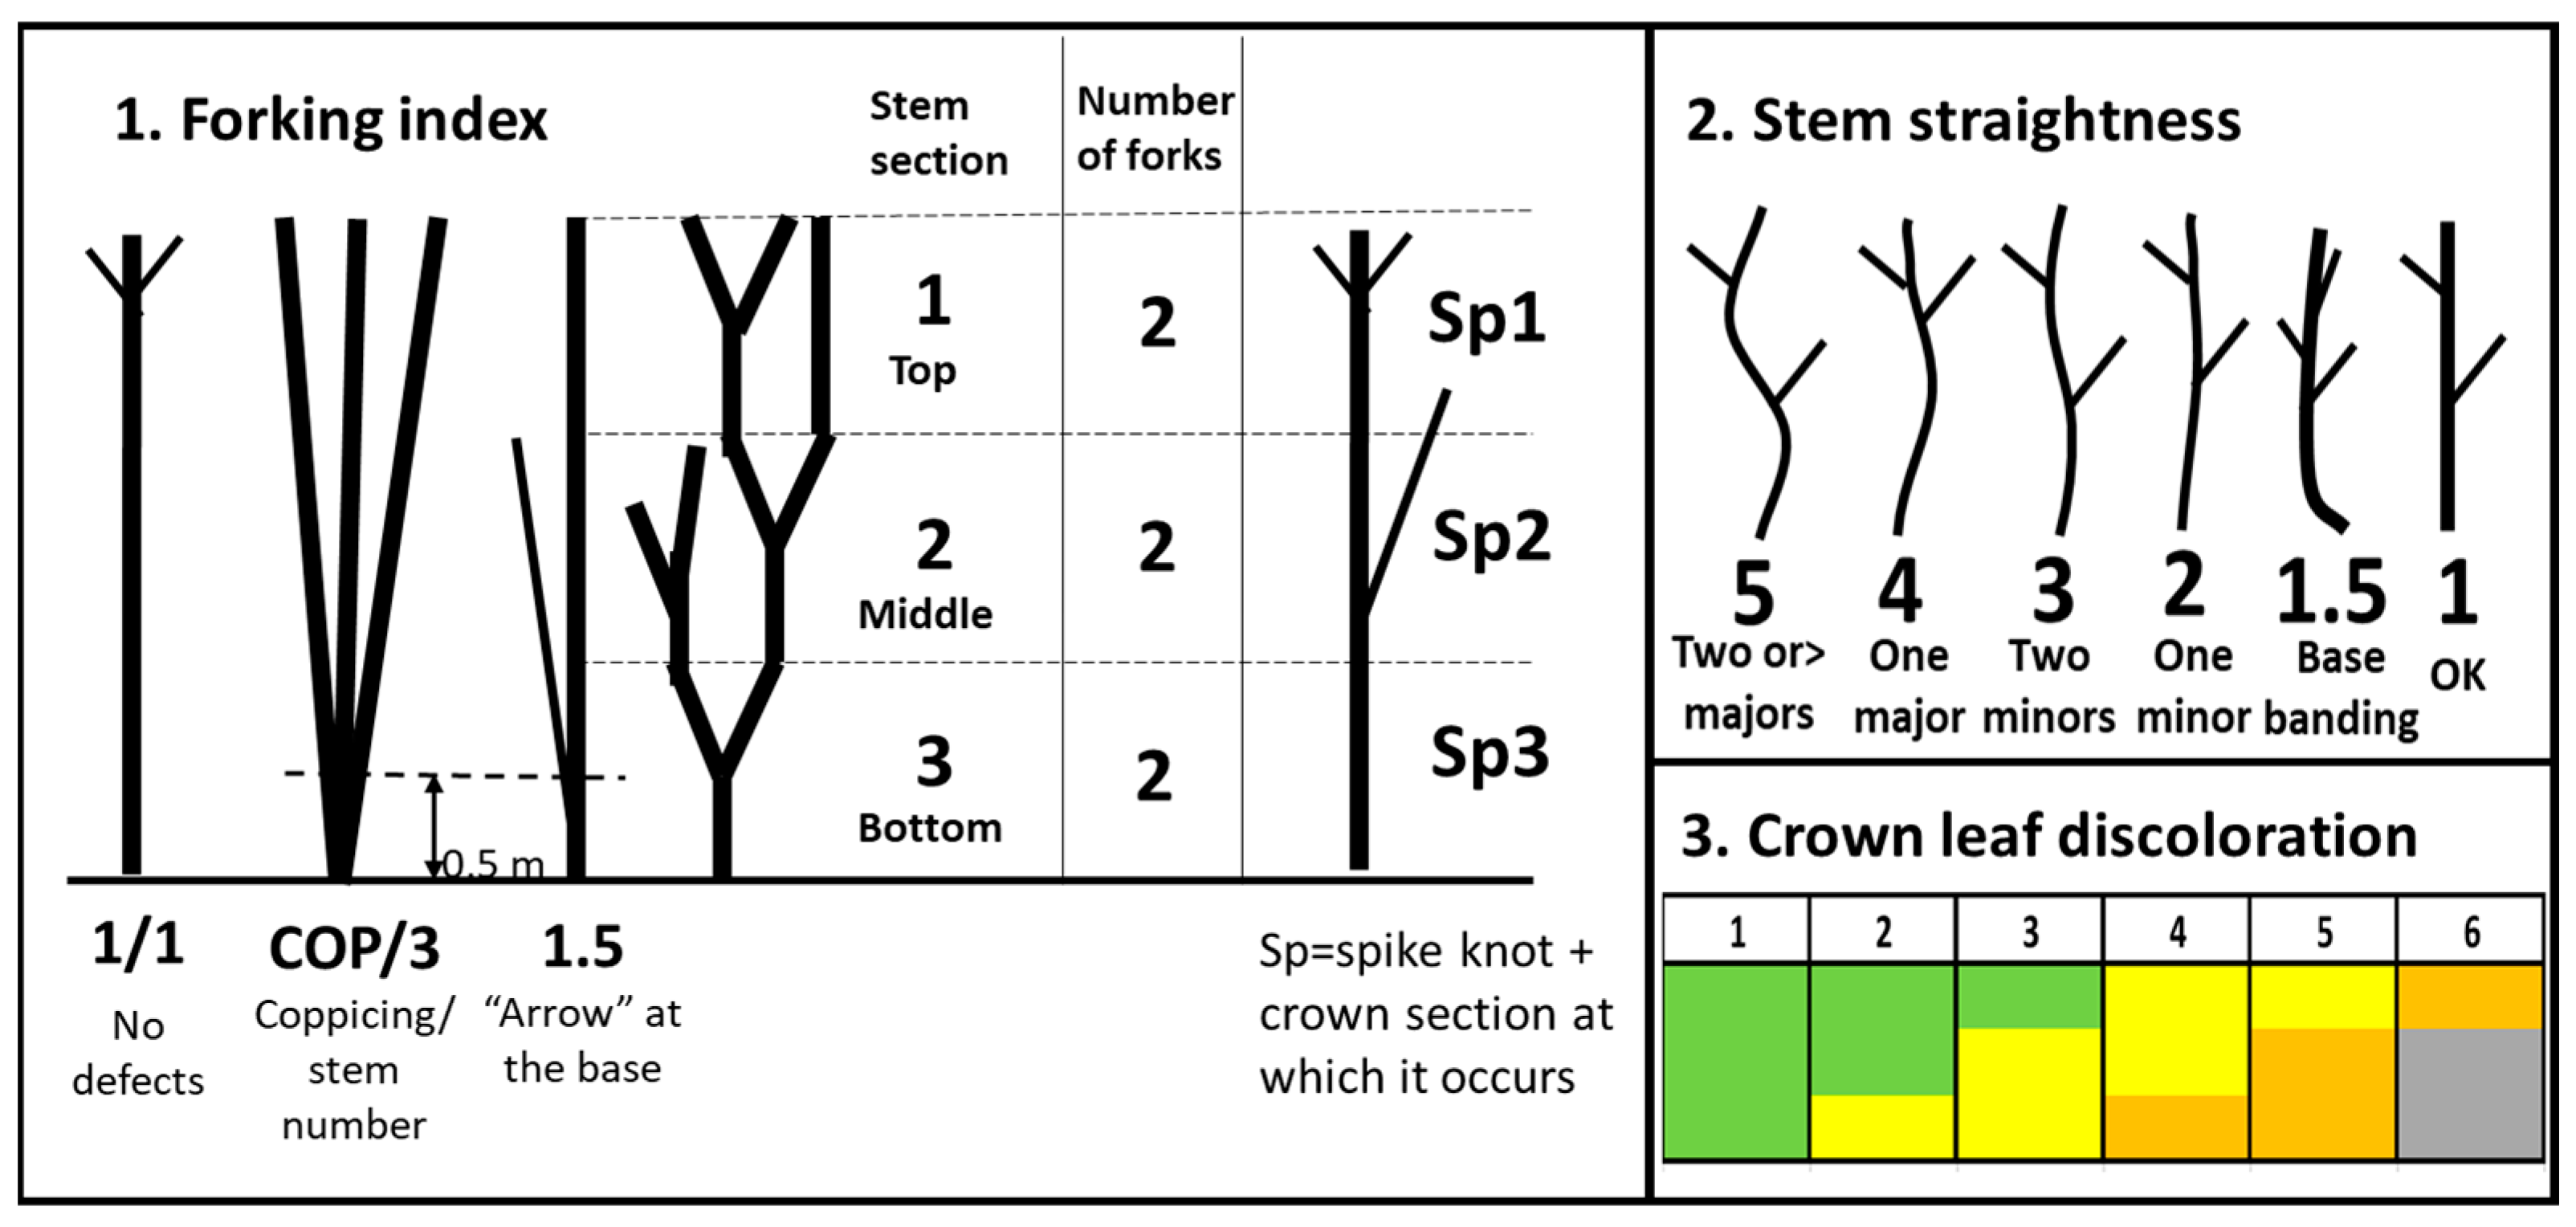
2.1. Material and Measurements

We morphotyped and genotyped 50 to 55 trees within each of the four 100 to 120 years old European beech stands located in the sea-side lowland, which is the mildest part of Lithuania (208 trees in total, Table 1, Figure S1). These stands were established before WW2 by the foresters in the former state of Eastern Prussia. Based on our recent DNA marker study the nearby located stands of VIES, MOCI and JURA originate from Bavarian Alps and the NOR1 stand originates from Carpathian Mountains [38]. In all the sampled stands, European beech dominates (over 70%) with an admixture of mainly Scots pine of overmature age (could have been used as a shelter for beech at the juvenile stage) and to lesser extend Norway spruce. The stands were mananged according common silvicultural practice in northerly commercial forests: tending up to age 20 (mainly promoting target tree species), pre-commercial thinning age 20–40 (optimizing stocking by providing more space for vital, healthy trees of the target species) followed by series of further thinnings to promote quality trees.
The European beech trees were sampled and GPS-tracked at random ca. 25 m apart when moving in a zig-zag manner over the stands.
We measured stem height, height to first stem fork, stem diameter (1.3 m height) and assessed stem quality as well as phenology of the sampled trees in the European beech stands described above (Figure 1). The stem quality index (SQINDEX) was calculated as follows:
SQINDEX = (F1 × n + F2 × n + SP1/2 + SP2/2) × STR/2
where, F1 is the stem section with first forking defect bottom (score 3) to top (score 1); F2-the stem section with the next forking defect when going upwards; n—fork number, SP1 and SP2 are stem sections with spike knots, starting from the bottom; STR- stem straightness score 1 to 5, where 5 is very curvy. The lower is the score the higher is the commercial stem quality. If multiple forking events occurred within a single stem section, we scored then as separate defects to be added in the formula above (i.e., the lowest value of SQI is 1.5 indicating single stemmed (1 × 1 = 1) and straight (1/2 = 0.5) tree; the highest value is 37.5, which is a fork at the base, two forks and a spike knot in the mid-section, very curvy of score 5; a slightly curvy tree with a signed fork in the mid-section acquires SQI value of 6, which means low commercial value).
The autumn leaf discoloration stage was scored by dominant leaf color and leave drop stage on whole crown in 6 stages as shown in Figure 1. Spring budburst and leaf spread were scored in three stages by observing the dominant stage over the crown: 1- dormant or swollen buds, some just flushed and the leaf tips are visible (late growth onset), 2- first elongation up to 3–4 cm, 3- further spread > 3 cm until full spread of leaves (early growth onset). We made several pilot visits to identify the most variable phenology stage and carried out the scoring once during ca. 3 h in each of the stands. The phenology observations were made with naked eye by trying to assess whole crown. The experience showed that the leaf spreading stages were rather discrete and well separable on adult trees. For autumn phenology, simply we had to identify which leaf color (green, yellow, brown) was dominant, which was well distinguishable. In NOR1, we missed the appropriate timing for budburst scoring.

2.2. Microsatellite Genotyping

In total, 208 European beech trees were genotyped at 15 nuclear microsatellite loci: FS1-15, FS3-04 [44], csolfagus_31, csolfagus_19, DE576_A_0 [45], MFC11, MFC5, MFC7 [46], sfc_0036 [47] and MFS11 [48] and DUCT, EEU75, EJV8T, EMILIY, ERHBI [45]. The DNA was extracted from stem wood dust (sampled by drilling with an electric bore) according to a modified ATMAB protocol [49]. The PCR was caried out in three multiplexes and the fragments separated by capillary electrophoresis on ABI PRISM™ 310 genetic analyzer (details in Kembrytė et al. [38]).

2.3. Statistical Analyses

The loci were screened for null alleles and stuttering errors with MICRO-CHECKER soft. [50]. We calculated the DEST genetic differentiation indexes among the stands and the standard genetic diversity indexes with GENALEX soft. ver. 6.5, Acton, Australia [51]. The Bayesian clustering with STRUCTURE soft. ver. 2.2.3, Stanford, CA, USA [52] was used to estimate the within stand genetic structuring was estimated with and sibling relationship analyses. For the STRUCTURE runs, we used the burn in period length for the posterior distribution of 105 and the number of MCMC iterations of 105, the K range from 1 to 10, each replicated 10 times. We used the correlated allele frequency model no admixture and the LOCPRIOR option. The most likely number of genetic clusters K was identified based on the deltaK value with STRUCTURE_HARVESTER WEB vers. 0.6.94, Santa Cruz, California, USA soft. [53]. In addition, we used sibling analysis with COLONY vers. 2.0.5.3 soft., London, UK [54] to detect a finer scale family structures. The STRUCTURE and COLONY genetic groups for each tree were displayed on spatial maps of the sampled stands to visually evaluate special clustering of genetic entries.
To assess the phenotype-genotype associations, we calculated the means and standard errors for the phenotypic traits for the STRUCTURE and COLONY genetic groups as the class variables, for each stand separately. In addition, we tested the associations between observed heterozygosity (Ho) and phenotypic traits by plotting the means of the phenotypic traits for several Ho classes for each stand separately. Here we intended to test the hypothesis that low Ho values are associated with reduced tree vigor, which in turn leads to low stress tolerance that is reflected by stem defects.

3. Results

3.1. Microsatellite Loci Statistics

The null allele frequencies were below 0.1 for all loci, except for the locus mfc11, which had high null allele frequency and was removed from the analysis (Table S1). All 14 remining loci were polymorphic with 4 to 26 alleles. For 11 out of 14 loci, the expected heterozygosity (He) values exceeded 0.60 (for 3 loci He was >0.5) (Table S1).

3.2. Comparison among the Stands

The genetic differentiation among the four European beech stands was moderate and significant (DEST = 0.029**). The stand NOR1 of Carpathian origin significantly differed from the remaining three stands of Bavarian origin at the highest 0.001 significance level. For the rest VIES vs. MOCI and MOCI vs. JURA the differentiation was significant, but the DEST values were lower than those with NOR1 (not shown). All four stands contained rather uniform genetic diversity parameters, except for the markedly higher inbreeding coefficient in MOCI stand (Table 2).
Stem quality was markedly lower in the “Carpathian” NOR1 stand than in all three other stands of Bavarian origin (twice as high stem quality index (=more forking events) for NOR1 in Table 2). The highest stem quality and the longest forking-free stem section was in the Bavarian MOCI stand, but it did not significantly differ from the other two stands of Bavarian origin (Table 2).

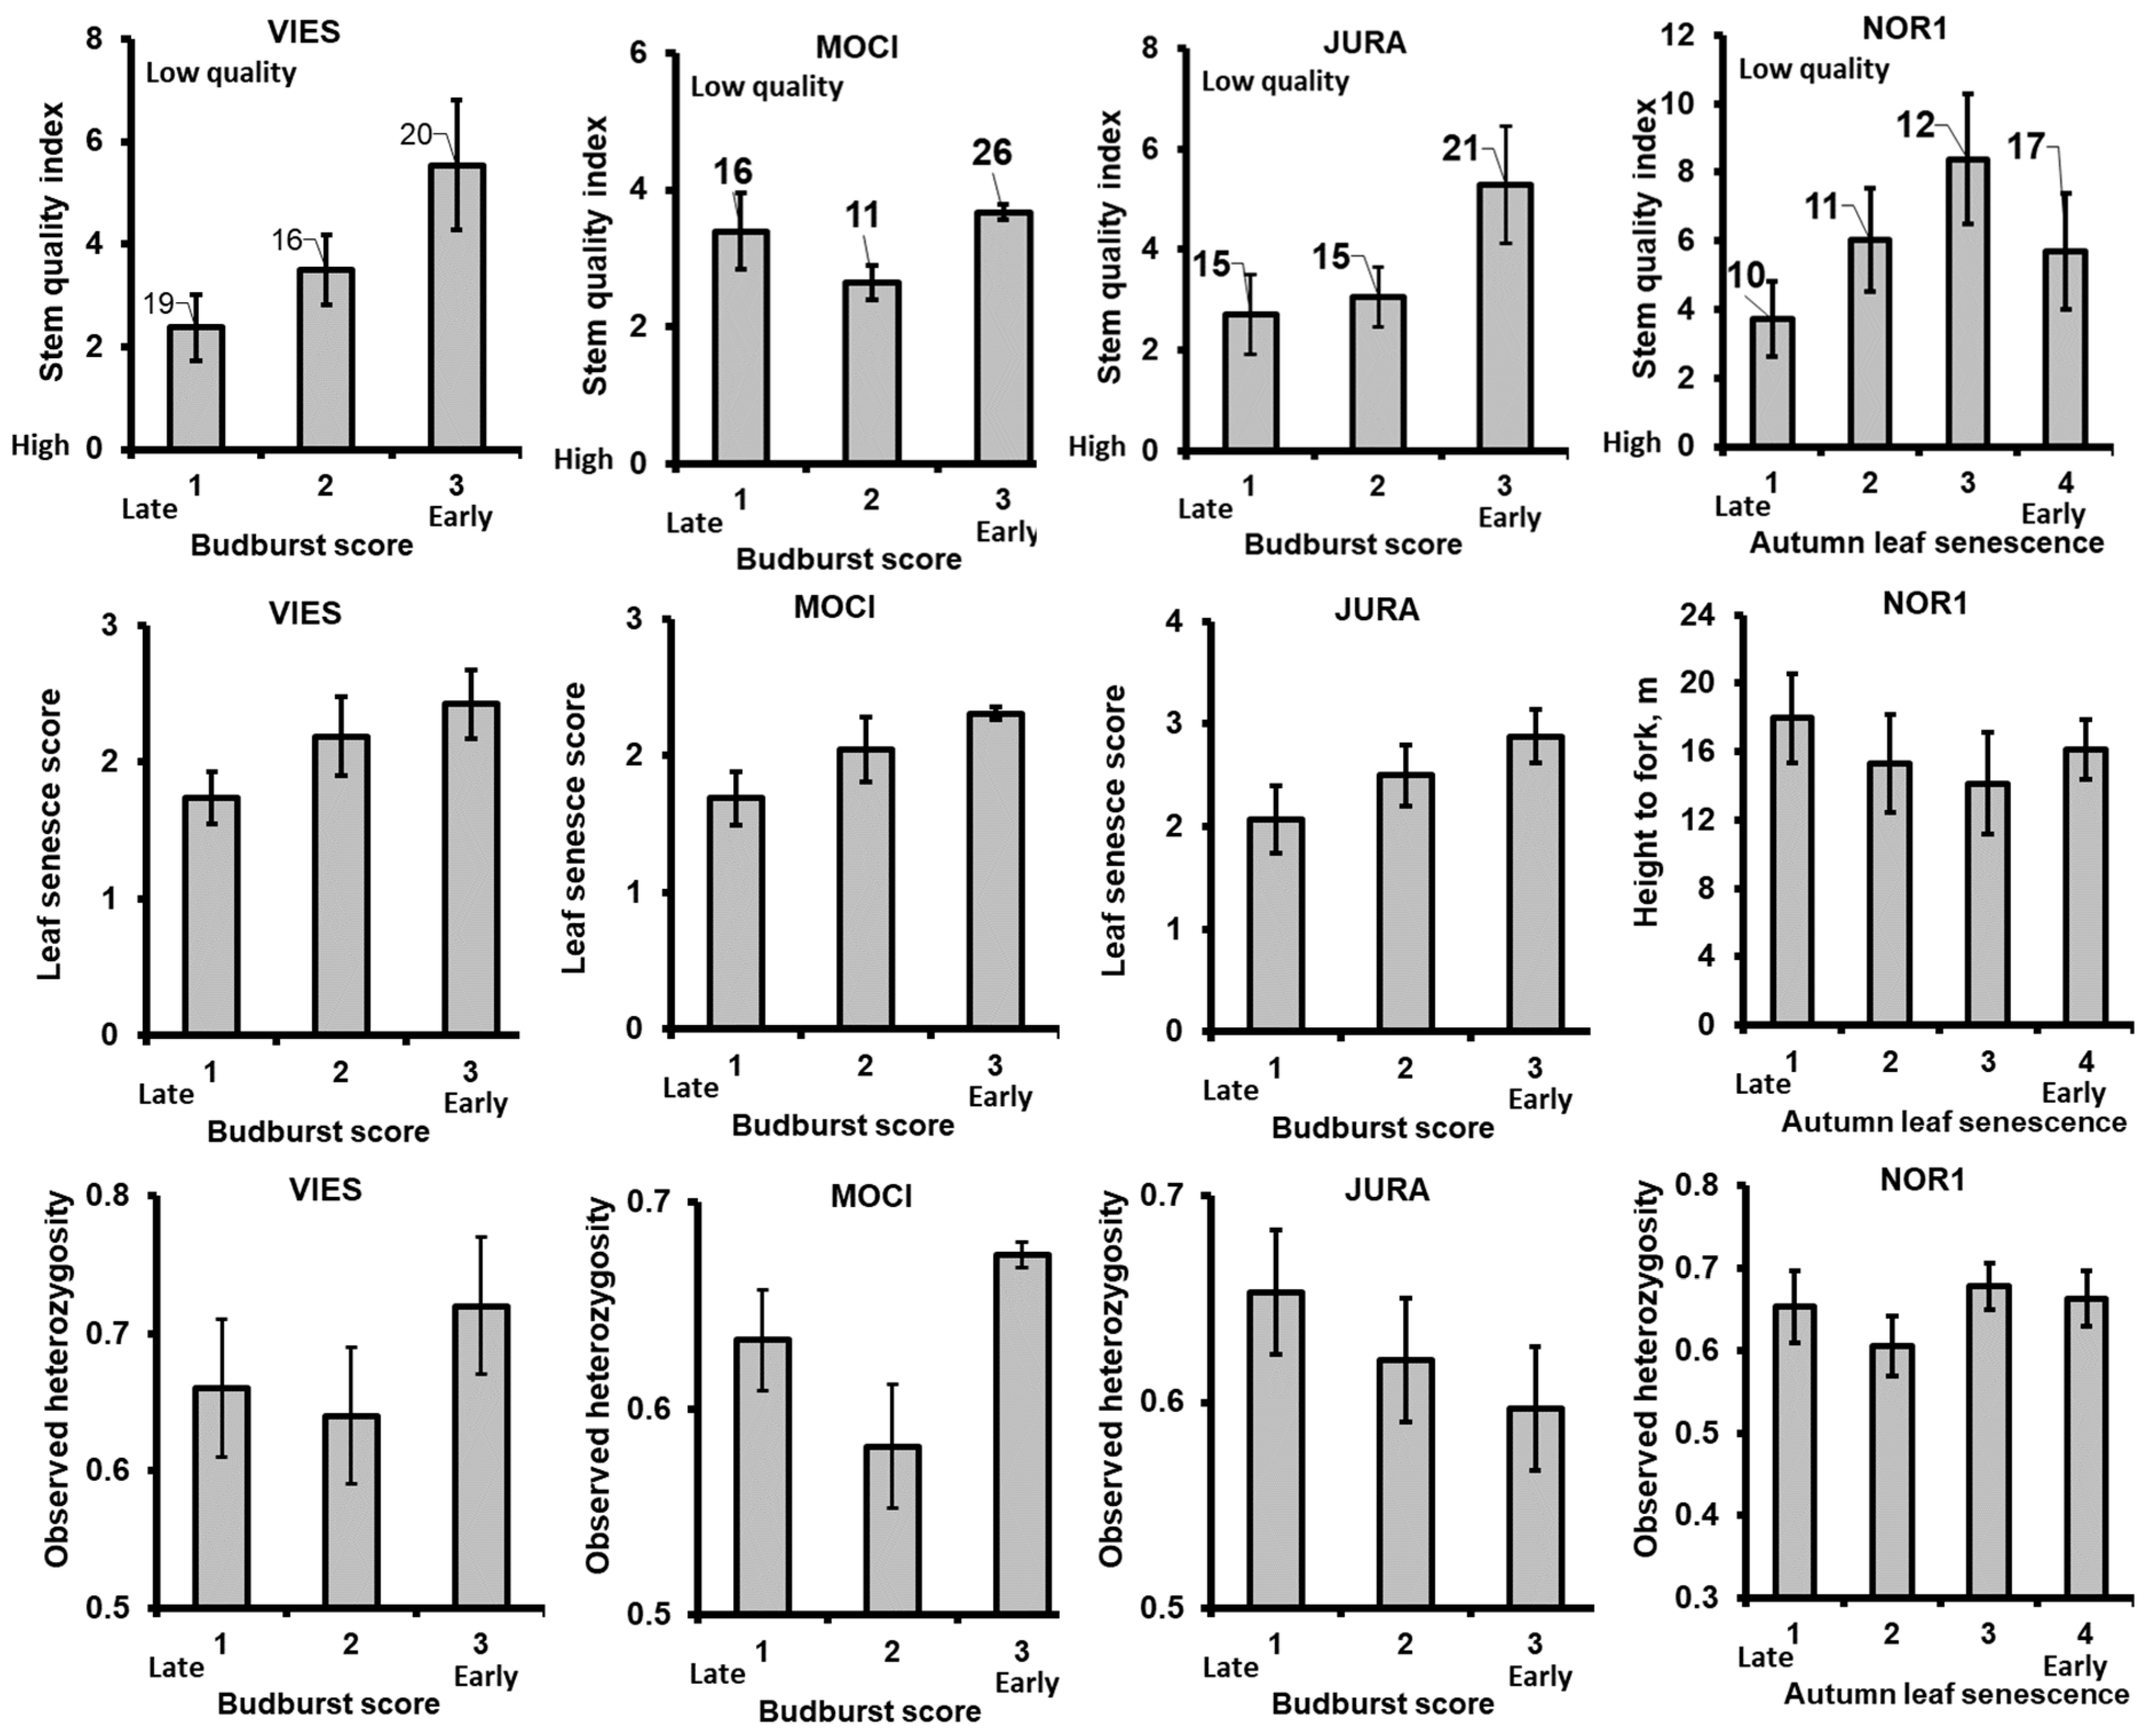
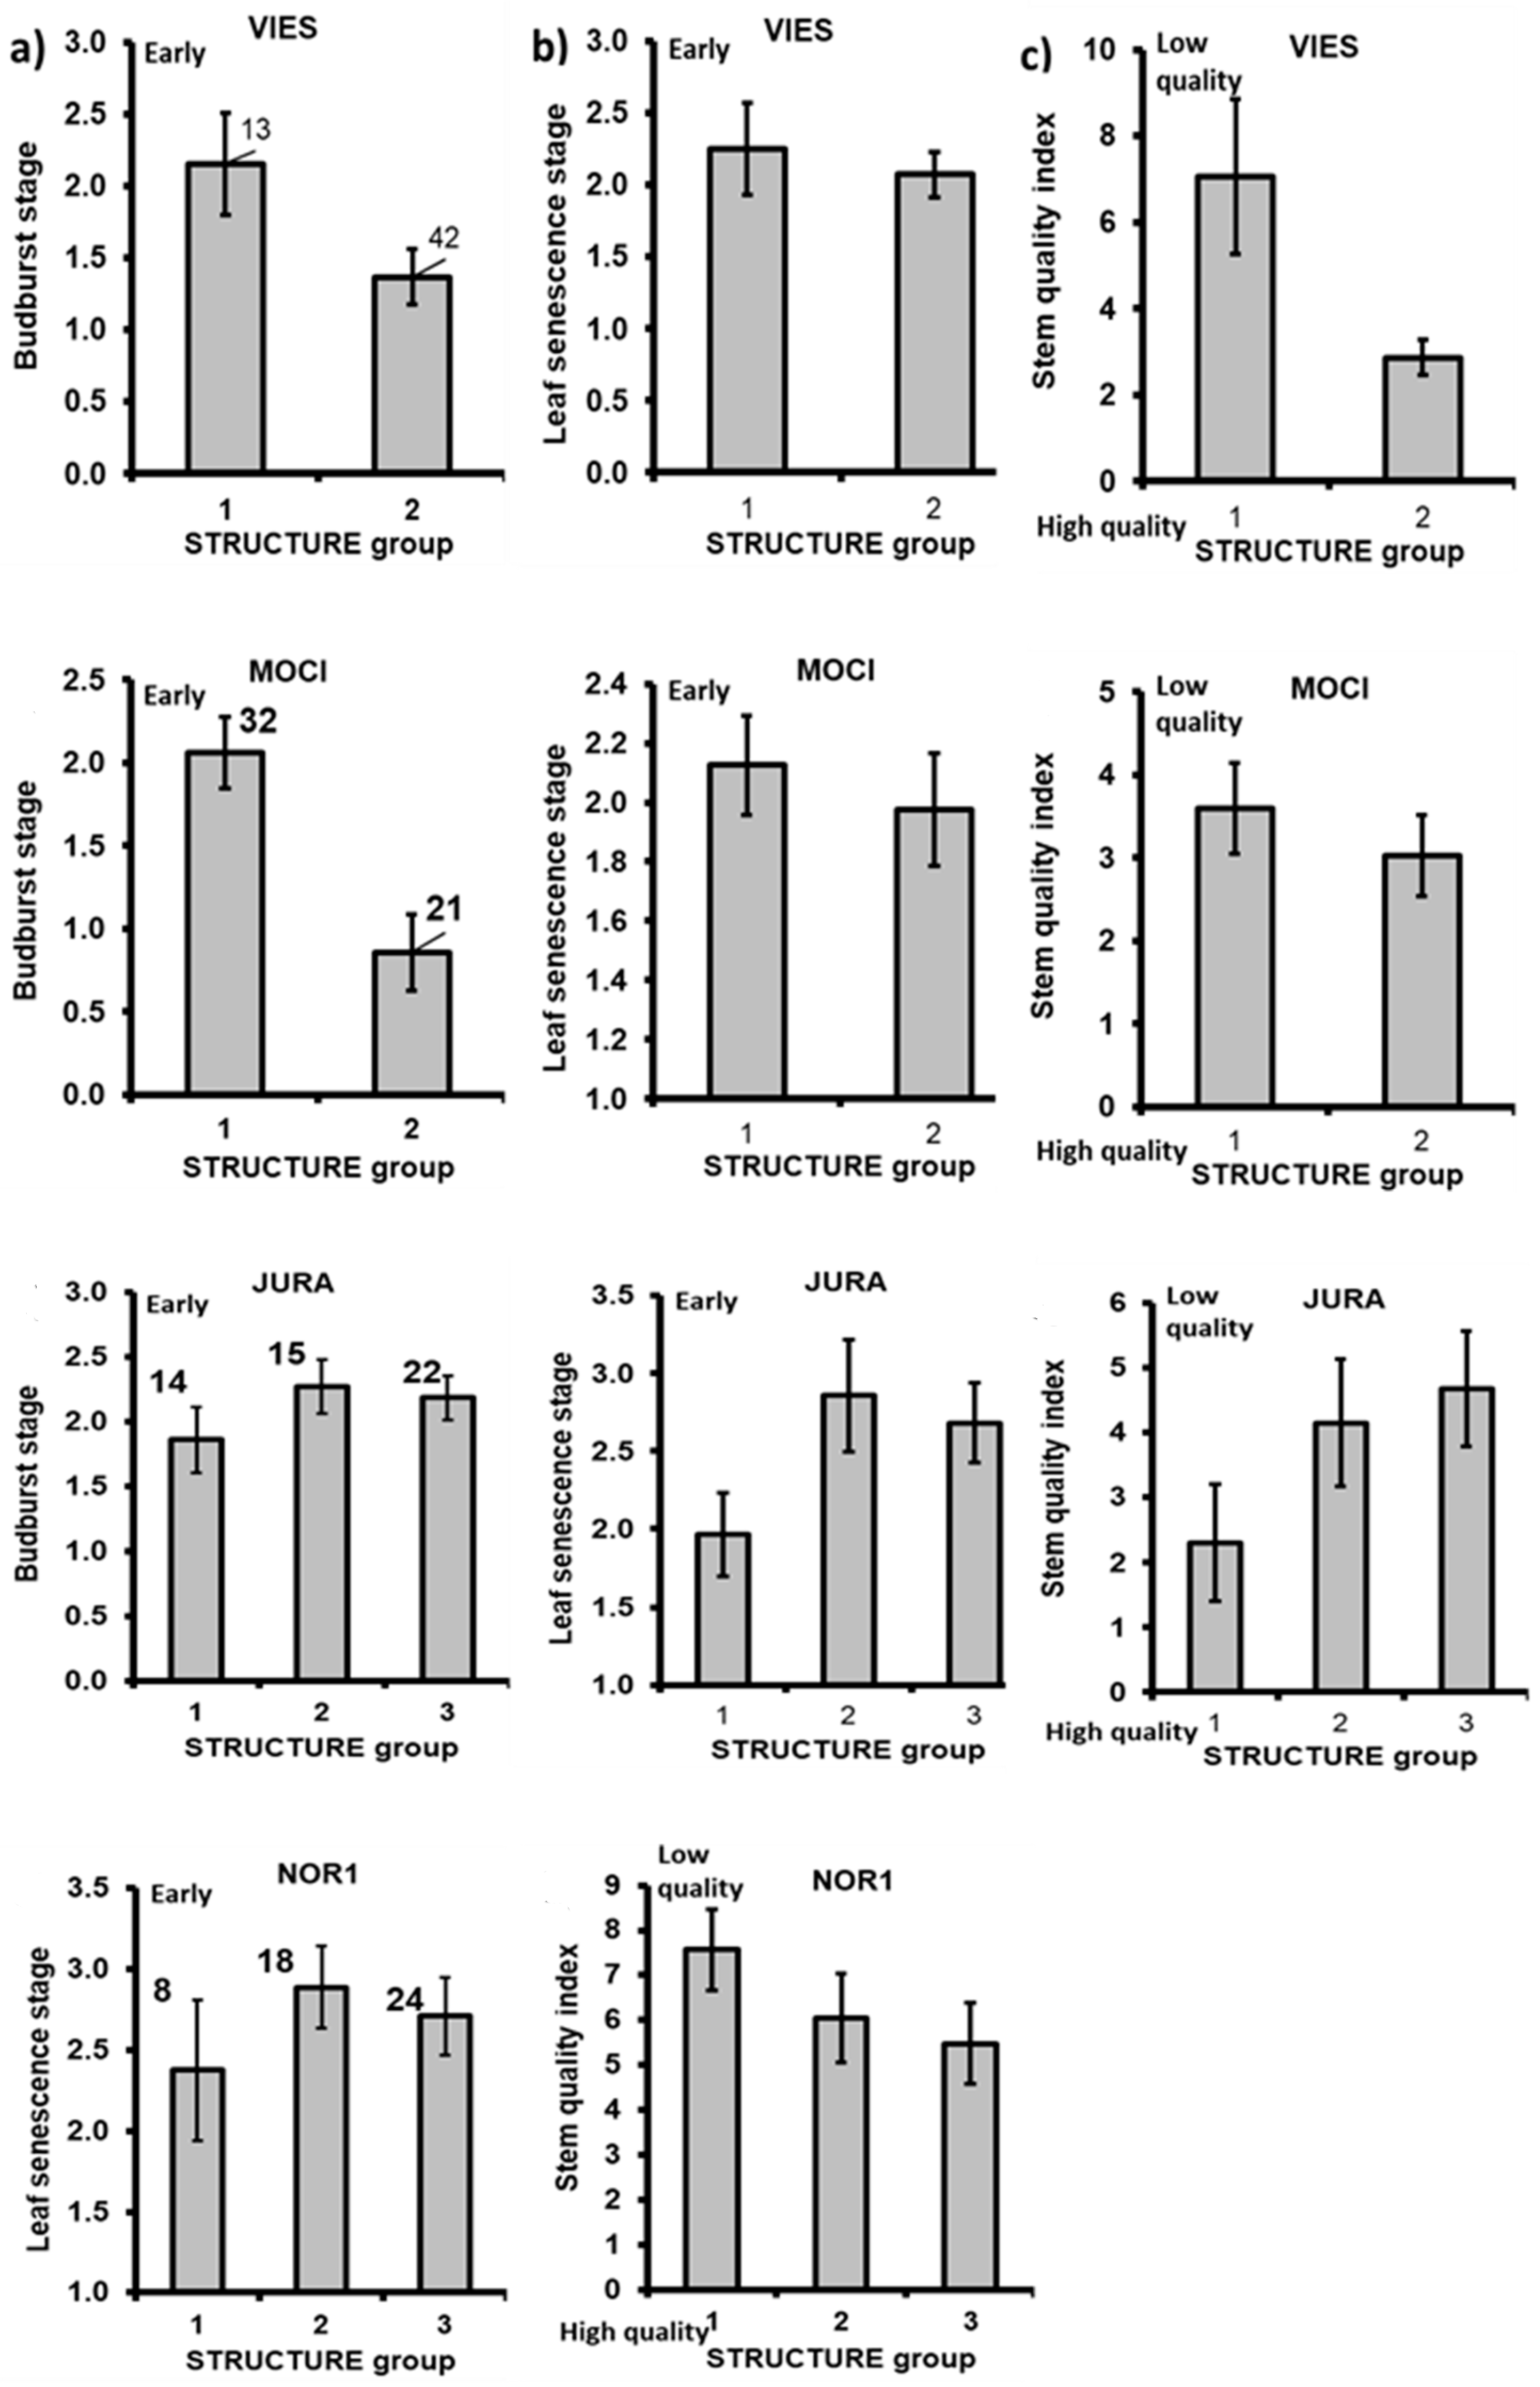
3.3. Associations between Phenology, Stem Quality and Observed Heterozygosity

Based on the correlation analysis in JURA and VIES stands, the early flushing trees were of worse stem quality, meaning multiple stem forking events (significant and positive correlation coefficients between stem quality index and budburst stage, Table 3). However, in MOCI stand (which had best quality stems and the highest stocking), the stem quality was not correlated with budburst, instead it was strongly correlated with stem diameter (thinner trees had fewer forking events, Table 3). The correlations analysis revealed no consistent relationship between the observed heterozygosity of an individual tree and its stem quality nor with wood yield (Table 3 and Table 4, Figure S2). However, the phenology-based groups differed markedly in observed heterozygosity in all stands except NOR1 (bottom row of the plots in Figure 2). Especially the differences in the Ho values between the phenology groups were strong in MOCI stand (note the low standard error for all 26 trees with the highest Ho values for MOCI in the Ho plot in Figure 2). However, the association between phenology and Ho was not consequent: positive in MOCI and VIES and negative in JURA (Table 4).
Except for MOCI stand, the comparison of the mean values of stem quality index for each budburst stage confirmed the worse stem quality of the early flushing European beech trees (Figure 2). In NOR1, the trees with early leaf senescence were of the lowest stem quality (Figure 2). Early budbust was positively associated with early leaf senescence in all stands (Figure 2). Stem quality index was more strongly associated with phenology stages than height to first fork, indicating that the stem quality index is a better estimate when studying the causal phenology—stem quality associations (Figures S3–S6). There was a tendency of negative association between phenology and tree height in JURA and VIES (lower stocking) but not in MOCI (higher stocking) (Figures S3–S6). On the contrary, stem diameter tended to be positively associated with phenology, especially in VIES stand (Figures S3–S6).

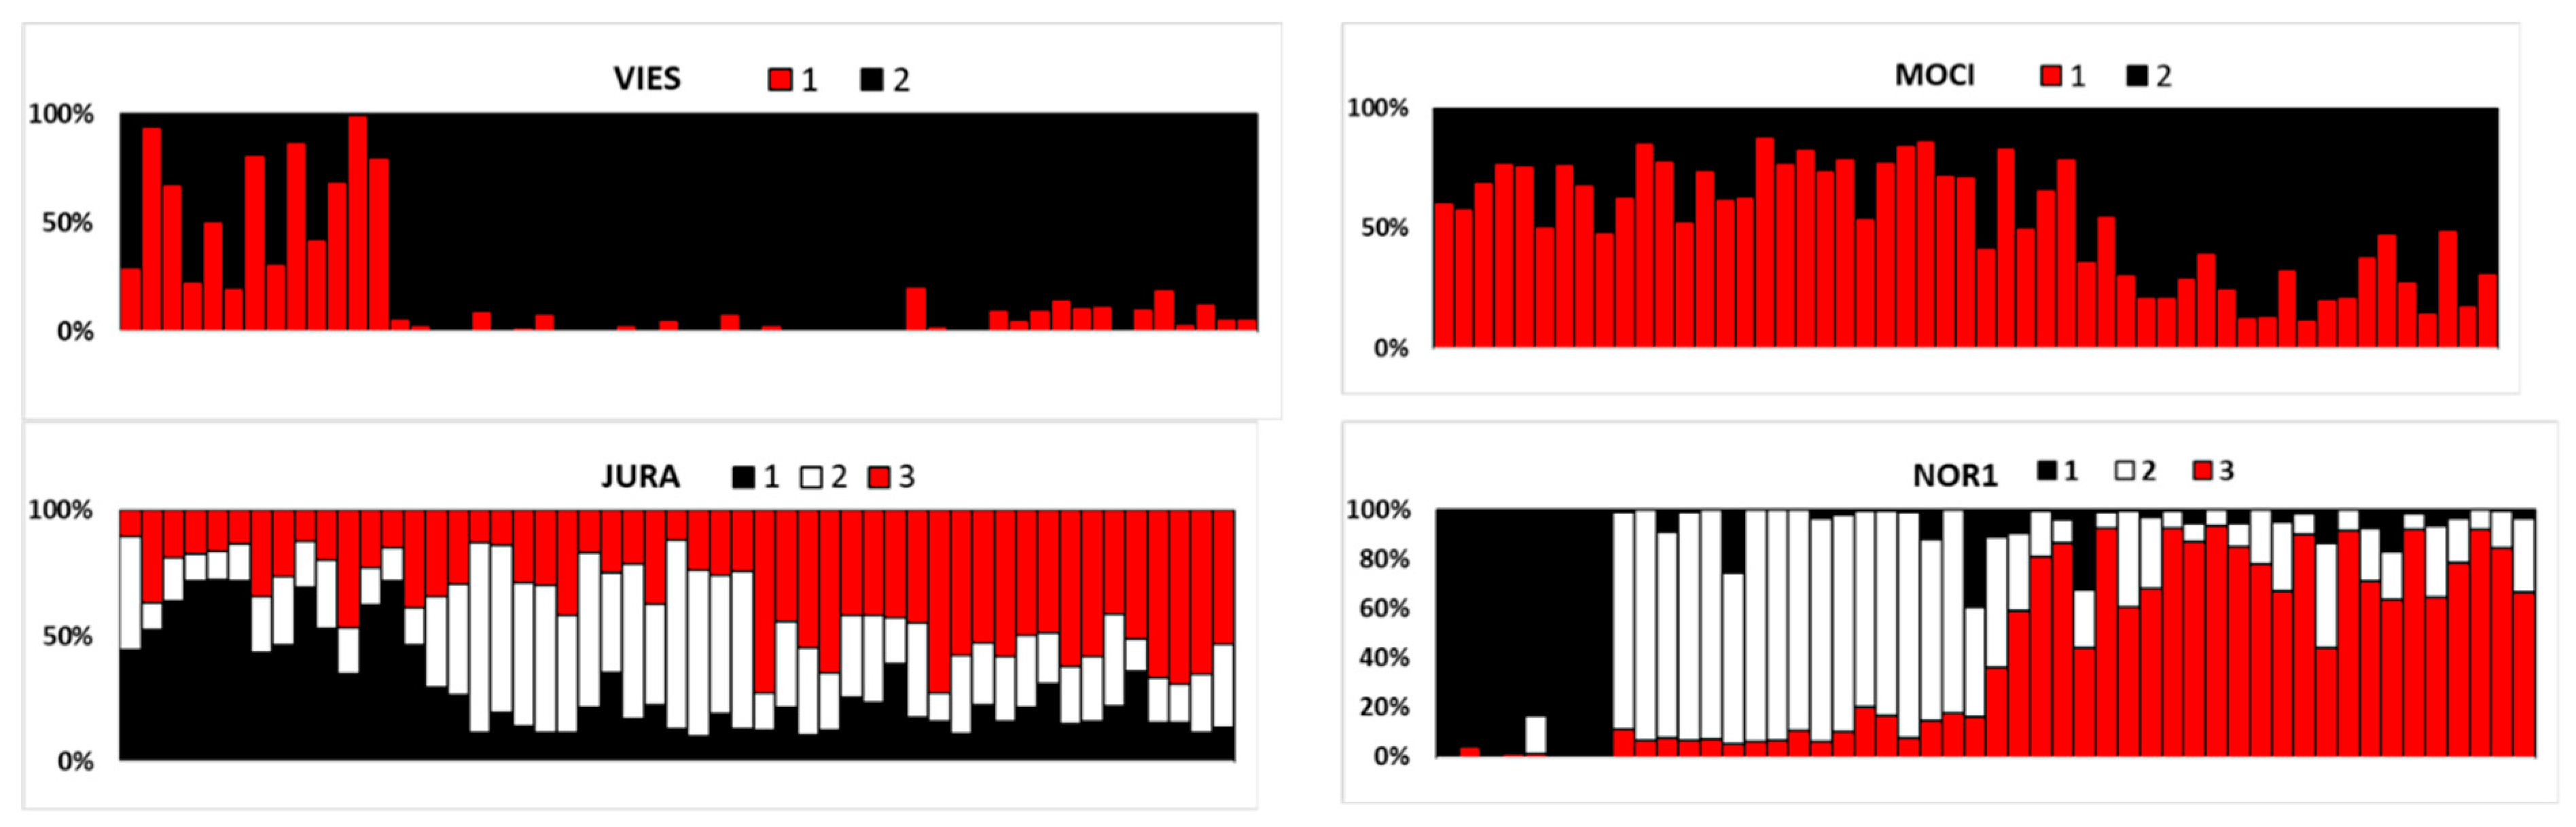
3.4. Within-Stand Genetic Structure

The STRUCTURE clustering followed by the deltaK test revealed a two-group structure as the most likely within VIES and MOCI stands and three genetic group structure within JURA and NOR1 stand (Figure 3). In VIES and MOCI stands, one group dominated over the other (Figure 3). However, in JURA and NOR1, the group structure was rather discrete (Figure 3). Spatial distribution of the genetic groups was random in all stands (Figure S7).
The genetic differentiation between the STRUCTURE genetic groups within each of the stands was significant, especially strong in JURA and NOR1 stands (VIES DEST = 0.095***, MOCI DEST = 0.098***, JURA DEST = 0.142***, NOR1 DEST = 0.121***) and markedly higher than the DEST values among the stands (between all stands DEST = 0.029**, between JURA and the rest DEST from 0.005 n.s. to 0.029***). The similarity among the genetic groups within the stands varied as well, for instance, in JURA stand, the genetic groups 1 and 2 differed stronger from the group 1 than among each other (DEST_1–2 = 0.208***, DEST_1–3 = 0.106***, DEST_2–3 = 0.099***).
Interestingly, the STRUCTURE genetic groups in most of the stands can be identified based on the phenology, especially by the budburst timing (Figure 4). The early flushing genetic groups tended be of a relatively lower stem quality (Figure 4). Such association of early budburst with low stem quality was the strongest for the genetic groups in relatively younger VIES and MOCI stands. The expected, observed heterozygosities and inbreeding coefficient varied markedly among the genetic groups in all the stands (Table 5). This indicates a relatively higher relatedness among the mating trees in some of the phenology-driven genetic groups (Figure S8).
The COLONY genetic clusters revealed a finer genetic hierarchy in the planted stands. As with the STRUCTURE genetic groups, the COLONY genetic clusters are randomly distributed within the stands and form tree groups with distinct phenology (Figures S9–S12). The COLONY clusters differed in both spring and autumn phenology (Figures S9–S12). The number of female parents of the investigated 50 to 55 adult beech trees in each stand varied between 34 to 40, or roughly ½ of the sample size (Table 6). This gave large effective population sizes (Table 6). Number of selfed trees varied between the stands from few percent to 20% of the sample size (Table 6). In MOCI and JURA stands, the selfed trees possessed lower wood yield than nonselfed trees (Figure S13). Full-sib families were very few, and there was no marked dominance of progeny from few families (largest families contained 2 to 3 members only and make up 6 to 8% of all families, Table 6). Numbers of the genetic clusters were high given the small samples sizes of ca. 50 trees. However, usually singe cluster included nearly 50% of the individuals within each stand (Table 6, last column).

4. Discussion

4.1. Loci Efficiency

The set of 15 SSR markers generated a highly polymorphic data set for detecting the genetic associations and the sibling structures [55]. The microsatellite loci returned similar levels of polymorphism as in the earlier studies with European beech, e.g., locus mfc_5 with 25 alleles (208 trees, our study) and 21 allele (99 adult trees within single stand in Germany [48].

4.2. Strong Phenology—Morphology Associations

In agreement with earlier findings for forest trees, the budburst was positively associated with the leaf senescence stage [10,17,56]. This indicates that in our study, we succeeded to capture the appropriate variances in both leaf senescence and budburst and these two properties in our material are not markedly affected by an error variance due to the stocking variation, soil types or slope exposure. The early flushing trees were thick but short, likely due to the higher frequency of forking at the lower part of the stem, which lead to a thicker base of the trunk but reduced the tree height in comparison to the single stem trees. Late growth cessation provides a longer period for active growth, therefore, the trees growth taller [17]. The timing of phenology traits is tightly positively autocorrelated within the annual cycle of trees [57,58]. Therefore, the ranking in timing of budburst can be used as a reliable estimate of ranking in flowering time at the individual tree level [59,60].
The low stem quality of the early flushing trees observed in our study likely is associated with the stem defect caused by spring frost injury [13,61]. The early flushing trees are often injured by late spring frosts causing multiple forking at the lower to middle part of the stem of European beech as well as in other climax forest tree species [62,63]. The low stem quality of early flushing trees implies that the seaside climatic zone in Lithuania, spring frost avoidance is a stronger adaptive advantage than winter frost tolerance [64]. Therefore, when constructing breeding populations of European beech for the sea-side and southerly Lithuania, the late flushing genotypes would be preferable. If adaptive significance of winter frost tolerance exceeds spring frost avoidance, then the trees of namely early growth onset/cessation acquire an adaptive advantage and contain better stem quality over the late flushing trees in a population [10,19]. This, however, was not the case with our material and the stem quality superiority of the late flushing trees was confirmed in all the stands studied. Of course, we cannot exclude the effects of random environmental stochasticity such as the overstory openings, glades or game and pest damage on the phenology and stem morphology estimates. The apical dominance loss usually occurs in the upper third of the adult crown has lower weight on our Stem Forking index than basal forking characteristic to spring frost damage [14]. In addition, there could be an error margin when scoring tall mature trees in densely stocked stands, where sometimes only the lower half of the crown is well visible, and we must determine the prevailing phenology stage for whole crown. Such deviating factors as listed above may have led to weaker phenology-stem quality relationship in MOCI stand, which is densely stocked.

4.3. Genetic Background for Stochastic Phenotypic Variation

Another important finding of our study is that these phenology-based stem morphotype groups within the stands have a genetic background: the phenology and stem morphotype differed significant between the STRUCTURE genetic groups in all the studied stands. This implies that the Bayesian clustering based on the SSR markers revealed genetically meaningful phenotypic structures. In contrast to our study, Dounavi et al. [5] did not observe strong genetic effects of stem forking in European beech stands based on isoenzyme markers. However, microsatellites are much more powerful makers capable to reveal fine genetic structures [4,48]. The genetic differentiation at the neutral genomic SSR loci often reflects mating patterns especially within a narrow geographical range such a single stand [4]. In agreement to this, our finding that the within-stand STRUCTURE genetic groups markedly differed in phenology indicates that phenology may be the driving force for maintaining the genetic structures with the stands of European beech. It is likely that the discrete genepools are maintained at the phenology margins within the stand, while mating assortativelly among the trees with overlapping phenology [65]. In addition, non-genetic causes of stem forking such as game browsing and apical bud damage by pest insects (such as Rynchaeus fagi) may further hamper the phenotype-genotype association [5,66]. However, the significant differences in phenology and stem quality between the genetic groups were consistent in the stands in our study, indicating, that the phenology and morphology variation possesses a strong genetic background in European beech stands. The autumn phenology was weaker associated with the genetic groups than budburst in spring (Figure 4). Autumn leaf sentence and drop rates are stretched over time, depend on both temperature and photoperiod and are more sensitive to environmental heterogeneity than budburst phenology. Despite these deviating factors, the within-stand genetic groups differed significantly in the mean bud burst and leaf senescence scores. This confirms the strong genetic control of phenology and the associated stem morphotype traits such as forking, spike knots and stem straightness. Thus, stem morphotype can be used as an indicator for differentiating genetic conservation populations of European beech (compare with Figliuolo [67]).
In our study, the European beech stands were artificially established and contained no immediately evident spatial clustering of related individuals as indicated by the spatial arrangement of the genetic groups in the studied stands (Figures S7, S10 and S11). This result contrasts with the significant SGS structures found in European beech stands of natural origin [4,5,48,68,69]. Therefore, it is possible that artificial establishment positively affects genetic structuring of beech stands by admixing different genetic groups, which otherwise remain clumped in naturally regenerated stands. Some of the natural European beech stands that had weak SGS (such as in [7] or [70]) may originate from historical plantations in such agricultural areas as in Italy and France. We did observe a marked variation in inbreeding values among the phenology groups within each of the investigated stands (Table 5). Mating among relatives increases inbreeding, especially within a spatial solid group [68,71]. If the stands are isolated by phenology gradients such as in mountains or as in our case the stands are introduced as exotics, long-term mating within such relatively closed phenology groups may elevate inbreeding due to genetic drift [72]. In such case the drift may act strongly despite of large population sizes [73]. This is important consideration when caring for sustainable spreading of new forest tree species following global warming [74,75]. Considering the adaptive significance of phenology for spreading of European beech in Lithuania, we suggest deploying the seed sources by considering the frost hardness gradients in Lithuania. Our study showed that late budburst is a favorable feature for European beech to be delayed in the seaside lowland of Lithuania. Furthermore, to disrupt the phenology-based groups of relatives in the new plantations of European beech, we recommend collecting the seeds all over the area of a seed collection stand from the trees of variable phenology by avoiding the very early flushing mother trees.
Even though, we found no significant spatial genetic structures, still phenology-based mating does not require immediate spatial neighborhood, pollen may effectively be dispersed over 100 m or more, so reaching the trees with the receptive stage [76,77]. However, in case of concentrated spatial clusters, the inbreeding within certain phenology groups in natural stands is expected to be higher than observed in our study within a mixed spatial genetic structure in the artificially established stands. Sibling structure analysis revealed collections from comparable high number of female parents, which can provide useful statistics when comparing with naturally regenerated stands.
Based on our recent DNA study the nearby located stands of VIES, MOCI and JURA originate from Bavarian Alps (likely altitude 500–1000 m a.s.l.) and the NOR1 stand originates from Carpathian Mountains (500–800 m. a.s.l.) [38]. Markedly worse stem quality if NOR1 stand may due its origin because the transfer effect from different sources leads to marked variation in adaptedness reflected by stem quality [19]. The mountainous Bavarian and Carpathian sites are cooler than the planting sites in Lithuania, e.g., the mean annual temperature is 6.05–6.63 °C, 5.05–5.61 °C and 7.44–7.65 °C for the Bavarian, Carpathian, and Lithuanian sites, respectively [23]. The Carpathian site is more continental than the other two sites: mean annual temperature amplitude for the Bavarian, Carpathian and Lithuanian sites is 18.4–18.5 °C, 20.9–21.0 °C and 19.7–20.7 °C [23]. When transferred to a new location, broadleaved trees adapted to cooler sites require relatively less heat to budburst [10]. This may lead to a relatively stronger spring frost damage and lower stem quality. Thus, differential adaptedness may lead to variable associations between the phenotypic traits as observed in our study.
Owing to presumably lower vitality as a result of mating among relatives, the trees of low observed heterozygosity (Ho) may be less tolerant to environmental stresses. However, in our study the absence of relationship between stem quality and observed heterozygosity indicates that homozygotes are largely lost already in early ontogeny (review by [8]). Consequently, the low stem quality in the mature beech trees observed in our study is a very likely consequence of maladaptation of their phenology rhythm against the local temperature climate and especially spring frosts. Therefore, we interpret the Ho variation between the phenology and genetic groups as consequence of variable relatedness of the mating parents within the phenology pools.

5. Conclusions

Considering the above, our study indicates that the phenology-based non-random mating networks strongly depends on the genetic structuring of relative groups in European beech stands. These relative groups are likely to maintain a district phenology leading to a strong genetic differentiation of the genetic groups within the stands. Furthermore, due to a strong relationship among the phenology, adaptedness and stem morphotype, this genetic variation is well reflected by the stem morphotype in European beech stands (Figure 5). Artificial establishment effectively disrupts the spatial structures of relatives in European beech stands and could be considered as a genetic diversity enrichment measure even in ecological forestry.

Supplementary Materials

The following supporting information can be downloaded at: https://www.mdpi.com/article/10.3390/f13050664/s1.

Author Contributions

Conceptualization, D.D. and R.K.; methodology, V.B. and D.D.; software, D.D. and V.B.; validation, R.K.; formal analysis, R.K.; investigation, R.K. and J.B.; resources, D.D.; data curation, V.B. and D.D.; writing—original draft preparation, R.K.; writing—review and editing, R.K. and D.D.; visualization, R.K. and D.D.; supervision, D.D.; funding acquisition, D.D. All authors have read and agreed to the published version of the manuscript.

Funding

The study was financially supported by the Lithuania Science Council project No. S-MIP-19-3 7.5.

Data Availability Statement

Data is available upon request from the corresponding author.

Conflicts of Interest

There are no conflict of interest.

References

  1. Sykes, M.T.; Prentice, I.C. Climate change, tree species distributions and forest dynamics: A case study in the mixed conifer/northern hardwoods zone of northern Europe. Clim. Change 1996, 34, 161–177. [Google Scholar] [CrossRef]
  2. McKenney, D.W.; Pedlar, J.H.; Lawrence, K.; Campbell, K.; Hutchinson, M.F. Potential Impacts of Climate Change on the Distribution of North American Trees. BioScience 2007, 57, 939–948. [Google Scholar] [CrossRef]
  3. Bolte, A.; Hilbrig, L.; Grundmann, B.; Kampf, F.; Brunet, J.; Roloff, A. Climate change impacts on stand structure and competitive interactions in a southern Swedish spruce–beech forest. Eur. J. For. Res. 2010, 129, 261–276. [Google Scholar] [CrossRef] [Green Version]
  4. Kraj, W.; Sztorc, A. Genetic structure and variability of phenological forms in the European beech (Fagus sylvatica L.). Ann. For. Sci. 2009, 66, 203. [Google Scholar] [CrossRef] [Green Version]
  5. Dounavi, A.; Netzer, F.; Celepirovic, N.; Ivanković, M.; Burger, J.; Figueroa, A.; Schön, S.; Simon, J.; Cremer, E.; Fussi, B.; et al. Genetic and physiological differences of European beech provenances (F. sylvatica L.) exposed to drought stress. For. Ecol. Manag. 2016, 361, 226–236. [Google Scholar] [CrossRef]
  6. Ciocîrlan, E.; Sofletea, N.; Ducci, F.; Curtu, A.L. Patterns of genetic diversity in European beech (Fagus sylvatica L.) at the eastern margins of its distribution range. iForest 2017, 10, 916–922. [Google Scholar] [CrossRef]
  7. Merzeau, D.; Comps, B.; Thiebaut, B.; Cuguen, J.; Letouzey, J. Genetic structure of natural stands of Fagus sylvatica L. Heredity 1994, 72, 269–277. [Google Scholar] [CrossRef] [Green Version]
  8. Pyhäjärvi, T.; Kujala, S.T.; Savolainen, O. 275 years of forestry meets genomics in Pinus sylvestris. Evol. Appl. 2020, 13, 11–30. [Google Scholar] [CrossRef] [Green Version]
  9. Nagai, H.; Murata, K.; Nakano, T. Defect detection in lumber including knots using bending deflection curve: Comparison between experimental analysis and finite element modeling. J. Wood Sci. 2009, 55, 169–174. [Google Scholar] [CrossRef]
  10. Eriksson, G. Quercus Petrea and Quercus Robur Recent Genetic Research; Stadia Forestalia Slovenica, 146; Slovenian Forestry Institute, The Silva Slovenica Publishing Centre: Ljubliana, Slovenian, 2015; p. 96. ISSN 0353-6025. [Google Scholar]
  11. Schuldt, B.; Buras, A.; Arend, M.; Vitasse, Y.; Beierkuhnlein, C.; Damm, A.; Gharun, M.; Grams, T.E.E.; Hauck, M.; Hajek, P.; et al. A first assessment of the impact of the extreme 2018 summer drought on Central European forests. Basic Appl. Ecol. 2020, 45, 86–103. [Google Scholar] [CrossRef]
  12. Drénou, C.; Restrepo, D.; Slater, D. Demystifying Tree Forks: Vices and Virtues of Forks in Arboriculture. J. Bot. Res. 2020, 3, 100–113. [Google Scholar] [CrossRef]
  13. Ningre, F.; Colin, F. Frost damage on the terminal shoot as a risk factor of fork incidence on common beech (Fagus sylvatica L.). Ann. For. Sci. 2007, 64, 79–86. [Google Scholar] [CrossRef] [Green Version]
  14. Jennings, D.T.; Stevens, R.E. Southwestern pine tip moth. In USDA Forest Service, Forest Insect and Disease Leaflet; US Department of Agriculture, Forest Service: Washington, DC, USA, 1982; Volume 58, p. 7. [Google Scholar]
  15. Colin, F.; Sanjines, A.; Fortin, M.; Bontemps, J.D.; Nicolini, E. Fagus sylvatica trunk epicormics in relation to primary and secondary growth. Ann. Bot. 2012, 110, 995–1005. [Google Scholar] [CrossRef] [Green Version]
  16. Hannerz, M. Genetic and seasonal variation in hardiness and growth rhythm in boreal and temperate conifers—A review and annotated bibliography. For. Res. Inst. Swed. Rep. 1998, 2, 140. [Google Scholar]
  17. Levins, R. Some Demographic and Genetic Consequences of Environmental Heterogeneity for Biological Control. Bull. Entomol. Soc. Am. 1969, 15, 237–240. [Google Scholar] [CrossRef]
  18. Chmura, D.J.; Rożkowski, R. Variability of beech provenances in spring and autumn phenology. Silvae Genet. 2002, 51, 123–127. [Google Scholar]
  19. Kreyling, J.; Thiel, D.; Nagy, L.; Jentsch, A.; Huber, G.; Konnert, M.; Beierkuhnlein, C. Late frost sensitivity of juvenile Fagus sylvatica L. differs between southern Germany and Bulgaria and depends on preceding air temperature. Eur. J. For. Res. 2012, 131, 717–725. [Google Scholar] [CrossRef]
  20. Dittmar, C.; Elling, W. Phenological phases of common beech (Fagus sylvatica L.) and their dependence on region and altitude in Southern Germany. Eur. J. For. Res. 2006, 125, 181–188. [Google Scholar] [CrossRef]
  21. Vitasse, Y.; Delzon, S.; Dufrêne, E.; Pontailler, J.Y.; Louvet, J.M.; Kremer, A.; Michalet, R. Leaf phenology sensitivity to temperature in European trees: Do withinspecies populations exhibit similar responses? Agric. For. Meteorol. 2009, 149, 735–744. [Google Scholar] [CrossRef]
  22. Danusevičius, D.; Jonsson, A.; Eriksson, G. Variation among open-pollinated families of Picea abies (L.) Karst. in response to simulated frost desiccation treatment. Silvae Genet. 1999, 45, 158–167. [Google Scholar]
  23. FAO Map Catalog. Interactive Temperature Data Maps for 10 km Grid in Europe. Available online: https://data.apps.fao.org/map/catalog/srv/eng/catalog.search#/home (accessed on 8 April 2022).
  24. Linderholm, H.W. Growing season changes in the lastcentury. Agric. For. Meteorol. 2006, 137, 1–14. [Google Scholar] [CrossRef]
  25. Heide, O.M. Daylength and thermal time responses of budburst during dormancy release in some northern deciduous trees. Physiol. Plant. 1993, 88, 531–540. [Google Scholar] [CrossRef] [PubMed]
  26. Leinonen, I.; Hanninen, H. Adaptation of the timing of bud burst of Norway spruce to temperate and boreal climates. Silva Fenn. 2002, 36, 695–701. [Google Scholar] [CrossRef] [Green Version]
  27. Falusi, M.; Calamassi, R. Bud dormancy in beech (Fagus sylvatica L.). Effect of chilling and photoperiod on dormancy release of beech seedlings. Tree Physiol. 1990, 6, 429–438. [Google Scholar] [CrossRef] [PubMed]
  28. Cline, M.G. Concepts and terminology of apical dominance. Am. J. Bot. 1997, 84, 1064–1069. [Google Scholar] [CrossRef] [PubMed] [Green Version]
  29. Barbier, F.; Dun, E.A.; Beveridge, C.A. Quick guide Apical dominance. Curr. Biol. 2017, 27, R853–R909. [Google Scholar] [CrossRef] [Green Version]
  30. Dun, E.A.; Ferguson, B.J.; Beveridge, C.A. Apical Dominance and Shoot Branching. Divergent Opinions or Divergent Mechanisms? Plant Physiol. 2006, 142, 812–819. [Google Scholar] [CrossRef] [Green Version]
  31. De Vries, D.P. Rootstock Breeding. In Encyclopedia of Rose Science; Plant Research International (PRI): Wageningen, The Netherlands, 2003; pp. 639–645. [Google Scholar] [CrossRef]
  32. Cline, M.G.; Harrington, C.A. Apical dominance and apical control in multiple flushing of temperate woody species. Can. J. For. Res. 2007, 37, 74–83. [Google Scholar] [CrossRef]
  33. Holsten, E.H.; Hennon, P.E.; Trummer, L.; Schultz, M. Insects and Diseases of Alaskan Forests. In USDA Forest Service, Alaska Region; US Department of Agriculture, Forest Service, Alaska Region, State and Private Forestry, Forest Health Protection: Washington, DC, USA, 2001; Volume R10-TP-87, p. 242. [Google Scholar]
  34. Heiermann, J.; Schütz, S. The effect of the tree species ratio of European beech (Fagus sylvatica L.) and Norway spruce (Picea abies (L.) Karst.) on polyphagous and monophagous pest species—Lymantria monacha L. and Calliteara pudibunda L. (Lepidoptera: Lymantriidae) as an example. For. Ecol. Manag. 2008, 255, 1161–1166. [Google Scholar] [CrossRef]
  35. van Couwenberghe, R.; Gégout, J.C.; Lacombe, E.; Collet, C. Light and competition gradients fail to explain the coexistence of shade-tolerant Fagus sylvatica and shade-intermediate Quercus petraea seedlings. Ann. Bot. 2013, 112, 1421–1430. [Google Scholar] [CrossRef] [Green Version]
  36. Pilkauskas, M.; Augustaitis, A.; Marozas, V. Growth peculiarities of European beech trees outside their natural distribution range in Lithuania. In Proceedings of the 5th International Scientific Conference “Rural Development 2011”, Kaunas, Lithuania, 24–25 November 2011; Volume 5, pp. 106–110. [Google Scholar]
  37. Kembrytė, R.; Danusevičius, D.; Buchovska, J.; Baliuckas, V.; Kavaliauskas, D.; Fussi, B.; Kempf, M. DNA-based tracking of historical introductions of forest trees: The case of European beech (Fagus sylvatica L.) in Lithuania. Eur. J. For. Res. 2021, 140, 435–449. [Google Scholar] [CrossRef]
  38. Kramer, K.; Degen, B.; Buschbom, J.; Hickler, T.; Thuiller, W.; Sykes, M.T.; de Winter, W. Modelling exploration of the future of European beech (Fagus sylvatica L.) under climate change–range, abundance, genetic diversity and adaptive response. For. Ecol. Manag. 2010, 259, 2213–2222. [Google Scholar] [CrossRef]
  39. Fiodorov, J.A. Forests of the Amber Land; Knyznoje izdalestvo: Kaliningrad, Russia, 1990; p. 65. (In Russian) [Google Scholar]
  40. Gregorius, H.R.; Kownatzki, D. Spatiogenetic characteristics of beech stands with different degrees of autochthony. BMC Ecol. 2005, 5, 8. [Google Scholar] [CrossRef] [PubMed] [Green Version]
  41. Kempf, M.; Konnert, M. Distribution of genetic diversity in Fagus sylvatica at the north-eastern edge of the natural range. Silva Fenn. 2016, 50, 17. [Google Scholar] [CrossRef] [Green Version]
  42. Ulaszewski, B.K. Neutralna i Adaptacyjna Zmienność Genetyczna Buka Zwyczajnego Fagus sylvatica L. na Podstawie Analiz Genomowych (Neutral and Adaptive Genetic Diversity of European Beech Fagus sylvatica L. Based on Genomic Analyses). Ph.D. Dissertation, Kazimierz the Great University, Bydgoszcz, Poland, 2018; p. 185, (In Polish with extended English summary). [Google Scholar]
  43. Pastorelli, R.; Smulders, M.J.M.; Van’t Westende, W.P.C.; Vosman, B.; Giannini, R.; Vettori, C.; Vendramin, G.G. Characterization of microsatellite markers in Fagus sylvatica L. and Fagus orientalis Lipsky. Mol. Ecol. Notes 2003, 3, 76–78. [Google Scholar] [CrossRef]
  44. Lefèvre, S.; Wagner, S.; Petit, R.J.; de Lafontaine, G. Multiplexed microsatellite markers for genetic studies of beech. Mol. Ecol. Resour. 2012, 12, 484–491. [Google Scholar] [CrossRef]
  45. Tanaka, K.; Nakamura, T.; Tsumura, Y. Development and polymorphism of microsatellite markers for Fagus crenataand the closely related species, F. japonica. Theor. Appl. Genet. 1999, 99, 11–15. [Google Scholar] [CrossRef]
  46. Asuka, Y.; Tomaru, N.; Nisimura, N.; Tsumura, Y.; Yamamoto, S. Heterogeneous genetic structure in a Fagus crenata population in an old-growth beech forest revealed by microsatellite markers. Mol. Ecol. 2004, 13, 1241–1250. [Google Scholar] [CrossRef]
  47. Vornam, B.; Decarli, N.; Gailing, O. Spatial Distribution of Genetic Variation in a Natural Beech Stand (Fagus sylvatica L.) Based on Microsatellite Markers. Conserv. Genet. 2004, 5, 561–570. [Google Scholar] [CrossRef]
  48. Dumolin, S.; Demesure, B.; Petit, R.J. Inheritance of chloroplast and mitochondrial genomes in pedunculated oak investigated with an efficient PCR method. Theor. Appl. Genet. 1995, 91, 1253–1256. [Google Scholar] [CrossRef]
  49. Oosterhout, C.V.; Weetman, D.; Hutchinson, W.F. Estimation and adjustment of microsatellite null alleles in nonequilibrium populations. Mol. Ecol. Notes 2006, 6, 255–256. [Google Scholar] [CrossRef]
  50. Peakall, R.; Smouse, P.E. GenAlEx 6: Genetic analysis in Excel. Population genetic software for teaching and research. Mol. Ecol. Notes 2006, 6, 288–295. [Google Scholar] [CrossRef]
  51. Pritchard, J.K.; Stephens, M.; Donnelly, P. Inference of population structure using multilocus genotype data. Genetics 2000, 155, 945–959. [Google Scholar] [CrossRef] [PubMed]
  52. Earl, D.A.; von Holdt, B.M. STRUCTURE HARVESTER: A website and program for visualizing STRUCTURE output and implementing the Evanno method. Conserv. Genet. Resour. 2012, 4, 359–361. [Google Scholar] [CrossRef]
  53. Jones, O.R.; Wang, J. COLONY: A program for parentage and sibship inference from multilocus genotype data. Mol. Ecol. Resour. 2010, 3, 551–555. [Google Scholar] [CrossRef] [PubMed]
  54. Lynch, M.; Ritland, K. Estimation of pairwise relatedness with molecular markers. Genetics 1999, 152, 1753–1766. [Google Scholar] [CrossRef]
  55. Hurme, P.; Repo, T.; Savolainen, O.; Pääkkönen, T. Climatic adaptation of bud set and frost hardiness in Scots pine (Pinus sylvestris). Can. J. For. Res. 1997, 27, 716–723. [Google Scholar] [CrossRef]
  56. Hansen, J.K.; Jørgensen, B.B.; Stoltze, P. Variation of quality and predicted economic returns between european beech (Fagus sylvatica L.) provenances. Silvae Genet. 2003, 5, 185–197. [Google Scholar]
  57. Soularue, J.P.; Kremer, A. Evolutionary responses of tree phenology to the combined effects of assortative mating, gene flow and divergent selection. Heredity 2014, 113, 485–494. [Google Scholar] [CrossRef] [Green Version]
  58. Shim, D.; Ko, J.H.; Kim, W.C.; Wang, Q.J.; Keathley, D.E.; Han, K.H. A molecular framework for seasonal growth-dormancy regulation in perennial plants. Hortic. Res.-Engl. 2014, 1, 14059. [Google Scholar] [CrossRef] [Green Version]
  59. Mijnsbrugge, K.V.; Moreels, S. Varying Levels of Genetic Control and Phenotypic Plasticity in Timing of Bud Burst, Flower Opening, Leaf Senescence and Leaf Fall in Two Common Gardens of Prunus padus L. Forests 2020, 11, 1070. [Google Scholar] [CrossRef]
  60. Jordan, C.Y.; Ally, D.; Hodgins, K.A. When can stress facilitate divergence by altering time to flowering? Ecol. Evol. 2015, 5, S962–S973. [Google Scholar] [CrossRef] [PubMed]
  61. Menzel, A.; Helm, R.; Zang, C. Patterns of late spring frost leaf damage and recovery in a European beech (Fagus sylvatica L.) stand in south-eastern Germany based on repeated digital photographs. Front. Plant Sci. 2015, 6, 110. [Google Scholar] [CrossRef] [Green Version]
  62. Gömöry, D.; Paule, L. Trade-off between height growth and spring flushing in common beech (Fagus sylvatica L.). Ann. For. Sci. 2011, 68, 975–984. [Google Scholar] [CrossRef]
  63. Wühlisch, G.V.; Krusche, D.; Muhs, H.J. Variation in temperature sum requirement for flushing of beech provenances. Silvae Genet. 1995, 44, 343–346. [Google Scholar]
  64. Ogris, N.; Brglez, A.; Piškur, B. Pseudodidymella fagi in Slovenia: First Report and Expansion of Host Range. Forests 2019, 10, 718. [Google Scholar] [CrossRef] [Green Version]
  65. Elzinga, J.A.; Atlan, A.; Biere, A.; Gigord, L.; Weis, A.E.; Bernasconi, G. Time after time: Flowering phenology and biotic interactions. Trends Ecol. Evol. 2007, 22, 432–439. [Google Scholar] [CrossRef] [Green Version]
  66. Figliuolo, G. Addressing Biodiversity Conservation Methods with Fagus sylvatica Genetic Indicators. Open J. Genet. 2014, 4, 166–174. [Google Scholar] [CrossRef] [Green Version]
  67. Starke, R.; Ziehe, M.; Muller-Strack, G. Viability selection in juvenile populations of European beech (Fagus sylvatica L.). For. Genet. 1996, 3, 217–225. [Google Scholar]
  68. Gregorius, H.; Krauhausen, J.; Müller-Starck, G. Spatial and temporal genetic differentiation among the seed in a stand of Fagus sylvatica L. Heredity 1986, 57, 255–262. [Google Scholar] [CrossRef] [Green Version]
  69. Jump, A.S.; Rico, L.; Coll, M.; Peñuelas, J. Wide variation in spatial genetic structure between natural populations of the European beech (Fagus sylvatica L.) and its implications for SGS comparability. Heredity 2012, 108, 633–639. [Google Scholar] [CrossRef] [PubMed]
  70. Marguardt, P.E.; Epperson, B.K. Spatial and population genetic structure of microsatellites in white pine. Mol. Ecol. 2004, 13, 3305–3315. [Google Scholar] [CrossRef] [PubMed]
  71. White, T.; Adams, W.; Neale, D. Forest Genetics; CABI Publishing: Wallingford, UK, 2008; 704p, ISBN 10 0851993486. [Google Scholar]
  72. Soularue, J.P.; Kremer, A. Assortative mating and gene flow generate clinal phenological variation in trees. BMC Evol. Biol. 2012, 12, 79. [Google Scholar] [CrossRef] [PubMed] [Green Version]
  73. Hampe, A.; Petit, R.J. Conserving biodiversity under climate change: The rear edge matters. Ecol. Lett. 2005, 8, 461–467. [Google Scholar] [CrossRef] [PubMed] [Green Version]
  74. Bolte, A.; Czajkowski, T.; Kompa, T.; Birks, H.J.B.; Willis, K.J. The north-eastern distribution range of European beech a review. Forestry 2007, 80, 413–429. [Google Scholar] [CrossRef]
  75. Koski, V. A study of pollen dispersal as a mechanism of gene flow in conifers. Commun. Inst. For. Fenn. 1970, 70, 78. [Google Scholar]
  76. Sjölund, M.J.; González-Díaz, P.; Moreno-Villena, J.J.; Jump, A.S. Gene flow at the leading range edge: The long-term consequences of isolation in European Beech (Fagus sylvatica L. Kuhn.). J. Biogeogr. 2019, 46, 2787–2799. [Google Scholar] [CrossRef] [Green Version]
  77. Jump, A.S.; Penuelas, J. Genetic effects of chronic habitat fragmentation in a wind-pollinated tree. Proc. Natl. Acad. Sci. USA 2006, 103, 8096–8100. [Google Scholar] [CrossRef] [Green Version]
Figure 1. Methods for scoring the stem morphotype. (1) forking index was scored by estimating at which part of the stem forking defect is located and the number of forks (e.g., the tree with most forks in figure above 3 × 2 + 2 × 2 + 2 × 2 + 1 × 2 = 16). The number of forks given in the figure is an example referring the left most forked tree at the left box of the figure. The score 1.5 notes the straight trees containing being at the very base. COP3 notes the tree from originated coppicing (not applicable for beech). 1/1 is tree with no defects (1 stem and 1 fork). Autumn leaf senesce shows dominant leaf color of the crown, where grey color in stage 6 indicates leaf-free sections, whereas color green in stage 1 indicates green leaves.
Forests 13 00664 g001
Figure 2. Associations between the budburst phenology, autumn leaf senescence, stem quality and observed heterozygosity in VIES. MOCI, JURA and NOR1 stands. The number of trees at a particular budburst stage is given above the bars at upmost row of the plots. The error bars indicate standard error. For NOR1, height to fork is given because budburst was not scored in NOR1.
Forests 13 00664 g002
Figure 3. Individual tree assignment scores to the within stand STRUCTURE genetic groups based on Bayesian clustering of the trees with each in stand analyzed separately. Colors mark the genetic groups, defined in the legend. Please explain the colors in the figure.
Forests 13 00664 g003
Figure 4. Properties of the STRUCTURE genetic groups in the four stands of European beech. For each stand separately the plots (a,b) indicate the phenology traits and plots (c)–the stem quality. The size of the genetic groups is indicated above the bars in the plots (a). The error bars show standard errors.
Forests 13 00664 g004
Figure 5. The phenology-morphology-genetic structure association model in European beech stands as supported by the findings of our study. (1) the geneflow feeds the genetic diversity together with distinct phenology into the stands; (2) distinct phenology groups develop (marked with color) and (3) leads to deviations for random mating that is reflected by forming distinct genetic groups (confirmed by association among the SSR genetic groups and phenology in this study) and in absence of strong selective pressure within a region these groups within stands can be stronger differentiated than stands in that particular region; (4) the differences in adaptedness of the phenology groups causes variation in stem quality morphotype (as found here by the association among phenology and stem quality indexes). Right is a photographic illustration of the above, where the tree of a European beech tree of an early leaf sentence contains stem forking defect lower dawn than the trees of late leaf sentence in JURA stand.
Forests 13 00664 g005
Table 1. Characteristics of the sampled stands of European beech in seaside lowland of western Lithuania (the mildest climatic zone in Lithuania, with mean annual temperature (MAT) of 7.44–7.65 °C [23]). All the stands were artificially established. Age of the mature overstory trees is given (estimated by coring). All stands are on normally irrigated medium fertility sandy sites. Species composition refers to the mature overstory.
Stand IDForest District Species
Composition
Area,
ha
Stocking Level/Age ClassSample SizeLat.Long.Alt.
m a.s.l.
VIES aViesvile70% beech, 30% Sc. pine5.90.8/1005555°4′52.37″22°24′9.72″42
MOCI aMociskes80% beech, 20% Sc. pine3.50.9/805355°6′19.98″22°14′51.54″30
JURA aJurava90% beech, 10 oak 1.80.6/1205055°8′6.15″22°18′39.19″39
NOR1 bNorkaiciai70% beech, 30% Sc. pine5.50.8/1205055°27′1.63″21°32′22.49″38
a—originates from Bavarian Alps (ca. 500–1000 m. a.s.l., MAT= 6.05–6.63 °C); b—originates from Carpathian Mountains of south-eastern Poland (ca. 500–800 m. a.s.l., MAT = 5.05–5.61 °C), based on DNA marker study Kembryte et al. [38].
Table 2. Comparison of the morphology traits and within the within stand genetic diversity indexes among the studied stands of European beech. se. stands for standard error. Stocking level of the stands is given below the stand ids (stocking of 1 means complete crown closure). Nobs is sample size. Na is mean number of different alleles, Ho and He observed and expected heterozygotes, Fis inbreeding coefficient (s.e. for DNA data was calculated from individual locus values).
Stand id/Stocking LevelNobsD (cm)H (m)H to First Fork Stem Quality Index 1 Stem Straightness, 5 Scores, 5 Is Very Curvy NaHouHeFis
VIES/5536.331.415.63.852.539.400.680.720.05
0.8s.e.1.00.71.30.570.151.170.040.040.04
MOCI/5333.928.521.23.372.589.070.640.730.10
0.9s.e.8.02.87.52.771.231.070.030.030.04
JURA/5043.824.518.03.872.556.270.610.670.05
0.6s.e.13.65.97.74.131.080.430.030.030.02
NOR1/5037.530.215.86.022.507.870.650.700.06
0.8s.e.1.370.721.211.030.201.010.040.040.02
1—range of stem quality index from 1 single stem straight to 37.5 multiple forking and very curvy.
Table 3. Pearson product moment correlation coefficients and their significance (*-0.01 to 0.05, **-0.001 to 0.01, and ***-<0.001) among the morphology traits and observed heterozygosity (Ho) of European beech trees calculated separately in each of the studied stands. The origin, age, number of trees and stocking of the stands are given in the parathesis at their names. Ho is observed heterozygosity of individual tree. High value of the stem indexes and stem straightness indicates worse stem quality. Height to fork measures height from the ground to the first major stem fork moving from the tree base upwards. SQINDEX 1 is the stem quality index calculated without the stem straightness term in the formula.
TraitDiameterHeightBudburst 3 Scores,
3 = Early
Leaf Senescence
4 Scores, 4 = Early
Ho
VIES (Bavaria, Age 100, n = 55, High Stocking)
Height to fork0.090.36 **−0.21−0.040.00
SQINDEX 1 −0.04−0.180.22−0.100.02
SQINDEX −0.06−0.33 *0.32 *0.000.10
STRAIGHT −0.16−0.48 ***0.39 **0.040.19
JURA (Bavaria, Age 120, n = 51, Low Stocking)
Height to fork0.000.75 ***−0.17−0.100.10
SQINDEX 1 0.29 *−0.180.20−0.16−0.19
SQINDEX 0.13−0.30 **0.27 *−0.15−0.17
STRAIGHT −0.07−0.27 *0.210.00−0.11
MOCI (Bavaria, Age 80, n = 55, Very High Stocking)
Height to fork−0.48 ***−0.150.170.100.27 *
SQINDEX 1 0.44 ***0.190.01−0.02−0.16
SQINDEX 0.52 ***0.200.06−0.12−0.14
STRAIGHT 0.07−0.020.00−0.080.16
NOR1 (Carpathians, Age 80, n = 50, High Stocking)
Height to fork0.000.27 *na−0.07−0.25 *
SQINDEX 1 0.05−0.26 *na0.160.13
SQINDEX −0.03−0.27 *na0.100.09
STRAIGHT −0.09−0.27 *na−0.06−0.02
Table 4. Pearson product moment correlation coefficients (bold) and their significance between the wood yield, morphology traits and the observed heterozygosity calculated on individual tree level for each stand separately.
TraitDHHFORKBUDBLEAFSQINDEXSTRAIGHT
Ho in VIES0.18−0.130.000.250.080.100.19
n = 550.19020.33460.97570.06450.56270.46360.1624
Ho in JURA−0.010.110.10−0.20−0.22−0.17−0.11
n = 510.93080.45550.48270.15130.12960.22310.4303
Ho in MOCI0.000.040.270.180.36−0.140.16
n = 550.9730.79920.05020.19410.00820.32860.2435
Ho in NOR1−0.02−0.22−0.25na0.100.09−0.02
n = 500.88040.11810.0753 0.50870.52840.8944
Table 5. Genetic diversity parameters compared between the STRUCTURE genetic groups in each of the studied stands (the multilocus standard errors on the brackets). N-group size. Na-mean number of different alleles, Ne-effective allele number, Ho and He observed and expected heterozygosity (adjusted for sample size), Fis-inbreeding coefficient.
Genetic Group 1 NNaNeHoHeFis
VIES
1 (early)136.73 (0.67)4.13 (0.48)0.73 (0.04)0.74 (0.04)−0.045 (0.040)
2 (late)428.33 (1.08)4.14 (0.61)0.66 (0.05)0.70 (0.04)0.057 (0.045)
MOCI
1 (late)277.73 (0.97)4.02 (0.44)0.61 (0.03)0.72 (0.03)0.113 (0.051)
2 (early)267.87 (0.82)4.37 (0.54)0.67 (0.03)0.74 (0.04)0.052 (0.039)
JURA
1 (late)145.53 (0.68)3.64 (0.48)0.60 (0.06)0.66 (0.06)0.060 (0.039)
2 (early)155.60 (0.72)3.32 (0.53)0.56 (0.05)0.60 (0.06)−0.006 (0.042)
3 (early)227.67 (0.73)4.54 (0.48)0.67 (0.04)0.75 (0.04)0.079 (0.044)
NOR1
1 (late)84.60 (0.45)2.98 (0.36)0.68 (0.05)0.64 (0.04)−0.135 (0.053)
2 (early)186.20 (0.60)3.70 (0.51)0.64 (0.05)0.68 (0.04)0.041 (0.036)
3 (early)246.53 (0.65)3.54 (0.31)0.65 (0.04)0.69 (0.04)0.036 (0.034)
1—prevailing phenology stage of the trees in the genetic group given in the parathesis.
Table 6. Sibling structure analysis in four European beech stands (soft. COLONY). Nef is effective population size. Nobs is number of trees. Spatial arrangement of the clusters is shown in Supplementary Material.
Stand idNobsNumber of Female Parents 1Freq. of Selfed TreesNumber of Full Sib FamiliesNumber of Families with 3 or More MembersLargest Family Size 2NefNumber of ClustersSize of 3 Largest Clusters
VIES55350.0503383923/14/12
MOCI53390.21024871721/10/4
JURA51400.200231032015/10/5
NOR150340.0223368825/9/5
1—equals to number of half sib families, 2—Number of trees in largest half sib family.
Publisher’s Note: MDPI stays neutral with regard to jurisdictional claims in published maps and institutional affiliations.

