Abstract
Most of the forest biomass models that have been developed so far focus on the study of the aboveground biomass of forest trees and the prediction of belowground biomass remains obviously insufficient. Moreover, most of the existing studies on the estimation of the belowground biomass of trees have considered roots as a whole, ignoring the differences in composition and function of roots within different diameter classes. In this study, we measured the root biomass of birch plantation forests in northeastern China using extensive destructive sampling, in which we divided the root system into three parts: coarse, medium, and fine roots. We selected the best model base form from three common allometric biomass equations and determined the most appropriate error structure for the two sets of models using likelihood comparisons. The additive and disaggregated models were fitted using maximum likelihood with open-source software. We also added the site factor as a dummy variable into the two models. Finally, the competency of the two models was tested using ten-fold cross-validation. The results showed that both models could provide relatively accurate estimates of birch root biomass but that the disaggregated model performed slightly better than the additive model.
1. Introduction
The biomass and carbon stocks of forests play a major role in the global carbon cycle and the assessment of the structure and condition of forests [1]. The estimation of forest biomass using models facilitates the assessment of the productivity and carbon sequestration capacity of forests [2]. The monitoring of forest biomass and carbon stocks and the establishment of biomass models that are suitable for larger areas are therefore increasingly important. Over recent decades, researchers have developed more than 2600 biomass models for over 100 species of tree around the world [3], most of which are used to estimate aboveground biomass [4,5,6,7]. There are much fewer estimates of the belowground biomass of plants due to the difficulties of excavation and high consumption costs. However, the root systems of trees, especially fine roots, play a critical role in resource absorption for plants [8] and the prediction of the root biomass of forests helps us to understand the growth and development of trees. Similarly, this contributes to our assessment of forest biomass distribution structures and forest development conditions at the stand scale. More importantly, root biomass accounts for about 15–25% of the total biomass of all types of forests [9] and is an essential part of the estimation of carbon stocks within forest ecosystems. Therefore, the accurate quantification of belowground carbon stocks within forest ecosystems is essential for the effective prediction of how future climate change could affect global carbon dynamics [10]. In addition, most of the existing studies have only estimated the overall root biomass of trees and have ignored the differences between roots in different diameter classes [11,12]. It is well known that roots in different diameter classes differ in their physiological characteristics and functions; for example, fine roots are usually the most active and dynamic part of the root system in terms of nutrient and water uptake and carbon (C) storage and the coarse root component comprises larger structural roots that provide support and anchorage for the aboveground parts of the tree [10,13]. Thus, we suggested that it would be a better option to classify the tree root system by diameter class before attempting estimations.
White birch (Betula platyphylla Suk.) is a pioneer species in the succession of natural secondary forest ecosystems and is a critical tree species within the forests of northeastern China [14]. The estimation of the underground root biomass of white birch is important for understanding its carbon stocks, as well as productivity, but there have been few studies on the underground biomass of white birch.
The aggregation method that was proposed by Parresol (2001) has now become the mainstream method for making individual component biomass estimates using additive equations [15]. This method constructs separate nonlinear models for each component of the biomass of the stand and later aggregates these components into the total biomass, usually through weighted nonlinear seemingly uncorrelated regression (SUR). Additive biomass equation systems have been developed for white birch trees in natural stands [16,17,18]. Only the root biomass is estimated as a component in these systems, which is less accurate for root prognosis when using Wang’s additive model for birch plantation development [18]. Moreover, in contrast to the aggregative method, the disaggregation strategy focuses first on the specification of the allometric equation for the total biomass and then constrains the form or parameters of the component equations by fitting the proportion of total biomass that is observed in each component to ensure additivity [3,19].
For individual stands, diameter at breast height (DBH) is typically used to estimate their biomass, either alone or in combination with other stand characteristics. DBH is easy to measure and usually accounts for the largest share of variation in tree biomass [20,21,22,23,24], but attributes such as tree height or tree age can account for additional variation that is associated with differences in height, including diameter ratios, stand density, and other factors [25,26]. Whether adding the tree height into the equation could improve the accuracy of the model for the estimation of the root biomass of birch trees has not been well documented.
In this study, we constructed additive and disaggregated models with the aim of developing a predictive model that would be suitable for the estimation of the belowground root biomass of birch and could provide a reference for C reserves within forest root systems. Both models were additive, which had the advantage of taking into account the inherent correlation of roots in different stem classes. The two model systems used a multiplicative error structure, overcame the heterogeneity problem through log-transformation, and fitted the models using Gaussian maximum likelihood. Finally, a comparison of the performance differences between the two models was carried out and provided a more accurate method for the estimation of the belowground root biomass of birch plantations.
2. Materials and Methods
2.1. Study Area Description
The study area spans three provinces in northeastern China: Heilongjiang, Jilin, and Liaoning. Detailed information about the climatic and location characteristics of the three sites are described in Table 1. We considered a total of five planted forests in those three provinces in northeastern China, with a total of 493 sample trees. Three of the five experimental plantations are in Heilongjiang Province, all of which are located in the Maoer mountains, Heilongjiang province. The first is a 13-year-old plantation, the second is 9 years old and the third plantation is 7 years old. The density of the above three plantations is 2 m × 2 m. The fourth is a 10-year-old plantation with a planting density of 2 m × 2 m in Jilin Province. The fifth is a 13-year-old plantation in Liaoning Province with a planting density of 1.5 m × 0.75 m.

Table 1.
Geographic coordinates, temperature, and precipitation at the sites.
2.2. Measurement of Belowground Root Biomass
We destructively sampled birch stands in the five plantations in August 2011. When excavating the root systems of the birch trees, we first used hoists to pull the trunk tight and then used a shovel to carefully expose the main root at the base of the trunk and dug carefully to maintain the integrity of the root system as much as possible. The soil was then washed off the roots using water and the roots were divided into three diameter classes, which are commonly found in the literature, using sieves of 2 mm and 5 mm [27,28]: the coarse class (>5 mm in diameter), medium class (5–2 mm), and fine roots (<2 mm) (Supplementary Material). The biomass of each part of the root system was calculated using the method of Zhu et al. (2013) [29]. Then, 500 g of coarse and medium roots and about 100 g of fine roots was randomly sampled to measure the exact fresh weights. All samples were dried at 70 °C until the mass was constant and then, the ratio of dry to fresh weight was calculated. Finally, the weight of the dry biomass of each part of the root system was obtained using the fresh weight multiplied by the corresponding dry weight to fresh weight ratio. Table 2 shows the data of the specific root biomass measurements. The relationship between the total root biomass of white birch and its components per tree and tree variables (DBH and HT) is shown in Figure 1, which demonstrates the obvious nonlinear relationships.
Table 2.
Summary statistics of diameter at breast height (DBH), tree height (HT), and root biomass for the sampled trees (n = 493).
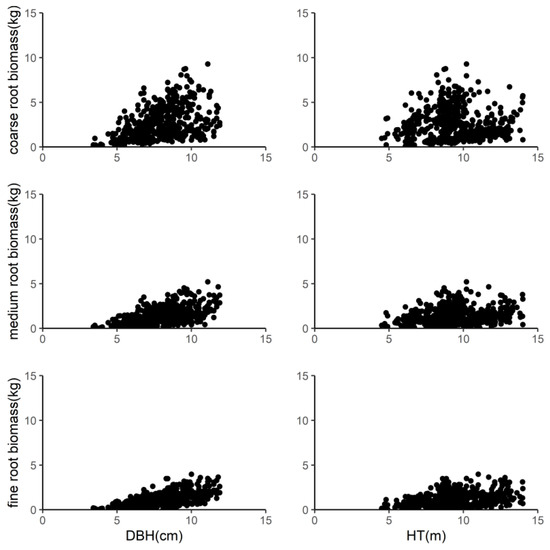
Figure 1.
Relationship between the coarse roots, medium roots, and fine roots of the sampled trees and tree diameter at breast height (DBH) and height (HT).
2.3. Selection of Allometric Equations and Error Structures
DBH is an important predictor in the biomass estimation model because it is easier to measure than other tree characteristics and has a satisfactory applicability for many tree species in many regions. In many cases, adding HT as a secondary predictor can improve the accuracy of the model predictions [12,30]. The following three formulae were common allometric equations in the literature:
In this study, the above three allometric biomass equations were fitted to the biomass of the components (coarse, medium, and fine roots) and the total root biomass.
There are two error structures (multiplicative and additive): the former is a linear regression (LR) on log-transformed data and the latter is a nonlinear regression (NLR) on untransformed data. In order to select the most appropriate error structure of the two for Equations (1)–(3), we applied the method that was recommended by Xiao et al. (2011) [31] to compute the Akaike information criterion (AICc) for each component model and the total root biomass model. Then, we compared the ΔAICc (ΔAICc = AICcNLR − AICcLR) to determine which error structure was more appropriate. When the ΔAICc > +2, it implied that the assumption of the multiplicative log-normal error structure was favored over the additive normal error structure. These results suggested that this dataset was more suitable for LR. Conversely, when the ΔAICc < −2, the more appropriate model was NLR on the untransformed data. When −2 < ΔAICc < +2, neither model error structure was favored and then, the model averaging could be adopted. Considering the differences in the environment as well as the age and density of the plantation forests at the three sites, we decided to use the sites as dummy variables in Equations (1)–(3). Two dummy variables, S2 and S3, were constructed to reflect the sites, i.e., Liaoning when S2 = 1 and S3 = 0, Jilin when S2 = 0 and S3 = 1, and Heilongjiang when S2 = 0 and S3 = 0.
Further, we evaluated the simple model using ten-fold cross-validation after determining the most suitable error structure.
2.4. Additive and Disaggregated Models of Biomass Equations
The gnls package of the open-source software R (4.0.4) was used to construct the additive and disaggregated models for the estimation of the root biomass of white birch, following the method of Affleck et al. (2016) [32]. The equations for coarse, medium, and fine root biomass were constructed separately and the total root biomass was calculated as the sum of each component biomass, as follows Equations (4)–(7):
Coarse:
Medium:
Fine:
Total:
where to denote the vectors of the coarse, medium, and fine root biomass of birch, respectively, is the total root biomass, is a nonlinear function of the mth component biomass, is the n × 1 residual vector, and n is the number of observations (trees). The disaggregated model was the contrast to the additive model. It required first the development of an estimation model for the overall root biomass, Equation (8):
Then, by treating the medium and fine roots as an overall F() function, was the fraction that was used to distinguish the coarse and fine roots, Equation (9):
It was decomposed using a multiplicative component judgment function. The component biomass expectation then became a complex nonlinear function of the available predictors, while the total amount was simplified. The additivity and homogeneity of the components were taken into account. An effective Gaussian biomass model that was based on this decomposed set of equations could be written in additive error form, as follows Equations (10)–(12):
where is a fractional function of similar form to , is the n × 1 residual vector, and n is the number of observations (trees).
2.5. Model Assessment and Evaluation
The strength of a model fit does not fully reflect the actual predictive ability of the model, so model validation was necessary to assess and evaluate the predictive ability of the different biomass equations. Therefore, we used the ten-fold cross-validation method to validate the model performances. The total data were randomly divided into 10 parts: 9 of them were used as training data and 1 was used as test data to test the model performances [33]. Four fit statistics were obtained for each equation to evaluate the fitting capability of the biomass prediction system: mean residual (E), mean of the absolute value of residuals (MABE), root mean square error (RMSE), and the coefficient of determination (R2). The relative error between the predicted and true values of the model was represented by E divided by the mean of the true data. The standard mathematical expressions of E, MABE, RMSE, and R2 are as follows, Equations (13)–(16):
In addition, due to the simplified variance functions of Affleck et al. (2016) that we used [32], the raw residuals were no longer suitable for the residual diagnostics. The normalized residuals were a better diagnostic method, Equation (17):
where = (, , …, )T is the vector of raw residuals for the nth tree, is the corresponding estimated variance–covariance matrix, and is a Choleski factorization of that matrix.
3. Results
3.1. Selection of Biomass Models
We compared the appropriateness of the error structures for the three allometric biomass equations (i.e., , , ) using the likelihood analysis. The information statistics (∆AICc) of the likelihood analysis are presented in Table 3. The results indicated that ∆AICc > 2 for the three allometric biomass equations for each component biomass and the total root biomass dataset. This means that the multiplicative log-normal error structure was more appropriate for our dataset. Thus, we used LR on the log-transformed data and added the dummy variables into Equations (1)–(3), as follows Equations (18)–(20):
where S represents the site of the dummy variable: Liaoning when S2 = 1 and S3 = 0, Jilin when S2 = 0 and S3 = 1, and Heilongjiang when S2 = 0 and S3 = 0.
Table 3.
Information statistics (ΔAICc = AICcnorm − AICclogn) of the likelihood analysis.
In the results of the ten-fold cross-validation (Table 4), it could be seen that Equation (3) had a relatively larger R2 and smaller E and MABE compared to Equations (1) and (2). Therefore, we ultimately chose Equation (3) as the basic form of the model and used the multiplicative log-normal error structure to establish the additive and disaggregated models.
Table 4.
R2, E, MABE, and RMSE for the three biomass models.
3.2. Additive Biomass Equations
Based on the multiplicative error structure of Equations (4)–(6), the results of fitting the additive system equations after logarithmic transformation are shown below Equations (21)–(23):
The coefficients of DBH and HT powers were significant (p < 0.05) in each biomass equation (Table 5). Interestingly, the coefficients of the DBH of white birch were positive in all three root component equations for coarse, medium, and fine roots, while the those of the HT were all negative. Positive coefficients for DBH and HT indicated that they were positively correlated with the biomass of each component of the root system. This meant that DBH was positively correlated with the biomass of each root fraction. In other words, the root biomass of birch increased with increasing DBH for the same tree height, while a negative coefficient of HT indicated that the root biomass decreased with increasing HT for the same DBH.
Table 5.
Parameter estimates and their asymptotic standard errors and p values for the additive root biomass equation system.
3.3. Disaggregated Model Equations
Against the additive model, a disaggregated model of Equations (10)–(12) was then specified. This model was based on an equation for the expected total root biomass, a function to discriminate between coarse root and fine root mass (<5 mm in diameter), and a function to discriminate between medium root and fine root mass. The forms that were adopted for these Equations (24)–(26) were:
The substitution of these equations into Equations (10)–(12) provided the overall model structure. The parameters of each biomass equation are shown in Table 6. We found that four parameters of the disaggregated model were insignificant so we tried to modify the model, but the results of the analysis of variance (ANOVA) showed that the deletion of the parameters that were not significant had little effect on the total model (p > 0.05). Considering that the overall p value of the model was highly significant (p < 0.001), we decided to still use the original model for the evaluation in order to avoid the deletion of parameters, which could lead to missing interactions between variables.
Table 6.
Parameter estimates and their asymptotic standard error and p values for the disaggregated root biomass equation system.
3.4. Biomass Model Validation and Comparison
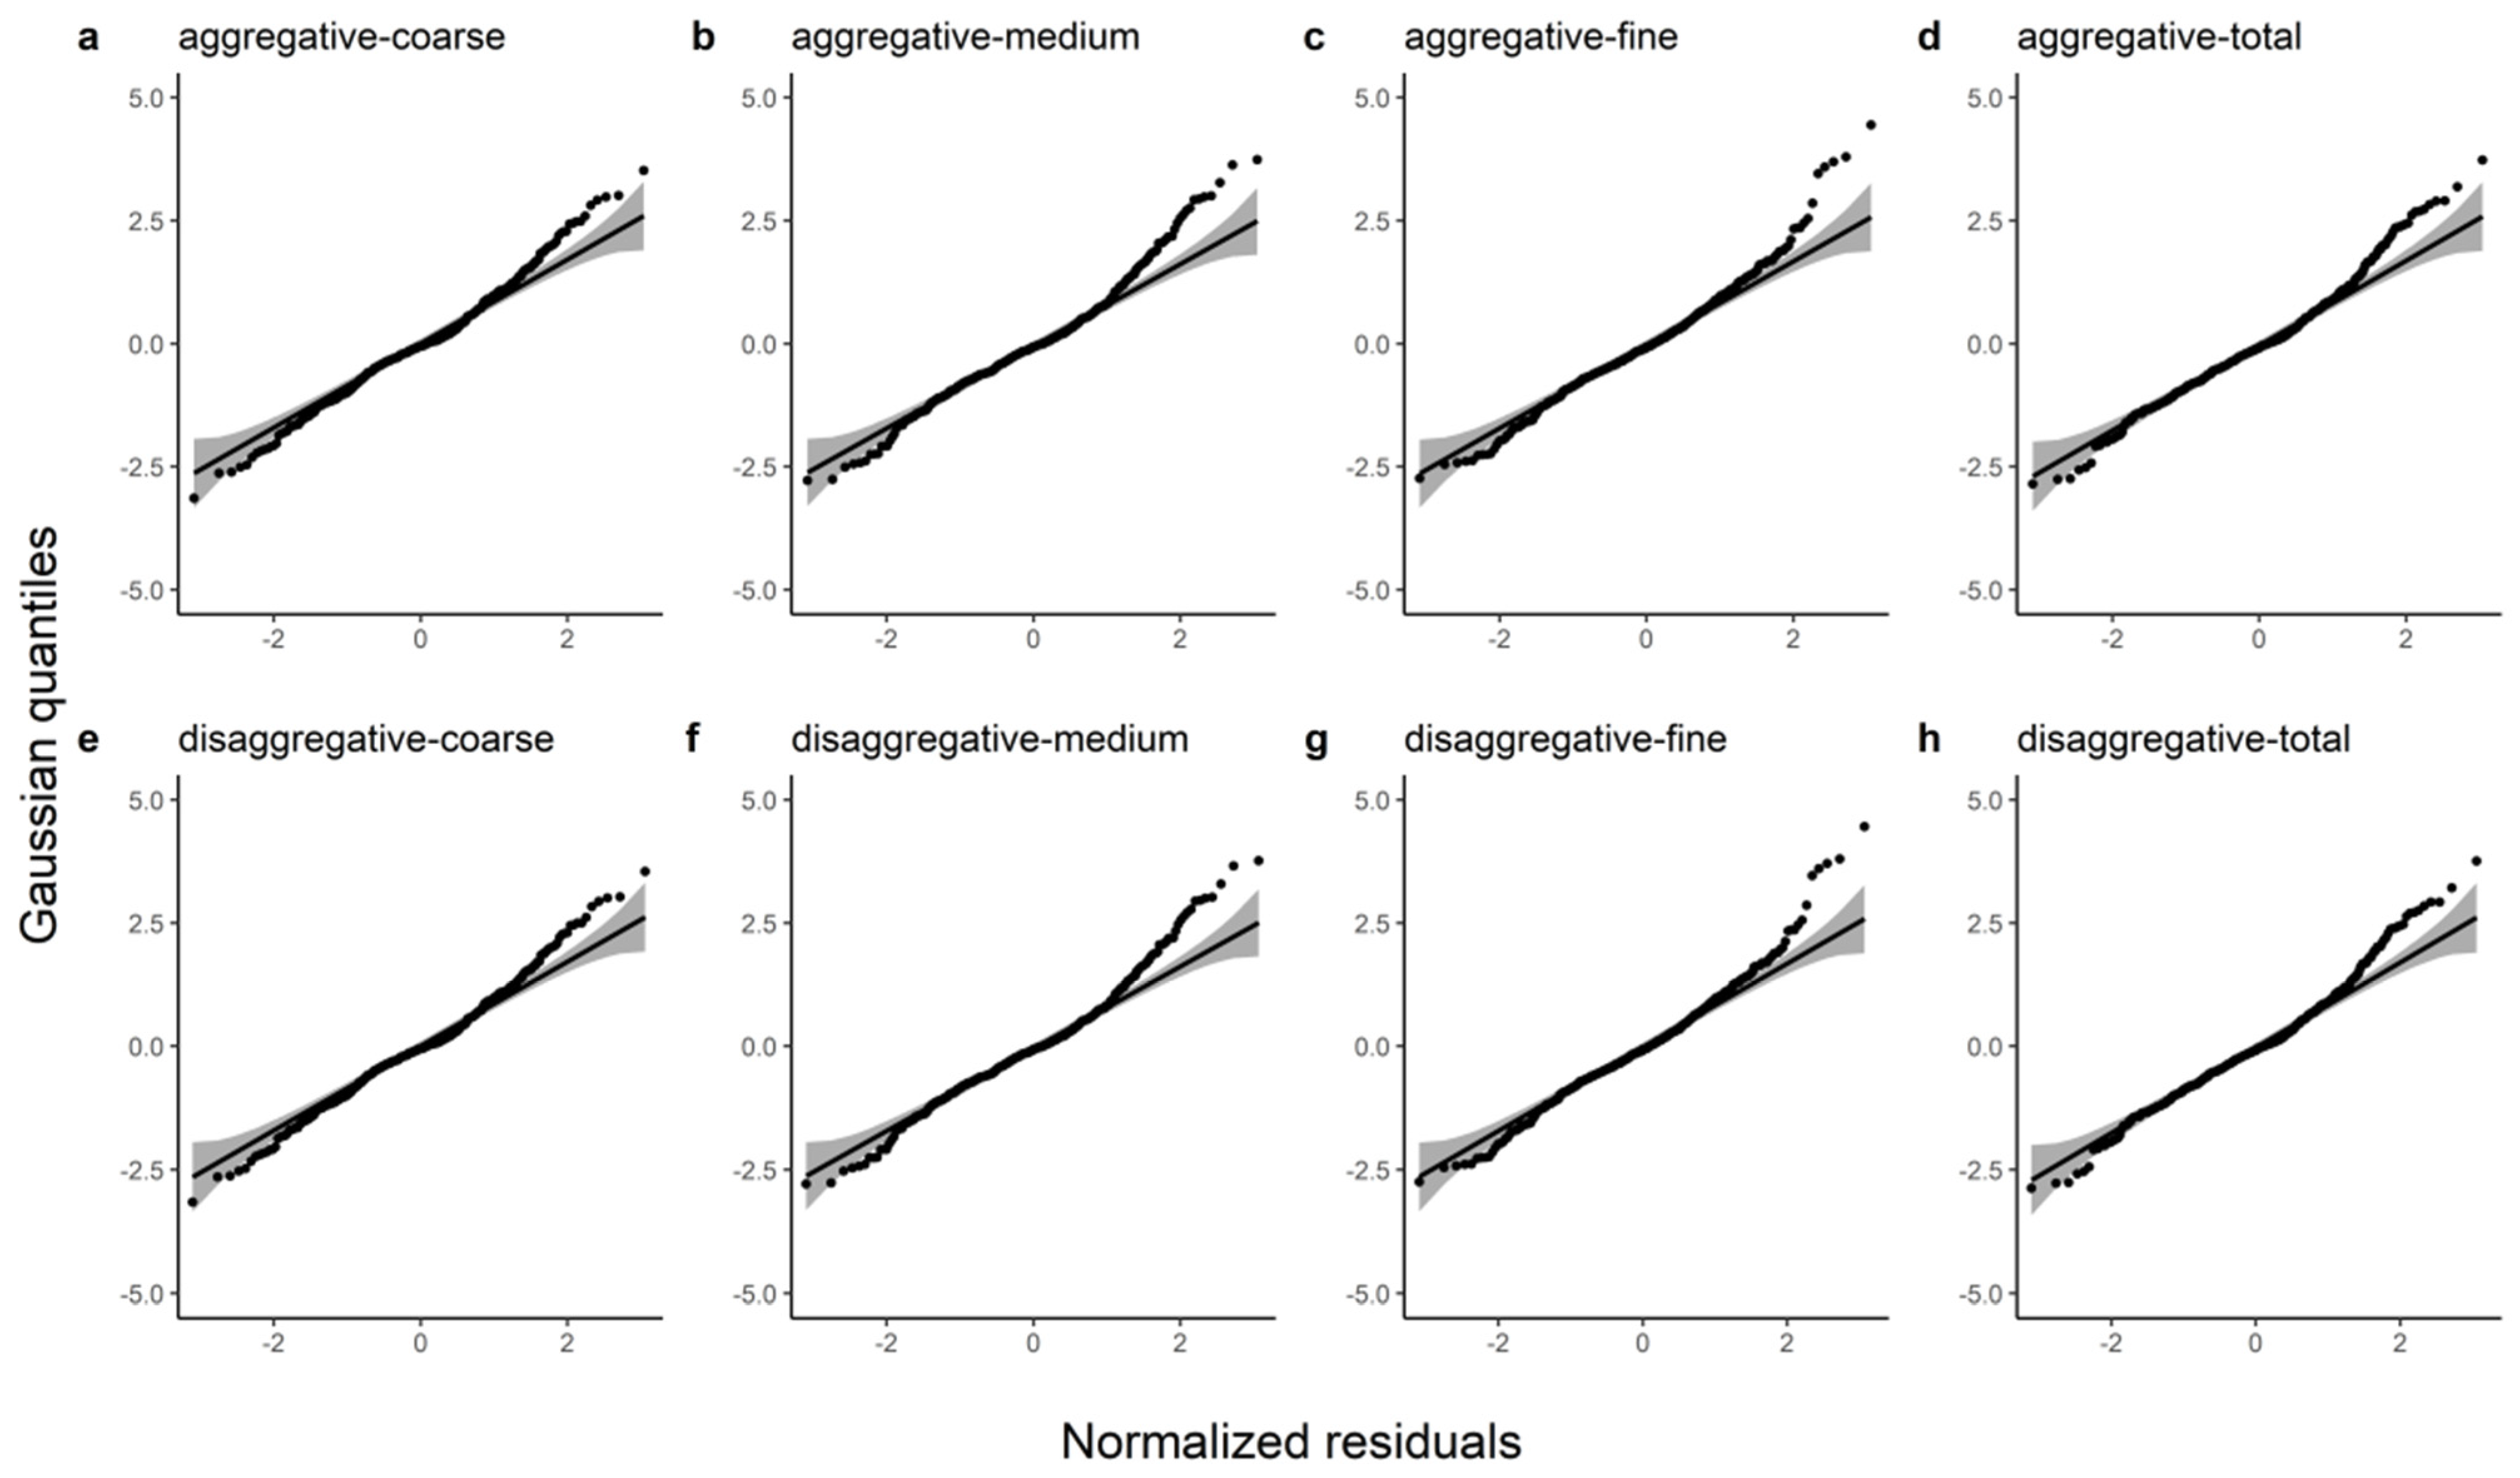
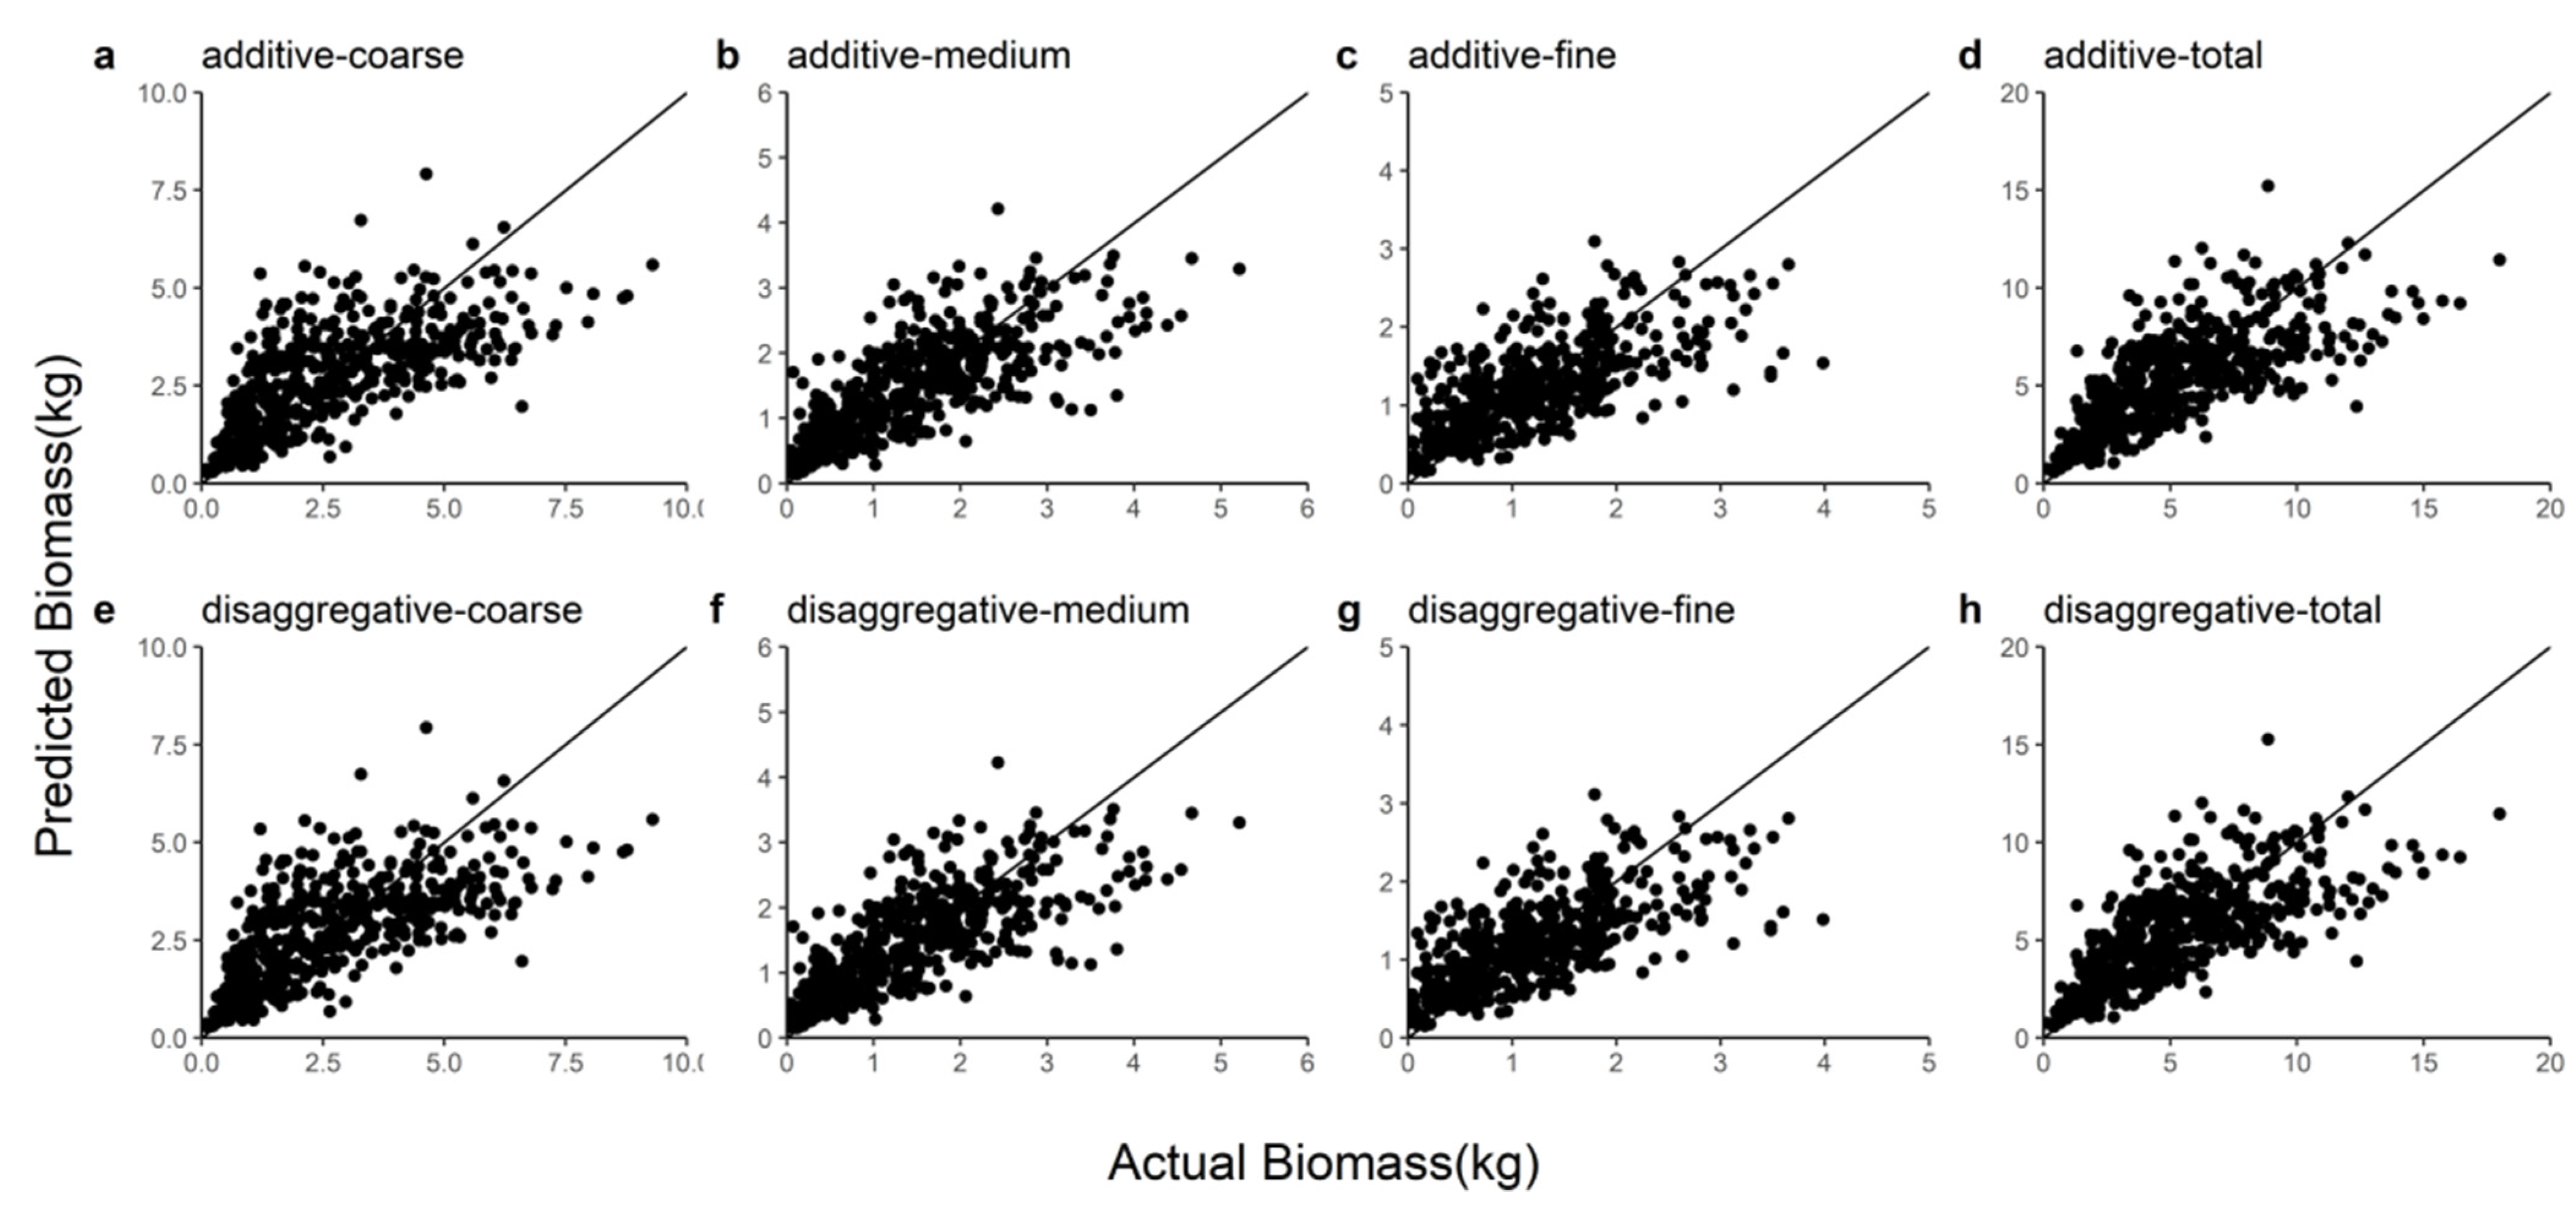
In this study, R2, E, MABE, and RMSE were used as metrics to assess the predictive power of the two model systems and detailed information on these results can be found in Table 7. We observed that the disaggregated model had a relatively larger R2 and smaller E, MABE, and RMSE by comparing these statistics. The ten-fold cross-validation indicated that the additive model slightly underestimated the coarse root (1.75%), medium root (1.04%), fine root (0.90%), and total root (1.36%) biomass and that the disaggregated model also underestimated the coarse root (1.46%), medium root (0.83%), fine root (0.80%), and total root (1.13%) biomass. Figure 2 shows the Gaussian probability plots of the normalized residuals from the additive and disaggregated models. The distributions of the residuals from the total and component root biomass models had light left tails, except for the coarse root biomass in the disaggregated model. However, the normalized residual plots exhibited no pronounced outliers or deviations from the Gaussian densities. Figure 3 demonstrates the accurate prediction of root biomass using the additive and disaggregated models.
Table 7.
Ten-fold cross-validation results for each root biomass component in the biomass equation systems.
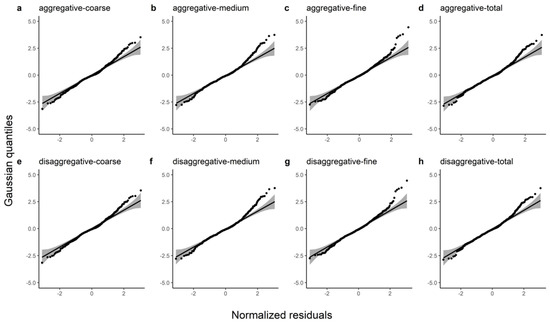
Figure 2.
Gaussian probability plots of the normalized residuals from the additive and disaggregated models for the total root biomass and the component biomasses. (a–d) represent the predicted coarse, medium, fine and total roots from the additive model; (e–h) represent the coarse root, medium root, fine root and total root predicted by the disaggregated model.

Figure 3.
Comparison of coarse root, medium root, fine root, and total root biomass predictions for the additive and disaggregated models. (a–d) represent the predicted coarse, medium, fine and total roots from the additive model; (e–h) represent the coarse root, medium root, fine root and total root predicted by the disaggregated model.
4. Discussion
DBH is widely used in aboveground biomass models for various types of forests and the addition of HT as a predictor variable can improve the predictive performance of the models [34,35]. In order to investigate whether the root systems of trees are also consistent with this phenomenon, we used three common anisotropic growth equations to construct two model systems. Our results suggested that Equation (1) predicted better for fine root biomass, while the estimates for coarse and medium root biomass were deficient. Equation (3) significantly improved the prediction of medium and coarse root biomass after the addition of HT. It is worth noting that although Equation (2) used two predictors (D, H), it did not show satisfactory prediction outcomes and was even worse than Equation (1). This contradicted our previous studies on aboveground biomass models of trees [21,36]. Therefore, the means of estimating the aboveground biomass of trees was not fully applicable with root biomass and we do not recommend the use of the D2H form to predict the root biomass of birch plantations.
Linear and nonlinear regressions with multiplicative and additive error structures are widely used for modeling tree biomass when using power functions as the basic form of the biomass models [37,38]. However, most researchers have tended to use log-transformed or nonlinear forms directly, without any further analysis to determine which is more appropriate for each particular dataset before use, which is not rigorous. We applied the likelihood comparisons that were proposed by Xiao et al. (2011) for the preliminary analysis of our root biomass dataset before modeling and thus, selected the most appropriate model error structure to decide whether the model fit should take a linear or nonlinear form. The results showed that the dataset of the three components of birch root biomass (coarse, medium, and fine roots) tended to have a multiplicative error structure, which demonstrated that log-transformed linear regression fitted our root biomass model better than the nonlinear models. Although additive models for the estimation of root biomass have rarely been developed, our results supported that the birch root biomass dataset was better adapted to log-transformed linear regression, as is the case for most datasets for the anisotropic growth of trees [39,40,41,42].
Most of the developed biomass models predict the aboveground biomass of forest trees and only a limited number estimate the belowground biomass. Considering the differences in physiological characteristics and functions of roots in different diameter classes, we divided the root system into three parts according to diameter class instead of constructing a model of the root system as a whole, as in other research [18,43,44]. A comparison of the R2, E, RMSE, and MABE of the two models revealed that they performed similarly and that both could provide effective assessments of the root biomass of birch plantation forests in northeastern China (Table 7 and Figure 2 and Figure 3). The disaggregated model provided more accurate estimates of the biomasses of the individual components and the total roots (Table 7). However, the predictive accuracy of our model appeared to be weak in comparison. For example, the R2 of the model that was constructed by Usoltsev et al. for the prediction of birch root biomass was 0.819 [45] and the R2 of the coarse root biomass model that was developed by Bijak et al. was as high as 0.94 [46]. This is due in large part to the variety of family lines within our studied birch plantations and we sampled completely randomly, rather than restricting samples to a certain DBH. All of these measures were intended to provide the model with a wider range of applications. In fact, we found that the prediction accuracy of our model was high, according to the results in Section 3.4.
In addition, the mean errors of the predictions for each component of the model in both groups was total root > coarse root > medium root > fine root (Table 7), which was related to the proportion of the biomass of each component. Among the 493 birch plants that were selected for this study, the average proportions of coarse, medium, and fine roots within the total roots were 49%, 28%, and 24%, respectively, (Table 2) and it can be seen that the average error of the model prediction increased with the increasing proportion of each component within the total. This phenomenon could be explained by errors in the destructive sampling of the underground roots. The distribution of tree roots in the soil is intertwined and complex and the sampling of forest roots is often challenging for researchers [47]. Even though we took enough care in digging up the plant roots, we still lost some roots due to the limitations of the sampling method. This could have caused our model to underestimate root biomass, which resulted in the calculation of root to shoot ratios in which our estimates were lower than the true values. Although the destructive sampling of the root systems introduced some errors into our estimations, a small number of samples has often been chosen to establish biomass equations with smaller sampling costs and time requirements. This adversely affects the estimation accuracy as well as the applicability of the model [48]. In contrast, our extensive sampling of the birch plantations at three sites in northeastern China spanned 3.71° longitude and 4.57° latitude with an annual mean temperature difference of 3.34 °C. A total of 493 birch trees from five plantations of various ages and genotypes were used as samples to construct our root biomass models. This enabled our models to have a higher prediction accuracy and a wider range of suitability.
Fine roots are the most active part of the root system of a plant and soil nutrients, structure, and environmental conditions often have a dramatic effect on fine root biomass [49,50,51]. In fact, there are other characteristics beyond DBH and HT that may have a favorable impact on the prediction of tree root biomass. Albaugh et al. showed that fine root mass is greatly correlated with leaf area and they demonstrated a decrease in the fine root biomass allocation of Loblolly Pines under fertilization and irrigation treatments [52]. A study by Zhang et al. (2011) concluded that stand density is an important factor that can affect the root biomass of Pinus massoniana [53]. Stand age is also an important influence on the fine root biomass of birch trees [54], but the age span of the stands was not large enough to be used as an effective predictor in our study. In addition, fine root turnover is rapid and biomass varies over a wide range during the different seasons [55]. This could have led to an underestimation of fine root biomass due to the sampling method. However, our experimental sites are located in northeastern China, which experiences long winters and a growing season that usually runs from May to October. The results of a study by Wang et al. on five forest types in northeastern China indicated that fine root biomass increases gradually from March to October [56], so we considered sampling in the middle of the growing season to be representative. In conclusion, establishing more effective models for the prediction of root biomass requires us to link more factors, such as stand age, climate, and soil conditions. The prediction of fine root biomass is still challenging (there were limitations in the modeling of the fine root biomass that we measured at a fixed time) and the prediction of fine root dynamics is more meaningful.
5. Conclusions
We developed two models for the estimation of the root biomass of birch plantations in northeastern China: the additive and disaggregated models. Between the two models, the results of the likelihood comparisons indicated that the multiplicative error structure was the most appropriate error structure. By comparing the R2, E, MABE, and RMSE of the three allometric equations, it was found that was the most suitable equation for the estimation of the root biomass of birch trees. Both systems took into account the inherent correlation between component biomass and additivity. we also added the site into the additive and disaggregated models as a dummy variable. In conclusion, both models were effective in predicting the root biomass of birch plantations, with the disaggregated model performing relatively well. In addition, the inclusion of factors such as stand density and nurturing intervals, which would have an influence on the allocation of plant root biomass, in subsequent studies of root biomass may further strengthen the predictive capability of these models.
Supplementary Materials
The following supporting information can be downloaded at: https://www.mdpi.com/article/10.3390/f13050661/s1.
Author Contributions
Conceptualization, X.W.; data curation, X.W.; formal analysis, X.W. and L.P.; funding acquisition, X.W.; methodology, X.W.; project administration, X.W.; software, L.P. and X.W.; supervision, X.W.; visualization, X.W.; writing—original draft, X.W. and L.P.; writing—review and editing, X.W. All authors have read and agreed to the published version of the manuscript.
Funding
This research was funded by the National Key R&D Program of China (2021YFD1500705), the National Natural Science Foundation of China (31670476), and the Fundamental Research Funds for the Central Universities (2572019BA15 and 2572020DR02).
Institutional Review Board Statement
Not applicable.
Informed Consent Statement
Not applicable.
Data Availability Statement
Data is contained within the Supplementary Material. The data presented in this study are available in Supplementary Material.
Conflicts of Interest
The authors have no conflicts of interest in regard to this research or its funding.
References
- Yu, D.; Wang, X.; Yin, Y.; Zhan, J.; Lewis, B.J.; Tian, J.; Bao, Y.; Zhou, W.; Zhou, L.; Dai, L. Estimates of Forest Biomass Carbon Storage in Liaoning Province of Northeast China: A Review and Assessment. PLoS ONE 2014, 9, e89572. [Google Scholar] [CrossRef] [PubMed]
- Zhao, D.; Kane, M.; Markewitz, D.; Teskey, R.; Clutter, M. Additive Tree Biomass Equations for Midrotation Loblolly Pine Plantations. For. Sci. 2015, 61, 613–623. [Google Scholar] [CrossRef] [Green Version]
- Dong, L.; Zhang, L.; Li, F. A Three-Step Proportional Weighting System of Nonlinear Biomass Equations. For. Sci. 2015, 61, 35–45. [Google Scholar] [CrossRef]
- Zianis, D.; Mencuccini, M. Aboveground Biomass Relationships for Beech (Fagus Moesiaca Cz.) Trees in Vermio Mountain, Northern Greece, and Generalised Equations for Fagus sp. Ann. For. Sci. 2003, 60, 439–448. [Google Scholar] [CrossRef] [Green Version]
- Quint, T.C.; Dech, J.P. Allometric Models for Predicting the Aboveground Biomass of Canada Yew (Taxus Canadensis Marsh.) from Visual and Digital Cover Estimates. Can. J. For. Res. 2010, 40, 2003–2014. [Google Scholar] [CrossRef]
- Castedo-Dorado, F.; Gómez-García, E.; Diéguez-Aranda, U.; Barrio-Anta, M.; Crecente-Campo, F. Aboveground Stand-Level Biomass Estimation: A Comparison of Two Methods for Major Forest Species in Northwest Spain. Ann. For. Sci. 2012, 69, 735–746. [Google Scholar] [CrossRef]
- Fu, Y.; Lei, Y.C.; Zeng, W.S. Uncertainty Analysis for Regional-Level above-Ground Biomass Estimates Based on Individual Tree Biomass Model. Acta Ecol. Sin. 2015, 35, 7738–7747. [Google Scholar] [CrossRef]
- McCormack, M.L.; Dickie, I.A.; Eissenstat, D.M.; Fahey, T.J.; Fernandez, C.W.; Guo, D.; Helmisaari, H.-S.; Hobbie, E.A.; Iversen, C.M.; Jackson, R.B.; et al. Redefining Fine Roots Improves Understanding of Below-Ground Contributions to Terrestrial Biosphere Processes. New Phytol. 2015, 207, 505–518. [Google Scholar] [CrossRef]
- Fogel, R. Root Turnover and Productivity of Coniferous Forests. Plant Soil 1983, 71, 75–85. [Google Scholar] [CrossRef]
- Brassard, B.W.; Chen, H.Y.H.; Bergeron, Y. Influence of Environmental Variability on Root Dynamics in Northern Forests. Crit. Rev. Plant Sci. 2009, 28, 179–197. [Google Scholar] [CrossRef]
- Zheng, C.; Mason, E.G.; Jia, L.; Wei, S.; Sun, C.; Duan, J. A Single-Tree Additive Biomass Model of Quercus Variabilis Blume Forests in North China. Trees 2015, 29, 705–716. [Google Scholar] [CrossRef] [Green Version]
- Dutcă, I.; Mather, R.; Blujdea, V.N.B.; Ioraș, F.; Olari, M.; Abrudan, I.V. Site-Effects on Biomass Allometric Models for Early Growth Plantations of Norway Spruce (Picea Abies (L.) Karst.). Biomass Bioenergy 2018, 116, 8–17. [Google Scholar] [CrossRef]
- Norby, R.J.; Ledford, J.; Reilly, C.D.; Miller, N.E.; O’Neill, E.G. Fine-Root Production Dominates Response of a Deciduous Forest to Atmospheric CO2 Enrichment. Proc. Natl. Acad. Sci. USA 2004, 101, 9689–9693. [Google Scholar] [CrossRef] [PubMed] [Green Version]
- Li, M.; Gao, X. Community structure and driving factors for rhizosphere ectomycorrhizal fungi of Betula platyphylla in Daqing Mountain. Chin. J. Ecol. 2021, 40, 1244–1252. [Google Scholar]
- Parresol, B.R. Additivity of Nonlinear Biomass Equations. Can. J. For. Res. 2001, 31, 865–878. [Google Scholar] [CrossRef]
- Dong, L.; Li, F.; Jia, W. Compatible Tree Biomass Models for Natural White Birch (Betula platyphylla) in Northeast China Forest Area. Sci. Silvae Sin. 2013, 49, 75–85. [Google Scholar]
- Dong, L.; Zhang, L.; Li, F. Developing Additive Systems of Biomass Equations for Nine Hardwood Species in Northeast China. Trees 2015, 29, 1149–1163. [Google Scholar] [CrossRef]
- Wang, X.; Zhao, D.; Liu, G.; Yang, C.; Teskey, R.O. Additive Tree Biomass Equations for Betula Platyphylla Suk. Plantations in Northeast China. Ann. For. Sci. 2018, 75, 60. [Google Scholar] [CrossRef] [Green Version]
- Tang, S.; Zhang, H.; Shu, H. Study on establish and estimate method of compatible biomass model. Sci. Silvae Sin. 2000, S1, 19–27. [Google Scholar]
- Lima, A.J.N.; Suwa, R.; de Mello Ribeiro, G.H.P.; Kajimoto, T.; dos Santos, J.; da Silva, R.P.; de Souza, C.A.S.; de Barros, P.C.; Noguchi, H.; Ishizuka, M.; et al. Allometric Models for Estimating Above- and below-Ground Biomass in Amazonian Forests at São Gabriel Da Cachoeira in the Upper Rio Negro, Brazil. For. Ecol. Manag. 2012, 277, 163–172. [Google Scholar] [CrossRef]
- Monika, V.; Daniel, Z.; Tomáš, Č.; Vít, Š. Models for Predicting Aboveground Biomass of European Beech (Fagus Sylvatica L.) in the Czech Republic. J. For. Sci. 2016, 61, 45–54. [Google Scholar] [CrossRef] [Green Version]
- Meng, S.; Jia, Q.; Liu, Q.; Zhou, G.; Wang, H.; Yu, J. Aboveground Biomass Allocation and Additive Allometric Models for Natural Larix Gmelinii in the Western Daxing’anling Mountains, Northeastern China. Forests 2019, 10, 150. [Google Scholar] [CrossRef] [Green Version]
- Zhao, H.; Li, Z.; Zhou, G.; Qiu, Z.; Wu, Z. Site-Specific Allometric Models for Prediction of Above-and Belowground Biomass of Subtropical Forests in Guangzhou, Southern China. Forests 2019, 10, 862. [Google Scholar] [CrossRef] [Green Version]
- Zhao, H.; Li, Z.; Zhou, G.; Qiu, Z.; Wu, Z. Aboveground Biomass Allometric Models for Evergreen Broad-Leaved Forest Damaged by a Serious Ice Storm in Southern China. Forests 2020, 11, 320. [Google Scholar] [CrossRef] [Green Version]
- Wang, J.; Zhang, C.; Fan, X.; Zhao, Y. Biomass Allocation Patterns and Allometric Models of Abies Nephrolepis Maxim. Shengtai Xuebao Acta Ecol. Sin. 2011, 31, 3918–3927. [Google Scholar]
- Chen, D.; Sun, X.; Jin, Y.; Zhang, Y.; Zhang, S. Effects of Stand Age and Competition on Allometric Relationships for Biomass Partitioning in Larixkaempferi Plantation. Acta Ecol. Sin. 2019, 40, 843–853. [Google Scholar]
- Finér, L.; Ohashi, M.; Noguchi, K.; Hirano, Y. Factors Causing Variation in Fine Root Biomass in Forest Ecosystems. For. Ecol. Manag. 2011, 261, 265–277. [Google Scholar] [CrossRef]
- Akburak, S.; Oral, H.V.; Ozdemir, E.; Makineci, E. Temporal Variations of Biomass, Carbon and Nitrogen of Roots under Different Tree Species. Scand. J. For. Res. 2013, 28, 8–16. [Google Scholar] [CrossRef]
- Zhu, H.Y.; Weng, Y.H.; Zhang, H.G.; Meng, F.R.; Major, J.E. Comparing Fast- and Slow-Growing Provenances of Picea Koraiensis in Biomass, Carbon Parameters and Their Relationships with Growth. For. Ecol. Manag. 2013, 307, 178–185. [Google Scholar] [CrossRef]
- Rutishauser, E.; Noor’an, F.; Laumonier, Y.; Halperin, J.; Rufi’ie; Hergoualc’h, K.; Verchot, L. Generic Allometric Models Including Height Best Estimate Forest Biomass and Carbon Stocks in Indonesia. For. Ecol. Manag. 2013, 307, 219–225. [Google Scholar] [CrossRef]
- Xiao, X.; White, E.P.; Hooten, M.B.; Durham, S.L. On the Use of Log-Transformation vs. Nonlinear Regression for Analyzing Biological Power Laws. Ecology 2011, 92, 1887–1894. [Google Scholar] [CrossRef] [PubMed] [Green Version]
- Affleck, D.L.R.; Diéguez-Aranda, U. Additive Nonlinear Biomass Equations: A Likelihood-Based Approach. For. Sci. 2016, 62, 129–140. [Google Scholar] [CrossRef]
- Bengio, Y.; Grandvalet, Y. No Unbiased Estimator of the Variance of K-Fold Cross-Validation. J. Mach. Learn. Res. 2004, 5, 1089–1105. [Google Scholar]
- Dutcă, I. The Variation Driven by Differences between Species and between Sites in Allometric Biomass Models. Forests 2019, 10, 976. [Google Scholar] [CrossRef] [Green Version]
- Mahmood, H.; Hosen, M.F.; Siddiqui, M.R.H.; Abdullah, S.M.R.; Islam, S.M.Z.; Matieu, H.; Iqbal, M.Z.; Akhter, M. Allometric Biomass Model for Aquilaria Malaccensis Lam. in Bangladesh: A Nondestructive Approach. J. Sustain. For. 2021, 40, 594–606. [Google Scholar] [CrossRef]
- Rizvi, R.H.; Khare, D.; Dhillon, R.S. Statistical Models for Aboveground Biomass of Populus Deltoides Planted in Agroforestry in Haryana. Trop. Ecol. 2008, 49, 35–42. [Google Scholar]
- Dong, L.-H.; Li, F.-R.; Song, Y.-W. Error Structure and Additivity of Individual Tree Biomass Model for Four Natural Conifer Species in Northeast China. Chin. J. Appl. Ecol. 2015, 26, 704–714. [Google Scholar]
- Cao, L.; Li, H. Analysis of Error Structure for Additive Biomass Equations on the Use of Multivariate Likelihood Function. Forests 2019, 10, 298. [Google Scholar] [CrossRef] [Green Version]
- Dong, L.; Li, F. Additive Stand-Level Biomass Models for Natural Larch Forest in the East of Daxing’an Mountains. Linye Kexue Sci. Silvae Sin. 2016, 52, 13–21. [Google Scholar] [CrossRef]
- Dong, L.; Zhang, L.; Li, F. Allometry and Partitioning of Individual Tree Biomass and Carbon of Abies Nephrolepis Maxim in Northeast China. Scand. J. For. Res. 2016, 31, 399–411. [Google Scholar] [CrossRef]
- Atkinson, C.L.; Parr, T.B.; van Ee, B.C.; Knapp, D.D.; Winebarger, M.; Madoni, K.J.; Haag, W.R. Length-Mass Equations for Freshwater Unionid Mussel Assemblages: Implications for Estimating Ecosystem Function. Freshw. Sci. 2020, 39, 377–390. [Google Scholar] [CrossRef]
- Xie, L.; Fu, L.; Widagdo, F.R.A.; Dong, L.; Li, F. Improving the Accuracy of Tree Biomass Estimations for Three Coniferous Tree Species in Northeast China. Trees 2021, 36, 451–469. [Google Scholar] [CrossRef]
- Cui, Y.; Bi, H.; Liu, S.; Hou, G.; Wang, N.; Ma, X.; Zhao, D.; Wang, S.; Yun, H. Developing Additive Systems of Biomass Equations for Robinia Pseudoacacia L. in the Region of Loess Plateau of Western Shanxi Province, China. Forests 2020, 11, 1332. [Google Scholar] [CrossRef]
- Meng, S.; Yang, F.; Hu, S.; Wang, H.; Wang, H. Generic Additive Allometric Models and Biomass Allocation for Two Natural Oak Species in Northeastern China. Forests 2021, 12, 715. [Google Scholar] [CrossRef]
- Usoltsev, V.A.; Shobairi, S.O.R.; Chasovskikh, V.P. Additive Allometric Models of Single-Tree Biomass of Sp. as a Basis of Regional Taxation Standards for Eurasia. Civ. Environ. Eng. 2018, 14, 105–115. [Google Scholar] [CrossRef] [Green Version]
- Bijak, S.; Zasada, M.; Agnieszka, B.; Bronisz, K.; Czajkowski, M.; Ludwisiak, Ł.; Tomusiak, R.; Wojtan, R. Estimating Coarse Roots Biomass in Young Silver Birch Stands on Post-Agricultural Lands in Central Poland. Silva Fenn. 2013, 47, 963. [Google Scholar] [CrossRef]
- Kapeluck, P.R.; Lear, D.H.V. A Technique for Estimating Below-Stump Biomass of Mature Loblolly Pine Plantations. Can. J. For. Res. 1995, 25, 355–360. [Google Scholar] [CrossRef]
- Gower, S.T.; Kucharik, C.J.; Norman, J.M. Direct and Indirect Estimation of Leaf Area Index, FAPAR, and Net Primary Production of Terrestrial Ecosystems. Remote Sens. Environ. 1999, 70, 29–51. [Google Scholar] [CrossRef]
- Xiao, C.W.; Sang, W.G.; Wang, R.-Z. Fine Root Dynamics and Turnover Rate in an Asia White Birch Forest of Donglingshan Mountain, China. For. Ecol. Manag. 2008, 255, 765–773. [Google Scholar] [CrossRef]
- Leuschner, C.; Hertel, D.; Schmid, I.; Koch, O.; Muhs, A.; Hölscher, D. Stand Fine Root Biomass and Fine Root Morphology in Old-Growth Beech Forests as a Function of Precipitation and Soil Fertility. Plant Soil 2004, 258, 43–56. [Google Scholar] [CrossRef]
- Burke, M.K.; Raynal, D.J. Fine Root Growth Phenology, Production, and Turnover in a Northern Hardwood Forest Ecosystem. Plant Soil 1994, 162, 135–146. [Google Scholar] [CrossRef] [Green Version]
- Albaugh, T.J. Leaf Area and Above- and Belowground Growth Responses of Loblolly Pine to Nutrient and Water Additions. For. Sci. 1996, 44, 317–328. [Google Scholar]
- Zhang, Y.; Wen, Z. Root Biomass of Pinus massoniana Plantations under Different Planting Densities. Sci. Silvae Sin. 2011, 47, 75–81. [Google Scholar]
- Varik, M.; Aosaar, J.; Ostonen, I.; Lõhmus, K.; Uri, V. Carbon and Nitrogen Accumulation in Belowground Tree Biomass in a Chronosequence of Silver Birch Stands. For. Ecol. Manag. 2013, 302, 62–70. [Google Scholar] [CrossRef]
- Yang, L.; Wu, S.; Zhang, L. Fine Root Biomass Dynamics and Carbon Storage along a Successional Gradient in Changbai Mountains, China. Forestry 2010, 83, 379–387. [Google Scholar] [CrossRef]
- Wang, N.; Wang, C.; Quan, X. Variations in fine root dynamics and turnover rates in five forest types in northeastern China. J. For. Res. 2019, 31, 871–884. [Google Scholar] [CrossRef]

Publisher’s Note: MDPI stays neutral with regard to jurisdictional claims in published maps and institutional affiliations. |
© 2022 by the authors. Licensee MDPI, Basel, Switzerland. This article is an open access article distributed under the terms and conditions of the Creative Commons Attribution (CC BY) license (https://creativecommons.org/licenses/by/4.0/).