Article

Genetic Diversity and Structure of Quercus hondae, a Rare Evergreen Oak Species in Southwestern Japan

1
Graduate School of Agriculture, Ehime University, Matsuyama 790-8566, Japan
2
United Graduate School of Agriculture, Ehime University, Matsuyama 790-8566, Japan
3
Japan International Research Center for Agricultural Sciences, Tsukuba 305-8686, Japan
4
Tano Forest Research Station, Faculty of Agriculture, University of Miyazaki, Miyazaki 889-1702, Japan
5
Faculty of Agriculture and Marine Science, Kochi University, Kochi City 783-8502, Japan
*
Author to whom correspondence should be addressed.
Forests 2022, 13(4), 579; https://doi.org/10.3390/f13040579
Submission received: 28 February 2022 / Revised: 3 April 2022 / Accepted: 4 April 2022 / Published: 7 April 2022
(This article belongs to the Section Genetics and Molecular Biology)

Abstract

:
Conservation of rare species is essential for maintaining ecosystem function. Quercus hondae is a rare evergreen oak species (Cyclobalanopsis) endemic to Japan. This species is found in several locations in Southwestern Japan; small populations remain in the tutelary forests of the Japanese shrine. To evaluate the genetic diversity and phylogeographic structure of this rare species, 11 microsatellite loci and chloroplast DNA sequences are analyzed for 12 populations of Q. hondae and 8 populations of the more widespread congeneric species, Q. glauca. It is found that heterozygosity at both the population and species level is substantially lower in Q. hondae than in Q. glauca. Genetic differentiation among populations of Q. hondae was high, in contrast to Q. glauca, in which populations exhibit largely insignificant differentiation. STRUCTURE analysis shows that at K = 7, the clusters largely corresponded to major predefined populations. This study suggests that there is little gene flow among extant Q. hondae populations and that Q. hondae is genetically differentiated due to the greater effect of genetic drift in small populations. This pattern is in sharp contrast to that of a more common congeneric species, which will be an important consideration in the conservation of Q. hondae.

1. Introduction

Forests provide critical habitats for a large proportion of species on Earth; thus, conservation of rare species is essential for maintaining the species diversity of forests. However, due to small population sizes, the genetic diversity of rare species may differ from that of common species; this should be considered in conservation efforts. Genetic diversity is influenced by historical demography and the level of gene flow. Several reviews examined correlations of genetic diversity with a geographic range (rare vs. widespread) for plant species [1]. These studies have indicated that rare species generally have lower genetic diversity, at both the population and species level, compared to widespread species. This tendency is consistent with a theory predicting that small population sizes experience strong genetic drift and that a geographically sparse distribution restricts gene flow between populations. Inbreeding and biparental inbreeding may also be increased in small populations, thus reducing genetic diversity. Consequently, maintaining genetic diversity is particularly important for rare species with a high risk of extinction.
Although the correlation between genetic diversity and geographic distribution is generally accepted, comparison of rare species and more widespread congeners can be used to examine relationships between geographical range and genetic diversity [2,3]. Comparison of rare and widespread congeners has indicated that genetic diversity within populations is significantly lower in rare species, although the levels of diversity are highly heterogeneous among genera [3]. A comparative study of three Rhododendron species with contrasting geographic distributions indicated that the level of genetic diversity was not lower in the rare species, R. amagianum, compared with the common species, R. weyrichii, suggesting that the level of genetic diversity and structure were not related to the degree of rarity, but rather to the distribution pattern [4]. These data demonstrate the advantage of studying genetic variation in rare and widespread congeners to determine whether rarity is associated with lower genetic diversity.
Oak (Quercus) is successful in temperate and tropical forests; there are over 400 species throughout the Northern Hemisphere, including many rare ones. However, 41% of oak species are currently threatened by rapid climate change and anthropogenic disturbances [5]. Oak is a famous example of a syngameon; some closely related species can exchange genes while maintaining morphologically distinct groups in sympatry [6]. The syngameon hypothesis suggests that the influx of genes from other species contributes to the survival of the species by providing drought tolerance in response to climate change, for example [7,8]. Therefore, the conservation of diverse tree species, including rare species, is essential to maintain a robust gene pool and evolutionary potential for the oak syngameon.
In this study, genetic diversity and genetic structure in populations of Q. hondae, a rare evergreen oak species endemic to Japan, were investigated based on chloroplast DNA sequences and multilocus microsatellite data. To characterize the patterns seen in rare species, sympatric populations of Q. glauca were also analyzed using the same DNA markers. These species are members of the subgenus Cyclobalanopsis, consisting of evergreen species of the genus Quercus that dominate in evergreen broadleaved forests in East Asia. Eight Cyclobalanopsis species, which are evolutionarily closely related, are found in Japan [9]. These species share the same breeding system (wind-pollinated) and seed dispersal mechanism (gravity), while vertical distribution and ecology differ slightly [10]. Quercus hondae is among the rarest of these species and is endemic to Southwestern Japan. A limited number of populations of Q. hondae remain in Southern Kyushu and Southern Shikoku, and the populations often exist in the tutelary forests of Japanese shrine, most of which are small and isolated. By contrast, Q. glauca, as the most common species, is broadly distributed in Eastern and South Asia, including Eastern and Western Japan. In Japan, this species dominates in both semi-natural and secondary forests [10]. Previous studies have shown that populations of evergreen Quercus species in Southwestern Japan retain a considerable level of genetic variation with weak genetic structure, suggesting that the populations have persisted during the last glacial maximum (LGM) [11,12]. Although studies of rare species are important to avoid further loss of biodiversity, the genetic diversity and structure of Q. hondae have not yet been examined.
The objectives of this study were to compare the levels of genetic diversity within and between populations of Q. hondae and Q. glauca, identify Q. hondae populations of high genetic diversity, and determine the number of genetically distinct clusters of Q. hondae. The results of this study can be used to guide the conservation of rare species.

2. Materials and Methods

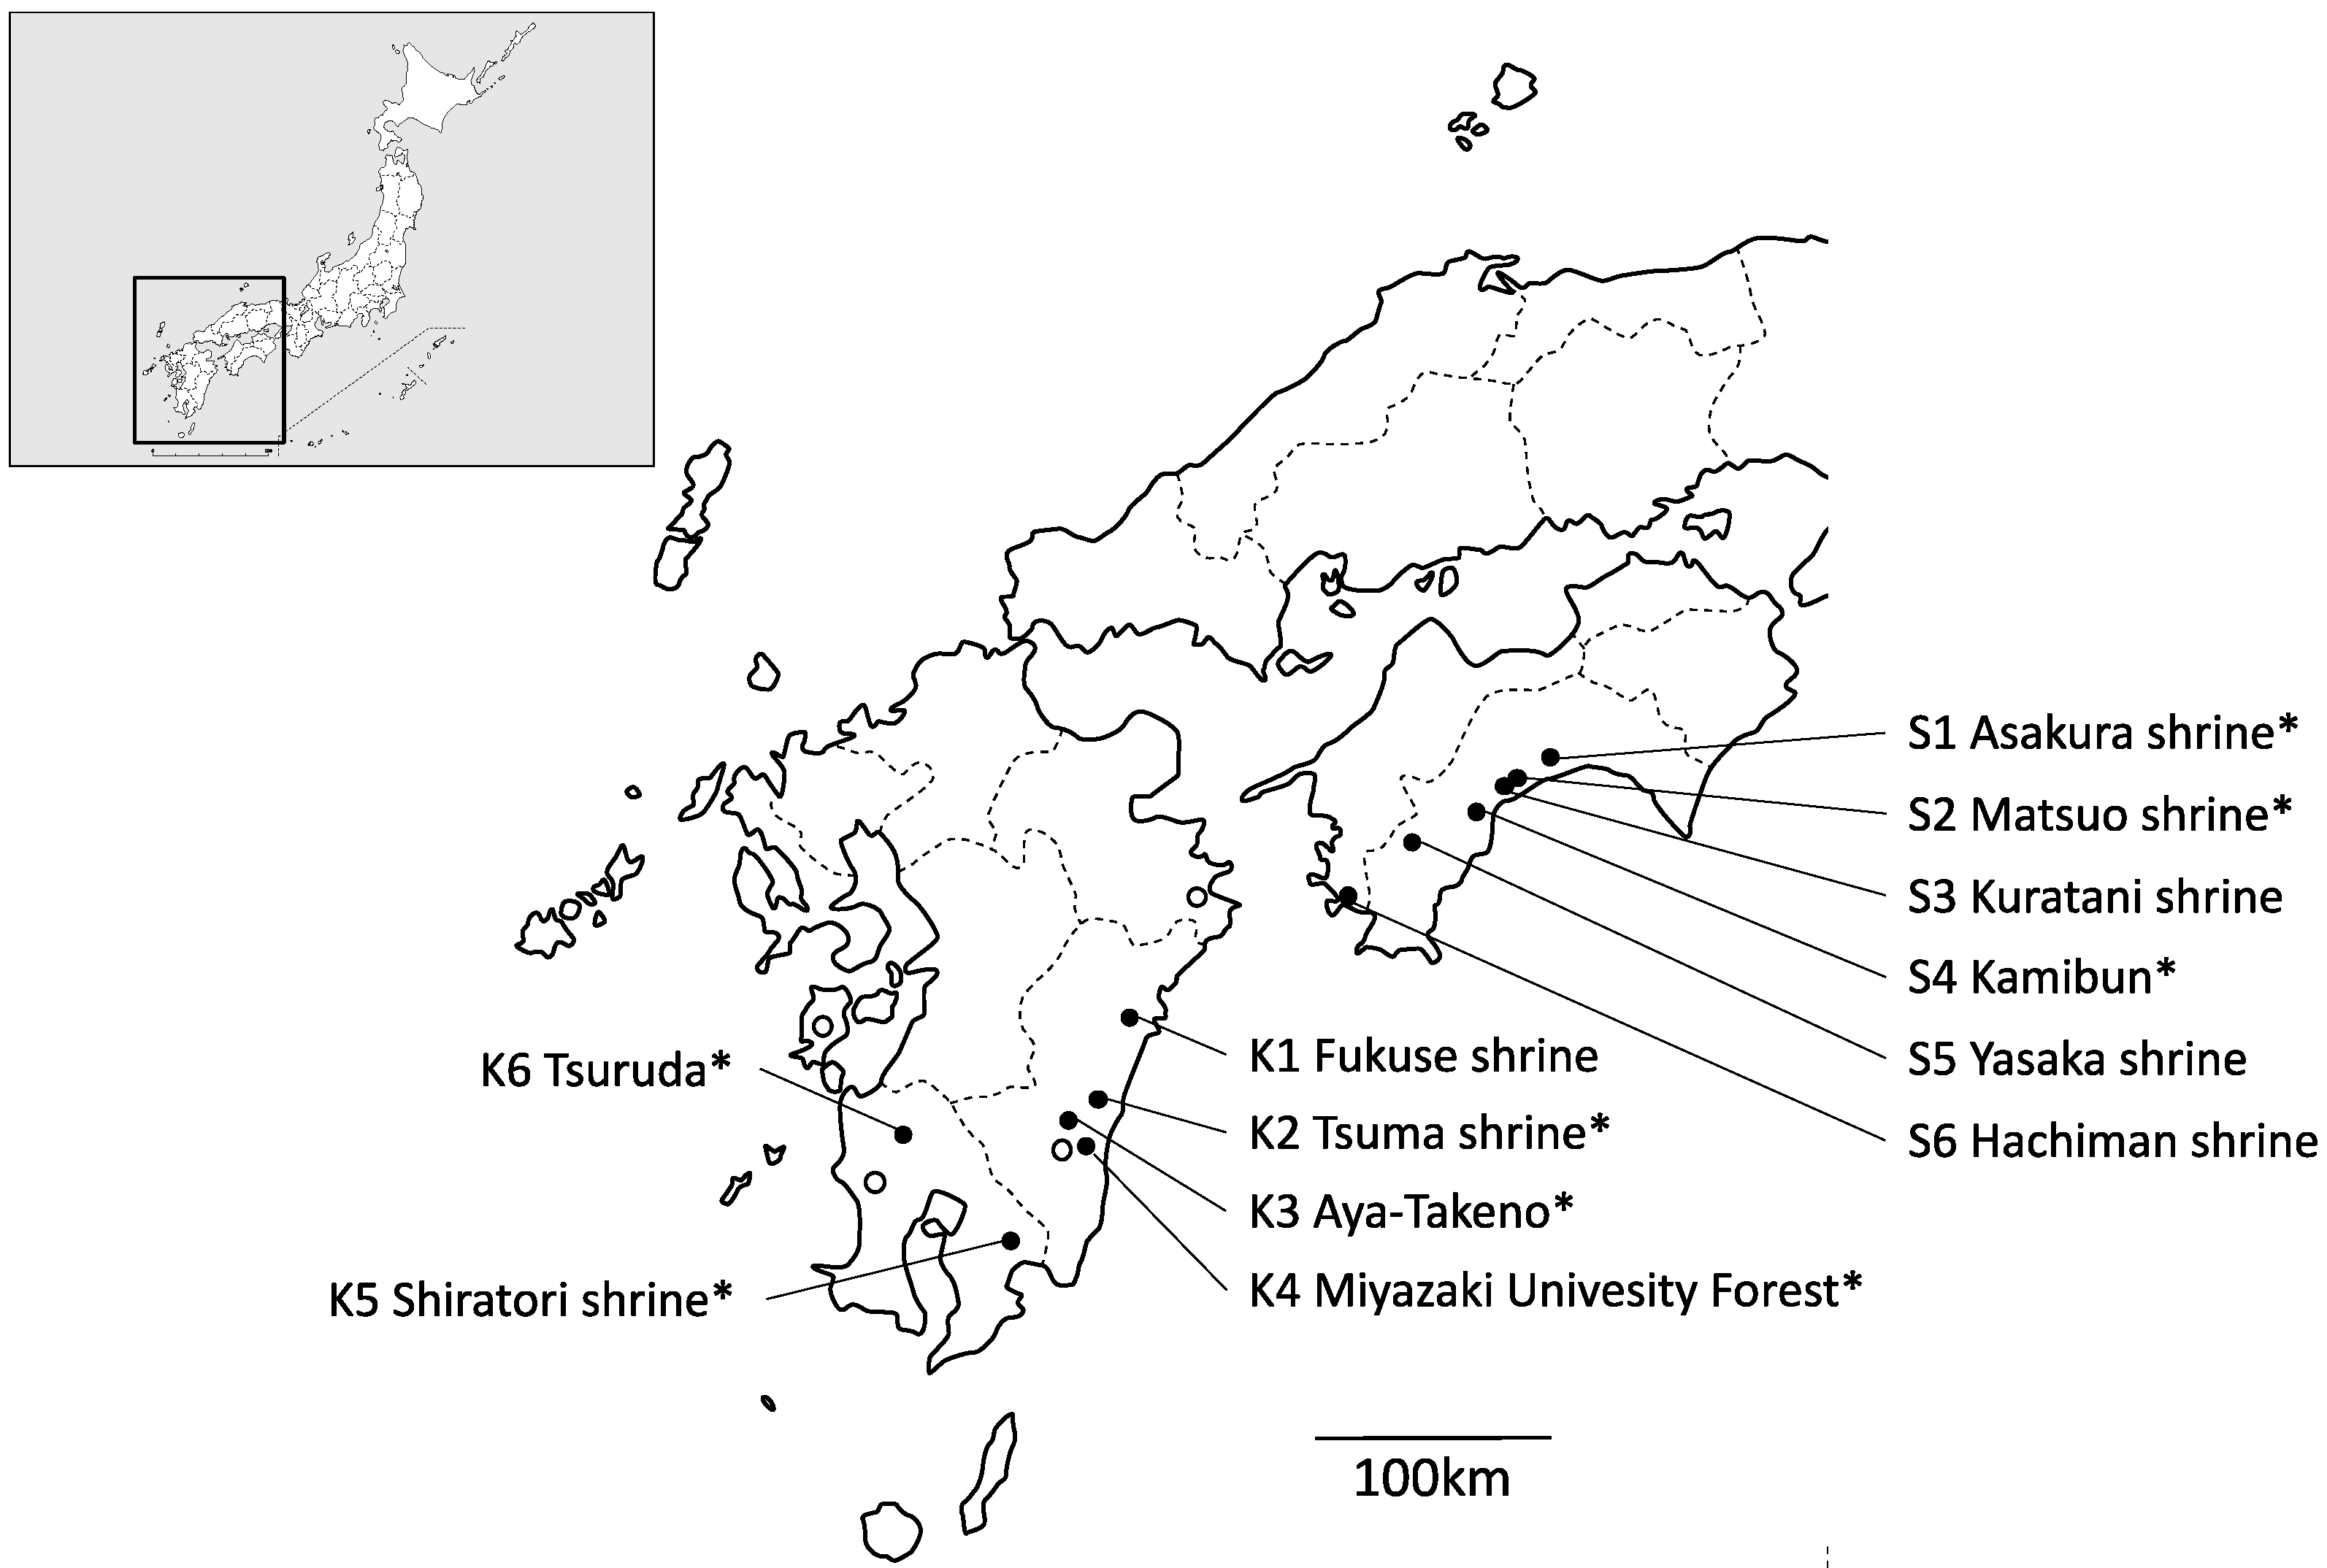
2.1. Collecting Population Samples and DNA Extraction

A total of 202 individual samples were collected from 12 localities of Q. hondae. These populations cover almost the entire distribution range of this species (Figure 1). Note that samples were only collected from two trees in each of the Asakura and Hachiman shrines because no more than two trees were present in each population. Therefore, they are not considered as a population. Quercus glauca grew in 8 of the 12 locations, and a total of 82 individual samples of this species were also collected. Information on the location and number of samples is summarized in Table 1. Genomic DNA was extracted from ~100 mg of silica gel-dried leaves using the modified cetyltrimethylammonium ammonium bromide (CTAB) method [13]. DNA was dissolved into Tris-EDTA buffer (10 mM Tris-HCl [pH 8.0], 1 mM EDTA [pH 8.0]) and stored at −20 °C until being used as a template for PCR.

2.2. Chloroplast DNA Sequencing and Data Analysis

Two chloroplast intergenic spacers (trnH-psbA and trnQ-trnS) were amplified by PCR for DNA sequencing. Primers developed by [14,15] for trnH-psbA and by [16] for trnQ-trnS were used. The PCR reaction (25 µL total volume) contained 0.5 U of KOD Plus (TOYOBO, Osaka, Japan), 10× KOD Plus buffer, 25 mM MgSO4, 2 mM of each dNTP, 0.5 µM of each forward and reverse primer, and approximately 10 ng of genomic DNA. The PCR was performed with initial denaturation for 5 min at 95 °C, followed by 28 cycles of denaturation for 1 min at 95 °C, annealing for 1 min at 52 °C, extension for 1 min at 72 °C, and a final extension for 10 min at 72 °C. The PCR products were directly sequenced after purification using ExoSAP-IT (Thermo Fisher Scientific, Waltham, MA, USA) by Macrogen Japan Corp. (Tokyo, Japan).
Sequence chromatograms for sense and antisense strands were verified using the sequence assembly software ATGC (Genetyx, Tokyo, Japan). Multiple alignment of the DNA sequences and manual modifications were performed using SeaView v5.0.4 [17]. The haplotype network was constructed based on the combined sequences of two regions using TCS v1.21 software [18]. DNA sequences of each haplotype were deposited in the DNA Data Bank of Japan (DDBJ; accession numbers LC682510–LC682529).

2.3. Microsatellite Genotyping and Data Analysis

Multiplex PCR was conducted on 12 microsatellite markers (CG75, CG105, CG139, CG258, and CG371 [19], and MSQa1, MSQa2, MSQa4, MSQa10, MSQa11, and MSQa13 [20]) using the Type-it Microsatellite PCR Kit (Qiagen, Venlo, The Netherlands) according to the manufacturer’s instructions. Forward primers were labeled with 6-FAM, VIC, NED, or PET (Life Technologies, Carlsbad, CA, USA). Genotyping was performed using an ABI 310 Genetic Analyzer (Applied Biosystems, Foster City, CA, USA). The sizes of the PCR fragments were determined by the GeneScan 500 LIZ Size Standard (Thermo Fisher Scientific, Waltham, MA, USA) and analyzed using GeneMapper software v3.0 (Applied Biosystems, Foster City, CA, USA).
Basic statistics for genetic diversity, including the number of alleles (Na), effective number of alleles (Ne), observed heterozygosity (Ho), heterozygosity within populations (Hs), total heterozygosity (Ht), and inbreeding coefficient (Gis), were estimated using GenoDive v3.0 [21] and GenAlEx 6.5 [22]. The inbreeding coefficient (Fis) was calculated for each population using FSTAT v2.9.4. [23]. INEST 2.2 [24] was also used to estimate Fis corrected for null alleles based on a Bayesian approach [individual inbreeding model (IIM)] with 50,000 burn-in and 500,000 Markov chain Monte Carlo (MCMC) iterations. When populations have experienced a recent population reduction, the expected heterozygosity under Hardy–Weinberg equilibrium (HE) becomes larger than that expected at mutation-drift equilibrium (HEQ) [25,26]. The Wilcoxon signed-rank test was used to test for heterozygosity excess (HE > HEQ) under the infinite allele model (IAM), strict stepwise mutation model (SMM), and two-phase model (TPM) using BOTTLENECK v1.2.02 [27].
Neighbor-joining trees [28], of individuals based on shared allele distance (DAS) and populations based on net divergence between populations (DA) [29], were generated using Population 1.2.30 beta [30]. Genetic differentiation among populations (FST) [31] was estimated, and statistical significance was tested after standard Bonferroni corrections using FSTAT v2.9.4. [23]. The positive relationship between pairwise genetic distances, FST/(1–FST), and geographic distances was assessed by a Mantel test with 999 permutations, as implemented in GenAIEx. The individual-based clustering analysis for Bayesian inference of population structure was performed using STRUCTURE v2.3.4 [32]. For each K (number of clusters), 10 independent runs with 100,000 burn-in periods and 100,000 MCMC iterations were conducted with the LOCPRIOR model under the admixture model and assuming correlated allele frequencies (F-model) [33,34]. The range of K was 1–12 for Q. hondae and 1–8 for Q. glauca. The best K was inferred from the value of ΔK and mean value of the log probability of data [LnP(D)] for each K calculated by STRUCTURE Harvester [35] for each species. The outputs of the 10 runs for each K were averaged by CLUMPAK [36].

3. Results

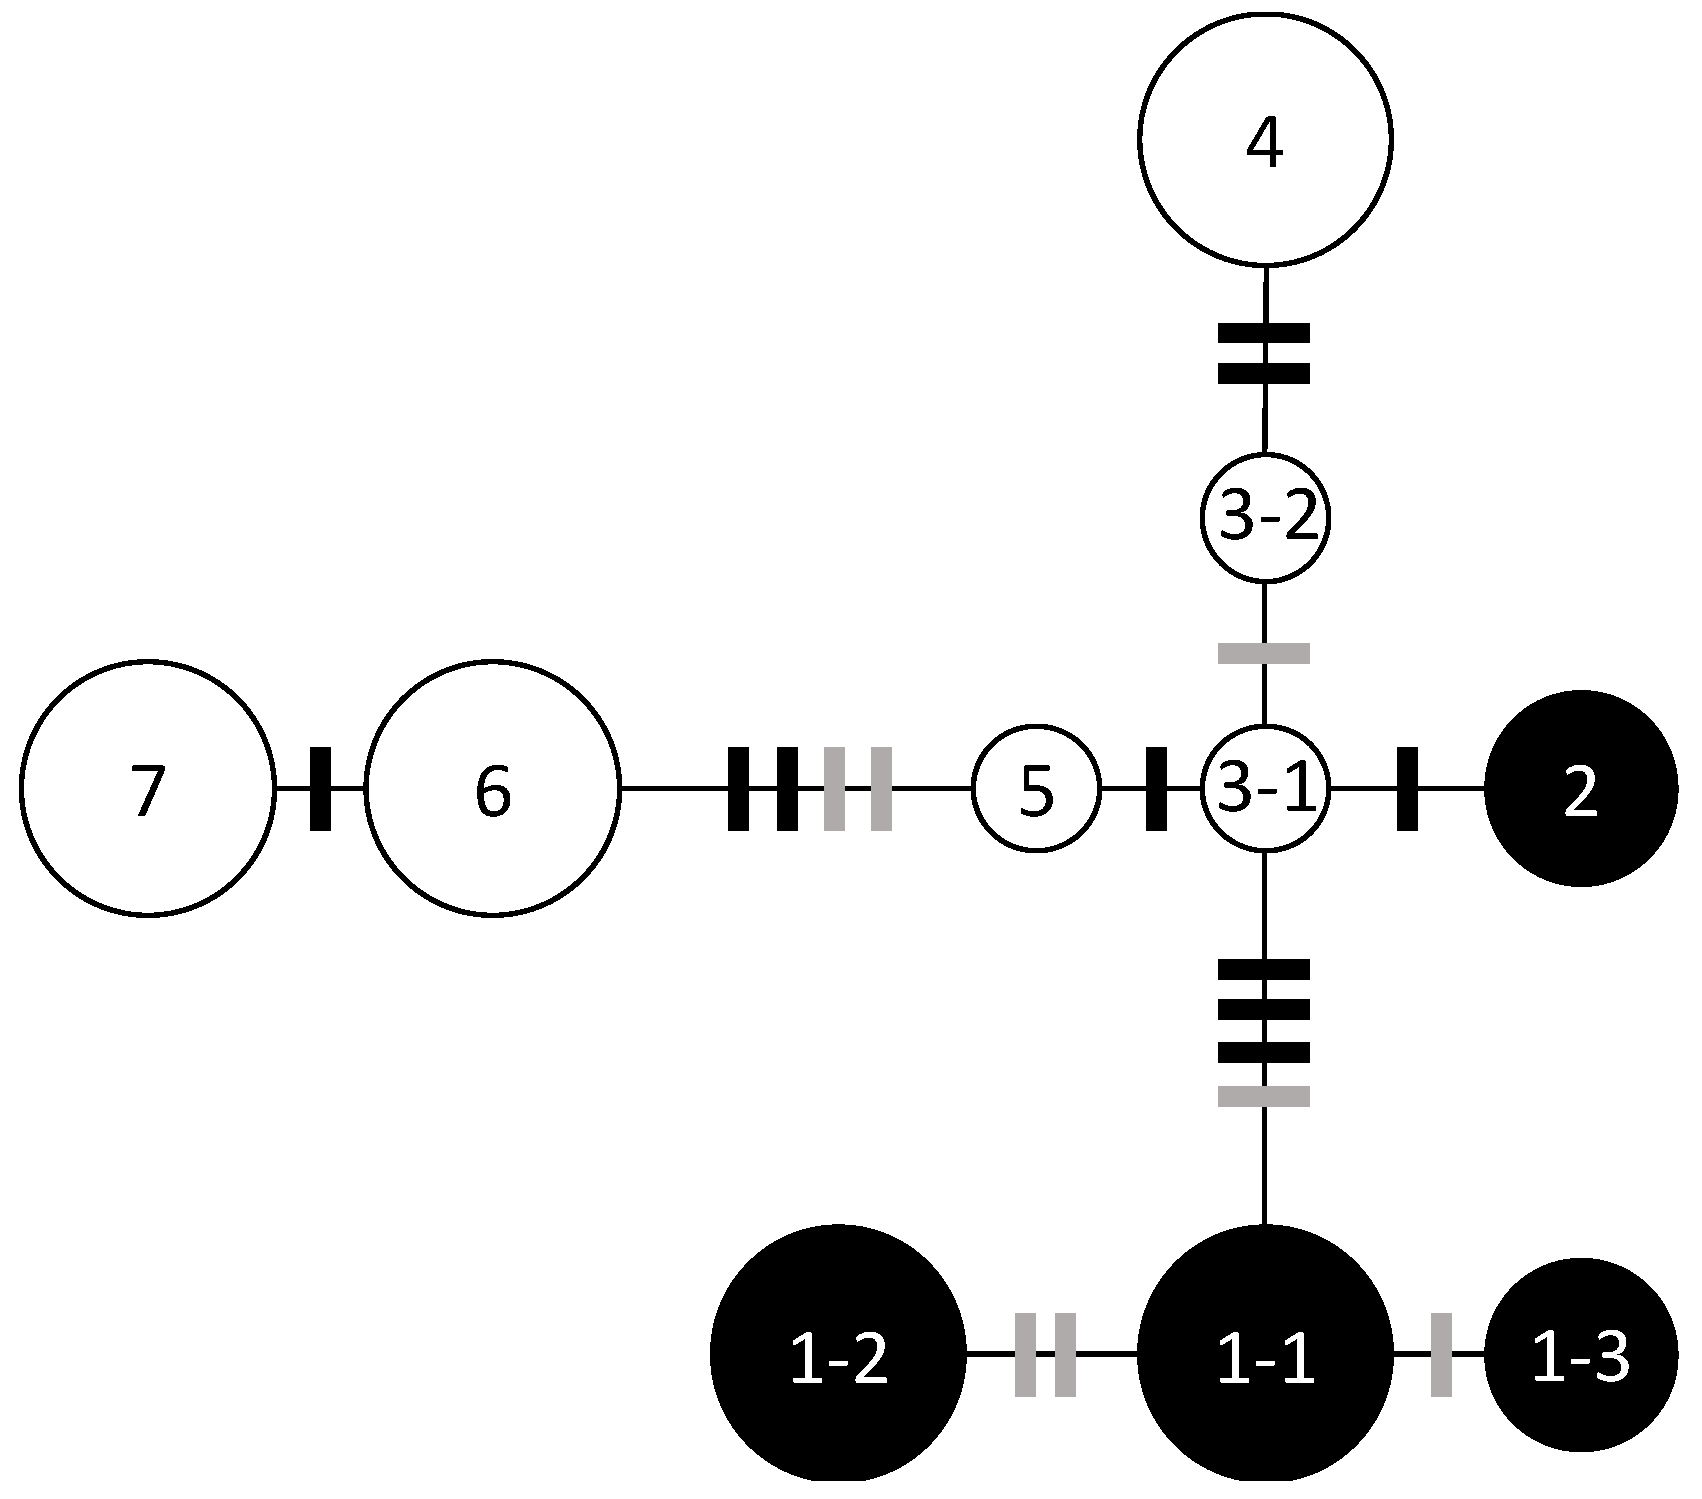
3.1. Chloroplast DNA Haplotype Variations

Nucleotide sequences from trnH-psbA (446 bp) and trnQ-trnS (905 bp) were determined for 82 individuals of Q. hondae and 46 individuals of Q. glauca. Ten nucleotide substitutions with three mononucleotide repeats could identify seven haplotypes and three subtypes (Figure 2). No haplotypes were shared between the two species.
In Q. hondae, two haplotypes were found; haplotype 2 was distinct from haplotype 1 by four nucleotide substitutions and was unique to Fukuse. Haplotype 1-1 was further divided into two subtypes (1-2 and 1-3) based on two mononucleotide repeats in trnH-psbA. Subtype 1-1 was found in Kamibun, Hachiman shrine, Tsuma shrine, Miyazaki University Forest, and Tsuruda; 1-2 was found in Asakura shrine, Matsuo shrine, Kuratani shrine, Yasaka shrine, and Aya-Takeno; 1-3 was found in Shiratori shrine and Tsuruda (Table 2). There were no variations within any population except Tsuruda, wherein two subtypes (1-2 and 1-3) were observed.
In Q. glauca, five haplotypes and one subtype were found. Kamibun, Tsuma shrine, Aya-Takeno, Miyazaki University Forest, and Tsuruda had multiple haplotypes, but only one haplotype was found in the Shiratori shrine.

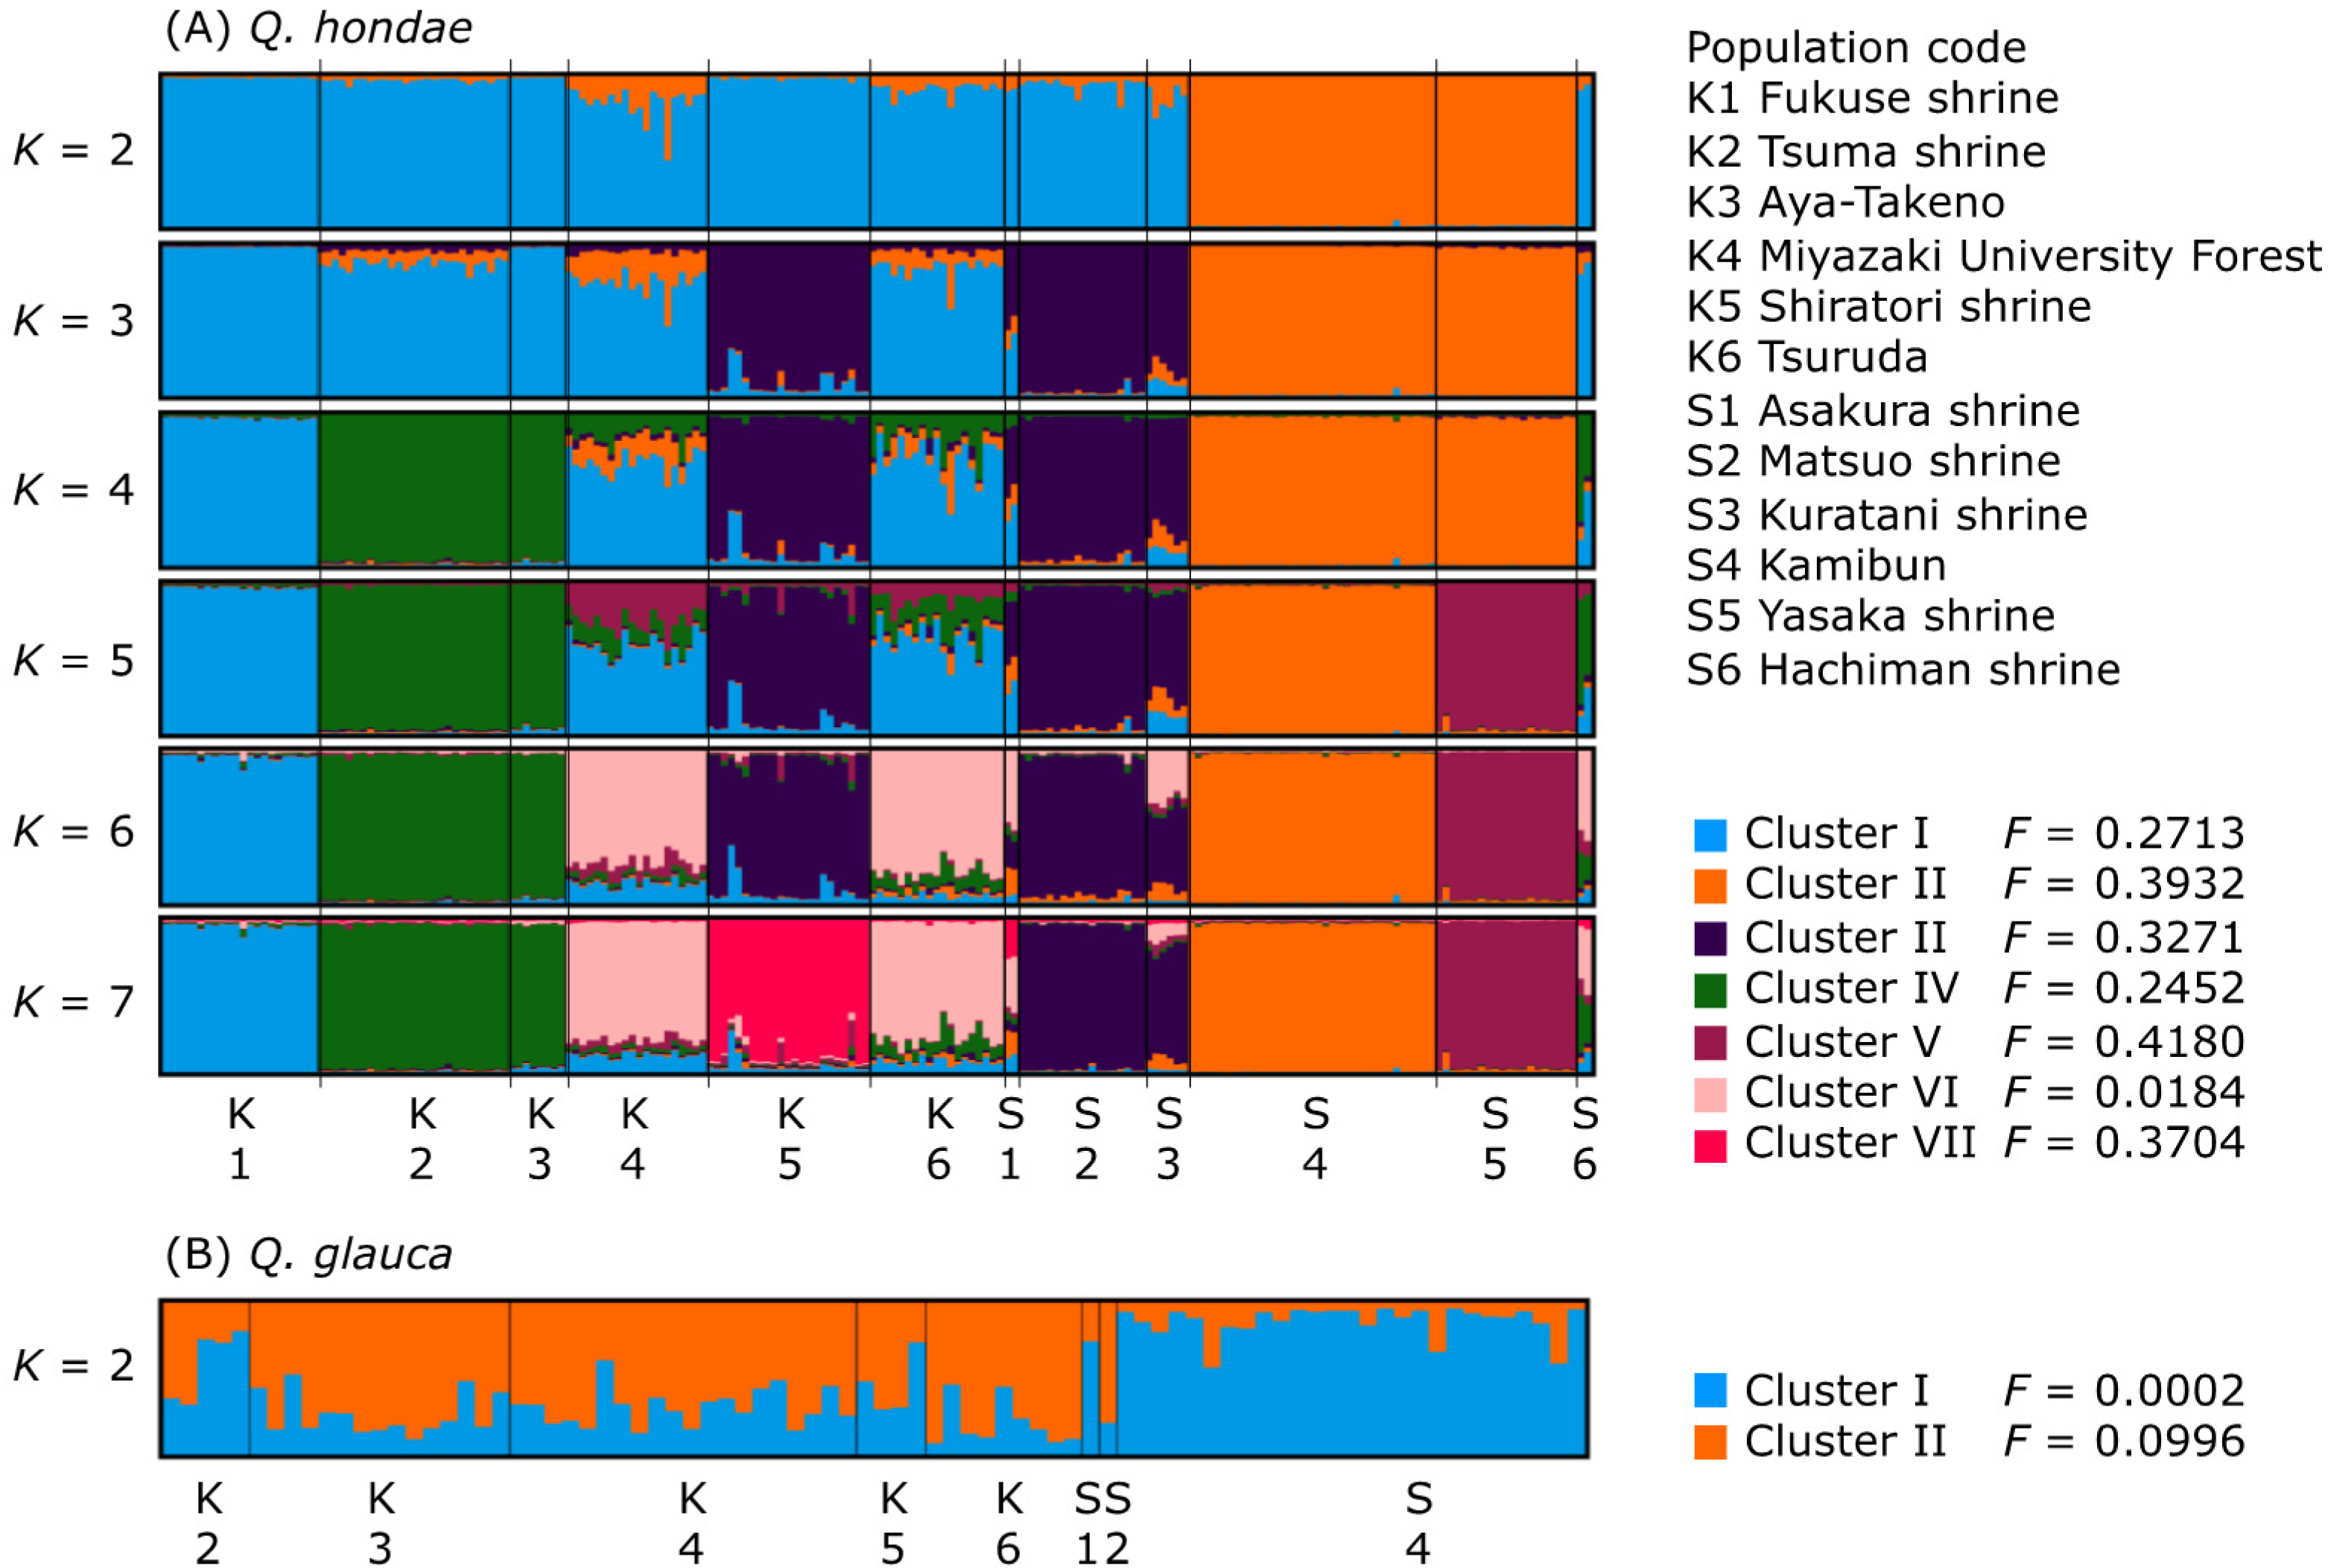
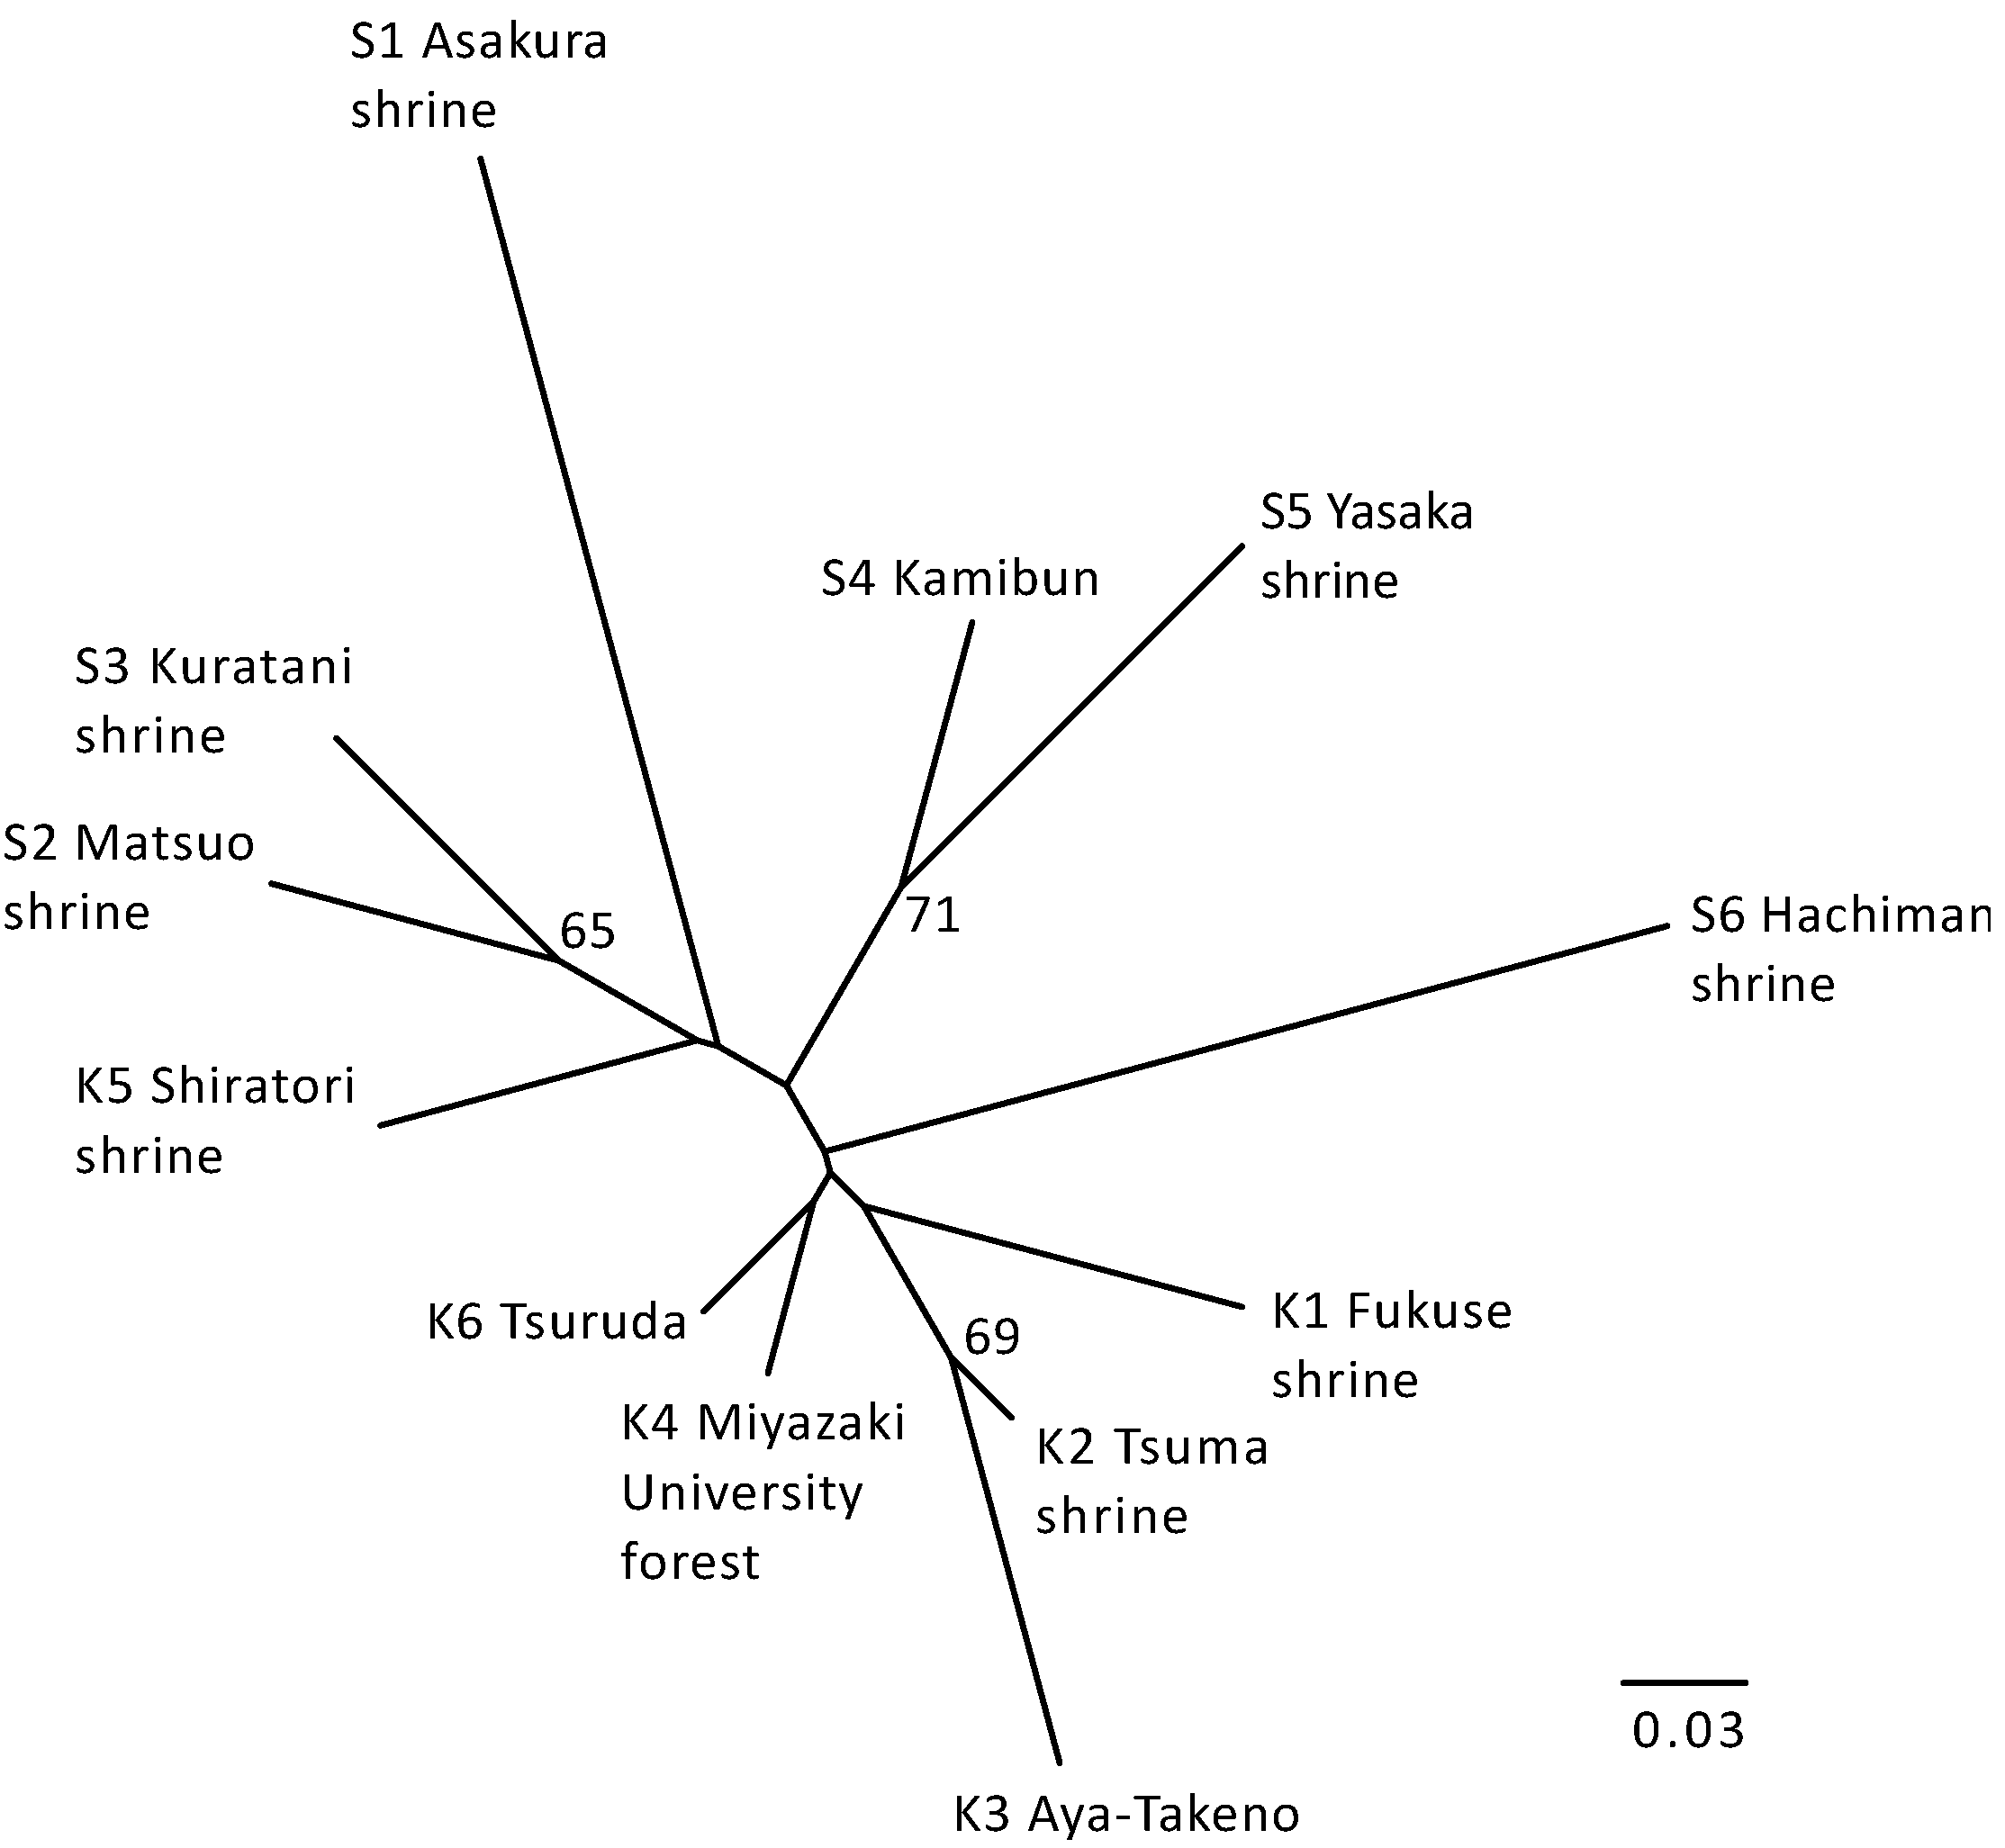
3.2. Genetic Diversity and Genetic Structure Based on Microsatellite Markers

Genotypes of 11 SSR loci were determined for 202 individuals of Q. hondae and 82 individuals of Q. glauca. In total, 63 and 125 different alleles were identified in Q. hondae and Q. glauca, respectively (Table 2). For CG105 in Q. hondae, all samples were heterozygotes, suggesting possible deviation from selective neutrality. For CG258, there was almost no variation within Q. hondae and Q. glauca, suggesting genetic hitchhiking near the locus or the presence of null alleles. Ultimately, the data from these loci was discarded for estimates of genetic diversity. The degree of genetic diversity was lower in Q. hondae than in Q. glauca. Mean values of gene diversity within the population (Hs) and overall gene diversity (Ht) in Q. hondae were 0.402 and 0.500, respectively; these values were lower than those in Q. glauca (0.676 and 0.683, respectively).
The degree of genetic diversity for populations of Q. hondae was always lower than for the corresponding population of Q. glauca (Table 1). Fis estimates tended to be negative for populations of Q. hondae but positive for populations of Q. glauca. Fis estimated using FSTAT was positive for five populations of Q. glauca, although Fis estimated using INEST was not significantly different from zero for any population.
The probability of a recent population bottleneck was estimated by the Wilcoxon signed-rank test and mode-shift test (Table 1). The Wilcoxon signed-rank test detected that four Q. hondae populations and one Q. glauca population were not at mutation-drift equilibrium under IAM, SSM, or TPM. The mode-shift test detected a recent bottleneck for each of the three Q. hondae populations.
Neighbor-joining trees based on shared allele distances (DAS) between individuals of Q. hondae and Q. glauca were generated (Figure S1). In Q. hondae, samples from Kyushu and Shikoku appeared to have separated from each other, although some clusters contained samples from both Shikoku and Kyushu. Most of the samples from each population fell into a single cluster, although a few samples from the same population were found in different clusters. Individuals from Miyazaki University Forest and Tsuruda were scattered in the tree and appeared in clusters that consisted of individuals in Shikoku. In contrast to Q. hondae, no distinct clusters were seen in Q. glauca, and samples from Shikoku and Kyushu were largely intermingled in the tree.
The overall FST estimated from microsatellites was approximately ten-fold higher in Q. hondae (0.184) than in Q. glauca (0.018). All pairwise FST values in Q. hondae were significant and ranged from 0.0310 between Miyazaki University Forest and Tsuruda to 0.3716 between Aya-Takeno and Yasaka shrine (Table 3). The Mantel test did not show a positive relationship between pairwise genetic and geographic distances (R2 = 0.0137, P = 0.204). In Q. glauca, FST values between the Shikoku population (Kamibun) and three Kyushu populations (Aya-Takeno, Miyazaki University Forest, and Tsuruda) were significant, which was not the case between populations in Kyushu (Table 4).
A STRUCTURE analysis of all samples indicated two clusters corresponding to the two species, suggesting no hybridization or introgression between the species (data not shown). For Q. hondae, ∆K was the highest at K = 2, while the [LnP(D)] in each K nearly plateaued at K = 7 (Figure S2). Based on these results, the optimal values of K could be 2 and 7. The STRUCTURE bar plots for K = 7 showed that most of the individuals in respective populations were assigned to a single cluster (Figure 3A). In Shikoku, the Matuso and Kuratani shrines formed a single cluster at K = 3–7 and were distinct from the Kamibun and Yasaka shrines. The Kamibun and Yasaka shrines consisted of the same cluster at K = 2–4 but were distinct from each other at K = 5–7. In Kyushu, four clusters were identified at K = 7, and two were shared by two populations. One cluster was shared by the Tsuma shrine and Aya-Takeno, and another by Miyazaki University Forest and Tsuruda. Overall, most of the individuals consisted of a single cluster, but individuals from Asakura, Hachiman, Miyazaki University Forest, and Tsuruda contained multiple clusters in varying proportions. For Q. glauca, both ∆K and the [LnP(D)] in each K was highest at K = 2 (Figure S2). The STRUCTURE bar plot for K = 2 indicated that the Kamibun population was distinct from the others, but this was only supported by a weak clustering solution (Figure 3B).
The neighbor-joining tree of populations of Q. hondae based on Nei’s DA distance was generally consistent with the STRUCTURE analysis (Figure 4). The populations assigned to the same cluster in the STRUCTURE analysis appeared to be closely related in the tree, whereas the populations from Kyushu were grouped together and only the Shiratori shrine population was grouped with Shikoku populations (although this grouping was not statistically supported).

4. Discussion

4.1. Low Genetic Diversity of Q. hondae

Both cpDNA and microsatellite data indicated that the genetic diversity of rare species of Q. hondae was lower than that of Q. glauca, a species more commonly found in evergreen broadleaved forests throughout Japan. Based on microsatellite data, the species-level heterozygosity was 27% lower in Q. hondae (Ht = 0.500) than in Q. glauca (Ht = 0.683). The limited number of samples and populations of Q. glauca likely led to an underestimation of the species-wide genetic diversity such that this value can be expected to be larger with a greater number of samples. The lower genetic diversity of Q. hondae is consistent with previous studies indicating that geographically restricted species exhibit lower levels of genetic diversity compared to more common congeneric species [2,3,37]. The average within-population heterozygosity was 0.402 in Q. hondae, which was 41% lower than in Q. glauca (Hs = 0.676). Low within-population heterozygosity in Q. hondae could result in a scattered geographical distribution and small sizes of each population. Quercus hondae is limited to lower slopes with humid soils, but such areas have been largely converted to Cryptomeria plantations, suggesting a reduction in the habitat that Q. hondae favors [38]. This is consistent with the detection of a bottleneck in four of eight tested populations of Q. hondae, compared to only one population of Q. glauca.
In Q. hondae, individuals from all populations except Fukuse had one of the three subtypes of haplotype 1, and all populations except Tsuruda were fixed to a single subtype. More Q. glauca haplotypes were identified; most of the populations had multiple haplotypes. This also suggests a smaller population size for Q. hondae. Individuals of Q. hondae from Fukuse exhibited haplotype 2, which was distantly related to haplotype 1, but close to haplotype 3-1 of Q. glauca. Introgressive hybridization of cpDNA is a common phenomenon in Quercus [39,40]. Several haplotypes were shared among four deciduous species of Quercus in Japan, suggesting introgressive hybridization [16,41]. The unexpectedly distinct haplotype of Q. hondae in Fukuse is thought to be the result of introgression from other Quercus species. More samples from other Quercus species are needed to test whether this is the result of introgressive hybridization.
Among Kyushu populations of Q. hondae, Miyazaki University Forest and Tsuruda exhibited higher genetic diversity. Genetic diversity in Kamibun was the highest among all populations in Shikoku. Since these populations are found in seminatural and secondary forest vegetation, they are expected to have higher genetic diversity than other populations in the tutelary forests of the Japanese shrine, in which forests are generally smaller and fragmented. In addition, higher genetic diversity in two Kyushu populations supports the presence of Pleistocene refugia in this region. Southern Kyushu is believed to be one refugium for plants that currently dominate evergreen broadleaved forests, as suggested by pollen and macrofossil data [42]. High genetic diversity and the high number of chloroplast haplotypes also support the presence of Pleistocene refugia in this region [43,44,45]. For Q. hondae, STRUCTURE analysis and the neighbor-joining tree indicated that the Kamibun and Yasaka populations in Shikoku were genetically distinct from the others. For Castanopsis sieboldii, three Shikoku populations and the most eastern population of Kyushu were genetically differentiated from other Kyushu populations, suggesting the existence of Pleistocene refugia other than Southern Kyushu [45]. These results also support the possibility of multiple refugia for evergreen broadleaved forest species.

4.2. High Genetic Differentiation between Populations of Q. hondae

Quercus species are wind-pollinated, and such species exhibit lower genetic differentiation compared with insect-pollinated species [1]. However, this study indicated that the genetic differentiation among populations of Q. hondae was substantially higher compared to Q. glauca. In a review of allozyme diversity in plants, the degree of population differentiation did not differ significantly among widespread, regional, narrowly distributed, and endemic species [1]. There was also no significant difference between rare and common congeners [37]. However, greater genetic differentiation between populations of endemic tree species was observed in the genus Pinus [46], consistent with this study. A low level of genetic differentiation was observed in common evergreen forest tree species in Japan, such as Castanopsis cuspidata, C. sieboldii [45], Q. acuta [12], and Q. gilva [11], while high genetic differentiation was observed in the pioneer tree species, Zanthoxylum ailanthoides [44]. For Q. hondae, fragmentation and isolation of the populations due to narrow ecological preferences and recent population bottlenecks may lead to high genetic differentiation among populations.
Despite the generally high genetic differentiation of populations of Q. hondae, the Mantel test did not support isolation-by-distance (IBD). Although Miyazaki University Forest and Tsuruda are separated by as much as 70 km, there is a low level of differentiation between these populations (FST = 0.0310). A STRUCTURE analysis showed that they were in the same group (Cluster VI in Figure 3A), and the population tree emphasized their closeness (Figure 4). However, there was a significant degree of differentiation between the Miyazaki University Forest and adjacent populations, such as Tsuma Shrine and Aya-Takeno (FST > 0.10), despite their being less than 30 km apart. The high genetic differentiation without IBD in this species could have two explanations. First, human-mediated seed or sapling transfer could obscure the IBD. This is plausible, as most extant populations are found in the tutelary forests of the Japanese shrine; however, there are no records indicating that this species was planted for commercial or religious purposes. A positive Fis value is expected because populations created by anthropogenic introductions are likely to be founded from a limited number of individuals. As a result, inbreeding and biparental inbreeding are inevitable. Nevertheless, a positive Fis was not detected in populations of Q. hondae. Second, the effect of genetic drift is greater in smaller populations. Individuals in such populations become genetically homogenized and the populations become distinct from each other. IBD may not be observed if the effect of genetic drift exceeds the gene flow between populations. As a result, STRUCTURE analysis can detect such populations even if they have recently diverged from the ancestral population [47,48]. The F-value, which indicates the degree of genetic drift [33], was smaller (0.0184) in Cluster VI, to which the Miyazaki University Forest and Tsuruda populations belong, compared to the other clusters (0.2452–0.3932). This suggests that the Miyazaki University Forest and Tsuruda have not experienced a severe population bottleneck in the past, and thus maintain a relatively high degree of heterozygosity and a low level of genetic differentiation. By contrast, the high F-values of other populations suggest that they have been greatly affected by genetic drift.

4.3. Implications for Conservation of Q. hondae

It was found that Q. hondae exhibits lower genetic diversity within and higher genetic differentiation among populations, in contrast to the more common congeneric species, Q. glauca (although populations of both species suffer similar anthropogenic disturbance). This study provides some insight concerning conservation guidelines for the recovery. This study showed that two Q. hondae populations on semi-natural or secondary forest vegetation in Kyushu (i.e., Miyazaki University Forest and Tsuruda) maintained the largest degree of genetic diversity among the populations studied. Such populations should be a priority for in situ conservation. Note that Tsuruda is located at the roadside and adjacent to a park and has therefore suffered from habitat disturbance. Kamibun, a large secondary forest population in Shikoku, also showed high genetic diversity and was genetically differentiated from the Kyushu populations, implying that this population is also important for conservation. All populations investigated were within the tutelary forests of the Japanese shrine and were genetically distinct from each other. These shrine forests are generally small, and isolated, and some are extremely small with only a few mature trees. For example, only two individuals, and no seedlings or juveniles, were found in the Asakura and Hachiman shrines, indicating discontinuous regeneration. Thus, some populations are at high risk of extinction. Because of the high genetic differentiation between populations, in order to increase genetic diversity and reduce the risk of extinction, the translocation of individuals between populations for this species is not recommended. The conservation of small populations without translocation may require the development of vegetative propagation techniques, such as cuttings for Q. hondae [49,50,51].

5. Conclusions

This is the first study to reveal the genetic diversity and population structure of Q. hondae. These results revealed that Q. hondae is characterized by lower genetic diversity at both population and species levels and high genetic differentiation among populations, compared to other evergreen Quercus and Castanopsis species that are common in evergreen broadleaf forests in Japan. These patterns are attributed to fragmentation and isolation of the populations due to narrow ecological preferences and recent population bottlenecks caused by human intervention, such as large-scale plantation. Despite the high genetic differentiation of populations of Q. hondae, IBD was not detected. This suggests the effect of genetic drift outweighs the effect of gene flow between populations. Information on the genetic diversity and population structure of Q. hondae is expected to be an important step toward the long-term conservation of this rare endemic species.

Supplementary Materials

The following supporting information can be downloaded at: https://www.mdpi.com/article/10.3390/f13040579/s1, Figure S1: Neighbor-joining trees based on allele sharing distance (DAS) between individuals for Q. hondae (A) and Q. glauca (B). The population numbers correspond to those found in Figure 1. Individuals collected in Shikoku Island are shown by grey; Figure S2: A ∆K for different number of clusters for Q. hondae (A) and Q. glauca (B), LnP(D) for each K for Q. hondae (C) and Q. glauca (D).

Author Contributions

Conceptualization, K.K., M.O., T.K., T.A. and T.I.; methodology, K.K. and M.O.; investigation, K.K., M.O., T.K. and T.I.; resources, Y.M.; data curation, K.K. and M.O.; writing—original draft preparation, K.K. and M.O.; writing—review and editing, K.K., M.O., T.K., Y.M., T.A. and T.I.; project administration, K.K., T.A. and T.I.; funding acquisition, K.K. and T.I. All authors have read and agreed to the published version of the manuscript.

Funding

This work was supported by JSPS KAKENHI 20H03032.

Institutional Review Board Statement

Not applicable.

Informed Consent Statement

Not applicable.

Data Availability Statement

Not applicable.

Acknowledgments

The authors thank the shrines, the Huga City office, and the Hokusatsu Regional Forest Office for giving permission to collect leave samples; Toyoaki Ohsaki for his guidance in the field work at Kamibun.

Conflicts of Interest

The authors declare no conflict of interest.

References

  1. Hamrick, J.L.; Godt, M.J.W. Allozyme diversity in plant species. In Plant Population Genetics, Breeding, and Genetic Resources; Brown, A.H.D., Clegg, M.T., Kahler, A.L., Weir, B.S., Eds.; Sinouer Association: Sunderland, MA, USA, 1989; pp. 43–63. [Google Scholar]
  2. Karron, J.D. A comparison of levels of genetic polymorphism and self-compatibility in geographically restricted and widespread plant congeners. Evol. Ecol. 1987, 1, 47–58. [Google Scholar] [CrossRef]
  3. Gitzendanner, M.A.; Soltis, P.S. Patterns of genetic variation in rare and widespread plant congeners. Am. J. Bot. 2000, 87, 783–792. [Google Scholar] [CrossRef] [PubMed]
  4. Yoichi, W.; Tomaru, N. Patterns of geographic distribution have a considerable influence on population genetic structure in one common and two rare species of Rhododendron (Ericaceae). Tree Genet. Genom. 2014, 10, 827–837. [Google Scholar] [CrossRef]
  5. Backs, J.R.; Ashley, M.V. Quercus conservation genetics and genomics: Past, present, and future. Forests 2021, 12, 882. [Google Scholar] [CrossRef]
  6. Cannon, C.H.; Petit, R.J. The oak syngameon: More than the sum of its parts. New Phytol. 2020, 226, 978–983. [Google Scholar] [CrossRef] [PubMed]
  7. Cannon, C.H.; Lerdau, M.T. Demography and destiny: The syngameon in hyperdiverse systems. Proc. Natl. Acad. Sci. USA 2019, 116, 8105. [Google Scholar] [CrossRef] [PubMed]
  8. Lazic, D.; Hipp, A.L.; Carlson, J.E.; Gailing, O. Use of genomic resources to assess adaptive divergence and introgression in oaks. Forests 2021, 12, 690. [Google Scholar] [CrossRef]
  9. Kamiya, K.; Harada, K.; Ogino, K.; Clyde, M.M.; Latiff, A.M. Phylogeny and genetic variation of Fagaceae in tropical montane forests. Tropics 2003, 13, 119–125. [Google Scholar] [CrossRef]
  10. Ito, S.; Ohtsuka, K.; Yamashita, T. Ecological distribution of seven evergreen Quercus species in southern and eastern Kyushu, Japan. Veg. Sci. 2007, 24, 53–63. [Google Scholar] [CrossRef]
  11. Han, E.K.; Cho, W.B.; Park, J.S.; Choi, I.S.; Kwak, M.; Kim, B.Y.; Lee, J.H. A Disjunctive Marginal Edge of Evergreen Broad-Leaved Oak (Quercus gilva) in East Asia: The High Genetic Distinctiveness and Unusual Diversity of Jeju Island Populations and Insight into a Massive, Independent Postglacial Colonization. Genes 2020, 11, 1114. [Google Scholar] [CrossRef] [PubMed]
  12. Lee, J.-H.; Lee, D.-H.; Choi, I.-S.; Choi, B.-H. Genetic diversity and historical migration patterns of an endemic evergreen oak, Quercus acuta, across Korea and Japan, inferred from nuclear microsatellites. Plant Syst. Evol. 2014, 300, 1913–1923. [Google Scholar] [CrossRef]
  13. Murray, M.G.; Thompson, W.F. Rapid isolation of high molecular weight plant DNA. Nucleic Acids Res. 1980, 8, 4321–4325. [Google Scholar] [CrossRef] [PubMed]
  14. Tate, J.A.; Simpson, B.B. Paraphyly of Tarasa (Malvaceae) and diverse origins of the polyploid species. Syst. Bot. 2003, 28, 723–737. [Google Scholar] [CrossRef]
  15. Sang, T.; Crawford, D.J.; Stuessy, T.F. Chloroplast DNA phylogeny, reticulate evolution, and biogeography of Paeonia (Paeoniaceae). Am. J. Bot. 1997, 84, 1120–1136. [Google Scholar] [CrossRef]
  16. Kanno, M.; Yokoyama, J.; Suyama, Y.; Ohyama, M.; Itoh, T.; Suzuki, M. Geographical distribution of two haplotypes of chloroplast DNA in four oak species (Quercus) in Japan. J. Plant Res. 2004, 117, 311–317. [Google Scholar] [CrossRef]
  17. Gouy, M.; Guindon, S.; Gascuel, O. SeaView version 4: A multiplatform graphical user interface for sequence alignment and phylogenetic tree building. Mol. Biol. Evol. 2010, 27, 221–224. [Google Scholar] [CrossRef]
  18. Clement, M.; Posada, D.; Crandall, K.A. TCS: A computer program to estimate gene genealogies. Mol. Ecol. 2000, 9, 1657–1659. [Google Scholar] [CrossRef]
  19. Tong, X.; Xu, N.N.; Li, L.; Chen, X.Y. Development and characterization of polymorphic microsatellite markers in Cyclobalanopsis glauca (Fagaceae). Am. J. Bot. 2012, 99, e120–e122. [Google Scholar] [CrossRef]
  20. Lee, J.-H.; Park, M.-H.; Min, G.-S.; Choi, B.-H. Isolation and Characterization of 13 Microsatellite Loci from Korean Quercus acuta (Fagaceae). J. Plant Biol. 2010, 53, 201–204. [Google Scholar] [CrossRef]
  21. Meirmans, P.G. GENODIVE version 3.0: Easy-to-use software for the analysis of genetic data of diploids and polyploids. Mol. Ecol. Resour. 2020, 20, 1126–1131. [Google Scholar] [CrossRef]
  22. Peakall, R.; Smouse, P.E. GenAlEx 6.5: Genetic analysis in Excel. Population genetic software for teaching and research—An update. Bioinformatics 2012, 28, 2537–2539. [Google Scholar] [CrossRef]
  23. Goudet, J. FSTAT (version 1.2): A computer program to calculate F-statistics. J. Hered. 1995, 86, 485–486. [Google Scholar] [CrossRef]
  24. Chybicki, I.J.; Burczyk, J. Simultaneous estimation of null alleles and inbreeding coefficients. J. Hered. 2009, 100, 106–113. [Google Scholar] [CrossRef]
  25. Nei, M.; Maruyama, T.; Chakraborty, R. The Bottleneck Effect and Genetic Variability in Populations. Evolution 1975, 29, 1–10. [Google Scholar] [CrossRef]
  26. Cornuet, J.M.; Luikart, G. Description and power analysis of two tests for detecting recent population bottlenecks from allele frequency data. Genetics 1996, 144, 2001–2014. [Google Scholar] [CrossRef]
  27. Piry, S.; Luikart, G.; Cornuet, J.M. Computer note. BOTTLENECK: A computer program for detecting recent reductions in the effective size using allele frequency data. J. Hered. 1999, 90, 502–503. [Google Scholar] [CrossRef]
  28. Saitou, N.; Nei, M. The neighbor-joining method: A new method for reconstructing phylogenetic trees. Mol. Biol. Evol. 1987, 4, 406–425. [Google Scholar] [CrossRef]
  29. Nei, M. Molecular Evolutionary Genetics; Columbia University Press: New York, NY, USA, 1987. [Google Scholar]
  30. Langella, O. Populations 1.2.30: Population Genetic Software (Individuals or Population Distances, Phylogenetic Trees). 2007. Available online: https://bioinformatics.org/populations/ (accessed on 22 February 2022).
  31. Weir, B.S.; Cockerham, C.C. Estimating F-Statistics for the analysis of population structure. Evolution 1984, 38, 1358–1370. [Google Scholar] [CrossRef]
  32. Pritchard, J.K.; Stephens, M.; Donnelly, P. Inference of population structure using multilocus genotype data. Genetics 2000, 155, 945–959. [Google Scholar] [CrossRef]
  33. Falush, D.; Stephens, M.; Pritchard, J.K. Inference of population structure using multilocus genotype data: Linked loci and correlated allele frequencies. Genetics 2003, 164, 1567–1587. [Google Scholar] [CrossRef] [PubMed]
  34. Hubisz, M.J.; Falush, D.; Stephens, M.; Pritchard, J.K. Inferring weak population structure with the assistance of sample group information. Mol. Ecol. Resour. 2009, 9, 1322–1332. [Google Scholar] [CrossRef]
  35. Earl, D.A.; von Holdt, B.M. STRUCTURE HARVESTER: A website and program for visualizing STRUCTURE output and implementing the Evanno method. Conserv. Genet. Resour. 2011, 4, 359–361. [Google Scholar] [CrossRef]
  36. Kopelman, N.M.; Mayzel, J.; Jakobsson, M.; Rosenberg, N.A.; Mayrose, I. Clumpak: A program for identifying clustering modes and packaging population structure inferences across K. Mol. Ecol. Resour. 2015, 15, 1179–1191. [Google Scholar] [CrossRef] [PubMed]
  37. Cole, C.T. Genetic variation in rare and common plants. Annu. Rev. Ecol. Evol. Syst. 2003, 34, 213–237. [Google Scholar] [CrossRef]
  38. Ito, S.; Nakagawa, M.; Buckley, G.P.; Nogami, K. Species richness in sugi (Cryptomeria japonica D. DON) plantations in southeastern Kyushu, Japan: The effects of stand type and age on understory trees and shrubs. J. For. Res. 2003, 8, 49–57. [Google Scholar] [CrossRef]
  39. Whittemore, A.T.; Schaal, B.A. Interspecific gene flow in sympatric oaks. Proc. Natl. Acad. Sci. USA 1991, 88, 2540–2544. [Google Scholar] [CrossRef] [PubMed]
  40. Dumolin-Lapegue, S.; Demesure, B.; Fineschi, S.; Le Corre, V.; Petit, R.J. Phylogeographic structure of white oaks throughout the European continent. Genetics 1997, 146, 1475–1487. [Google Scholar] [CrossRef] [PubMed]
  41. Okaura, T.; Quang, N.D.; Ubukata, M.; Harada, K. Phylogeographic structure and late Quaternary population history of the Japanese oak Quercus mongolica var. crispula and related species revealed by chloroplast DNA variation. Genes Genet. Syst. 2007, 82, 465–477. [Google Scholar] [CrossRef]
  42. Tsukada, M. Map of vegetation during the last glacial maximum in Japan. Quatern. Res. 1985, 23, 369–381. [Google Scholar] [CrossRef]
  43. Aoki, K.; Suzuki, T.; Hsu, T.W.; Murakami, N. Phylogeography of the component species of broad-leaved evergreen forests in Japan, based on chloroplast DNA variation. J. Plant Res. 2004, 117, 77–94. [Google Scholar] [CrossRef]
  44. Yoshida, T.; Nagai, H.; Yahara, T.; Tachida, H. Genetic structure and putative selective sweep in the pioneer tree, Zanthoxylum ailanthoides. J. Plant Res. 2010, 123, 607–616. [Google Scholar] [CrossRef] [PubMed]
  45. Aoki, K.; Ueno, S.; Kamijo, T.; Setoguchi, H.; Murakami, N.; Kato, M.; Tsumura, Y. Genetic differentiation and genetic diversity of Castanopsis (Fagaceae), the dominant tree species in Japanese broadleaved evergreen forests, revealed by analysis of EST-associated microsatellites. PLoS ONE 2014, 9, e87429. [Google Scholar] [CrossRef]
  46. Hamrick, J.L.; Godt, M.J.W.; Sherman-Broyles, S.L. Factors influencing levels of genetic diversity in woody plant species. New For. 1992, 6, 95–124. [Google Scholar] [CrossRef]
  47. Rosenberg, N.A.; Burke, T.; Elo, K.; Feldman, M.W.; Freidlin, P.J.; Groenen, M.A.M.; Hillel, J.; Maki-Tanila, A.; Tixier-Boichard, M.l.; Vignal, A.; et al. Empirical Evaluation of Genetic Clustering Methods Using Multilocus Genotypes from 20 Chicken Breeds. Genetics 2001, 159, 699–713. [Google Scholar] [CrossRef] [PubMed]
  48. Rosenberg, N.A.; Pritchard, J.K.; Weber, J.L.; Cann, H.M.; Kidd, K.K.; Zhivotovsky, L.A.; Feldman, M.W. Genetic structure of human populations. Science 2002, 298, 2381–2385. [Google Scholar] [CrossRef] [PubMed]
  49. Chalupa, V. Vegetative propagation of oak (Quercus robur and Q. petraea) by cutting and tissue culture. Ann. Des Sci. For. INRA/EDP Sci. 1993, 50, 295s–307s. [Google Scholar] [CrossRef]
  50. Drew, J.J.; Dirr, M.A. Propagation of Quercus L. Species by Cuttings. J. Environ. Hort. 1989, 7, 115–117. [Google Scholar] [CrossRef]
  51. Kenzo, T.; Ichie, T.; Kamiya, K.; Ngo, K.M.; Lum, S.K.Y. Rooting Ability of Leafy-stem cuttings of hybrid Shorea (Dipterocarpaceae). J. Trop. For. Sci. 2019, 31, 324–331. [Google Scholar] [CrossRef]
Figure 1. Populations of Q. hondae sampled in this study (solid circles). Open circles indicate areas where Q. hondae exists but was not sampled in this study. Q. glauca individuals were also collected from populations with asterisks.
Forests 13 00579 g001
Figure 2. Chloroplast DNA haplotype network based on the TCS method. The five haplotypes and subtypes found in Q. hondae are denoted by solid circles, and the six haplotypes and subtypes found in Q. glauca by open circles. Black bars indicate single base mutations and grey bars indicate differences in mononucleotide repeats. The sizes of the circles are approximately proportional to the sample sizes.
Forests 13 00579 g002
Figure 3. STRUCTURE bar plots of individuals with K = 2–7 for Q. hondae (A) and K = 2 for Q. glauca (B). Populations were separated by black bars.
Forests 13 00579 g003
Figure 4. Neighbor-joining tree based on DA distances between populations of Q. hondae. Numbers indicate bootstrap values exceeding 50% based on 1000 replicates.
Forests 13 00579 g004
Table 1. Populations sampled and the statistics of genetic diversity.
Population CodeLocationNNaNeHouHeFis (FSTAT)Fis (INEST)BOTTLENECK
Wilcoxon Test Probability 1
BOTTLENECK Mode-Shift 2cpDNA
Haplotypes (n) 3
IAMTPMSMM
Q. hondae
K1Miyazaki, Fukuse shrine223.222.110.4650.421−0.1070.0190.0060.0200.422Normal L-shaped2 (8)
K2Miyazaki, Tsuma shrine273.112.400.4810.481−0.0300.0170.0100.0270.098Shifted mode1-1 (8)
K3Miyazaki, Aya-Takeno82.441.810.4310.431−0.0420.0341-2 (8)
K4Miyazaki, Miyazaki University Forest205.112.850.5940.575−0.0360.0240.0640.4550.997Normal L-shaped1-1 (8)
K5Kagoshima, Shiratori shrine233.442.020.5270.482−0.0950.0140.1500.4100.674Normal L-shaped1-3 (8)
K6Kagoshima, Tsuruda194.672.710.5030.5300.0520.0400.1800.6741.000Normal L-shaped1-1 (4), 1-3 (4)
S1Kochi, Asakura shrine21-2 (2)
S2Kochi, Matsuo shrine182.781.950.3700.369−0.0030.0470.2190.2190.219Normal L-shaped1-2 (8)
S3Kochi, Kuratani shrine62.111.660.3330.318−0.0530.0521-2 (6)
S4Kochi, Kamibun352.672.310.5050.451−0.1210.0080.0080.0120.012Shifted mode1-1 (8)
S5Kochi, Yasaka shrine202.562.000.4110.4120.0010.0310.0040.0200.027Shifted mode1-2 (8)
S6Ehime, Hachiman shrine21-1 (2)
Q. glauca
K2Miyazaki, Tsuma shrine54.403.410.4850.7550.387 *0.1044 (4), 7 (1)
K3Miyazaki, Aya-Takeno156.104.190.5950.7000.155 *0.0250.0020.0050.248Normal L-shaped6 (2), 7 (10)
K4Miyazaki, Miyazaki University Forest208.304.340.5480.6970.218 *0.0490.5000.9580.999Normal L-shaped3-1 (1), 4 (7)
K5Kagoshima, Shiratori shrine43.803.160.6500.7390.1380.0366 (4)
K6Kagoshima, Tsuruda95.704.040.5570.7080.224 *0.0333-1 (1), 5 (2), 6 (5)
S1Kochi, Asakura shrine14 (1)
S2Kochi, Matsuo shrine16 (1)
S4Kochi, Kamibun279.504.830.6060.7150.155 *0.0380.1160.3131.000Normal L-shaped3-2 (1), 4 (6)
N, number of samples; Na, number of alleles; Ne, effective number of alleles; Ho, observed heterozygosity; uHe, unbiased expected heterozygosity; Fis (FSTAT), inbreeding coefficient; Fis (INEST), inbreeding coefficient correcting for null alleles; *, p < 0.05. 1 The Wilcoxon one-tail probabilities of heterozygosity excess under the infinite allele model (IAM), two-phase model (TPM) and the stepwise mutation model (SMM). 2 The allelic distribution modes expected from mutation-drift equilibrium (Normal L-shaped), or from recent bottleneck event (Shifted mode). 3 Chloroplast DNA haplotypes observed and the frequency (n); see Figure 3 for haplotype names.
Table 2. A comparison of genetic diversity per locus between Q. hondae and Q. glauca.
LocusNaNeHoHsHtGisNaNeHoHsHtGis
Q. hondaeQ. glauca
CG7541.470.3850.3390.433−0.13593.020.7440.8210.8160.093
CG10532.010.9890.5030.502−0.96752.200.8170.6150.655−0.329
CG13931.360.2990.2810.337−0.06451.190.1500.2010.1820.252
CG25811.000.0000.0000.00021.020.0110.0260.0200.582
CG371102.290.5730.6080.7220.059213.910.5620.8950.9110.373
MSQa152.180.6740.5730.707−0.17552.100.4300.6810.7060.369
MSQa282.110.5820.5640.769−0.033163.740.8750.8850.8690.011
MSQa4162.690.5810.6840.8770.150202.210.1460.8040.8430.819
MSQa1051.350.2870.2780.329−0.032102.300.5420.7180.7420.245
MSQa1151.870.5630.4950.665−0.137153.710.8220.8940.8900.081
MSQa1331.110.1480.1020.156−0.442173.940.9080.8960.880−0.013
Mean5.731.770.4620.4020.500−0.17811.362.670.5460.6760.6830.226
Na, number of alleles; Ne, effective number of alleles; Ho, observed heterozygosity; Hs, heterozygosity within populations; Ht, total heterozygosity; Gis, inbreeding coefficient.
Table 3. Pairwise FST estimated from microsatellite loci for Q. hondae.
PopulationK2K3K4K5K6S2S3S4S5
K1Miyazaki, Fukuse shrine0.1435 ***0.2280 ***0.0987 ***0.1909 ***0.0877 ***0.2250 ***0.2502 ***0.1917 ***0.3451 ***
K2Miyazaki, Tsuma shrine0.0766 ***0.0969 ***0.1487 ***0.0757 ***0.1789 ***0.1663 **0.1736 ***0.2752 ***
K3Miyazaki, Aya-Takeno 0.1598 ***0.2733 ***0.1184 ***0.3028 ***0.2884 *0.2475 ***0.3716 ***
K4Miyazaki, Miyazaki University Forest 0.1278 ***0.0310 *0.1400 ***0.1413 ***0.1347 ***0.1471 ***
K5Kagoshima, Shiratori shrine 0.1268 ***0.1321 ***0.1798 ***0.2603 ***0.2805 ***
K6Kagoshima, Tsuruda 0.1477 ***0.0929 *0.1422 ***0.2244 ***
S2Kochi, Matsuo shrine 0.1808 ***0.2217 ***0.2714 ***
S3Kochi, Kuratani shrine 0.2278 ***0.3340 ***
S4Kochi, Kamibun 0.2250 ***
S5Kochi, Yasaka shrine
*, p < 0.05; **, p < 0.01; ***, p < 0.001.
Table 4. Pairwise FST estimated from microsatellite loci for Q. glauca.
PopulationK3K4K6S4
K2Miyazaki, Tsuma shrine0.0236 NS0.0184 NS0.0205 NS0.0413 NS
K3Miyazaki, Aya-Takeno0.0015 NS0.0003 NS0.0220 *
K4Miyazaki, Miyazaki University Forest −0.0087 NS0.0236 **
K6Kagoshima, Tsuruda 0.0324 **
S4Kochi, Kamibun
NS, not significant; *, p < 0.05; **, p < 0.01.
Publisher’s Note: MDPI stays neutral with regard to jurisdictional claims in published maps and institutional affiliations.

