Article

Seven-Year Changes in Bulk Density Following Forest Harvesting and Machine Trafficking in Alberta, Canada

by
David H. McNabb
1,* and
Andrei Startsev
2,†
1
Forest Soil Science Ltd., 8775 Strathearn Crescent NW, Edmonton, AB T6C 4C5, Canada
2
Alberta Environmental Centre, Alberta Research Council, Vegreville, AB T9C 1T4, Canada
*
Author to whom correspondence should be addressed.
Retired.
Forests 2022, 13(4), 553; https://doi.org/10.3390/f13040553
Submission received: 1 March 2022 / Revised: 24 March 2022 / Accepted: 27 March 2022 / Published: 31 March 2022

Abstract

:
Processes responsible for natural recovery of compacted forest soils are poorly understood, making estimating their recovery problematic. Bulk density was measured over 7 years at nine boreal forest sites in Alberta, Canada, where harvest-only and three skidding treatments were installed (~10,000 samples). Air and soil temperatures, soil moisture and redox potential, and snow depth were also measured on the harvest-only and adjacent seven-cycle skid trail. Significant increases in bulk density occurred when the soil water potential was wetter than −25 kPa. After 1 year, an additional significant increase in bulk density of 0.03 Mg m−3 was measured across all treatments, soil depths, and sites. The increase is attributed to the soil mechanics process of rebound and disruption of soil biological processes. By year 7, the secondary increase in bulk density had recovered in trafficked soil, but not on the harvest-only area. Some soil freezing had no effect on bulk density, which was moderated by the depth of the snowpack. The array of soil physical processes, soil texture, water supply, mechanics of water freezing in soil, and weather required to make soil freezing an effective decompacting agent did not occur. The shrink–swell process was not relevant because the soils remained wet. As a result, the bulk density of the trafficked soil failed to recover after 7 years to a depth of 20 cm. The freeze–thaw process as a decompaction agent is far more complex than commonly assumed, and its effectiveness cannot be assumed because soil temperatures below 0 °C are measured.

1. Introduction

The potential to reduce soil productivity and adversely affect other ecological functions of soil by trafficking soil with ground-based equipment has long been a concern in agriculture and forestry [1]. More than 150 papers published between 1970 and 1977 reported that soil compaction affected the growth of agricultural crops and forest trees [2]. Compaction of forest soils was the focus of 26 papers with only 2 papers failing to report compaction-reduced tree growth. These papers drew attention to the most obvious examples of agroforestry machines impacting soils and crop productivity. At the time, indiscriminate areal trafficking of soil and a lack of awareness of the problem were important issues. Concentrating the trafficking to a few skid trails reduced the impact [3], and other options to manage soil compaction were promoted [4]. New literature reviews continue to summarize the expanding range of impacts soil compaction causes and options for their management [5,6,7], and evaluate a wider array of machines and operational practices to reduce soil impacts [8,9], but the potential for long-term term natural recovery of anthropogenically compacted soils remains speculative [10].
The ecological consequences of compaction on forest soils are complex. Soil compaction causes an increase in bulk density and a related decrease in air-filled porosity as a function of an increasing number of machine passes [11]. These changes in soil affect a wide range of other soil properties important for the growth of roots [12], including soil resistance to root penetration [13], soil aeration [14], soil water availability, and movement of water into and through soil [15,16]. The potential for soil compaction to affect multiple, interrelated soil properties has complicated our ability to relate changes in tree growth on compacted soil to a single-soil property. This complexity also makes it difficult to define specific values of bulk density that limit root and tree growth [4]. Values of natural and compacted bulk densities are also significantly correlated [17]. Particle size distribution and organic matter content are important soil properties responsible for these differences [18]. A newer alternative is to use relative density instead of bulk density as a measure of the severity of soil compaction. Relative density is the ratio of measured bulk density divided by the bulk density obtained using a standardized compaction or consolidation test [19,20]. Relative density has been related to differences that soil compaction has on tree growth for different sites and soils in British Columbia, Canada [21].
The effectiveness of natural decompaction processes to restore compacted soil to its original condition is uncertain because of the range of factors and interactions involved [22]. As a result, efforts to estimate soil recovery are based on studying a chronosequence of similarly treated sites. Unfortunately, the history of older sites may not be well documented, and the ability to visually identify compacted and adjacent control soils on older sites becomes less dependable [4]. Finally, the estimated time for compacted soil to recover in chronosequence studies is based on regression analyses of when the difference between the bulk density of samples selected to represent compacted and control soils becomes zero. Estimates of forest soil recovery based on this methodology have ranged from about two decades in northern climates [23] to 50 to 70 years in France [24] and more than 32 to 70 years in the western US [25,26]. Surface soils consistently recover faster than subsoil [25,26]. In a recent review of the natural recovery of skid trails, DeArmond et al. [10] identified 18 of 64 studies where the physical properties of the surface soil to a depth of 5 to 15 cm had recovered, but recovery was primarily limited to the less traveled skid trails.
More reliable measures of soil recovery should be obtained if bulk density is repeatedly measured on the same site over time, but short-term reports of soil recovery have been inconsistent. For example, Labelle and Jaeger [27] reported two loams in New Brunswick, Canada, which indicated no natural recovery after 5 years. On the other hand, Page-Dumroese et al. [28] reported a possible minor recovery of compacted, coarse-textured soil in a 0–10 cm layer after 5 years when a significance level of α = 0.10 was used. They did note that the number of samples required to estimate a 15% difference in bulk density on most of the sites was generally greater than the number of samples collected. For repeated measurement of bulk density over time to be dependable, many high-quality bulk density samples must be collected at each location and time. The standard agroforestry method of measuring bulk density by the core method recommends using large-volume rings with a diameter of at least 75 mm [29]. Validation of statistically significant differences in bulk density as a measure of soil recovery will be more dependable if the monitoring of the soil and climatic environment helps confirm that specific natural recovery processes were active [30].
Our objective was to quantify changes in bulk density over a 7-year period following forest harvesting and controlled skidding on boreal forest soils in west-central Alberta. We assumed that cold winters would make the freeze–thaw process an important factor contributing to the natural decompaction of these soils. Weather stations to measure air and soil temperatures and snow depth were installed at each installation to confirm when such events occurred.

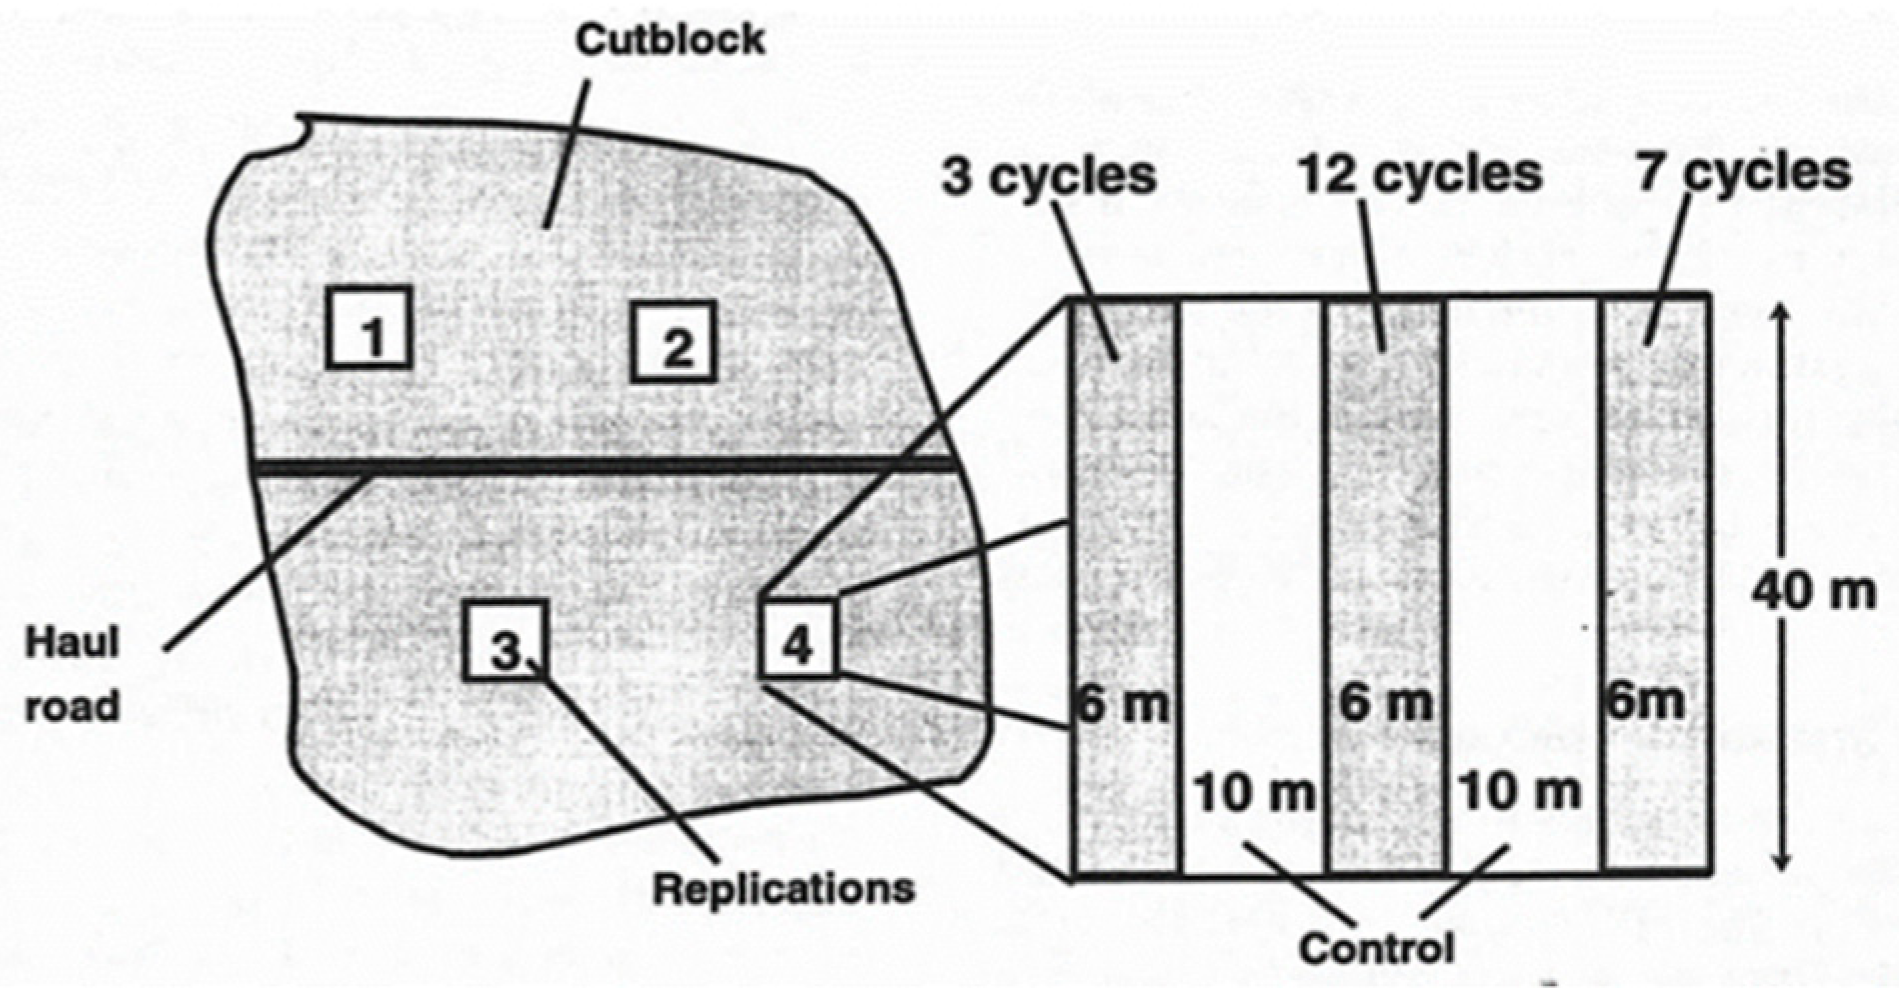
2. Materials and Methods
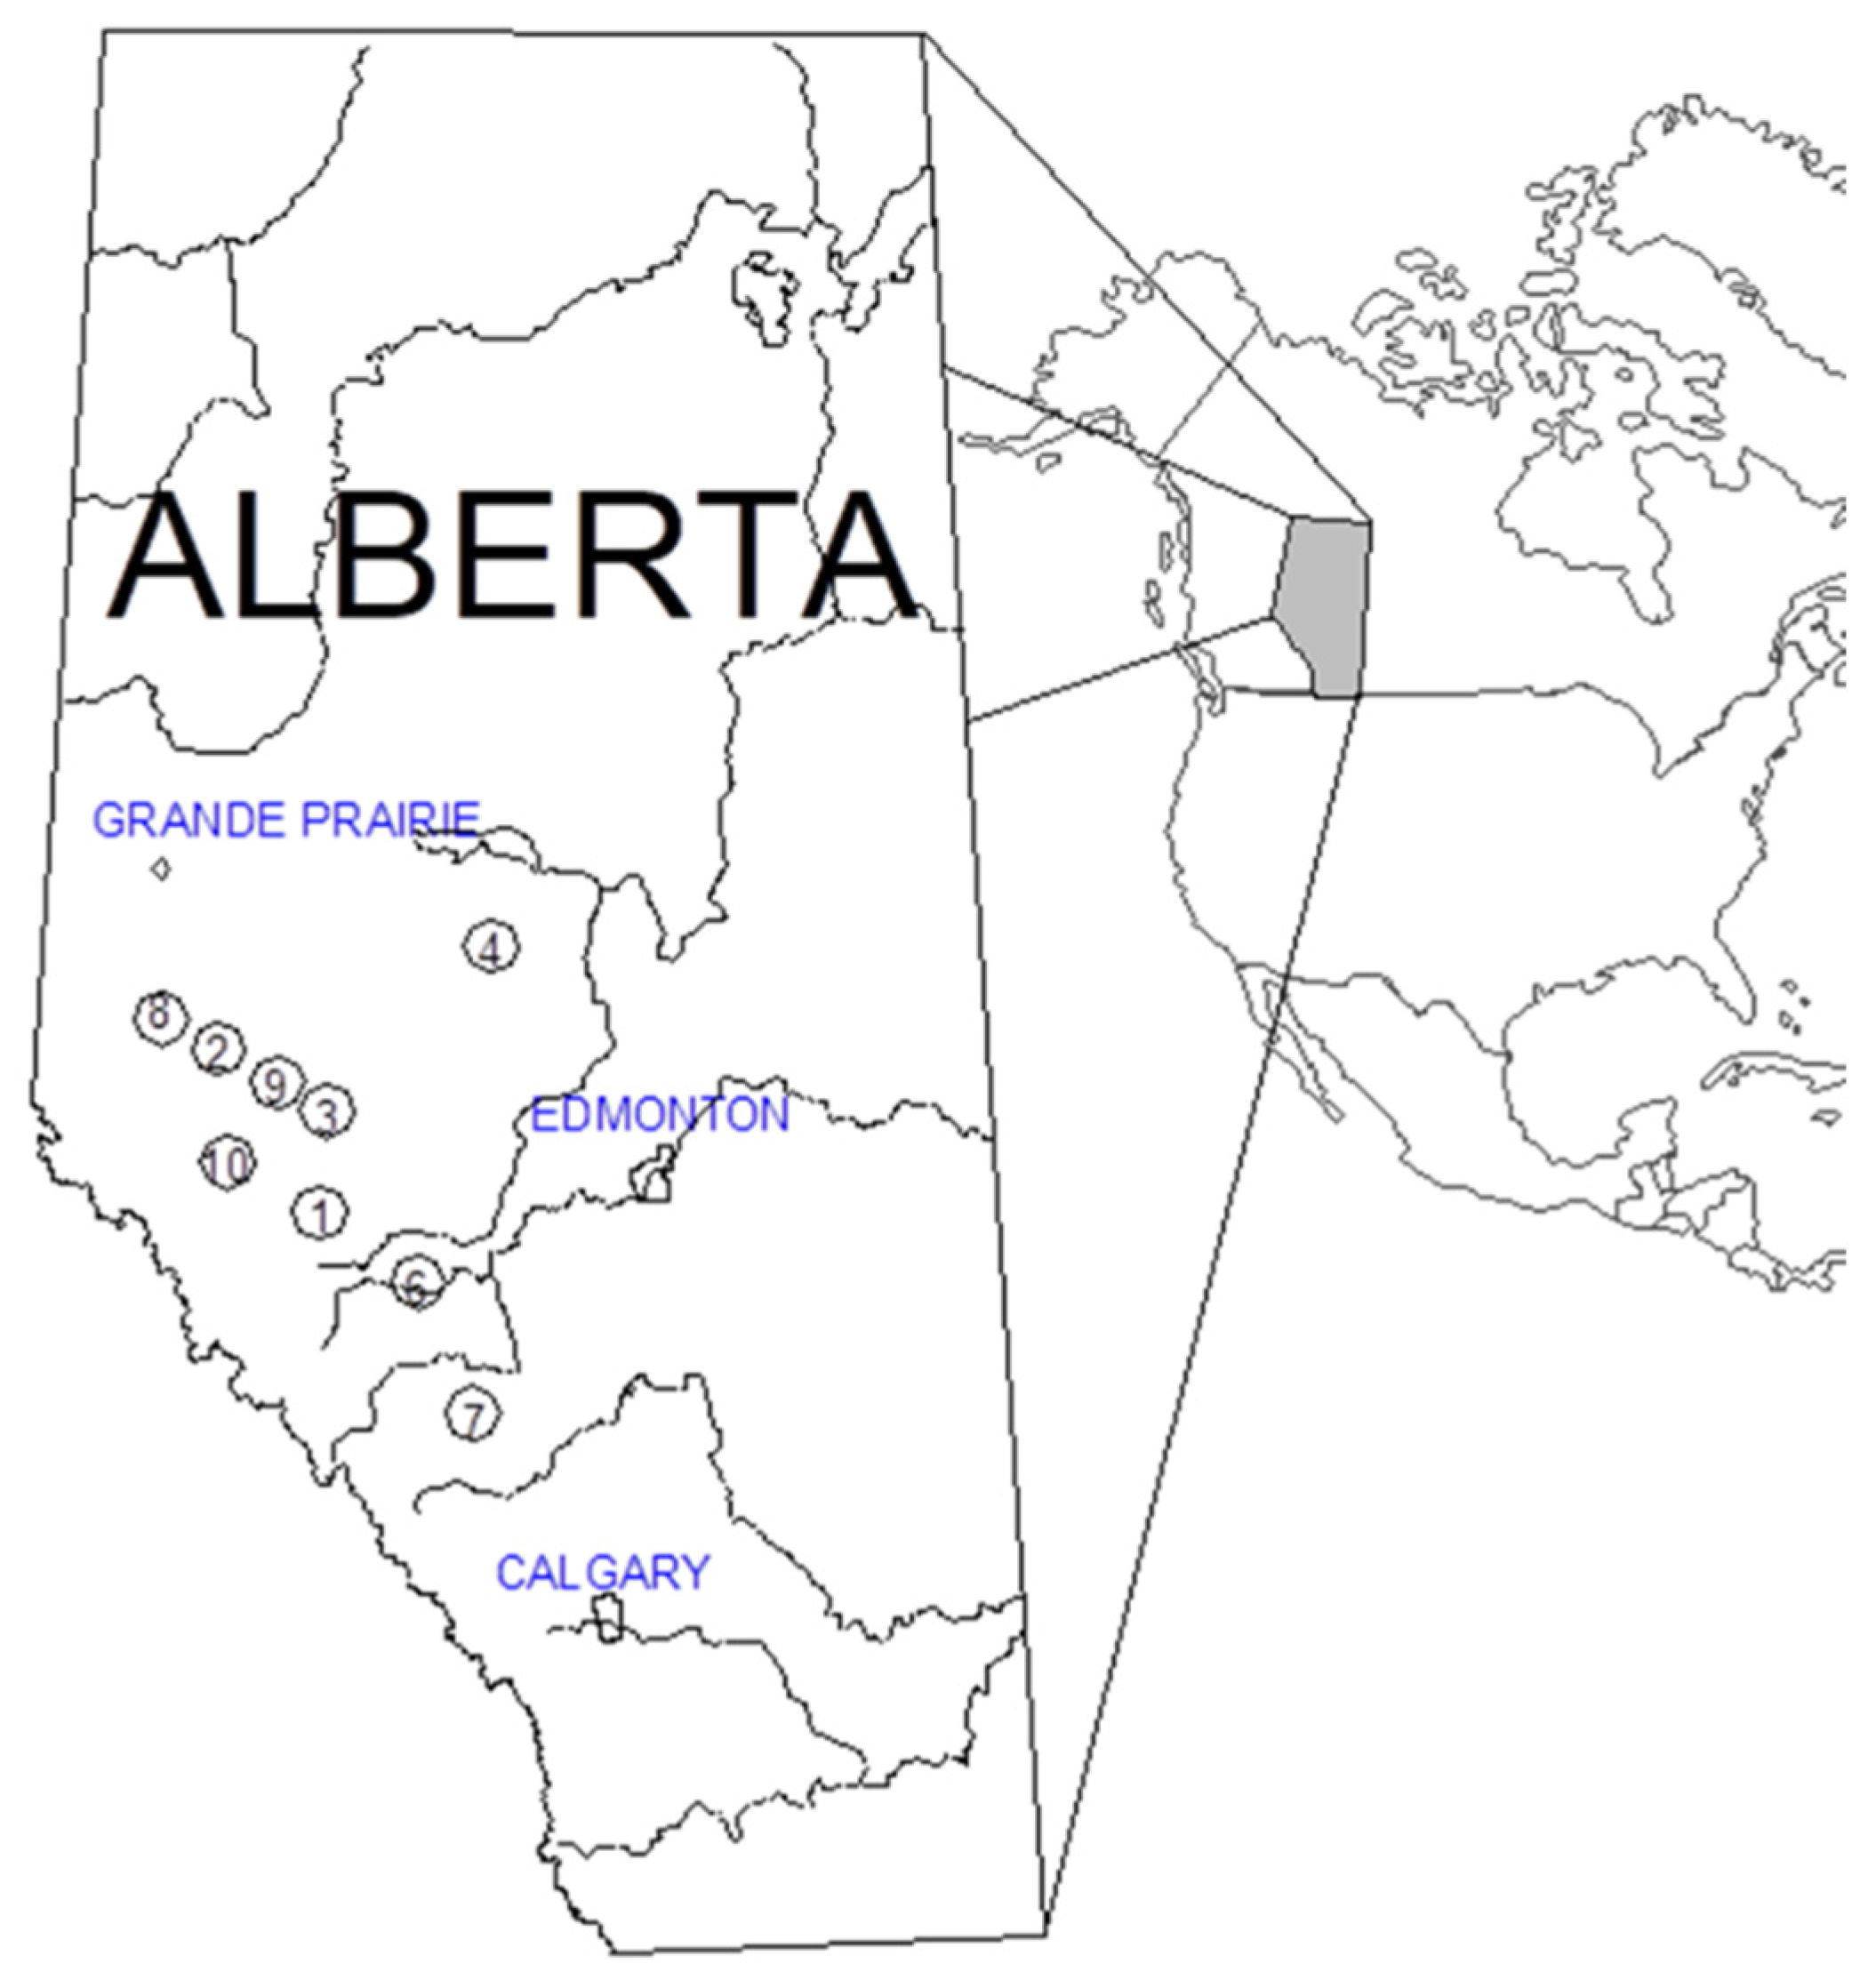
2.1. Sites

We are reporting changes in bulk density over 7 years for 9 sites that were operationally trafficked in western–central Alberta [6]. The primary objective of the study was to assess the effects that differences in soil wetness and trafficking intensity had on soil bulk density, air-filled porosity, and other changes in soil physical properties. Changes in bulk density, air-filled porosity, infiltration rate, and pore-size distribution immediately after trafficking have been reported for the original 14 sites [11,15,16]. Changes in soil aeration and soil morphology up to 4 years after harvesting have also been reported [14].
Although 14 sites were originally established, funding was only available to measure 9 of the first 10 sites over 7 years (Figure 1). One large cutblock contained two research installations, but only one was instrumented with a weather station for this phase of the project. The locations of the study sites are shown in Figure 1.
Prior to skidding, four replicated plots, 40 m on a side, were established about 50 m from the temporary harvest road (Figure 2). This location allowed controlled skidding of each replication and space for the skidder to realign the trees for decking with butts at roadside. Skidding cycles of 3, 7, and 12 empty and loaded passes were assigned to each plot. The same skid trail layout was used for all replications and sites. Control areas were skidded from the sides of the plot or down the center of the 12-cycle plot.
Except for site 2, the sites were harvested with a tracked feller-buncher operating parallel to a temporary harvest road. The feller-buncher made one pass across the site at a spacing of about 12 m. Bunches of whole trees were skidded to the roadside and decked with the butts of the trees at the edge of the road. Skidders were two-axle grapple skidders that weighed 16–17 mg, the width of tires ranged were between 0.8 and 1.2 man, and wider tires were on the rear of skidders (Table 1). Trees at site 2 were felled and processed at the stump with a harvester and log-transported with a small three-axle forwarder (Valmet 540). The compacted slash mat was thin, and the resulting soil compaction was not different from skidders [11].

2.2. Bulk Density

We are reporting changes in soil bulk density through the first 7 years (1994–2001) of the study. Bulk density was measured using stainless steel rings (7.6 cm outside diameter and 3 cm height); the wall thickness of the rings was 0.16 cm. Rings were pushed into the soil with a T-bar handle and a driving head [11]. Soil cores were collected from the midpoint of the 5, 10, and 20 cm depths and at random preselected locations in each skidding corridor and control. For each remeasurement period, the sample point was shifted 0.5 m along the corridor in the direction of machine travel from the previous measurement point and always in the same direction; the relative position across the corridor remained the same. Bulk density was measured within 2–3 days after each site was felled and skidded (year 0), and 1, 2, 3, 4 and 7 years later in late summer and early fall. A maximum of 192 samples were collected from each site and time (3 soil depths per point, 4 points per treatment, 4 treatments per replication, and 4 replications per site). Only a few samples were either lost, labels unidentifiable, and bags broken or removed from the database because a value was an outlier (4 + standard errors). The database contains approximately 10,000 values of bulk density.
Site 10 was not measured in year 4, and the last sampling date was year 6 because of a lack of funds in other years. When the data for Site 10 was excluded, nearly 80% of the resultant mean bulk densities changed by less than 0.01 Mg m−3. Thus, the effect that these two missing sample periods had on our analyses is assumed to be minor. We use values of bulk density collected immediately after skidding as the reference bulk density to assess whether there were significant changes in bulk density from 0, 3, 7, and 12 cycles of soil trafficking in subsequent years.

2.3. Soil Climate

The most representative replicate at each site, based on soil and terrain, was instrumented with a multiplexed CR10 data logger (Campbell Scientific Inc., Logan, UT, USA) to measure air and soil temperature in the control soil and adjacent 7-cycle skid trail. The distance between soil measurement points in these two treatments was between 6 and 8 m. Thermocouples were inserted horizontally at the interface between the LFH layer and mineral soil (0 cm depth) and at 5, 10, 20, and 50 cm depths. Soil and air temperatures were recorded every second hour. Snow depth was measured over the harvest-only treatment with a sonic range sensor (Campbell Scientific Inc.).

2.4. Statistical Analyses

The analysis of bulk density data was performed using SAS 6.11 [31], a doubly repeated mixed model with time and depth as repeated factors [32]. This step was followed by analyses of effects sliced by the interacting factor and differences among least square means for significant effects. Analysis of effects was conducted starting from higher-order interactions according to Milliken and Johnson [33].

3. Results

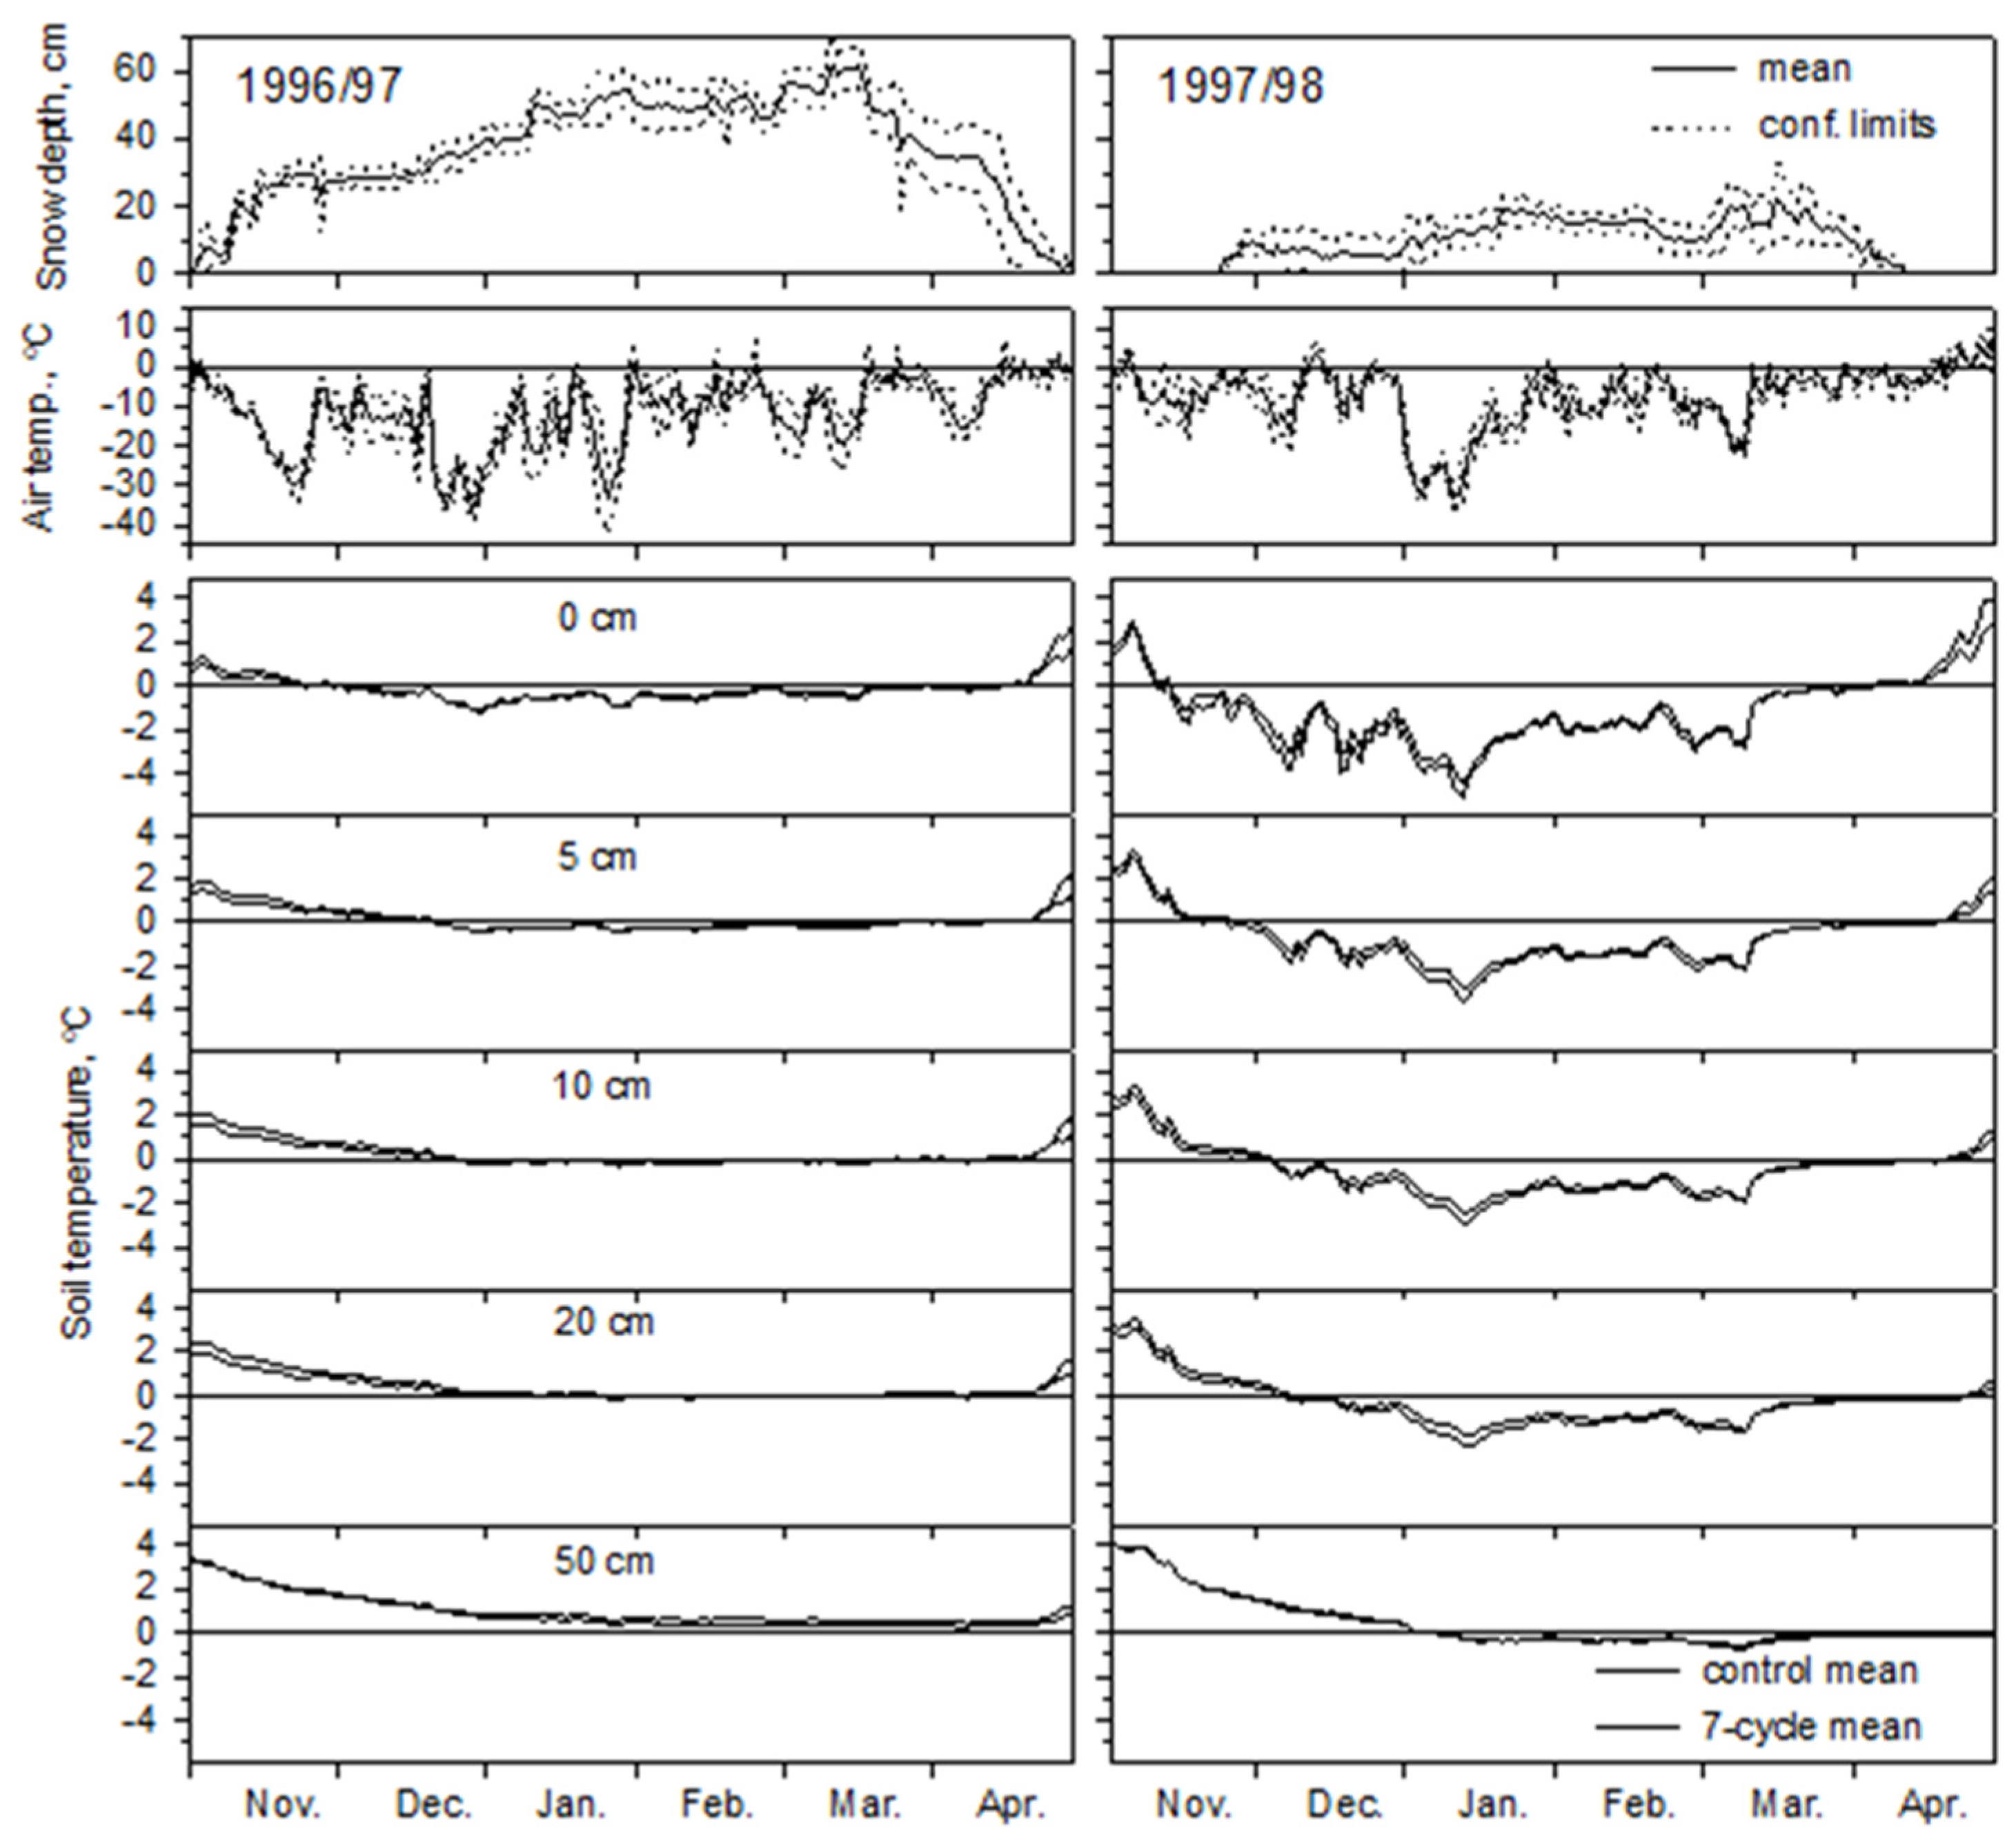
3.1. Soils and Weather and Soil Climate

The soils were all medium textured, ranging from sandy loam to clay loam (Table 1). The similarity in textures, organic matter content, and classifications reflect their common glacial till origins. Soil organic matter was low, averaging 0.036 kg kg−1 at the 5 cm depth and a third of that amount at 20 cm (Table 1). The sites are in the Upper and Lower Cordilleran Ecoregions of western Alberta [34]. The values of soil water content were obtained from each bulk density sample, and the soil water potential was measured with a handheld tensiometer next to each bulk density sample [11].
Differences in the depth of winter snowpack dominated the weather data over the 7 years that data were collected. The depth of snow cover was deeper the first three winters (1994–1997) than during the last four winters (1997–2001). Data to illustrate the differences between a heavy and light snowpack winter are shown in Figure 3. Although the sites were separated by up to 330 km, the confidence limits for snow depth within a year showed that the differences were small within the Upper and Lower Cordilleran Ecoregions of western Alberta [34].
Periodic cycles of colder air temperatures had a more pronounced effect on soil temperatures when snow depth was low (Figure 3). A snow depth of about 10 cm was insufficient to prevent soil temperatures from dropping to near −4 °C at 5 cm and −2 °C at the 20 cm depth when daily minimum air temperatures were between −25 and −33 °C (3–14 January 1998). A snow cover of at least 40 cm prevented soils from dropping below −1 °C at the surface despite daily minimum air temperatures of −30 °C and colder, which occurred four times during the winter of 1996–1997. Whether the soil water froze either time will be an important part of our discussion.
Snow depth was measured over the undisturbed litter layer of the harvest-only treatment. Most of the forest floor was compacted or displaced on the adjacent seven-cycle treatment. Nevertheless, the differences in soil temperature between the control and trafficked soil were less than 1 °C (Figure 3). Thorud and Duncan [35] previously reported that the removal of the forest floor had less effect on soil freezing than did the depth of snow cover.

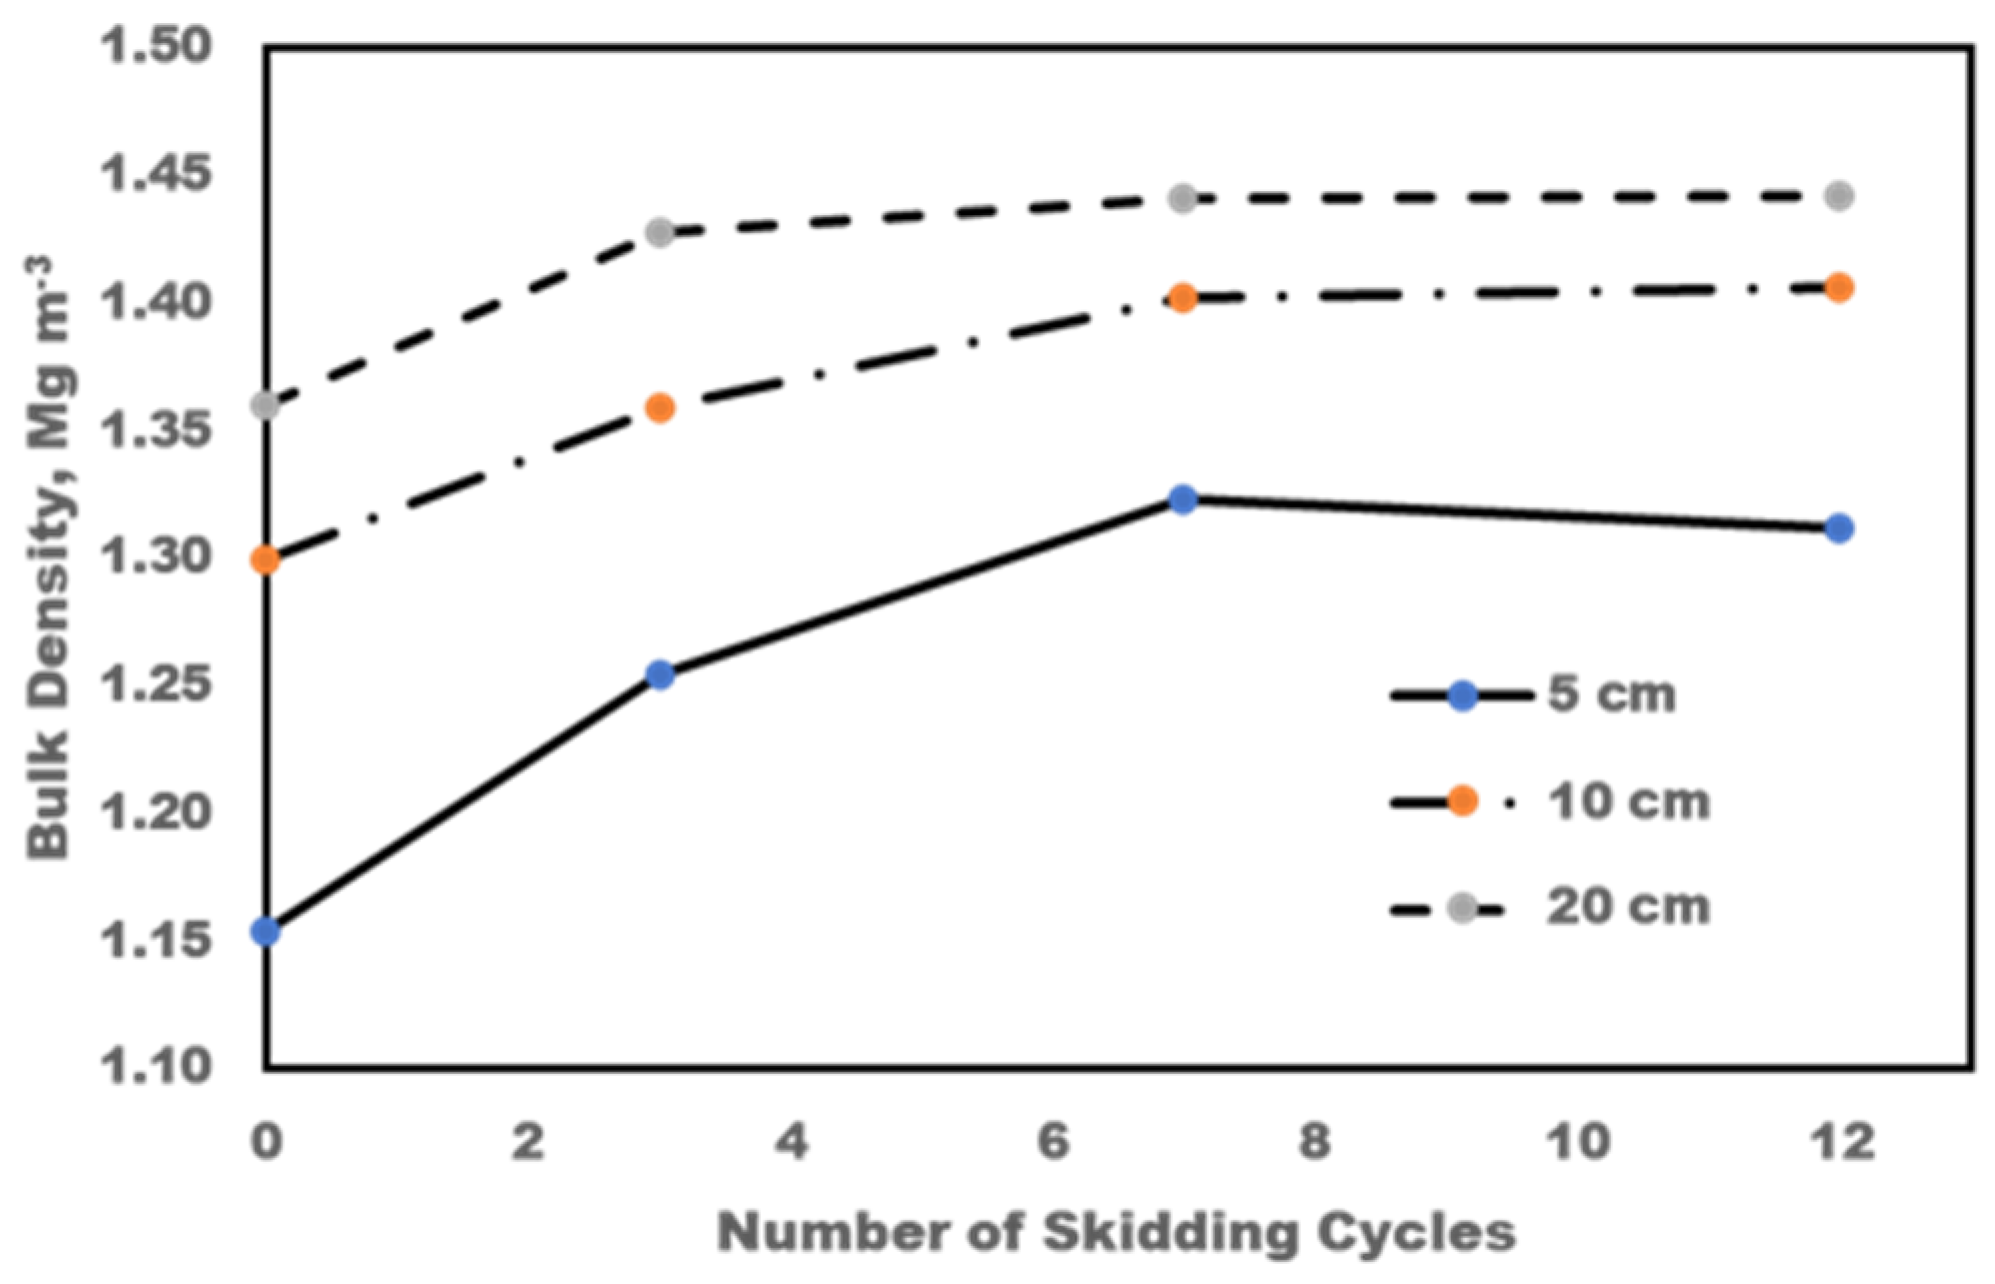
3.2. Skidding Traffic Increases Bulk Density

The mean values of bulk density and standard errors for each treatment, depth, site, and year are shown in Table 2. The only obvious trend in standard errors was values decreasing with depth—0.046, 0.039, and 0.033 Mg m−3 for depths of 5, 10, 20 cm, respectively.
The main effects model of the ANOVA show trafficking, depth, site, and year are all highly significant (p < 0.0000, Table 3). Soil depth is the dominant variable because bulk density increases rapidly with increasing depth (Table 4). The relationship is consistent for the entire period (depth and year interaction was not significant). These upland forest soils typically have a thin mineral topsoil with the B horizon beginning within 6 to 16 cm of the surface [36].
Only the three cycles of skidding treatment caused a significant increase in bulk density (p < 0.0000, Table 3, Figure 4). An increase in bulk density between 3 and 7 cycles occurred but was not significant. A factor contributing to the sustained increase between 3 and 7 cycles on these wet soils was that samples for bulk density were collected from predetermined points within the 6 m wide skidding corridor [11]. Therefore, some of the increase in bulk density between 3 and 7 cycles is attributed to increased areal coverage of the skidding corridor. By seven cycles, the traffic pattern had stabilized into a well-defined skid trail along the 40 m transect. Bulk density increases faster when compaction is only measured in wheel tracks [27].
Site was a significant factor (p < 0.0000, Table 4) because increases in bulk density from three cycles of skidding were only significant at six of the nine sites. After 12 cycles of skidding, the average increase in bulk density when trafficking at the 5, 10, and 20 cm depths were 0.161, 0.106, and 0.084 Mg m−3, respectively. The percentage increases in bulk density with a soil depth were 14.2%, 8.2%, and 6.2%, respectively. The low increase in bulk density is partly attributed to the use of wider tires on the pressure harvesting machines (Table 1). Compaction of the wettest of these soils reduced their low air-filled porosity until the soils were essentially saturated at the higher skidding cycles [11]. Essentially saturated soils contained trapped air at a high degree of saturation. Trapped air prevents a further increase in bulk density because water is incompressible and trafficking does not allow time for the water in the soil to drain [11,37]. Sites 6 and 8 were not significantly compacted and had soil water potentials lower than −25 kPa (Table 1). The increase in bulk density for these soils was less than 6% despite the soils having an average air-filled porosity of 0.32 m3 m3 after three cycles [11].

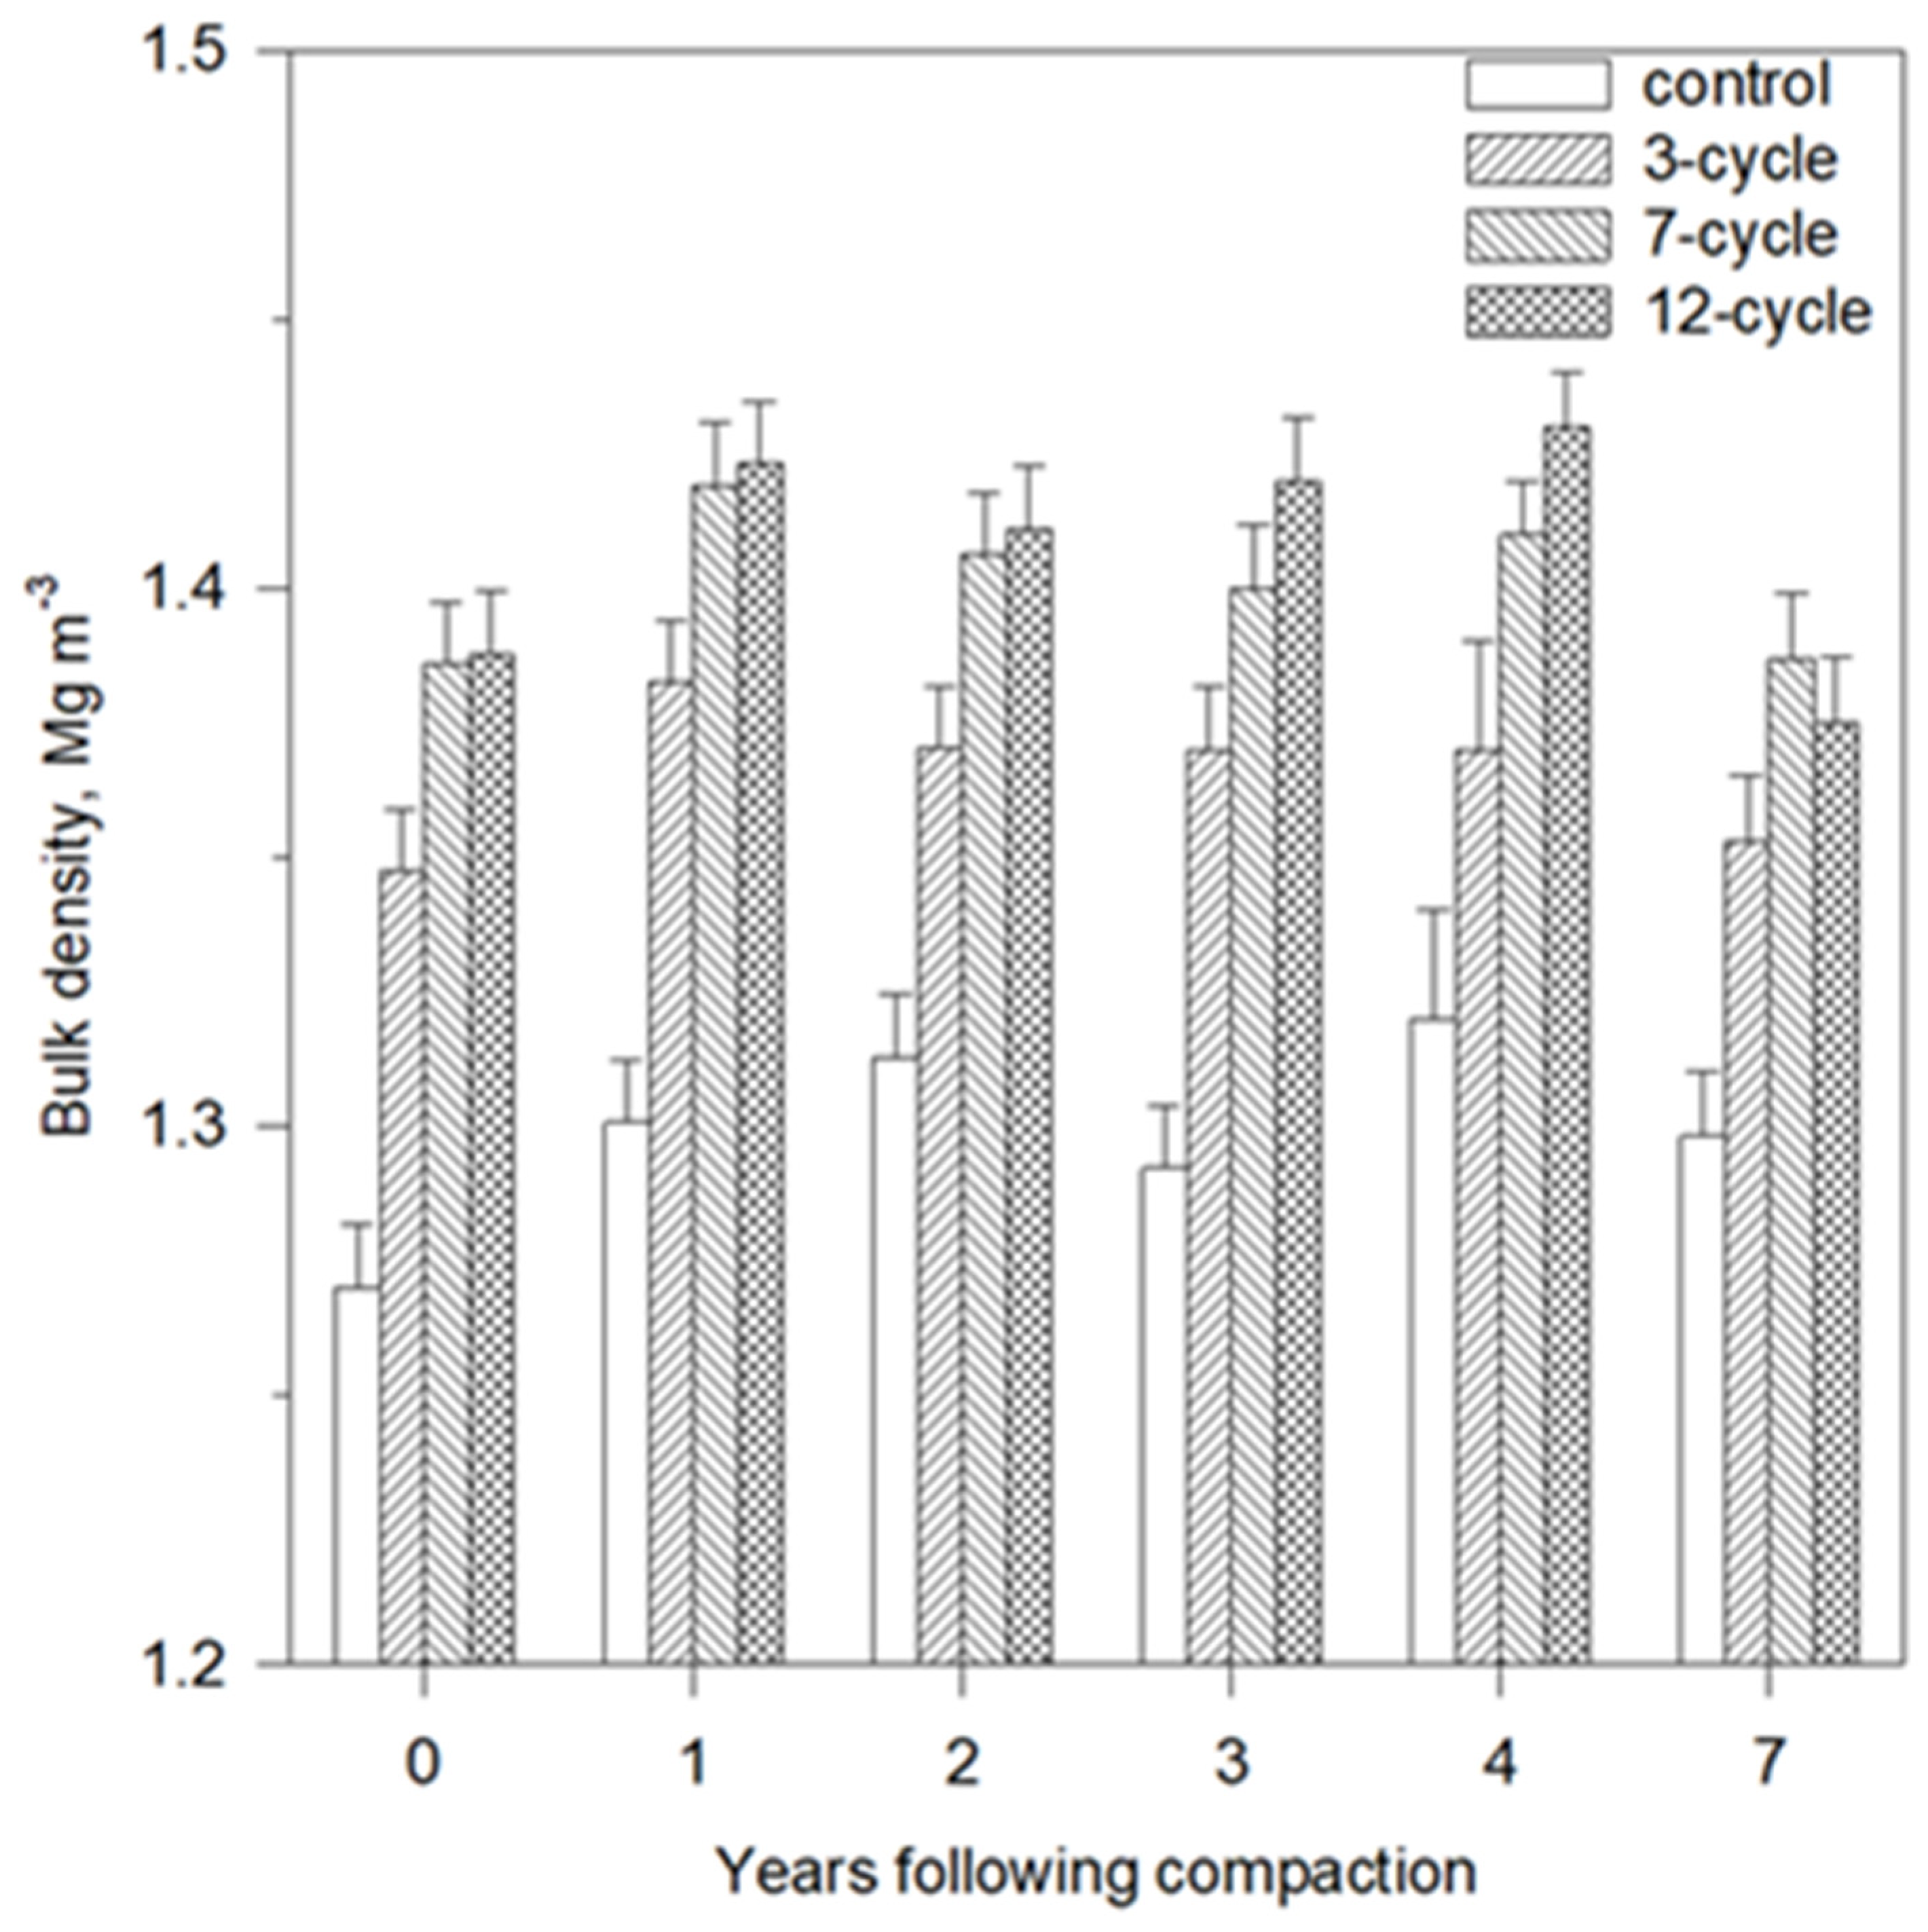
3.3. Postharvest Changes in Bulk Density

Changes in bulk density occurred in the 7 years postharvest (Figure 5). The first change was a significant increase in bulk density after 1 year. Year of sampling was a significant source of variation (p < 0.0000, Table 3) and was consistent across all levels of trafficking, including the harvest-only control. The interactions of traffic cycles and site, and trafficking cycles and year were not significant.
The significant increase in bulk density after 1 year was approximately 0.03 Mg m−3 (Figure 5). This is a 2.4% average increase in bulk density, which is about 25% of the original increase as a percentage. The postharvest increase in bulk density of trafficked soil persisted for three winters when the snowpacks were deep (Figure 3). The bulk density samples for year 4 were collected in the fall of 1997 prior to the first of four winters when the snowpack was thin. By year 7, the bulk density of the three trafficked treatments had decreased to values similar to those measured immediately following trafficking. During the intervening time period, these sites had potentially undergone a minor amount of freezing (Figure 3). However, the bulk density of the harvest-only soil had not returned to the values measured immediately after harvesting.
The site and year interaction (p < 0.0000) and the depth and year interaction (p < 0.0027) were both significant (Table 3). Sites 1 and 8 had the greatest year-to-year variation (Table 2). The year-to-year variation in soil wetness was greater on these sites than the other sites. The sustained wetness on some sites also caused changes in soil morphology and decreased soil drainage class within the first 3 to 4 years [14], the time period when two-thirds of the data were collected. Wet or dry soils can sometimes make it more difficult to consistently collect high-quality soil cores with a standardized protocol [28,30]. Field staff also reported that wet soil made the collection of core samples on some sites more difficult.
The interactions that are not statistically significant are also relevant to understanding the dynamics of natural recovery processes. Traffic cycles and year (p < 0.1976), and traffic cycles, depth, and year interactions (p < 0.7903) are most notable (Table 4). Their lack of significance indicates that soil to a sampling depth of 22 cm behaved as a homogeneous unit over the entire 7-year period. This is a further indication that the soil freezing, if it occurred, was ineffective, and postharvest soil biological processes were not sufficiently effective to loosen the soil compacted by skidding at any depth.

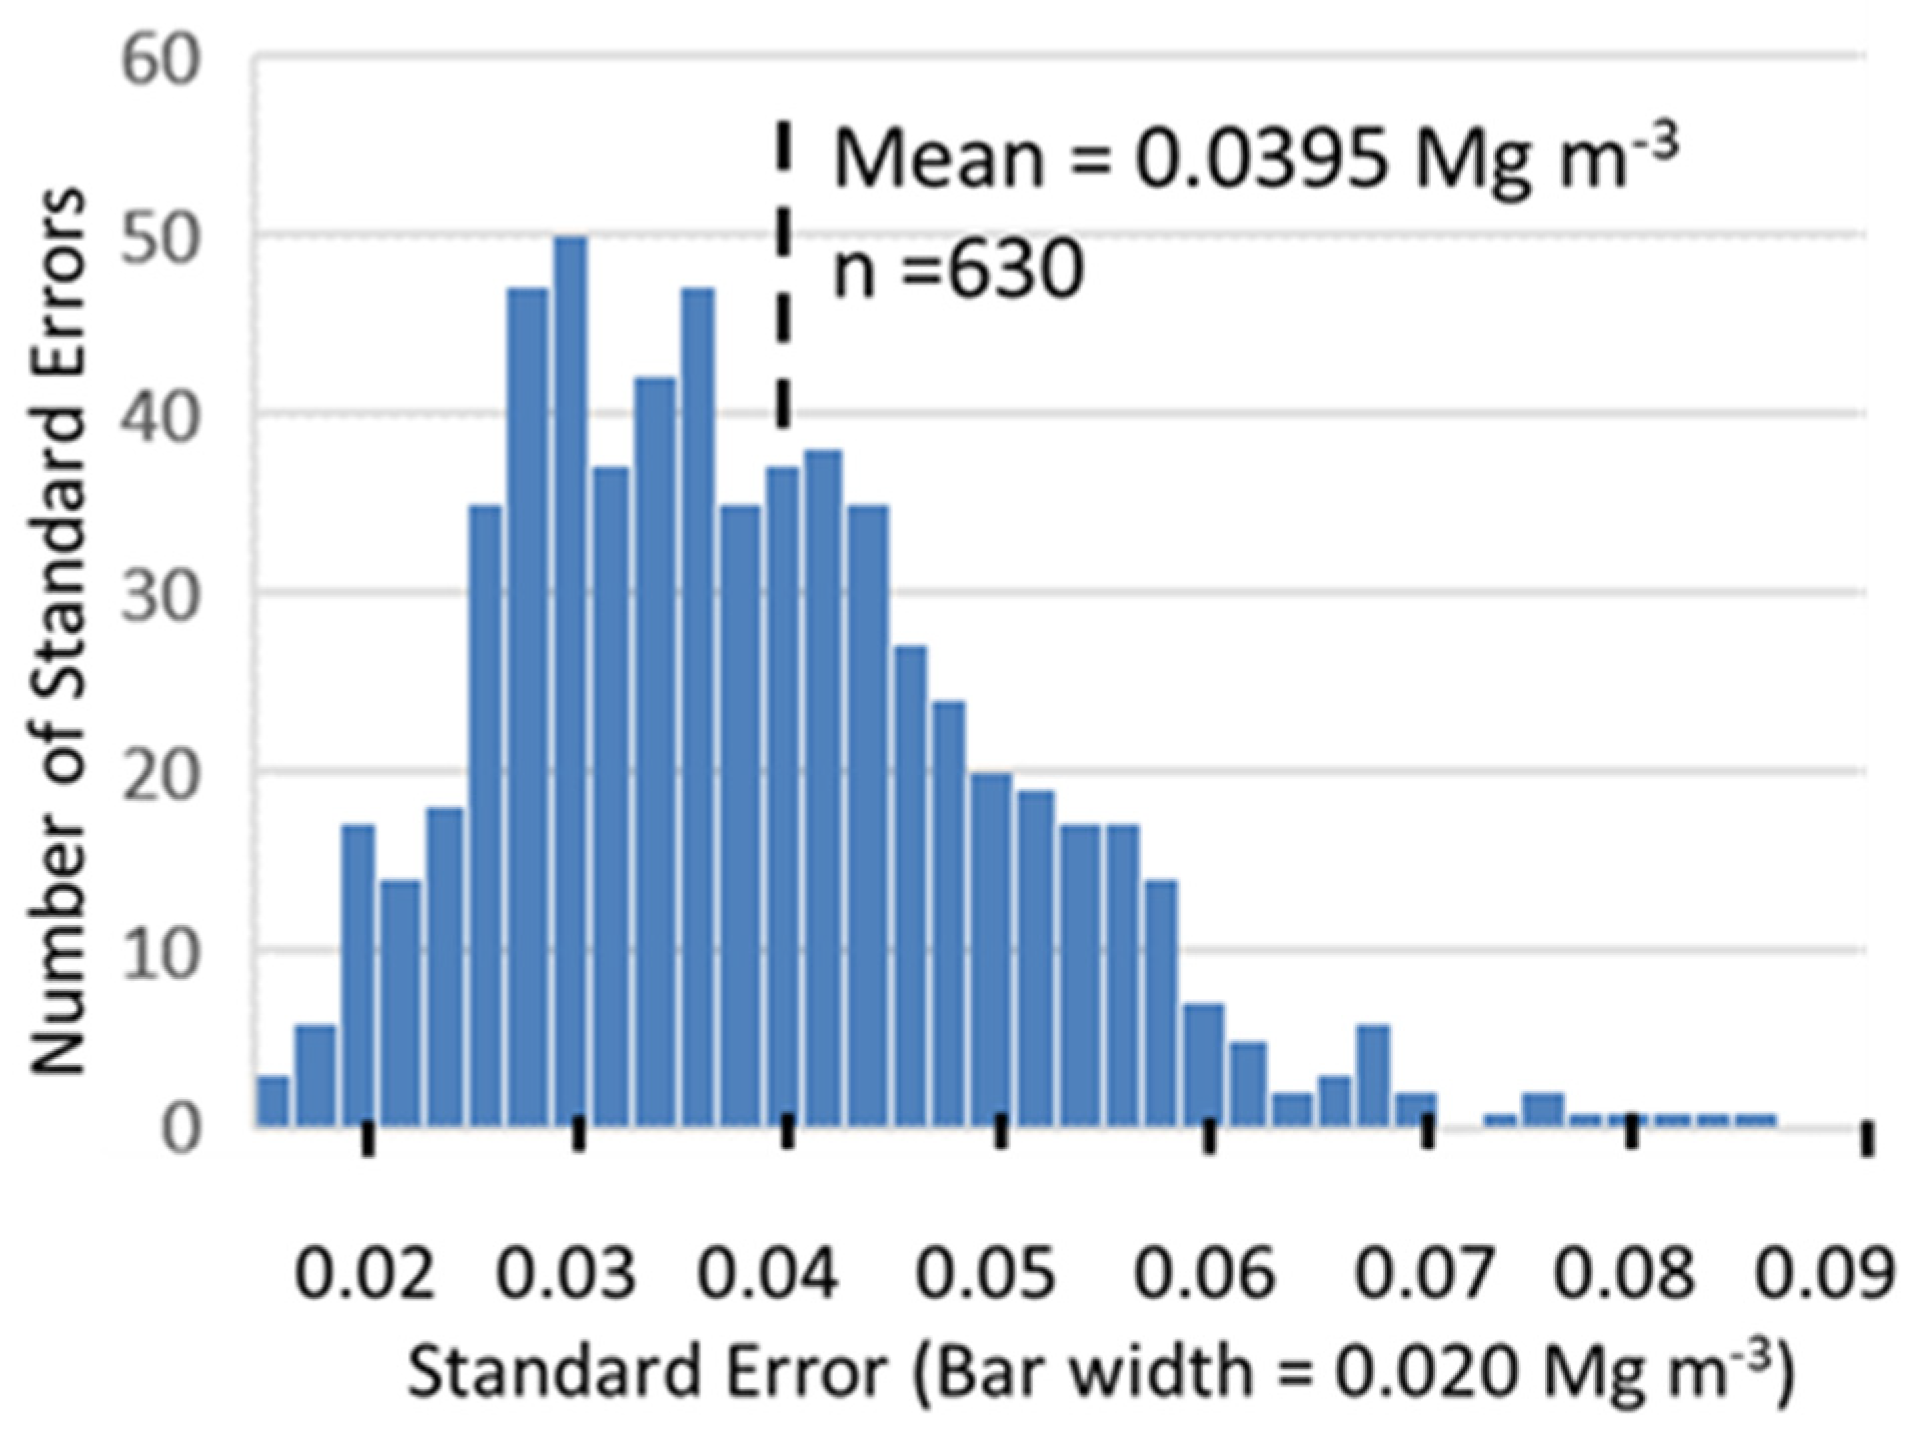
3.4. Measuring Bulk Density

The mean of the standard errors for bulk density for the three depths in Table 2 is 0.039 Mg m−3 with a standard deviation of 0.0149 Mg m−3 (Table 3). The median value is 0.037 Mg m−3. The only obvious tread in standard deviation was values decreasing with depth (0.046, 0.039, and 0.033 Mg m−3 for depths 5, 10, 20 cm, respectively). The inclusive value for kurtosis is 13.39, and the data are positively skewed to the right (2.54) for all depths. Hence, the variability of the values of bulk density is not described by a bell-shaped distribution curve, but by the widening of the lower portion of the curve [38] (Figure 6). Standard errors > 0.065 Mg m−3 represent 3.6% of the samples. Half of these values, six of the seven values > 0.095 Mg m−3, and 75% of all values occurred on Site 9 in year 3 (Table 2). Site 9 was the only site where a small amount of gravel was encountered [11]. Nevertheless, the mean standard error at Site 9 for year 0 was 0.042 Mg m−3, including a maximum value of 0.069 Mg m−3. At that time, a small amount of gravel was not regarded as a problem or likely to have a measurable effect on the value of bulk density. The sampling protocol required that sampling rings be pressed into the soil by body weight. Roots were normally the dominant factor causing a high discard rate of potential bulk density sampling points. At Site 9, small gravel caused more sample locations to be abandoned or cores discarded during trimming. Nevertheless, a temporary relaxation of the commitment to the sampling protocol on a difficult-to-sample site is most likely responsible for this one-time deviation. This deviation reinforces the need for a strict adherence to a sampling protocol.

4. Discussion

4.1. Measured Changes in Bulk Density

Ampoorter et al. [39], using a meta-analysis of data from several soil compaction studies including this one, found the number of skidding cycles was the only factor responsible for an increase in bulk density, but the relationship was weak. Soil water content was the only common measure of soil wetness considered and was not significant. However, other research has confirmed wet soils are more susceptible to compaction, and 60% to 90% of the increase in bulk density occurs in the first skidding cycle [27,40]. Soil water content alone is not a reliable variable to evaluate compactability of soil because the relationship between soil water content and maximum bulk density primarily depends on soil texture [17,41]. Higher compacted bulk density can only be achieved at lower soil water contents in course-textured soils [42]. Field measurements of soil water potential is a more reliable predictor of when a soil is most susceptible to compaction [11]. Soil resistance to compression increases as soil water potential becomes more negative [43].
Labelle and Jaeger [27] reported a slight increase in bulk density of soil in wheel tracks of forwarders lasting 12 to 24 months at two sites in New Brunswick, Canada. However, a statistically significant increase in the bulk densities of harvested and/or skidded soils after trafficking is unprecedented. Nevertheless, the statistical power of our data set and the consistency of the increase across all treatments and soil depths for at least 4 years make it difficult to assume that the increase is an artifact of sampling, natural variability, or an anomaly [44,45]. We believe that a combination of factors is contributing to the initial postharvest significant increase in bulk density, as well as a similar decrease in bulk density in the skidding treatments by year 7. In this situation, natural processes of decompaction [22] were ineffective. Instead, we considered postharvest changes in soil ecology [46], and the soil mechanics of deformation [41] as plausible factors responsible for an increase in bulk density after year 1 (Figure 5).
We hypothesize that the dynamics and intensity of the below-ground biological processes in conjunction with the protection of the soil provided by a mature forest canopy and intact forest floor allow mature forests to develop a slightly less dense soil. First, the upper 20 cm of forest soils commonly contain more than 80% of the roots in forested ecosystems [47]. To maintain this high root density, complex and dynamic processes of root mortality and regeneration are necessary, which are site and soil environment specific [48]. The root system also requires an equally active root rhizosphere biota to maintain its efficiency. As a result, a substantial proportion of annual gross primary production of forests is allocated to below ground processes [49]. These processes had not been disturbed on our sites for at least a century.
Clearcut forest harvesting removed the predominantly coniferous tree canopy, causing massive root mortality, stopping new root regeneration, and exposing the forest floor to more cyclic climatic variations. At the same time, the soil environment was also conducive to accelerated decomposition of organic matter [50]. As a result, a combination of root mortality, minimal root regeneration and rhizosphere maintenance, and accelerated rate of decomposition is most likely responsible for the natural consolidation of our soils. This consolidation resulted in the small significant increase in bulk density measured after year 1 (Figure 5). These combinations of processes would have occurred across all treatments but are solely responsible for the increase in bulk density in the harvest-only soil.
The increase in bulk density of trafficked soil after 1 year is attributed to a soil mechanics process. In soil mechanics, a small decrease in bulk density occurs whenever a consolidating force applied to a soil is removed [41]. The decrease in bulk density is referred to as rebound. Rebound is an instantaneous process that occurs once a load is removed from a soil and can only be measured in laboratory consolidation tests. Rebound is attributed to the elastic properties of soil [51]. The amount and kind of clay minerals in a soil are the primary determinants of the amount of rebound [52]. Consolidation tests of sieved agricultural soils have found that rebound results in a 2% to 5% decrease in bulk density after a consolidating load is removed. Rebound with similar decreases in bulk density has been reported for undisturbed forest soils [53]. Root systems of trees also increase soil strength [54] and would increase rebound because the root network would provide additional elastic resistance after a wheel passes.
For bulk density to increase in all trafficked treatments and depths at year 1, the soil apparently returned to its most dense condition, which occurred when the soil was under the wheel/track. The massive disruption of soil ecological processes [50] would have adversely impacted the biological elasticity of roots and other biota. It is this disruption that allowed the trafficked soil to ‘reconsolidate’ after 1 year. The reconsolidation is assumed to occur from the soil collapsing back into the same structural arrangement of soil particles and aggregates when under the wheel/track. The envisioned process is likened to expansion and contraction of a surface soil from the formation of ice lenses during a freeze–thaw cycle [55]. The increase was consistent across the three skidding treatments and three soil depths, which persisted for at least 4 years in the skidding treatments (Figure 5).
The values of bulk density at year 7 in all skidding treatments decreased to approximately the values measured immediately after trafficking (Figure 5). The most plausible explanation for the decrease in the values of bulk density for only the trafficked soil is that vegetation regenerated enough root growth and soil biota recovery to exploit the pore spaces created by rebound. A survey of vegetation cover of these sites at year 4 found the 12-cycle treatment had a vegetation cover of 80%, decreasing with less trafficking to the harvest-only area with a cover of 57% (Startsev, unpublished). Unpublished data on water infiltration and pore size distribution measured at year 5 at a few of these sites also inferred a slight improvement in macroporosity may have started. These data are supportive of the small decrease in bulk density measured by year 7 (Figure 5).
Soil on harvest-only areas failed to recover the porosity lost during the first year (Figure 5). More time is needed for successional development of a more mature forest canopy and forest floor. This development will support and protect the associated higher level of gross primary productivity found in soils under mature forests [48]. The process is generally slower in conifer dominated boreal forest ecosystems than elsewhere [49]. Other than the assumed role in reversing the rebound effect of soil compaction, biological processes had no other obvious role in restoring these compacted soils after 7 years.

4.2. Freeze–Thaw (F–T) as a Decompaction Process

Soil temperature and snow depth were measured on these sites because deep snow insulates the soil, which could limit the effectiveness of the F–T process [35]. The thermal conductivities of air, water, and ice are 0.025, 0.555, and 2.24 W m−1 K−1, respectively [56]. The thermal conductivities of snow range between 0.10 and 0.5 W m−1 K−1, which is primarily a function of density. In seasonal snowpacks, thermal conductivity also increases with the weathering of the snow grains [57]. The thermal conductivity of snow is 5 to 20 lower than that of mineral soils [56]. Hence, snow is a high-quality insulation that slows the loss of heat from the soil, which slows or prevents soil from freezing.
Our data confirmed the insulating potential of snow during the first 3 years of monitoring (Figure 3), and that a snowpack of at least 40 cm kept mineral soil temperatures close to zero despite cycles of air temperatures dropping to −30 to −20 °C [56]. Thinner snowpacks were measured in 1997/1998, and later years only resulted in soil temperatures decreasing to −4 to −2 °C to a depth of 20 cm. The low soil temperatures were not sustained when air temperatures returned to above −20 °C. The warming of the soil is due to the heat released from melting ice in the soil [56].
When subzero soil temperatures are sufficient to contribute to soil decompaction is a complex question. Soil water must first undergo the process of nucleation, which is a structural transformation of water, before ice crystals can begin to form and grow [58]. The process only occurs in soil when water is supercooled. The nucleation temperature can be a few degrees below 0 °C in a pure clay–water mixture [59]. In natural fine-textured soils, nucleation generally occurs at soil temperatures <−1 °C, and initially occurs on the chemically inert surfaces of grains of sand [60] and high silt soils [61]. The growth of ice crystals next to sand grains pushes the finer soil particles away as the ice crystals grow, which can leave clean grains of sand visible on the surfaces of soil peds. Nucleation generally occurs at the surface of the same sand grains and locations when soil undergoes repeated cycles of subzero temperatures [55].
Without an external supply of water, the water/ice ratio decreases as ice crystals grow. For a high silt soil with 75% silt and 25% clay, Azmatch et al. [61] found about half the soil water had changed to ice at a temperature of −0.65 °C. At a temperature of −9.0 °C, approximately 25% of the soil water remained unfrozen. Surface chemistry of clay minerals slows the decrease in the water/ice ratio as the clay content and its chemical activity increase [58]. Soil must be nearly saturated if only in situ soil water is available for growing ice crystals that will be large enough to decrease bulk density [62]. In this situation, the maximum volume expansion of a saturated soil remains less than about 3% at a soil temperature of −6.7 °C. Such conditions are not common unless the soils are poorly drained. The partial freezing of soil water, including those high in silt, can increase the tensile strength of soil by 100-fold at a temperature of only −0.65 °C [61]. Therefore, the measurement of subzero soil temperatures between −2 and 0 °C or encountering frozen surface soils in the field cannot automatically be interpreted as an indicator that the F–T process may be decompacting the soil (Figure 3).
The environmental conditions for the F–T process to effectively decompact soil requires a substantial amount of soil water moving upward from deeper in the soil [58]. When the freezing front is stationary, water and vapor moving upward from lower soil layers causes ice crystals to grow into ice lenses and heave the soil upward [60,63,64]. The freezing front will advance deeper into the soil when the heat loss to the atmosphere exceeds the supply of water and heat to the freezing front from deeper in the soil. This advance can be triggered by colder air temperatures, decreasing unsaturated hydraulic conductivity of the nonfrozen soil because the deeper soil no longer contains as much water, or a combination of the two. Freezing of drier soil deeper in the profile will only produce small ice crystals within soil pores that cannot effectively decompact the soil [62]. This is a critical factor limiting the effectiveness of the F–T to decompact subsoils.
A sustained cycle of cold temperatures is more effective at cooling the soil profile. Abrupt decreases in soil temperature do not penetrate soil as deeply as slowly changing soil temperatures of the same amplitude occurring over a long period of time [65]. Snow cover, even a thin one, also moderates the temperature fluctuations (Figure 3) [66]. A sustained balancing of the heat loss to the atmosphere and input of heat from deeper in the soil is called the zero-curtain effect [67]. The depth of the zero curtain in our soils was about 50 cm. The most notable feature of the zero-curtain effect was a synchronized decrease in soil temperature at all depths during the cold cycle starting on 3 January and persisting to 14 January 1998. The effect caused a slight change in the amplitude of soil temperature with increasing depth, and the absence of the normal time lag associated with the peak decreased in soil temperature with increasing depth [65]. This response is indicative of soil cooling as a result of the simultaneous growth of in situ ice crystals at all depths. Otherwise, water flowing upward in the soil during the cold cycle would have increased the volume of ice forming near the surface, and soil temperatures deeper in the soil would not have decreased as much or as quickly with increasing soil depth. As air temperatures increased at the end of the cold cycle, the recovery of soil temperatures was also a synchronized response. This response occurred because the source of most of the heat warming the soil at these depths originated from the latent heat of fusion released from the in situ melting of ice crystals. Our interpretation is also supported by the low saturated hydraulic conductivity of less than 2 × 10⁻⁶ m sec−1 in these fine-textured soils starting at a depth of 10 cm [14]. The actual rate would have been 100 or more times slower than this value because of the lower viscosity of subzero water and the formation of ice crystals blocking the larger pore spaces. The zero-curtain effect persisted until early March. The occurrence of the zero-curtain effect under seasonal snowpacks may be a limited phenomenon in northern temperate forests. The effect would not occur in the absence of a temperature moderating snowpack or a sustained cycle of cold air temperatures occurring before the snowpack was established [56]. It would not have been nearly as obvious without a temporary large decrease in air temperatures previously discussed (Figure 3).
The F–T process is potentially most effective in surface soils where the cycles of freezing soil temperatures are greater and occur more frequently [55,60]. The potential for ice formation to decompact soil is reduced because ice normally forms horizontal lenses in the soil that collapse when the ice melts [55]. In forestry, this phenomenon is responsible for frost heaving small germinates and new planted seedlings out of the ground [60]. In soil engineering, most of the adverse impacts of F–T on roads occur from one to three F-T cycles; additional cycles cause minimal additional adverse impacts [68,69]. The F–T process in subsoils is seldom effective because cycles of F–T are fewer, unsaturated permeability much lower, and external water supply insufficient. While the surface soils of severely compacted temporary forest roads on high clay content soil have been partly loosed to depths of 10–15 cm, the subsoil remains compact and nonforested after 28 years [70]. The subsoil in two early wagon roads crossing the prairies in southeastern Alberta have also remained compacted after 80 and 100 years [71]; these soils are assumed to have frozen every year.

4.3. Shrink–Swell (S-S) as a Decompaction Process

As a decompaction process, S–S primarily depends on the presence of plastic clay minerals [22]. However, soil must undergo numerous cycles of wetting and drying for evapotranspiration and precipitation cycles to be effective. The clearcut harvesting and mostly intact forest floor on these sites had severely limited evapotranspiration. Five of the sites were imperfectly or poorly drained, and the other four had an argillic subsoil horizon prior to harvesting [14]. As a result, the excess soil moisture reduced soil aeration in the compacted and harvest-only soils on four of these sites, and all sites were moist to wet when sampled in late fall. The future effectiveness of the S–S process in these soils will be poor because other forest soils in the center of the study area have a low plasticity index [70]. A low plasticity index is indicative of soils with lesser amounts of expandable clay minerals [41,59].

4.4. Management Implications

Trafficking and rebound collapse caused a 16.6% increase in bulk density at 5 cm, decreasing to 8.6% at 20 cm for the significantly compacted soil (Table 2). The increase in bulk density only decreased the macropore space [15], but these are the pore sizes primarily responsible for gas diffusion and air permeability [72] and water permeability on these sites [15]. These boreal forest soils commonly have poor internal drainage because they are finer-textured soils and the sites have low slope classes [73]. The undisturbed soil at six of these nine sites had mottles within the top 20 cm [1]. Harvesting and trafficking caused four of these sites to exhibit morphological changes, and two of these sites changed from imperfectly drained to poorly drained soil after 3–4 years because of prolonged anaerobic soil conditions.
Mechanical site preparation is commonly used to ensure the prompt reforestation of conifers in harvested areas across the boreal forests of Alberta. Disc trenchers and small mounders mounted on wheeled skidders are most common; on wetter soils, larger mounds are built with tracked excavators using mounding buckets. Hence, the sustained poor drainage and loss of air-filled porosity [11,14,15] will likely require a switch to the more aggressive and expensive mechanical site preparation practices on moderately well-drained soils and other more poorly drained areas.
The skidders trafficking soils in this study were in the 16–17 Mg weight class; new skidders are in the 22 + Mg class. New machines have the ability to compact soil to a higher bulk density across a wider range of soil wetness. These changes will drive the need to use aggressive forms of site preparation on more areas and more frequently.
The biological consequences of a postharvest increase in bulk density are unlikely to be a long-term ecological concern on most boreal forest sites in the region. The 25% increase in postharvest bulk density was important on these sites because of the dynamic changes occurring in air-filled porosity and redox potential [11,14]. The postharvest increase in bulk density is also a short-term issue (Figure 5) but has the potential to adversely affect the prompt reforestation of some sites at a critical time. Whether the current change in drainage class is a long-term issue is probably unlikely. The data show that changes in redox potential is dynamic and sensitive to the establishment of a new vegetation cover [14]. Therefore, a long-term change in drainage class in these soils from the machines used is probably unlikely. However, changes in machine systems and climate could result in a different outcome because natural drainage class is the dominant factor affecting site productivity of Picea glauca (Moench) Voss [74].

4.5. Measuring Bulk Density

Bulk density is an increasingly important soil property for measuring the ecological consequences of soil compaction, assessing soil health [75], and quantifying soil carbon storage. Hence, the collection of bulk density samples using the core (cylinder) method requires a higher level of precision and quality control. Page-Dumroese et al. [28] also reported these types of issues affect the monitoring of field trials and operational practices in forestry.
The standard errors decreased with depth, which is attributed to more natural soil perturbations closer to the surface and differences in morphological soil development (Table 1 and Table 4). Nevertheless, kurtosis and skewness were consistent for the three depths. The variance in standard errors widened at the base and was shewed to the right. The range of values may have only started to decrease at 20 cm. The consistency of these results suggests that this distribution should be regarded as a normal soil behavior (Figure 6) [59]. The largest standard errors mostly occurred at Site 9 at year 3 and were attributed to site conditions and a probable lapse in diligence in discarding some soil cores (Figure 6). These extreme values were obvious, but other sources of errors may not be during the collection of soil cores.
The widening of the base of the standard error histogram suggests two sources of variation are likely (Figure 6). First is the natural variability of soil bulk density. These data suggest that the minimum is about 0.02 Mg m−3. McNabb and Boersma [53] reported standard errors between 0.023 and 0.059 Mg m−3 (n = 19–23) for four forest soils collected at a higher-quality control standard (7–12 cm depth) because the cores were used in soil mechanics tests. The lowest values were for three Andisols that were quite uniform, and the highest value was for an older Xeric Haplohumult with more spatial and profile variability. Forest soils likely have higher natural variability than soils in other ecosystems because of large root decay, windthrow, and other types of perturbations that occur close to the soil surface.
The second source of variation in standard error is the quality control used during the collection of soil cores. These two errors are not necessarily additive but are responsible for widening of the base of the distribution of the standard errors (Figure 6). Grossman and Reinsch [29] concluded without evidence that mass had less effect on bulk density than sample volume. D2937-17 [76] recommends a core volume of approximately 940 cm3, which is the size of the mold used in the standard compaction test, but 7.5 cm diameters have worked well in most agroforestry tests of cylinder sizes [77,78]. A slide-hammer assembly with a removable sleeve with a diameter of about 7.5 cm has long been regarded as a superior design for agroforestry applications [29,79,80]. However, Grossman and Reinsch [29] provided an equation to calculate whether a hammer-driven core sampler is a good design. The specification is the ratio of the cross-sectional area of steel/material in the sampler (i.e., inside wall thickness of the cylinder) relative to its outside diameter. For double-walled samplers, these measurements include the sleeve and driving cylinder. The ratio of the area in material(s) in the sample cylinder to the outside area of the cylinder should not be greater than 10% to 15%. Hvorslev [81] established these values, and they have been part of the ASTM standard for decades. For our stainless steel rings with a wall thickness of 0.16 cm, the ratio is 8.3%. For a double-walled sampler with a diameter of 7.5 cm and a total wall thickness of 0.6 cm, the area ratio is 27%, and for a smaller sampler, 5 cm double-walled sampler with a wall thickness estimated at 0.5 cm, the ratio is about 32%.
The higher ratio requires more of the energy applied to a driven core sampler to displace soil so that the cutter edge can advance deeper. As a result, thick-walled samplers are far more likely to fracture and loosen dry or compacted soils, compact wetter cohesive soils, or limit the entry of soil into the ring. Woody roots in forest soils compound this problem when a driven core sampler temporarily bounces on an uncut root. In cases where the ring does not fill with soil, Gross and Reinsch [29] and Hao et al. [82] propose measuring the height of the unfilled ring with a ruler or filling the void with beads to correct for soil volume. This is an unacceptable practice and becomes a major source of unknown error in the measurement of bulk density. Soil engineers have long measured the height of soil within a sampling cylinder and compared it with the depth that the cylinder penetrates the soil as a measure of how severely the soil core had been disturbed [81]. As a result, the North American project to evaluate soil health lists Blake and Hartge [80] as their preferred methods for measuring bulk density [75].
Blake [79,80] considered the volume changes in soil from shattering or compaction to be a genuine problem. D2937-17 [76] provides a design specification for a driven sampler with a thin-wall sampler to reduce these errors. The design can be scaled to a 7.5 cm diameter ring. The design includes a space in the driving head for the expansion of a sample if it shatters. If the driving head is removed prior to extracting the cylinder, the elevation of the soil inside the ring can be compared with the surrounding soil. This is a critical practice to ensure that only high-quality soil cores are extracted from the soil profile. A tolerance for error should be established, and samples failing to meet this standard should be abandoned while still in the ground. D1937-17 [76] also provides helpful advice on the soil and conditions when the drive-cylinder method should not be used as well as several recommendations when it may not be applicable.

5. Conclusions

This paper reiterates the point that significant compaction measured as an increase in bulk density is related to soil water potential, which can be measured in the field with a handheld penetrometer. The value applies to a specific weight class of forestry machines. Heavier machines will compact soil to a higher bulk density and do so across a wider range of soil wetness. Hence, the applicable value of soil water potential will be lower because heavier machines can significantly compact soil at a lower soil water content.
Harvesting and soil trafficking resulted in a slight but statistically significant increase in bulk density after 1 year on these sites. Older mature forests are viewed as providing a deeper forest floor and mature canopy that protects natural processes that have tended to loosen soil over an extended period of time, which cannot be maintained after harvesting. The bulk density of all trafficked soil increased by the same small amount, which is attributed to soil rebound. These are natural soil mechanical and biophysical responses to a soil perturbation; they have always happened. Only the size and quality of our database allowed us to document them.
This project confirms that small, significant increases in bulk density can have site- and soil-specific ecological consequences. The ecological consequence on these sites was that compaction prolonged anaerobic soil conditions in soils with partially impaired drainage. The dynamics of the process indicate that the shift will be temporary. Reforestation will shift the water balance of these sites back to a less anaerobic environment, but in the interim, more aggressive forms of site preparation will be necessary to promptly reforest the sites.
Monitoring of air and soil temperatures found that subzero soil temperature is not indicative of a freeze–thaw process that could decompact soil. As a decompaction process, the freeze–thaw process is complex with exacting requirements of soil texture and mineralogy, soil permeability, temperature gradients in the profile, and external supply of water. These requirements were not met, and the bulk density of trafficked soil remained unchanged. A snow depth of 40 cm in these ecotypes effectively moderated soil temperatures with and without an intact forest floor.
Recent changes simplifying the measurement of bulk density using the core method and videos showing the ease with which sample rings can be hammered into the ground are misleading. The collection of high-quality core samples for bulk density and other physical tests has never been easy. When bulk density is used as an indicator of soil health, monitoring the sustained impact of soil compaction on ecosystem services, and soil carbon storage, the precision of the values of bulk density obtained by the core method becomes paramount. The protocol for the collection of bulk density using the core method must be updated with an emphasis on the use of better practices and specifications for the core method and a rigorous commitment to a quality control and assurance program in the field.

Author Contributions

Conceptualization, D.H.M.; methodology, D.H.M.; formal analysis, A.S.; investigation, all; resources, D.H.M.; data curation, A.S.; writing, D.H.M.; visualization, D.H.M.; supervision, all; project administration, all; funding acquisition, all. All authors have read and agreed to the published version of the manuscript.

Funding

The data collection and original publications were performed while both authors were employed by the Alberta Environmental Centre, Alberta Environment at Vegreville, Alberta, which became part of the Alberta Research Council toward the end of the data collection period. Research sites and forest harvesting equipment for the field trials were provided by Canadian Forest Products Ltd., Weldwood of Canada Ltd. (Hinton Division), Weyerhaeuser Canada Ltd. (Grande Prairie), Sundance Forest Products Ltd., Sunpine Forest Products Ltd., Millar Western Industries Ltd., and Alberta Newsprint Company. These companies also provided direct funding for the project via the Alberta Forest Development Trust, Government of Alberta. Funding for the first 3 years was also provided by Foothills Model Forest (now fRI Research), Hinton, Alberta. The analyses and preparation of a draft report of these data were initially made possible by a grant from the Forest Resources Improvement Association of Alberta (FRIAA), Open Funds Initiative, Government of Alberta, to ForestSoil Science Ltd. Final paper and interpretations are personal contributions.

Institutional Review Board Statement

Not applicable.

Data Availability Statement

Data may be available from the senior author.

Acknowledgments

The authors thank Susan Paquin and Rod Kusiek for their technical and laboratory support and as crew leaders for the collection of soil samples, and the field crew; Michelle Hiltz for advice on statistical analyses; and reviewers.

Conflicts of Interest

The funders had no role in the design of the study; in the collection, analyses, and interpretation of data; in the writing of the manuscript; or in the decision to publish the results. DM has also done research and development on soil restoration implements and practices, which has resulted in Canada Patent No 2586933, and U.S. Patent No 8176993 B2, a ‘Ripper Plough for Soil Tillage’.

References

  1. Rosenberg, N.R. Response of plants to the physical effects of soil compaction. Adv. Agron. 1964, 16, 181–196. [Google Scholar] [CrossRef]
  2. Greacen, E.L.; Sands, R. Compaction of forest soils: A review. Aus. J. Soil Res. 1980, 18, 163–189. [Google Scholar] [CrossRef]
  3. Froehlich, H.A.; Aulerich, D.D.; Curtis, R. Designing Skidtrails Systems to Reduce Soil Impacts from Tractive Logging Machines; Research Paper 44; Oregon State University: Corvallis, OR, USA, 1981; p. 15. [Google Scholar]
  4. Froehlich, H.A.; McNabb, D.H. Minimizing soil compaction in Pacific Northwest forests. In Forest Soils and Treatment Impacts. Proceedings of the 6th North American Forest Soils Conference Knoxville, TN, USA, 19–23 June 1983; Stone, E.L., Ed.; The University of Tennessee: Knoxville, TN, USA, 1984; pp. 159–192. [Google Scholar]
  5. Hamza, M.A.; Anderson, M.A. Soil compaction in cropping systems: A review of the nature, causes, and possible solutions. Soil Till. Res. 2005, 82, 121–145. [Google Scholar] [CrossRef]
  6. Horn, J.; Vossbrink, J.; Peth, S.; Becker, S. Impact of modern forest vehicles on soil physical properties. For. Ecol. Manag. 2007, 248, 56–63. [Google Scholar] [CrossRef]
  7. Cambi, M.; Certini, G.; Neri, F.; Marchi, E. The impact of heavy traffic on forest soils: A review. For. Ecol. Manag. 2015, 338, 124–138. [Google Scholar] [CrossRef]
  8. Alakukku, L.; Weisskofp, P.; Chamen, W.C.T.; Tijink, F.G.J.; van der Linde, J.P.; Pires, S.; Sommer, C.; Spoor, G. Prevention strategies for field traffic-induced subsoil compaction: A review: Part 1. Machine/soil interactions. Soil Till. Res. 2003, 73, 145–160. [Google Scholar] [CrossRef]
  9. Chamen, W.C.T.; Alakukku, L.; Pires, S.; Sommer, C.; Spoor, G.; Tijink, F.; Weisskofp, P. Prevention strategies for field traffic-induced subsoil compaction: A review: Part 2. Equipment and field practices. Soil Till. Res. 2003, 73, 161–174. [Google Scholar] [CrossRef]
  10. DeArmond, D.; Ferraz, J.B.S.; Higuchi, N. Natural recovery of skid trails: A review. Can. J. For. Res. 2021, 51, 948–961. [Google Scholar] [CrossRef]
  11. McNabb, D.H.; Startsev, A.D.; Nguyen, H. Soil wetness and traffic level effects on bulk density and air-filled porosity of compacted boreal forest soils. Soil Sci. Soc. Am. J. 2001, 65, 1238–1247. [Google Scholar] [CrossRef]
  12. da Silva, A.P.; Kay, B.C. Estimating the least limiting water range of soils from properties and management. Soil Sci. Soc. Am. J. 1997, 61, 877–883. [Google Scholar] [CrossRef]
  13. Zou, C.; Penfold, C.; Sands, R.; Misra, R.K.; Hudson, I. Effects of air-filled porosity, soil matric potential and soil strength on primary root growth of radiata pine seedlings. Plant Soil 2001, 236, 105–115. [Google Scholar] [CrossRef]
  14. Startsev, A.D.; McNabb, D.H. Effects of compaction on aeration and morphology of boreal forest soils in Alberta, Canada. Can. J. Soil Sci. 2009, 89, 45–56. [Google Scholar] [CrossRef]
  15. Startsev, A.D.; McNabb, D.H. Skidder traffic effects on water retention, pore size distribution, and van Genuchten parameters of boreal forest soils. Soil Sci. Soc. Am. J. 2001, 65, 224–231. [Google Scholar] [CrossRef]
  16. Startsev, A.D.; McNabb, D.H. Effects of skidding on soil infiltration in west central Alberta. Can. J. Soil Sci. 2000, 80, 617–624. [Google Scholar] [CrossRef]
  17. Howard, R.F.; Singer, M.J.; Frantz, G.A. Effects of soil properties, water content, and compactive effort on the compaction of selected California forest and range soils. Soil Soc. Soc. Am. J. 1981, 45, 231–236. [Google Scholar] [CrossRef]
  18. Zhao, Y.; Krzic, M.; Bulmer, C.E.; Schmidt, M.G. Bulk Density of British Columbia Forest Soils from the Proctor Test: Relationships with Selected Physical and Chemical Properties. Soil Sci. Soc. Am. J. 2008, 72, 442–452. [Google Scholar] [CrossRef] [Green Version]
  19. Carter, M.R. Relative measures of soil bulk density to characterize compaction in tillage studies on fine sandy loams. Can. J. Soil Sci. 1990, 70, 425–433. [Google Scholar] [CrossRef]
  20. Håkansson, I.; Lipiec, J. A review of the usefulness of relative bulk density values in studies of soil structure and compaction. Soil Till. Res. 2000, 53, 71–85. [Google Scholar] [CrossRef]
  21. Zhao, Y.; Krzic, M.; Bulmer, C.E.; Schmidt, M.G.; Simard, S.W. Relative bulk density as a measure of compaction and its influence on tree height. Can. J. For. Res. 2010, 40, 1724–1734. [Google Scholar] [CrossRef]
  22. Dexter, A.R. Amelioration of soil by natural processes. Soil Till. Res. 1991, 20, 87–100. [Google Scholar] [CrossRef]
  23. Corns, I.G.W. Compaction by forestry equipment and effects on coniferous seedling growth on four soils in the Alberta foothills. Can. J. For. Res. 1988, 18, 75–84. [Google Scholar] [CrossRef]
  24. Mohieddinne, H.; Brasseur, B.; Spicher, F.; Gallet-Moron, E.; Buridant, J.; Kobaissi, A.; Horen, H. Physical recovery of forest soil after compaction by heavy machines, revealed by penetration resistance over multiple decades. For. Ecol. Manag. 2019, 449, 117472. [Google Scholar] [CrossRef]
  25. Wert, S.; Thomas, B.R. Effects of skid roads on diameter, height, and volume growth in Douglas-fir. Soil Sci. Soc. Am. J. 1981, 45, 629–632. [Google Scholar] [CrossRef]
  26. Froehlich, H.A.; Miles, D.W.R.; Robbins, R.W. Soil bulk density recovery on compacted skid trails in Central Idaho. Soil Sci. Soc. Am. J. 1985, 49, 1015–1019. [Google Scholar] [CrossRef]
  27. Labelle, E.R.; Jaeger, D. Soil compaction caused by cut-to-length forest operations and possible short-term natural rehabilitation of soil density. Soil Sci. Soc. Am. J. 2011, 75, 2314–2329. [Google Scholar] [CrossRef] [Green Version]
  28. Page-Dumroese, D.S.; Jurgensen, M.F.; Tiarks, A.E.; Ponder, F., Jr.; Sanchez, F.G.; Fleming, R.L.; Kranabetter, J.M.; Powers, R.F.; Stone, D.M.; Elioff, J.D.; et al. Soil physical property changes at the North American Long-Term Soil Productivity study sites: 1 and 5 years after compaction. Can. J. For. Res. 2006, 36, 551–564. [Google Scholar] [CrossRef]
  29. Grossman, R.B.; Reinsch, T.G. 2.1 Bulk density and linear extensibility. In Methods of Soil Analysis, Part 4: Physical Methods, 5.4; Dane, J.H., Topp, G.C., Eds.; Soil Science Society of America Inc.: Madison, WI, USA, 2002; pp. 201–228. [Google Scholar] [CrossRef]
  30. Goutal, N.; Soivin, P.; Ranger, J. Assessment of the natural recovery rate of soil specific volume following forest soil compaction. Soil Sci. Soc. Am. J. 2012, 76, 1426–1435. [Google Scholar] [CrossRef]
  31. SAS Institute. SAS System for Linear Models, 3rd ed.; SAS Institute Inc.: Cary, NC, USA, 1991. [Google Scholar]
  32. Littell, R.C.; Milliken, G.A.; Stroup, W.W.; Wolfinger, R.D. SAS System for Mixed Models; SAS Institute Inc.: Cary, NC, USA, 1996. [Google Scholar]
  33. Milliken, G.A.; Johnson, D.E. Analysis of Messy Data: Designed Experiments; Chapman Hall: London, UK, 1994; Volume 1. [Google Scholar]
  34. Strong, W.L. Ecoregions and Ecodistricts of Alberta; Alberta Forestry, Lands, and Wildlife: Edmonton, AB, Canada, 1992; Volume 1. [Google Scholar]
  35. Thorud, D.B.; Duncan, D.P. Effects of snow removal, litter removal, and soil compaction on soil freezing and thawing in a Minnesota oak stand. Soil Sci. Soc. Am. Proc. 1972, 36, 153–157. [Google Scholar] [CrossRef]
  36. Siltanen, R.M.; Apps, M.J.; Zoltai, S.C.; Mair, R.M.; Strong, W.L. A Soil Profile and Organic Carbon Data Base for Canadian Forest and Tundra Mineral Soils; Natural Resources Canada: Edmonton, AB, Canada, 1997. [Google Scholar]
  37. McNabb, D.H. Soil failures under rigid-tracked forestry machines as a function of slope and soil wetness. In Exceeding the Vision: Forest Mechanization in the Future, Proceedings of the 52nd International Symposium on Forestry Mechanization, Sopron, Hungary/Forchtenstein, Austria, 6–9 October 2019; Czupy, I., Ed.; University of Sopron Press: Sopron, Hungary, 2019; pp. 340–349. ISBN 978-963-334-343-2. [Google Scholar]
  38. Wikipedia.org. Kurtosis, Updated 6 February 2022. Available online: https://en.wikipedia.org/w/index/php?title=Kurtosis&oldid=1070274736 (accessed on 12 February 2022).
  39. Ampoorter, E.; de Schrijver, A.; van Nevel, L.; Hermy, M.; Verheyen, K. Impact of mechanized harvesting on compaction of sandy and clayey forest soils: Results of a meta-analysis. Ann. For. Sci. 2012, 69, 533–542. [Google Scholar] [CrossRef] [Green Version]
  40. Williamson, J.R.; Neilson, W.A. The influence of forest site on rate and extent of soil compaction and profile disturbance of skid trails during ground-based harvesting. Can. J. For. Res. 2000, 30, 1196–1205. [Google Scholar] [CrossRef]
  41. Das, B.M. Fundamentals of Geotechnical Engineering, 4th ed.; Cengage Learning: Stamford, CT, USA, 2013. [Google Scholar]
  42. Krzic, M.; Bulmer, C.E.; Teste, F.; Dampier, L.; Rahman, S. Soil properties influencing compactability of forest soils in British Columbia. Can. J. Soil Sci. 2004, 84, 219–226. [Google Scholar] [CrossRef]
  43. McNabb, D.H.; Boersma, L. Nonlinear model for compressibility of partly saturated soils. Soil Sci. Soc. Am. J. 1996, 60, 333–341. [Google Scholar] [CrossRef]
  44. Casler, M.D. Fundamentals of experimental design: Guidelines for designing successful experiments. Agron. J. 2015, 107, 692–705. [Google Scholar] [CrossRef] [Green Version]
  45. Campbell, K.G.; Thompson, Y.M.; Guy, S.O.; McIntosh, M.; Glaz, B. Is, or is not, the two great ends of Fate: Errors in agronomic research. Agron. J. 2015, 107, 718–729. [Google Scholar] [CrossRef] [Green Version]
  46. Marshall, V.G. Impacts of forest harvesting on biological processes in northern forest soils. For. Ecol. Manag. 2000, 133, 43–60. [Google Scholar] [CrossRef]
  47. Jackson, R.B.; Canadell, J.; Ehleringer, J.R.; Mooney, H.A.; Sala, O.E.; Schultze, E.D. A global analysis of root distributions for terrestrial biomes. Oecologia 1996, 108, 389–411. [Google Scholar] [CrossRef]
  48. Grier, C.C.; Logan, R.S. Old-growth Pseudotsuga menziesii communities of a western Oregon watershed: Biomass distribution and production budgets. Ecol. Monogr. 1979, 47, 373–400. [Google Scholar] [CrossRef]
  49. Waring, R.H.; Schlesinger, W.H. Forest Ecosystems Concepts and Management; Academic Press, Inc.: New York, NY, USA, 1985. [Google Scholar]
  50. Startsev, N.A.; McNabb, D.H.; Startsev, A.D. Soil biological activity in recent clearcuts in Alberta. Can. J. Soil. Sci. 1998, 78, 69–78. [Google Scholar] [CrossRef] [Green Version]
  51. Kirchhof, G. Plastic Properties. In Encyclopedia of Soil Science, 2nd ed.; Lai, R., Ed.; Taylor and Francis: New York, NY, USA, 2006; pp. 1311–1313. [Google Scholar]
  52. Stone, J.A.; Larson, W.E. Rebound of five one-dimensional compressed granular soils. Soil Sci. Soc. Am. J. 1980, 44, 819–822. [Google Scholar] [CrossRef]
  53. McNabb, D.H.; Boersma, L. Evaluation of the relationship between compressibility and shear strength of Andisols. Soil Sci. Soc. Am. J. 1993, 57, 923–929. [Google Scholar] [CrossRef]
  54. Mickovski, S.B.; Hallett, P.D.; Bransby, M.F.; Davies, M.C.R.; Sonnenberg, R.; Bengough, A.G. Mechanical reinforcement of soil by willow roots: Impacts of root properties and root failure system. Soil Sci. Soc. Am. J. 2009, 73, 1276–1285. [Google Scholar] [CrossRef]
  55. Kay, B.C.; Grant, C.D.; Groenevelt, P.H. Significance of ground freezing on soil bulk density under zero tillage. Soil Sci. Soc. Am. J. 1985, 49, 973–978. [Google Scholar] [CrossRef]
  56. Zhang, T. Influence of the seasonal snow cover on the ground thermal regime: An overview. Am. Geophys. Union 2005, 43, RG4002. [Google Scholar] [CrossRef]
  57. Smith, M.; Jamieson, B. A new set of thermal conductivity measurements. In Proceedings of the International Snow Science Workshop 2014, Banff, AB, Canada, 29 September–3 October 2014; pp. 507–510. [Google Scholar] [CrossRef]
  58. Chalmers, B.; Jackson, K.A. Experimental and Theoretical Studies of Mechanism of Frost Heaving; Research Paper 199; Cold Regions Research and Engineering Laboratory: Hanover, NH, USA, 1970; p. 23. [Google Scholar]
  59. Mitchell, J.K.; Soga, K. Fundamentals of Soil Behavior, 3rd ed.; John Wiley & Sons, Inc.: Hoboken, NJ, USA, 2005. [Google Scholar]
  60. Heidmann, L.J. Frost Heaving of Tree Seedlings: A Literature Review of Causes and Possible Control; USDA Forest Serv. Gen. Tec. Rep. RM-21; Rocky Mountain Forest and Range Experiment Station: Fort Collins, CO, USA, 1976; p. 10. [Google Scholar]
  61. Azmatch, T.C.; Sego, D.C.; Arenson, L.U.; Biggar, K.W. Tensile strength of frozen soils using for-point bending test. In Proceedings of the 63th Canadian Geotechnical Conference, Calgary, AB, Canada, 12–16 September 2010; pp. 436–442. [Google Scholar]
  62. Dagesse, D.F. Freezing-induced bulk soil changes. Can. J. Soil Sci. 2010, 90, 389–401. [Google Scholar] [CrossRef] [Green Version]
  63. Groenevelt, P.H.; Kay, B.D. On the Interaction of Water and Heat Transport in Frozen and Unfrozen Soils: II. The liquid phase. Soil Sci. Soc. Am. J. 1994, 38, 400–404. [Google Scholar] [CrossRef]
  64. Sheng, D.; Axelsson, K.; Knutsson, S. Frost heave due to ice lens formation in freezing soils 1. Theory and verification. Nord. Hydrol. 1995, 26, 125–146. [Google Scholar] [CrossRef]
  65. Jury, W.A.; Gardner, W.R.; Gardner, W.H. Soil Physics, 5th ed.; John Wiley & Sons, Inc.: New York, NY, USA, 1991. [Google Scholar]
  66. Hinkel, K.M.; Outcalt, S.I. Identification of Heat-Transfer Processes during Soil Cooling, Freezing and Thaw in Central Alaska. Permafr. Periglac. Processes 1994, 5, 217–235. [Google Scholar] [CrossRef]
  67. Oulcalt, S.I.; Nelson, F.E.; Hinkel, K.M. The Zero-Curtain Effect: Heat and mass transfer across an isothermal region in freezing soil. Water Resour. Res. 1990, 26, 1509–1516. [Google Scholar]
  68. Eigenbroad, B.D. Effects of cyclic freezing and thawing on volume changes and permeabilities of soft fine-grained soils. Can. Geotech. J. 1996, 33, 529–537. [Google Scholar] [CrossRef]
  69. Viklander, P. Permeability and volume changes in till due to cyclic freeze/thaw. Can. Geotech. J. 1988, 35, 471–477. [Google Scholar] [CrossRef]
  70. McNabb, D.H. Tillage of compacted haul roads and landings in the boreal forests of Alberta, Canada. For. Ecol. Manag. 1994, 66, 179–194. [Google Scholar] [CrossRef]
  71. Gillund, G.; Kennedy, B. Historical wagon trails: An evaluation of the durability of subsoil compaction in Alberta. In Proceedings of the 32nd Annual Alberta Soil Science Workshop, Grande Prairie, AB, Canada, 13–15 March 1995; pp. 201–206. [Google Scholar]
  72. Schjønning, P.; Lamandé, M.; Berisso, F.E.; Simojoki, A.; Alakukku, L.; Andreasen, R.R. Gas diffusion, non-Darcy air permeability, and computed tomography images of a clay subsoil affected by compaction. Soil Sci. Soc. Am. J. 2013, 77, 1977–1990. [Google Scholar] [CrossRef]
  73. Bechingham, J.D.; Corns, I.G.W.; Archibald, J.H. Field Guide to Ecosites of West-Central Alberta; Special Report—Field Guide (NoFC—Edmonton); Northern Forest Centre: Edmonton, AB, USA, 1996. [Google Scholar]
  74. Yang, G.G.; Klinka, K. Use of synoptic variables in predicting white spruce site index. For. Ecol. Manag. 1996, 80, 95–105. [Google Scholar] [CrossRef]
  75. Norris, C.E.; Bean, G.M.; Cappellazzi, S.B.; Cope, M.; Greub, K.L.H.; Liptzin, D.; Rieke, E.L.; Tracy, P.W.; Morgan, C.L.S.; Honeycutt, C.W. Introducing the North American project to evaluate soil health measurements. Agron. J. 2020, 112, 3195–3215. [Google Scholar] [CrossRef]
  76. ASTM D2937-17; Standard Test Method for Density of soil in place by the drive-cylinder method. ASTM International: West Conshohocken, PA, USA, 2017; p. 8.
  77. Terry, T.A.; Cassel, D.K.; Wollum, A.G., II. Effects of soil sample size and included root and wood on bulk density in forested soils. Soil Sci. Soc. Am. J. 1981, 45, 135–138. [Google Scholar] [CrossRef]
  78. Page-Dumroese, D.S.; Jurgensen, M.F.; Brown, R.E.; Mroz, G.D. Comparison of Methods for determining bulk densities of rocky forest soils. Soil Sci. Soc. Am. J. 1999, 63, 379–383. [Google Scholar] [CrossRef]
  79. Blake, G.R. Bulk density. In Methods of Soil Analysis Part 1 Physical and Mineralogical Properties, Including Statistics of Measurement and Sampling; Black, D.A., Ed.; Soil Science Society of America Inc.: Madison, WI, USA, 1965; pp. 374–390. [Google Scholar] [CrossRef]
  80. Blake, G.R.; Hartge, K.H. Bulk density. In Physical and Mineralogical Methods, 5.1, 2nd ed.; Klute, A., Ed.; Soil Science Society of America Inc.: Madison, WI, USA, 1986; pp. 363–375. [Google Scholar] [CrossRef]
  81. Hvorslev, M.J. Subsurface Exploration and Sampling of Soils for Civil Engineering Purposes: Report on a Research Project of the Committee on Sampling and Testing, Soil Mechanics and Foundations Division, American Society of Civil Engineers; Waterways Experiment Station: Vicksburg, MS, USA, 1949. [Google Scholar]
  82. Culley, J.L.B. Density and compressibility. In Soil Sampling and Methods of Analysis; Carter, M.R., Ed.; CRC Press: Boca Raton, FL, USA, 1993; pp. 529–539. [Google Scholar]
Figure 1. West-central Alberta location of nine sample sites where soil bulk density was measured six times over 7 years. The distance between sites 7 and 8 is about 330 km.
Forests 13 00553 g001
Figure 2. Illustration of location and location of each replication at each site.
Forests 13 00553 g002
Figure 3. Snow depth and daily minimum air temperatures for a winter with normal snowfall (1996–1997) and below normal snowfall (1997–1998). Values are the mean (solid lines) and the confidence limits (dashed lines) for the 9 sites each winter.
Forests 13 00553 g003
Figure 4. Bulk density measured immediately after harvesting and skidding (year 0) as a function of the number of skidding cycles.
Forests 13 00553 g004
Figure 5. Mean bulk density of harvest-only (control) and 3, 7, and 12 skid cycles of soil trafficking over a period of 7 years. Each value of bulk density is the mean for the 5, 10, and 20 cm depths measured at nine sites (n = 144; Table 2).
Forests 13 00553 g005
Figure 6. Histogram of all the standard errors reported in Table 2. Seven values between 0.095 and 0.150 g m−3 are not shown. Each value of standard error is based on 16 individual soil cores (Table 2).
Forests 13 00553 g006
Table 1. Soil organic matter and particle size distribution (n = 4), soil classification, and soil water content and tensiometer water potential (n = 64) at the time of skidding [11].
SiteDepthOrganic MatterParticle Size DistributionTextureClassificationSoil Water When SkiddedTireTrack Width
ClaySiltSand
cmkg kg−1 kg kg−1kPam
150.0230.160.50.34Silt loam/loamOrthic/Gleyed Gray Luvisol0.264−130.8/1.1
100.0360.130.520.35Silt loam/loam0.218−15
200.0060.160.430.41Loam0.181−15
250.0250.170.640.19Silt loamGleyed Gray Luvisol0.251−150.7
100.0280.190.590.22Silt loam0.234−7
200.0150.230.590.18Silt loam0.259−8
350.0310.120.530.35Silt loamOrthic Gray Luvisol0.251−60.8/1.1
100.0260.120.510.37Silt loam0.234−7
200.0140.150.480.37Loam0.259−7
450.0240.210.430.36LoamOrthic Gray Luvisol0.337−91.1
100.0310.20.40.4Loam0.295−6
200.010.230.380.39Loam0.271−7
650.0270.150.440.41LoamBrunisolic Gray Luvisol0.293−230.8
120.0260.130.420.45Loam0.234−30
200.0080.170.390.44Loam0.231−38
750.0330.220.560.22Silt loamEluviated Dystric Brunisol0.26−71.1
100.0270.210.550.24Silt loam0.23−13
200.0120.280.520.2Silty clay loam/clay loam0.189−10
850.0250.290.470.27Clay loamOrthic/Gleyed Gray Luvisol0.448−401.1
100.0220.310.460.32Clay loam0.306−37
200.0160.240.440.27Silt loam0.232−26
950.0580.180.550.28Silt loamOrthic Gray Luvisol0.229−130.8/1.1
100.0260.150.540.27Silt loam0.184−16
200.0160.180.550.24Silt loam0.184−15
1050.0280.250.50.25Silt loam/loamOrthic/Gleyed Gray Luvisol0.278−70.8
100.015 0.470.27Loam0.222−11
200.010.330.430.24Clay loam0.219−9
Table 2. Soil bulk density data for 9 sites, 4 treatments, 3 depths, and 6 sampling periods over 7 years. Soil depth is the average depth of a soil core with a height of 3 cm. The sample size was 16 and the standard errors are in parentheses.
Site/YearSoil Depth, 5 cmSoil Depth, 10 cmSoil Depth, 20 cm
Control3 Cycle7 Cycle12 CycleControl3 Cycle7 Cycle12 CycleControl3 Cycle7 Cycle12 Cycle
Mg m−3
Site 1
01.13 (0.04)1.29 (0.04)1.33 (0.04)1.29 (0.04)1.34 (0.04)1.46 (0.04)1.44 (0.04)1.44 (0.03)1.46 (0.02)1.46 (0.03)1.41 (0.04)1.47 (0.03)
11.20 (0.04)1.24 (0.04)1.35 (0.04)1.36 (0.03)1.37 (0.06)1.52 (0.04)1.51 (0.03)1.49 (0.03)1.48 (0.04)1.61 (0.02)1.58 (0.02)1.58 (0.02)
21.12 (0.04)1.07 (0.05)1.14 (0.04)1.19 (0.04)1.28 (0.03)1.30 (0.05)1.36 (0.05)1.34 (0.04)1.39 (0.03)1.39 (0.03)1.38 (0.03)1.36 (0.03)
31.09 (0.04)1.12 (0.07)1.27 (0.05)1.26 (0.04)1.29 (0.03)1.40 (0.05)1.46 (0.04)1.44 (0.04)1.46 (0.03)1.46 (0.04)1.50 (0.04)1.45 (0.02)
41.20 (0.05)1.1 (0.05)1.30 (0.04)1.28 (0.05)1.48 (0.03)1.45 (0.05)1.42 (0.05)1.43 (0.06)1.58 (0.02)1.58 (0.04)1.54 (0.03) 1.51 (0.04)
71.14 (0.03)1.09 (0.04)1.14 (0.04)1.15 (0.05)1.22 (0.03)1.19 (0.04)1.28 (0.03)1.27 (0.04)1.27 (0.03)1.24 (0.05)1.29 (0.03)1.15 (0.06)
Site 2
01.29 (0.05)1.34 (0.05)1.40 (0.04)1.46 (0.04)1.37 (0.04)1.38 (0.04)1.41 (0.03)1.42 (0.04)1.29 (0.05)1.40 (0.04)1.38 (0.03)1.41 (0.04)
11.20 (0.04)1.39 (0.04)1.34 (0.05)1.42 (0.03)1.23 (0.04)1.41 (0.04)1.43 (0.03)1.39 (0.04)1.30 (0.04)1.35 (0.05)1.43 (0.03)1.42 (0.04)
21.18 (0.04)1.26 (0.06)1.33 (0.03)1.35 (0.05)1.30 (0.05)1.38 (0.04)1.45 (0.03)1.40 (0.04)1.33 (0.04)1.40 (0.05)1.42 (0.03)1.44 (0.04)
31.31 (0.05)1.36 (0.05)1.31 (0.03)1.43 (0.03)1.29 (0.04)1.38 (0.04)1.40 (0.03)1.44 (0.05)1.29 (0.03)1.38 (0.05)1.45 (0.03)1.42 (0.04)
41.24 (0.05)1.32 (0.05)1.37 (0.03)1.38 (0.03)1.31 (0.05)1.40 (0.04)1.43 (0.03)1.43 (0.04)1.22 (0.04)1.33 (0.04)1.44 (0.04)1.42 (0.05)
71.03 (0.06)1.16 (0.05)1.27 (0.03)1.25 (0.03)1.13 (0.04)1.31 (0.04)1.35 (0.03)1.30 (0.03)1.16 (0.05)1.27 (0.05)1.31 (0.04)1.33 (0.03)
Site 3
01.19 (0.06)1.27 (0.04)1.39 (0.04)1.37 (0.03)1.31 (0.03)1.42 (0.03)1.47 (0.04)1.48 (0.03)1.35 (0.03)1.47 (0.03)1.50 (0.04)1.51 (0.03)
11.28 (0.04)1.27 (0.05)1.27 (0.06)1.35 (0.04)1.33 (0.03)1.37 (0.03)1.39 (0.05)1.45 (0.03)1.40 (0.04)1.44 (0.03)1.45 (0.04)1.54 (0.02)
21.22 (0.04)1.35 (0.05)1.33 (0.06)1.43 (0.04)1.36 (0.04)1.45 (0.03)1.45 (0.02)1.52 (0.03)1.47 (0.03)1.49 (0.03)1.53 (0.03)1.59 (0.03)
31.28 (0.03)1.24 (0.07)1.35 (0.06)1.44 (0.03)1.33 (0.03)1.48 (0.05)1.44 (0.03)1.50 (0.03)1.40 (0.03)1.54 (0.05)1.50 (0.04)1.60 (0.03)
41.17 (0.05)1.27 (0.03)1.35 (0.06)1.41 (0.03)1.31 (0.04)1.37 (0.04)1.43 (0.03)1.45 (0.04)1.37 (0.03)1.44 (0.04)1.51 (0.03)1.58 (0.02)
71.32 (0.05)1.48 (0.06)1.42 (0.06)1.46 (0.05)1.49 (0.03)1.50 (0.04)1.56 (0.05)1.53 (0.04)1.50 (0.02)1.52 (0.03)1.59 (0.04)1.61 (0.03)
Site 4
01.21 (0.04)1.38 (0.05)1.39 (0.03)1.42 (0.04)1.39 (0.02)1.39 (0.04)1.46 (0.03)1.47 (0.03)1.38 (0.04)1.43 (0.04)1.46 (0.02)1.50 (0.02)
11.27 (0.03)1.33 (0.06)1.46 (0.03)1.41 (0.04)1.39 (0.03)1.49 (0.02)1.49 (0.03)1.57 (0.04)1.39 (0.03)1.46 (0.03)1.51 (0.03)1.57 (0.03)
21.30 (0.03)1.30 (0.03)1.36 (0.05)1.27 (0.06)1.35 (0.03)1.40 (0.03)1.43 (0.04)1.54 (0.02)1.41 (0.03)1.42 (0.03)1.54 (0.04)1.53 (0.03)
31.27 (0.05)1.33 (0.04)1.38 (0.05)1.39 (0.04)1.35 (0.04)1.46 (0.03)1.52 (0.02)1.52 (0.03)1.38 (0.04)1.47 (0.03)1.49 (0.02)1.53 (0.03)
41.27 (0.04)1.28 (0.03)1.38 (0.04)1.36 (0.05)1.34 (0.03)1.43 (0.04)1.50 (0.02)1.46 (0.09)1.39 (0.02)1.49 (0.03)1.50 (0.03)1.57 (0.02)
71.24 (0.04)1.28 (0.05)1.33 (0.04)1.32 (0.05)1.27 (0.03)1.33 (0.04)1.42 (0.03)1.45 (0.04)1.29 (0.04)1.32 (0.03)1.40 (0.03)1.43 (0.03)
Site 6
01.08 (0.06)1.16 (0.06)1.31 (0.05)1.14 (0.05)1.22 (0.05)1.34 (0.05)1.30 (0.07)1.32 (0.04)1.31 (0.03)1.43 (0.04)1.45 (0.04)1.41 (0.06)
11.05 (0.04)1.20 (0.06)1.13 (0.05)1.17 (0.07)1.31 (0.04)1.35 (0.04)1.33 (0.05)1.36 (0.04)1.34 (0.05)1.42 (0.02)1.47 (0.03)1.45 (0.03)
21.22 (0.04)1.18 (0.05)1.30 (0.05)1.23 (0.05)1.35 (0.03)1.29 (0.05)1.42 (0.04)1.30 (0.03)1.37 (0.02)1.37 (0.03)1.40 (0.04)1.31 (0.03)
31.09 (0.05)1.14 (0.05)1.11 (0.05)1.11 (0.05)1.25 (0.04)1.27 (0.04)1.27 (0.06)1.30 (0.05)1.39 (0.03)1.41 (0.02)1.41 (0.03)1.49 (0.03)
41.08 (0.04)1.08 (0.04)1.12 (0.06)1.19 (0.06)1.26 (0.04)1.22 (0.05)1.32 (0.04)1.28 (0.04)1.41 (0.02)1.47 (0.03)1.50 (0.02)1.42 (0.05)
71.24 (0.04)1.24 (0.04)1.22 (0.05)1.22 (0.04)1.35 (0.02)1.37 (0.02)1.38 (0.03)1.34 (0.04)1.36 (0.03)1.37 (0.02)1.43 (0.04)1.36 (0.06)
Site 7
01.00 (0.05)1.12 (0.05)1.18 (0.04)1.22 (0.06)1.25 (0.06)1.23 (0.03)1.28 (0.05)1.36 (0.05)1.43 (0.03)1.45 (0.05)1.44 (0.05)1.47 (0.05)
11.05 (0.04)1.20 (0.06)1.21 (0.06)1.30 (0.07)1.30 (0.05)1.35 (0.05)1.42 (0.06)1.43 (0.04)1.43 (0.05)1.49 (0.02)1.56 (0.03)1.50 (0.04)
21.14 (0.05)1.27 (0.04)1.23 (0.07)1.33 (0.08)1.33 (0.05)1.39 (0.05)1.39 (0.06)1.46 (0.04)1.48 (0.04)1.53 (0.03)1.51 (0.04)1.55 (0.03)
31.03 (0.04)1.20 (0.06)1.14 (0.06)1.27 (0.05)1.32 (0.05)1.45 (0.04)1.38 (0.06)1.44 (0.07)1.51 (0.02)1.50 (0.04)1.49 (0.04)1.53 (0.04)
40.99 0.04)1.21 (0.06)1.19 (0.06)1.35 (0.06)1.27 (0.05)1.44 (0.04)1.48 (0.05)1.47 (0.04)1.44 (0.04)1.47 (0.04)1.56 (0.02)1.51 (0.03)
71.27 (0.05)1.27 (0.06)1.29 (0.06)1.31 (0.05)1.35 (0.03)1.37 (0.05)1.47 (0.05)1.49 (0.05)1.40 (0.05)1.39 (0.04)1.48 (0.03)1.48 (0.04)
Site 8
01.15 (0.06)1.15 (0.07)1.31 (0.06)1.28 (0.05)1.33 (0.05)1.36 (0.03)1.45 (0.05)1.38 (0.02)1.39 (0.04)1.43 (0.03)1.45 (0.02)1.37 (0.03)
11.41 (0.04)1.37 (0.03)1.49 (0.04)1.39 (0.04)1.55 (0.03)1.51 (0.04)1.55 (0.02)1.51 (0.03)1.53 (0.03)1.49 (0.03)1.49 (0.02)1.47 (0.02)
21.38 (0.05)1.37 (0.06)1.50 (0.03)1.40 (0.04)1.52 (0.03)1.55 (0.04)1.59 (0.02)1.54 (0.02)1.58 (0.03)1.56 (0.03)1.59 (0.03)1.54 (0.02)
31.15 (0.07)1.33 (0.06)1.36 (0.04)1.36 (0.06)1.44 (0.05)1.54 (0.03)1.50 (0.04)1.50 (0.04)1.54 (0.03)1.47 (0.04)1.52 (0.03)1.49 (0.03)
41.48 (0.03)1.44 (0.04)1.38 (0.05)1.39 (0.04)1.56 (0.03)1.56 (0.03)1.46 (0.05)1.59 (0.02)1.54 (0.03)1.50 (0.04)1.48 (0.02)1.51 (0.02)
71.49 (0.05)1.50 (0.07)1.43 (0.04)1.49 (0.04)1.52 (0.03)1.61 (0.04)1.51 (0.03)1.56 (0.02)1.61 (0.03)1.55 (0.03)1.50 (0.02)1.55 (0.02)
Site 9
01.24 (0.05)1.27 (0.05)1.29 (0.06)1.32 (0.07)1.30 (0.04)1.29 (0.03)1.38 (0.04)1.36 (0.03)1.35 (0.04)1.34 (0.03)1.42 (0.03)1.44 (0.04)
11.24 (0.04)1.29 (0.03)1.32 (0.04)1.29 (0.08)1.29 (0.05)1.33 (0.04)1.44 (0.03)1.34 (0.07)1.32 (0.03)1.39 (0.02)1.47 (0.04)1.45 (0.03)
21.28 (0.05)1.38 (0.02)1.36 (0.05)1.41 (0.03)1.29 (0.04)1.35 (0.04)1.41 (0.04)1.40 (0.05)1.31 (0.03)1.40 (0.04)1.46 (0.04)1.48 (0.03)
31.22 (0.08)1.06 (0.14)1.35 (0.04)1.08 (0.15)1.28 (0.09)1.17 (0.12)1.38 (0.02)1.24 (0.14)1.37 (0.08)1.34 (0.08)1.49 (0.03)1.29 (0.13)
41.30 (0.05)1.30 (0.04)1.39 (0.04)1.43 (0.03)1.27 (0.03)1.33 (0.03)1.40 (0.04)1.49 (0.03)1.30 (0.03)1.33 (0.04)1.44 (0.03)1.49 (0.03)
71.34 (0.04)1.41 (0.03)1.45 (0.04)1.31 (0.03)1.37 (0.04)1.39 (0.02)1.50 (0.04)1.44 (0.05)1.43 (0.03)1.43 (0.04)1.46 (0.06)1.57 (0.05)
Site 10
01.09 (0.05)1.30 (0.04)1.30 (0.03)1.31 (0.03)1.18 (0.04)1.35 (0.03)1.41 (0.02)1.42 (0.03)1.27 (0.03)1.42 (0.03)1.44 (0.02)1.39 (0.03)
11.08 (0.03)1.28 (0.03)1.36 (0.03)1.35 (0.04)1.12 (0.03)1.37 (0.03)1.39 (0.02)1.46 (0.03)1.28 (0.03)1.43 (0.03)1.50 (0.02)1.42 (0.03)
21.10 (0.04)1.32 (0.03)1.33 (0.04)1.34 (0.03)1.19 (0.03)1.36 (0.03)1.40 (0.03)1.46 (0.03)1.32 (0.02)1.45 (0.02)1.49 (0.02)1.44 (0.03)
31.12 (0.04)1.32 (0.03)1.39 (0.03)1.32 (0.04)1.19 (0.05)1.43 (0.03)1.43 (0.02)1.45 (0.02)1.29 (0.02)1.44 (0.03)1.50 (0.02)1.44 (0.03)
4Site was not sampled
71.04 (0.03)1.16 (0.03)1.22 (0.06)1.05 (0.06)1.13 (0.03)1.38 (0.03)1.42 (0.02)1.41 (0.02)1.19 (0.03)1.37 (0.03)1.40 (0.03)1.38 (0.02)
Table 3. Analyses of Variance of soil bulk density collected over a sampling period of 7 years (mixed ANOVA with depth and year as repeated factors).
Source of VarianceDegrees of FreedomType III FPr > FSignificance Level
Traffic Cycles 332.710.0000****
Depth2801.820.0000****
Site813.910.0000****
Year511.260.0000****
Traffic Cycles * Depth62.360.0300*
Traffic Cycles * Site241.320.1720
Traffic Cycles * Year61.490.1976
Depth * Site1620.420.0000****
Depth * Year102.710.0027**
Site * Year3914.910.0000****
Traffic Cycles * Depth * Site481.430.0442*
Traffic Cycles * Depth * Year300.780.7903
Traffic Cycles * Site * Year1171.210.0889
Depth * Site * Year781.980.0000****
* Significance level, Pr < 0.05; ** Significance level, Pr < 0.01; **** Significance level, Pr < 0.0001.
Table 4. Summary of descriptive statistics for standard erros at the 5, 10, and 20 cm d.
Statistic5 cm Depth10 cm Depth20 cm DepthCombined Depths
Mean0.04630.03910.03330.0395
Median0.04410.03630.03100.0370
Standard Error0.00100.00100.00080.0006
Standard Deviation0.01510.01470.01170.149
Kurtosis14.959215.784820.239613.4195
Skewness2.716722.90933.14462.5526
Range0.12880.12700.11060.1328
Minimum0.02050.01700.01650.0165
Maximum0.14930.14400.12720.1493
Count210210210630
Publisher’s Note: MDPI stays neutral with regard to jurisdictional claims in published maps and institutional affiliations.

