Article

Relationship between Canopy Structure and Community Structure of the Understory Trees in a Beech Forest in Japan

1
Doctoral Program in Biology, Degree Programs in Life and Earth Sciences, Graduate School of Science and Technology, University of Tsukuba, Tsukuba 305-8577, Japan
2
Faculty of Education, Shinshu University, Nagano 380-8544, Japan
3
Faculty of Life and Environmental Sciences, University of Tsukuba, Tsukuba 305-8577, Japan
*
Author to whom correspondence should be addressed.
Forests 2022, 13(4), 494; https://doi.org/10.3390/f13040494
Submission received: 15 February 2022 / Revised: 18 March 2022 / Accepted: 21 March 2022 / Published: 22 March 2022

Abstract

:
Understory trees occupy a spatially heterogeneous light environment owing to light interception by patchily distributed canopy leaves. We examined the spatial distribution of canopy leaves and the spatial structure of the understory tree community (height < 5 m) and their relationships in a beech forest in Nagano, Japan. We measured the canopy leaf area index (LAI) at 10 m intervals (n = 81) in a permanent research plot (1 ha). We established a circular subplot centered on each LAI measurement point, and determined the species composition and the aboveground net primary production of wood (ANPPW) of the understory tree community by using tree size data from an open database in the Monitoring Sites 1000 project. There was a significant negative correlation between canopy LAI and the ANPPW of understory trees and a significant positive correlation between the ANPPW of understory and understory tree density. The dominant species of understory trees differed between subplots with high and low LAI values. Our results suggest that niche differentiation allows trees in the understory community to make use of various light conditions, thereby enhancing the primary productivity of the entire community.

1. Introduction

Trees of various heights occupy different strata in forests. Understory trees receive little light. However, in the gaps created by the death of a large tree, understory trees receive large amounts of light, even in dense forests [1,2,3,4,5]. Canopy gaps are important for the survival of understory trees, such as shrub species, which remain in the understory, and growth into canopy of small individual canopy tree species. Previous studies have reported that they also affect the establishment and primary production of the understory [6,7].
Canopy gaps provide additional light, an essential resource to understory leaves. However, it is not necessarily true that a plant which receives increased light can reach its maximum potential of photosynthesis. Light that is too strong can be harmful [8,9,10]. Trees must adjust their functional traits, such as leaf area or leaf weight, which can affect light use characteristics, as well as their light environment. Furthermore, and the values and plasticity of these traits vary from species to species [11,12]. Different species of understory trees co-exist in this heterogeneous light environment. For example, shade-tolerant trees can grow under dense canopy and shade-intolerant trees can grow in gaps [13,14]. The shade-tolerant species were often present prior to a canopy opening in a seedling bank, whereas shade-intolerant species are more apt to have established gaps. As suggested by previous studies, the mechanism underlying the high productivity of communities with high diversity, niche differentiation, allows efficient use of resources, with different species inhabiting different areas where resources are distributed heterogeneously [15,16]. In this way, as the diversity of the understory tree community increases, so does its primary production by enhancing light-use efficiency.
Within gaps, the light environment varies at the fine scale, such as between the center and the edge of gaps [17,18]. Previous studies that conducted multi-point measurements of canopy leaves showed that the amount of canopy leaves varies depending on the location, even within gaps or under a closed canopy [19,20]. These fine changes in the forest light environment cannot be captured by classification as either gaps or closed canopy. However, fine-scale variation of the light environment has not been well studied, and although it is clear that the understory light environment changes at a fine spatial scale, it is not yet clear how understory trees respond to these changes and maintain primary productivity.
This study investigated the spatial structure of the forest canopy in a secondary mature forest in order to clarify the spatial relationship between forest canopy structure and primary production of the understory tree community (height < 5 m). The objectives were to understand the spatial relationship between the quantity of canopy leaves and (1) the aboveground primary production of the understory tree community and (2) the structure of the understory tree community.

2. Materials and Methods
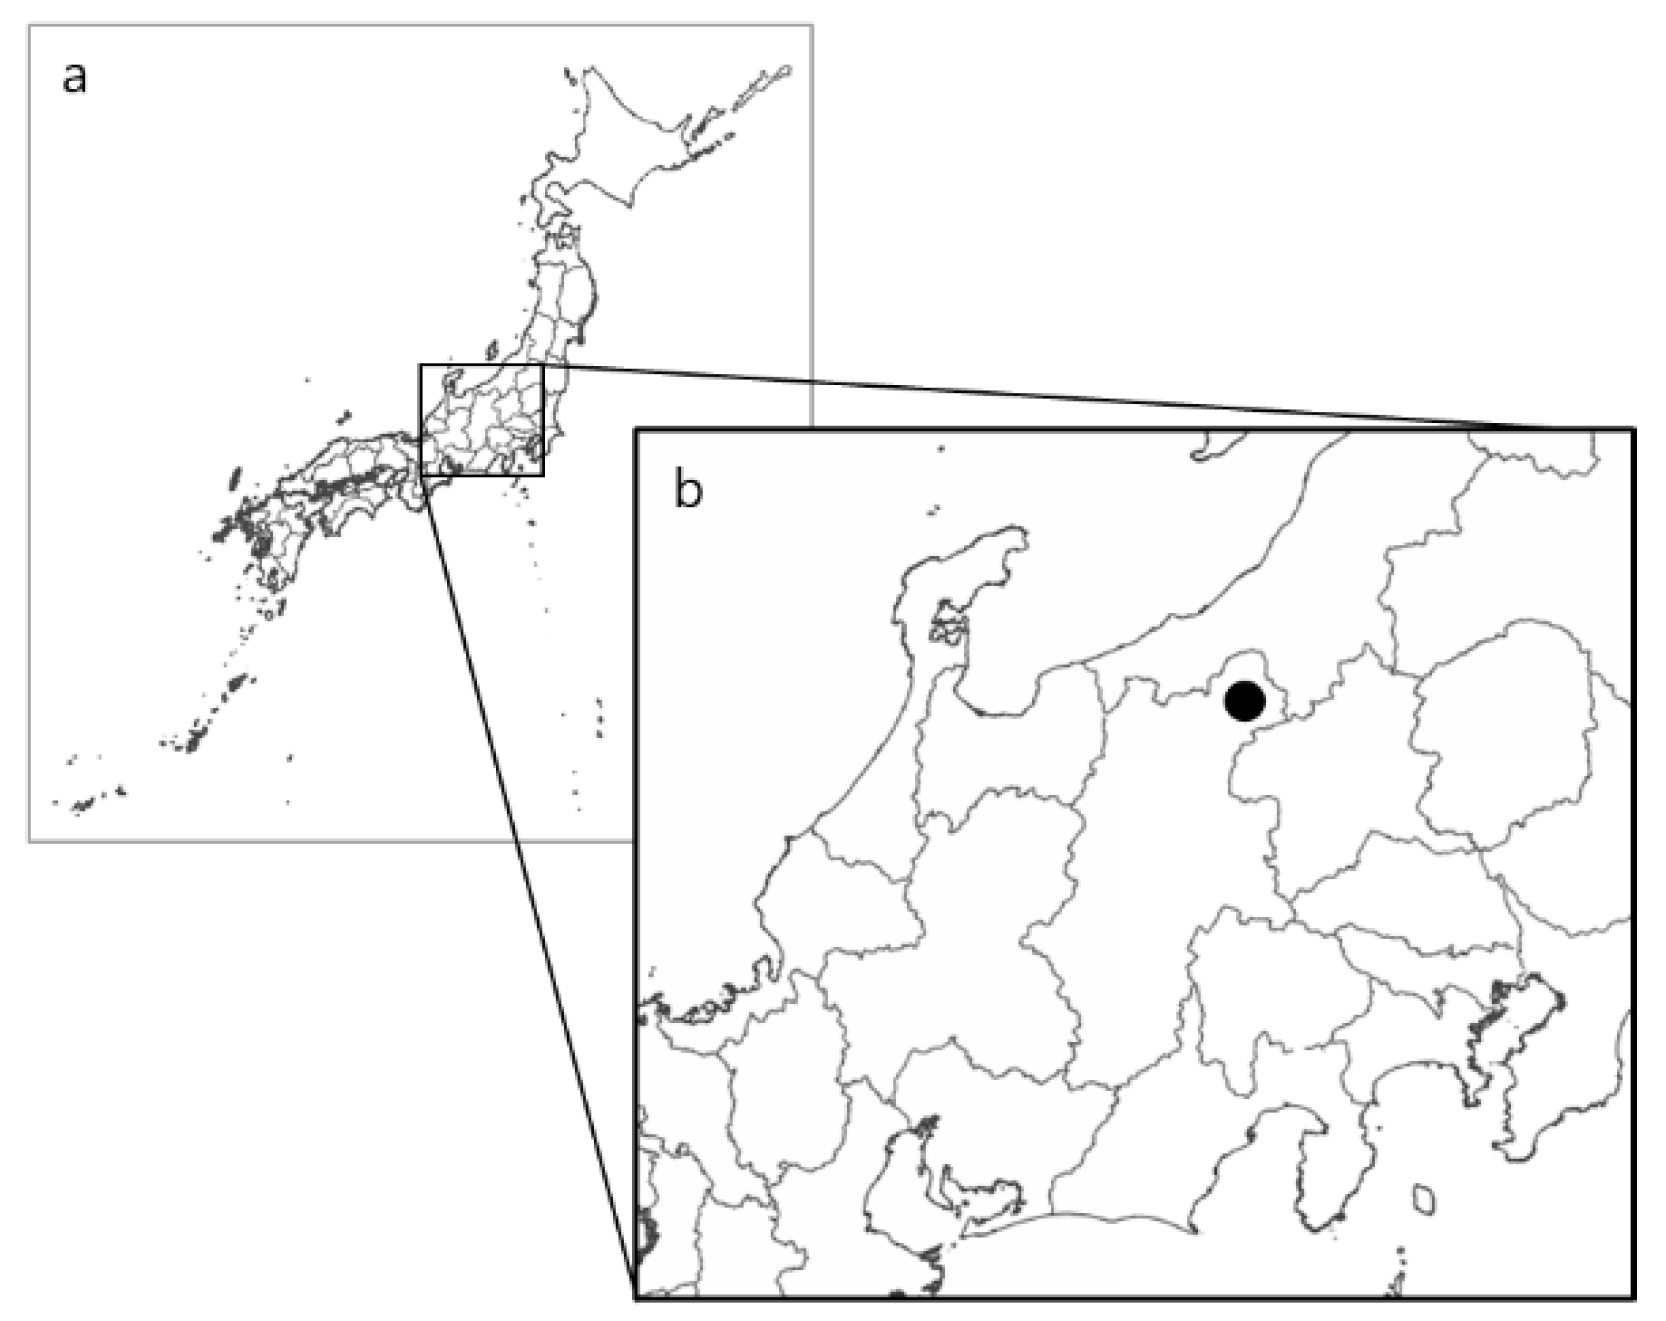
2.1. Study Area

We conducted our study in the Kayanodaira Beech Forest (N 36.838480, E 138.499200) in Nagano Prefecture, Japan (Figure 1). The altitude is 1495 m, the mean annual temperature is 4.9 °C, and the mean annual precipitation is 1677.5 mm (1981–2010) [19]. The site has snow cover from early October to late May, with a maximum snow depth of about 4 m. It is a cool-temperate deciduous broadleaf forest dominated by beech (Fagus crenata Blume), and containing a few other tree species (e.g., Betula ermanii Cham., Aesculus turbinate Blume). The understory consists of young trees of the canopy species as well as many species of deciduous broadleaf shrubs (Table 1). The forest floor is covered by dwarf bamboo (Sasa senanensis), which is 0.5 m to 2 m in height [20]. Some canopy trees are more than 300 years old, but this is a secondary forest that had been used for harvest of fuelwood. The details of the study site are described in IDA (2013) [19].
A 1 ha research plot was established in the study area in 2005. The plot was registered as one of the core sites for the Monitoring Sites 1000 Project [21]. As part of this project, all living trees in the study area with a girth of breast height (GBH) of ≥15 cm are surveyed annually, and their position, species, and GBH are recorded.

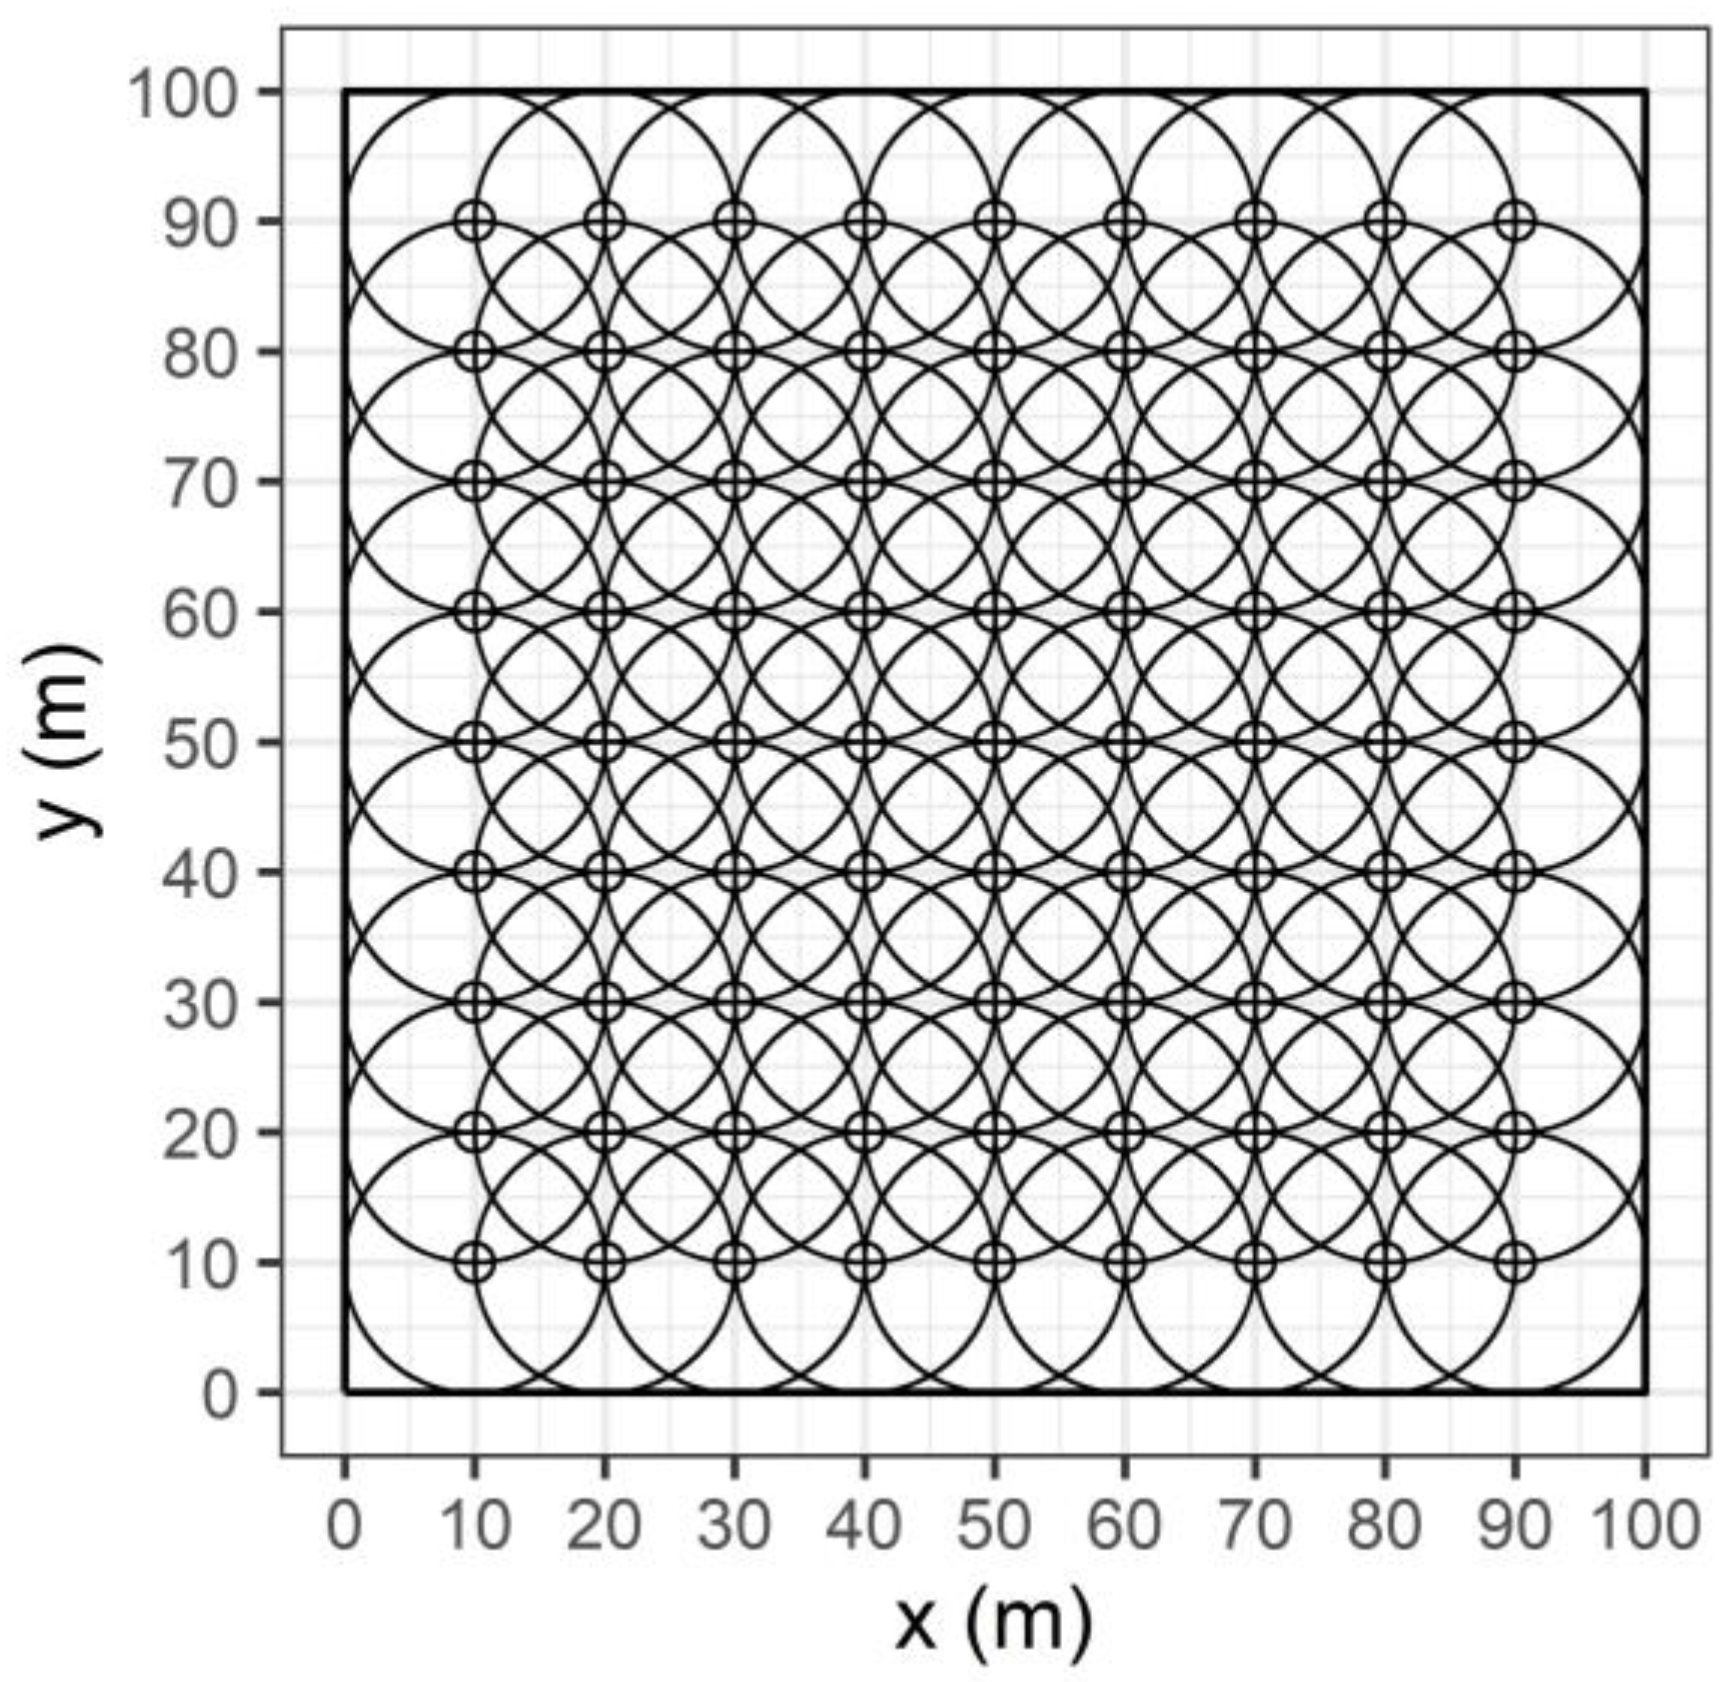
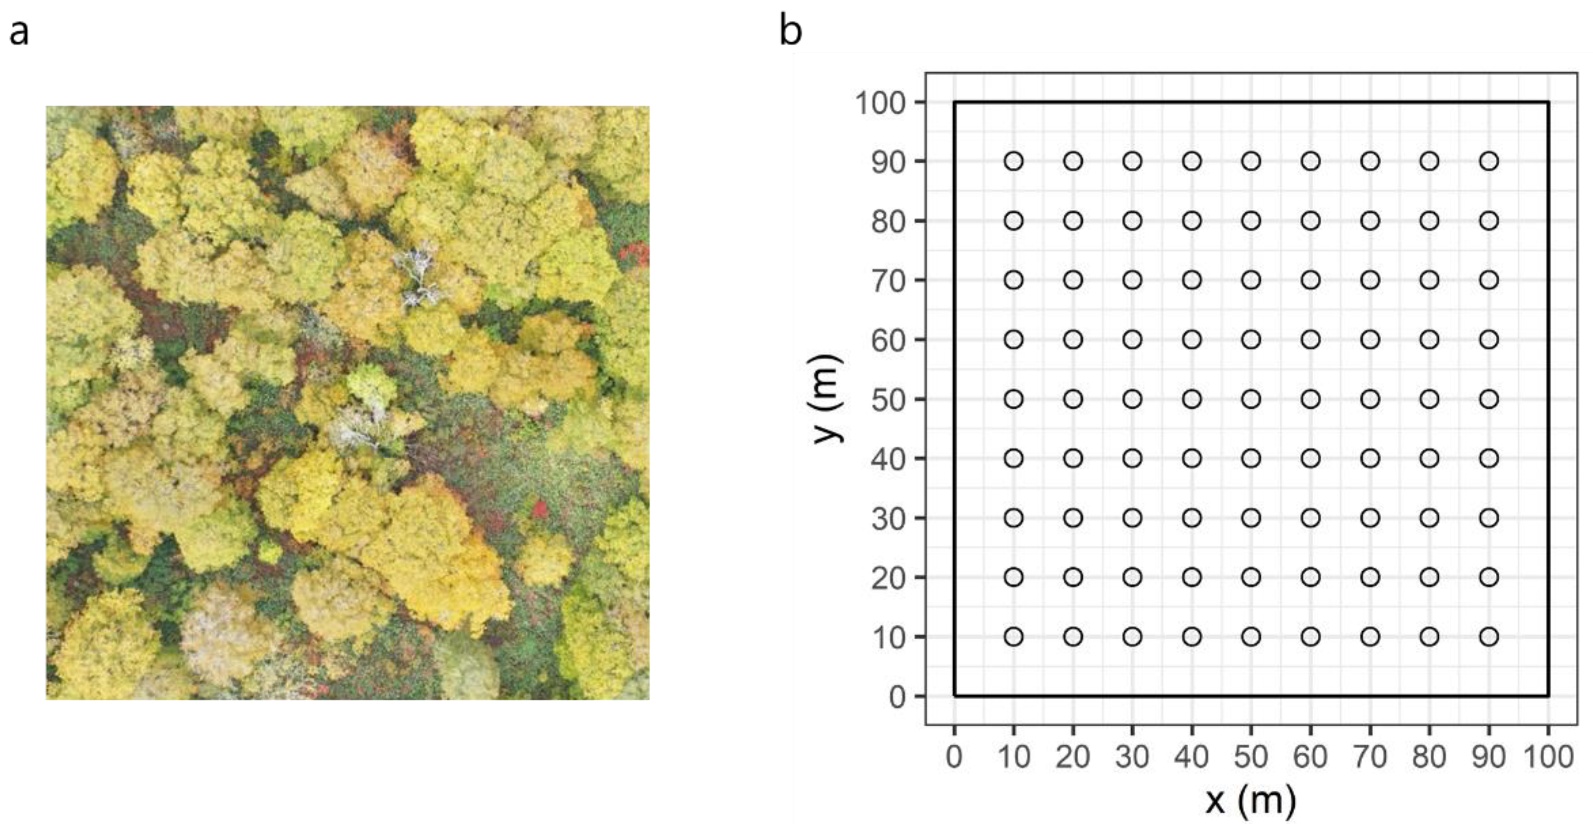
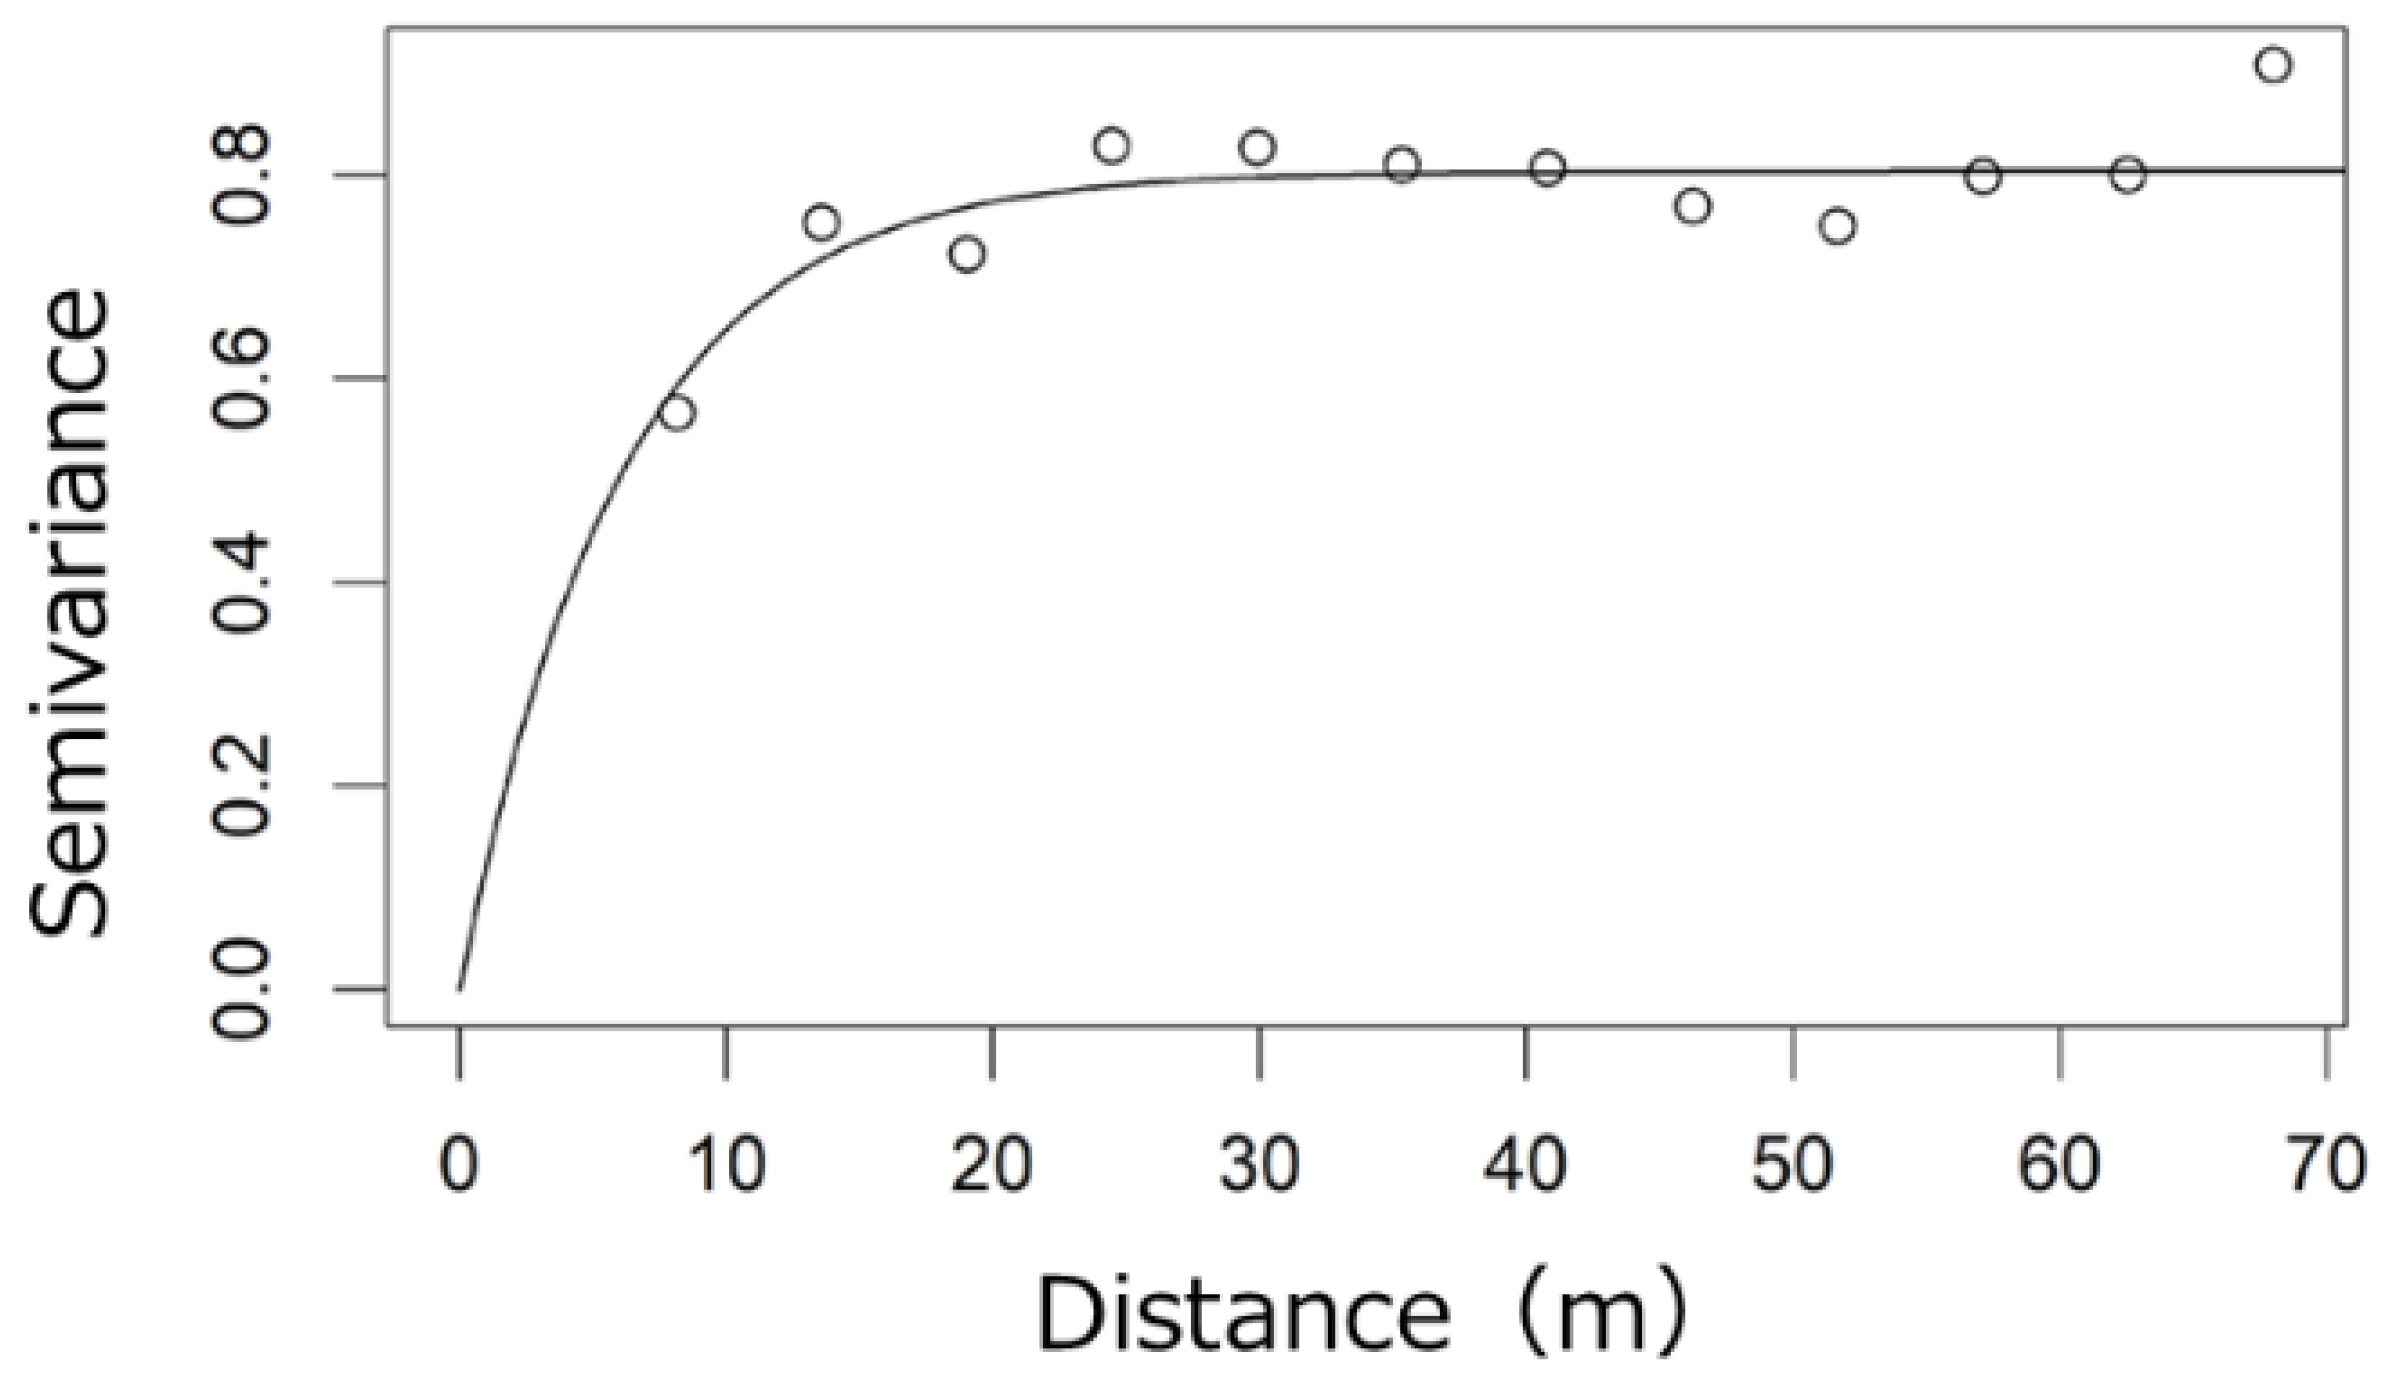
2.2. Spatial Distribution of Canopy LAI

To examine the spatial distribution of canopy leaves, we used leaf area index (LAI), as measured by Tanioka et al. (2020) [22]. LAI was measured by using a portable leaf area index analyzer (MIJ-LAI/P; Environmental Measurement Japan, CO., LTD., Fukuoka, Japan). LAI was measured across a grid of points at 10 m intervals, at a height of 5 m (Figure 2), as described in Tanioka et al. (2020).

2.3. Aboveground Net Primary Production of Wood

Forest inventory data in the study plot were obtained from the Monitoring Sites 1000 website (SIN02.zip, http://www.biodic.go.jp/moni1000/findings/data/index.html accessed on 19 June 2020. For all living individual trees surveyed in 2013 and 2018, the diameter of breast height (DBH) was calculated as the girth at breast height (GBH) ÷ π. DBH was substituted into an allometric equation (Equation (1)) to calculate aboveground woody biomass [23]:
W = 0.1853 ρ D 2.491
where W is the dry weight (kg) of the aboveground biomass excluding productive organs, ρ is the wood density of the stem that is unique to each species (kg/m3), and D is the DBH (cm). Wood densities reported by Komiyama et al. (2011) [23] were used where available (n = 6). To estimate the wood density of species not mentioned in Komiyama et al. (2011), we constructed a regression equation that describes the relationship between the wood density values reported by Komiyama et al. (2011) and the air-dried wood density (kg/m3) values of those species reported by Kijima et al. (1986) [24]. Using this equation and values for air-dried wood density from Kijima et al. (1986), we determined the wood density values of the remaining species (n = 10). For trees not listed in Kijima et al. (1986), the average specific gravity reported by Komiyama et al. (2011) was used as the wood density of the tree (n = 5). The aboveground woody biomasses of individuals with several stems were the sum of aboveground woody biomasses of all stems. The difference in aboveground woody biomasses between 2013 and 2018 in all stems was divided by 5 to obtain the annual growth rate in aboveground biomass for each tree:
I = W 2018 W 2013 5
where I is the annual growth rate in aboveground biomass of each individual tree per year, and W2013 and W2018 are the aboveground woody biomasses in 2013 and 2018, respectively. For the five individuals lacking GBH data for 2018 (0.414% of the total), the growth rate per year was calculated for the four-year period from 2013 to 2017 using 2017 GBH data. Similarly, for the five individuals lacking GBH data for 2013 (0.414% of the total), the growth rate per year was calculated for the four-year period from 2014 to 2018 using 2014 GBH data. For stems that reached GBH of 15 cm after 2014, the GBH in that year was set at 15 cm and the mean annual increase was measured from the year when their GBH reached 15 cm in 2018 [25].
In this study, trees with a height of <5 m were counted as understory trees. To determine the tree height from data in the DBH database, we created an allometric equation describing the relationship between tree height and DBH. We measured the height of 171 trees including all species using poles (maximum height 15 m) in October 2020 and compared height data with DBH data from the database. The DBH of a 5 m-tall tree was 9.25 cm (Figure 3). Therefore, trees with a DBH of ≤9.25 cm in 2018 were deemed to be understory trees. For trees with several stems, the DBH of the largest stem was used to classify trees as canopy or understory. The aboveground net primary production of wood (ANPPW) in the understory was determined by summing the growth rates of all understory trees. The ANPPW of all trees was also determined.

2.4. Data Analysis

To determine the appropriate size of subplots for gathering data about the relationship between canopy structure and understory tree community structure, we measured the spatial autocorrelation of canopy LAI. The semivariance of canopy LAI was calculated [26,27] as:
γ h = 1 2 N h i = 1 N h Z x i Z x i + h
where γ is the semivariance of distance h, N(h) is the number of combinations of two points at distance h, and Z(xi) is the canopy LAI at measurement point xi. We made a semivariogram based on h and fitted the semivariogram model as follows:
γ = γ 0 + b 1 e 3 h / c
where γ0 is the nugget, b is the sill, and c is the range. The range indicates the distance at which spatial autocorrelation became negligible; we used it as the subplot size. The semivariogram was obtained up to h = 70, where N(h) > 30 and < ½ maximum h. The range of the forest canopy LAI was about 18.25 m (Figure 4). To eliminate autocorrelation, subplots were defined as a circle with a radius of 10 m centered on each LAI measurement point (Figure 5).
The ANPPW and the number of trees (understory and total) within each subplot were calculated. Pearson’s correlation coefficients (r) between canopy LAI and the ANPPW and between the ANPPW and the number of trees in the subplot were calculated. To investigate the relationship between community structure and canopy LAI, the relative dominance of each species was calculated in each subplot and compared with canopy LAI. All analyses were performed in R v. 3.6.0 software (R Core Team (2020)). The spatial autocorrelation of forest canopy LAI was analyzed in the geoR v. 1.8-1.

3. Results

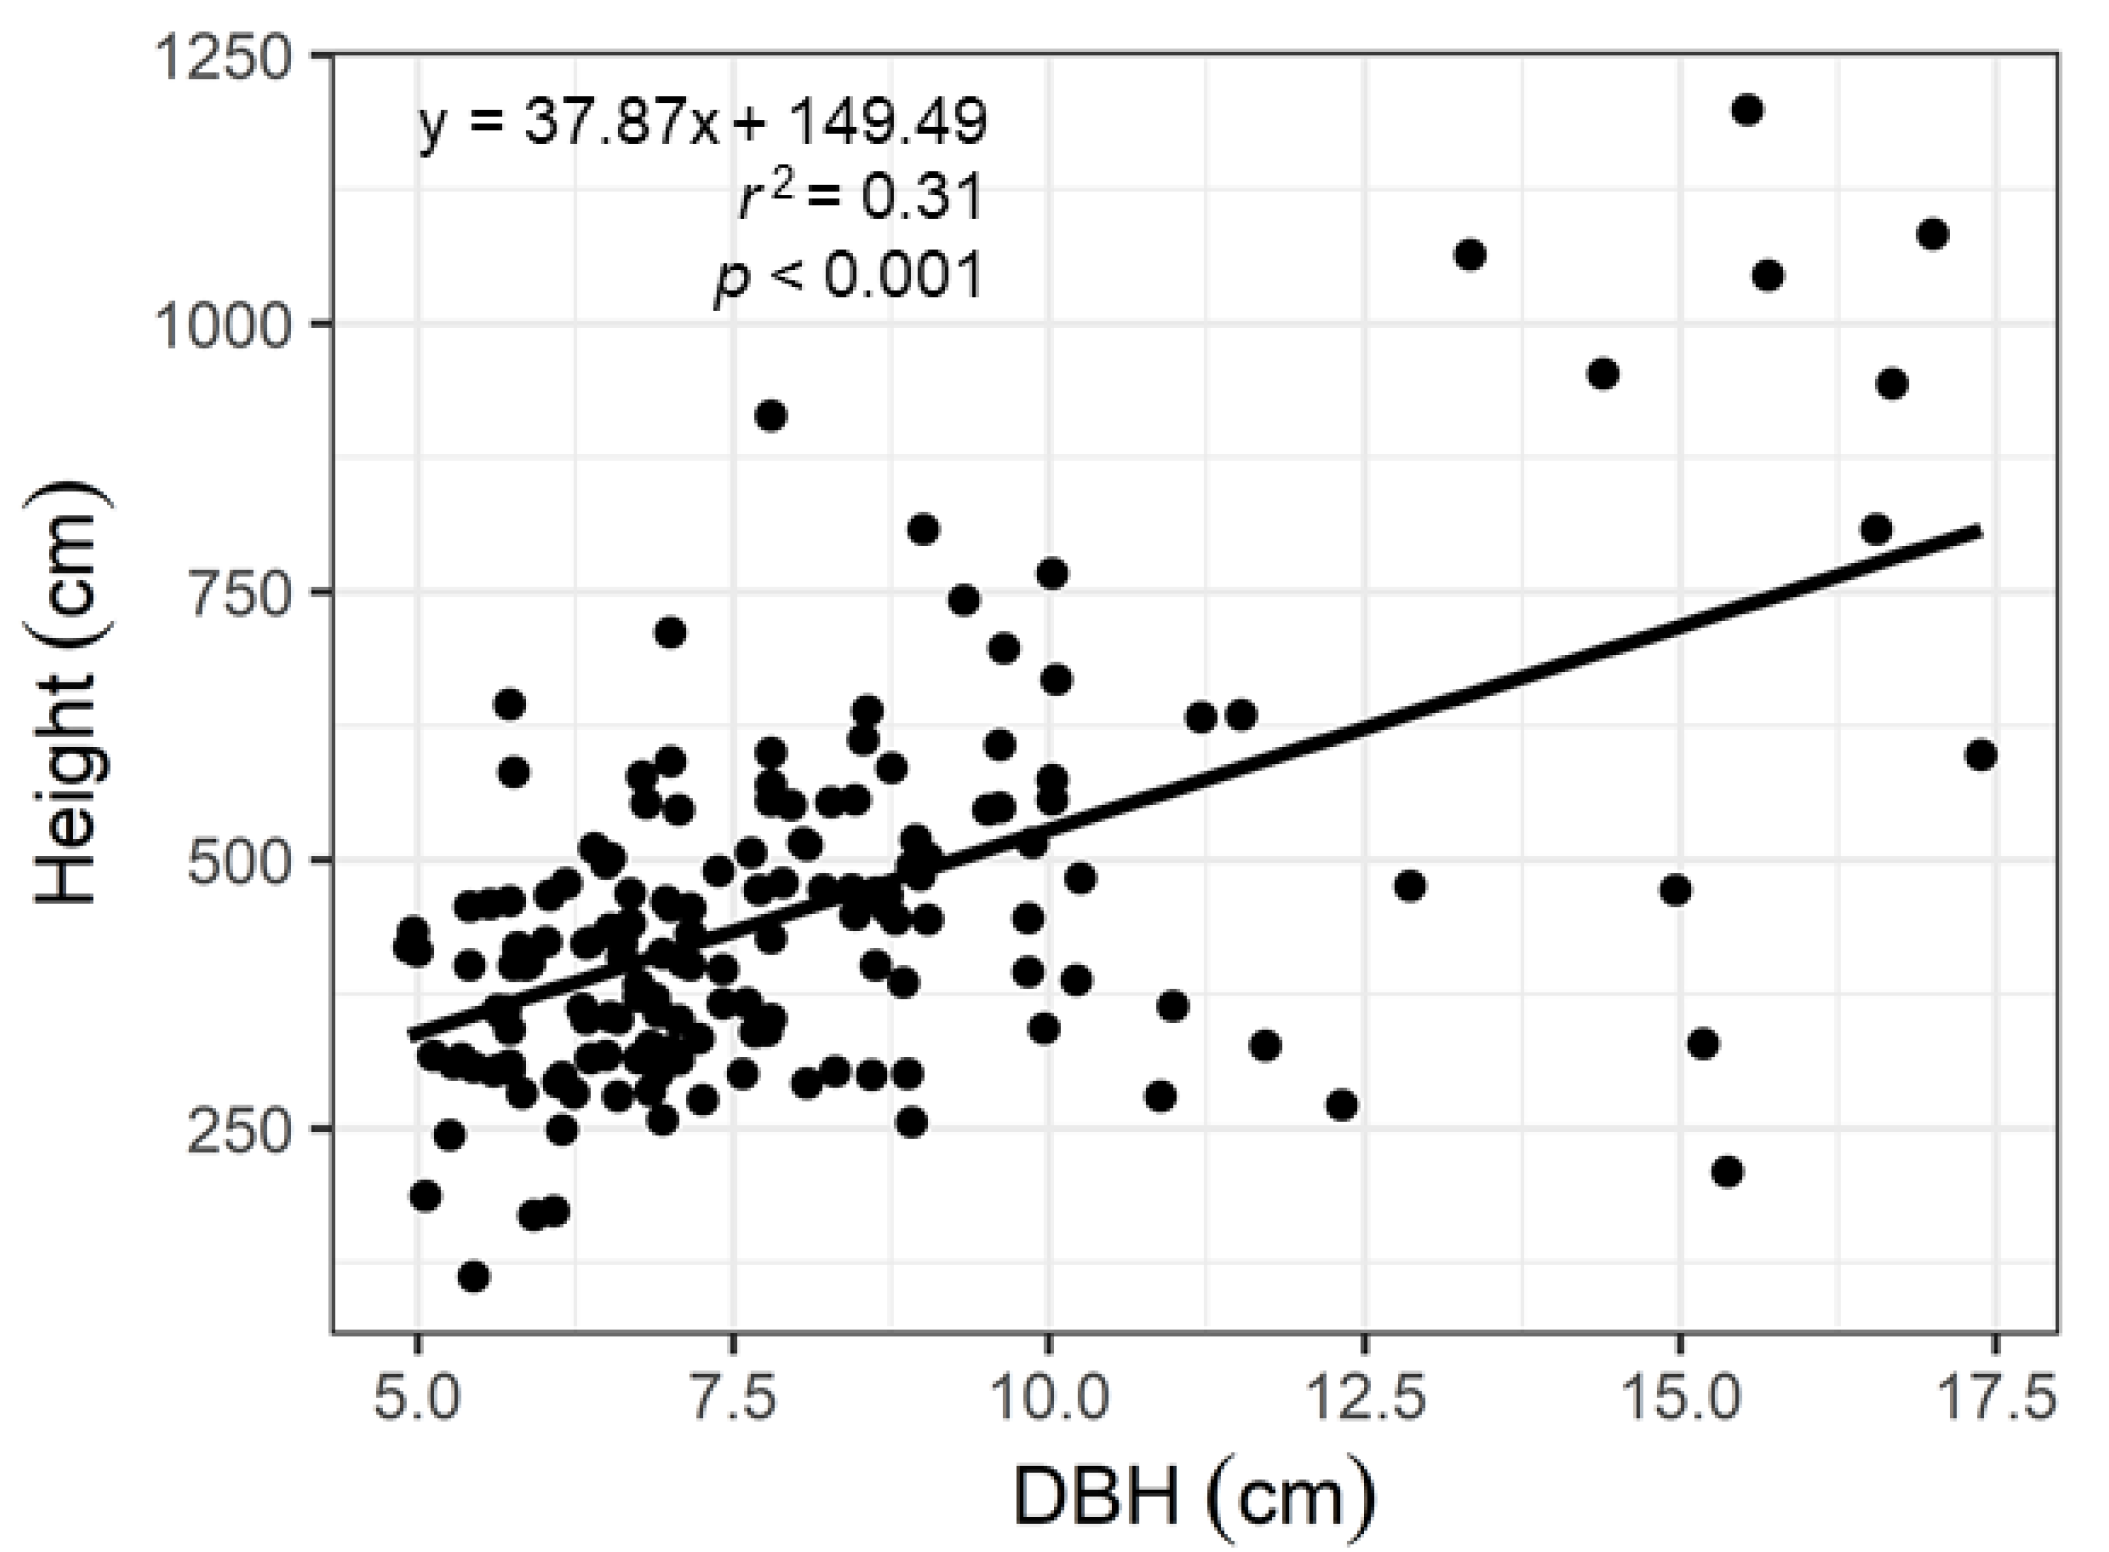
3.1. Forest Inventory Data

Of the 949 trees in the study plot, 687 (72%) were classified as understory trees (Table 2). Among understory trees only, Acer nipponicum was the most abundant, followed by Hydrangea paniculata and Viburnum furcatum. Among all trees, F. crenata was most abundant, followed by Acer nipponicum and H. paniculata. Beech was less dominant among understory trees (66 trees/ha) than among all trees (217 trees/ha).

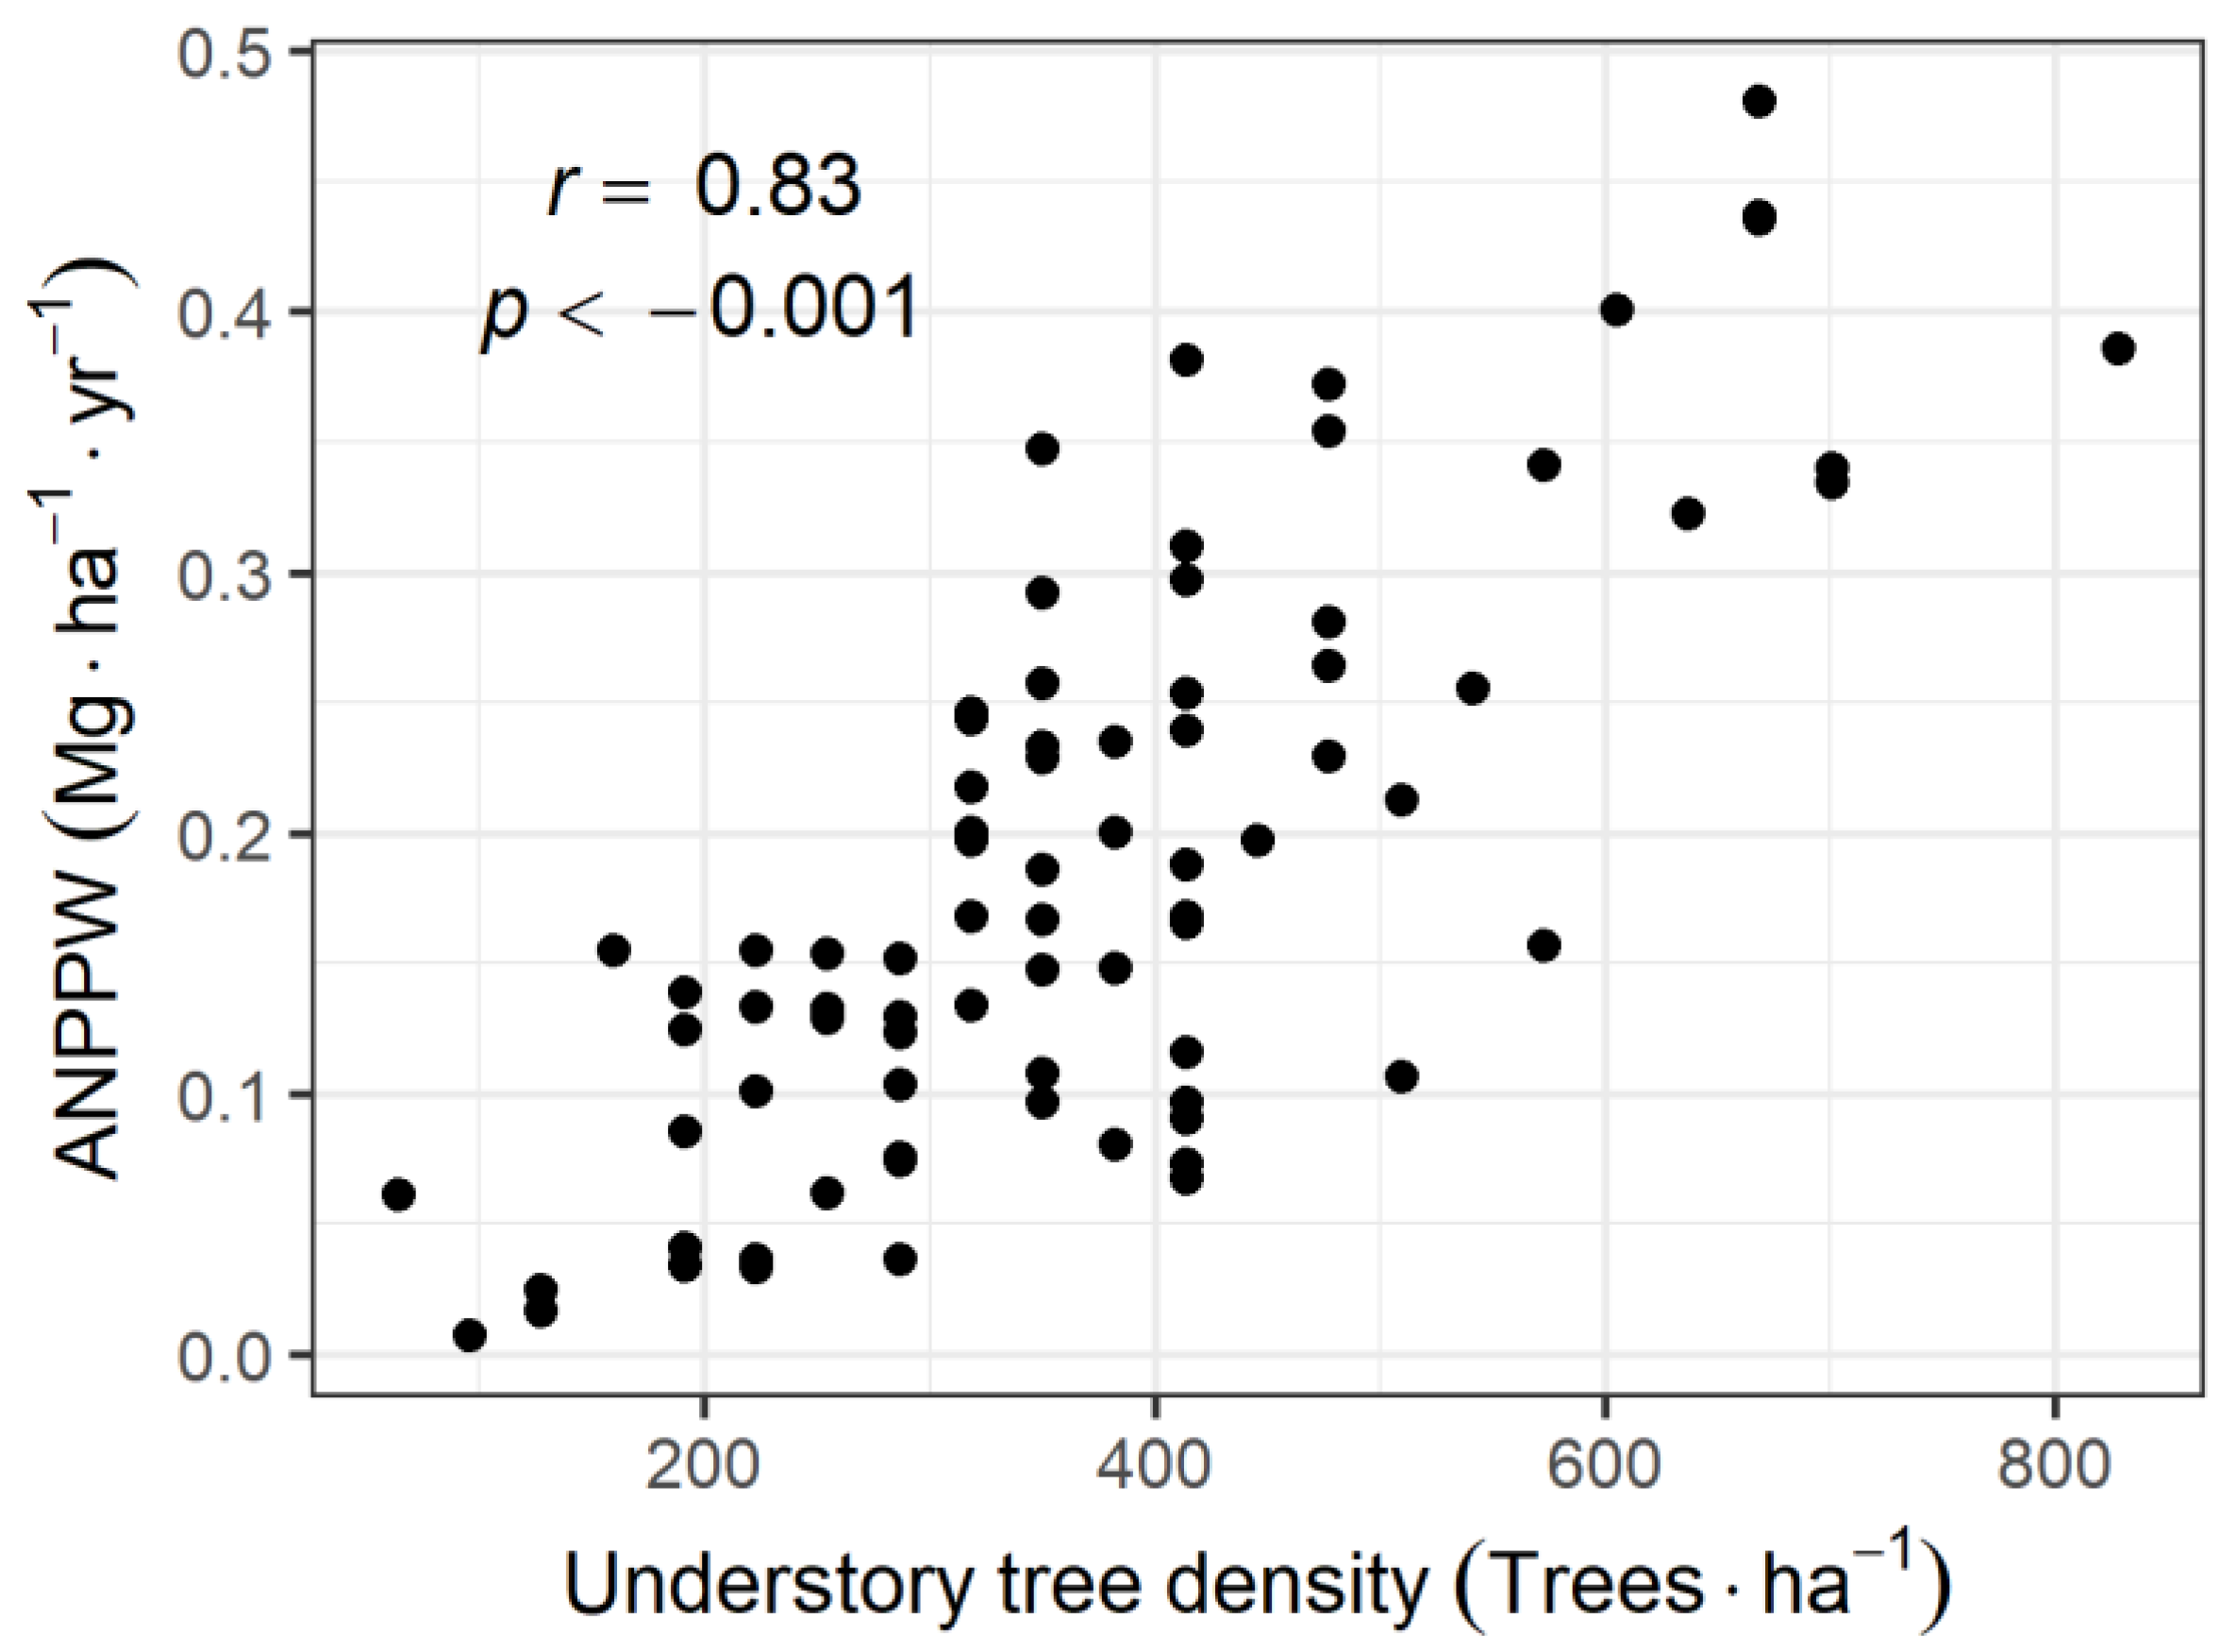
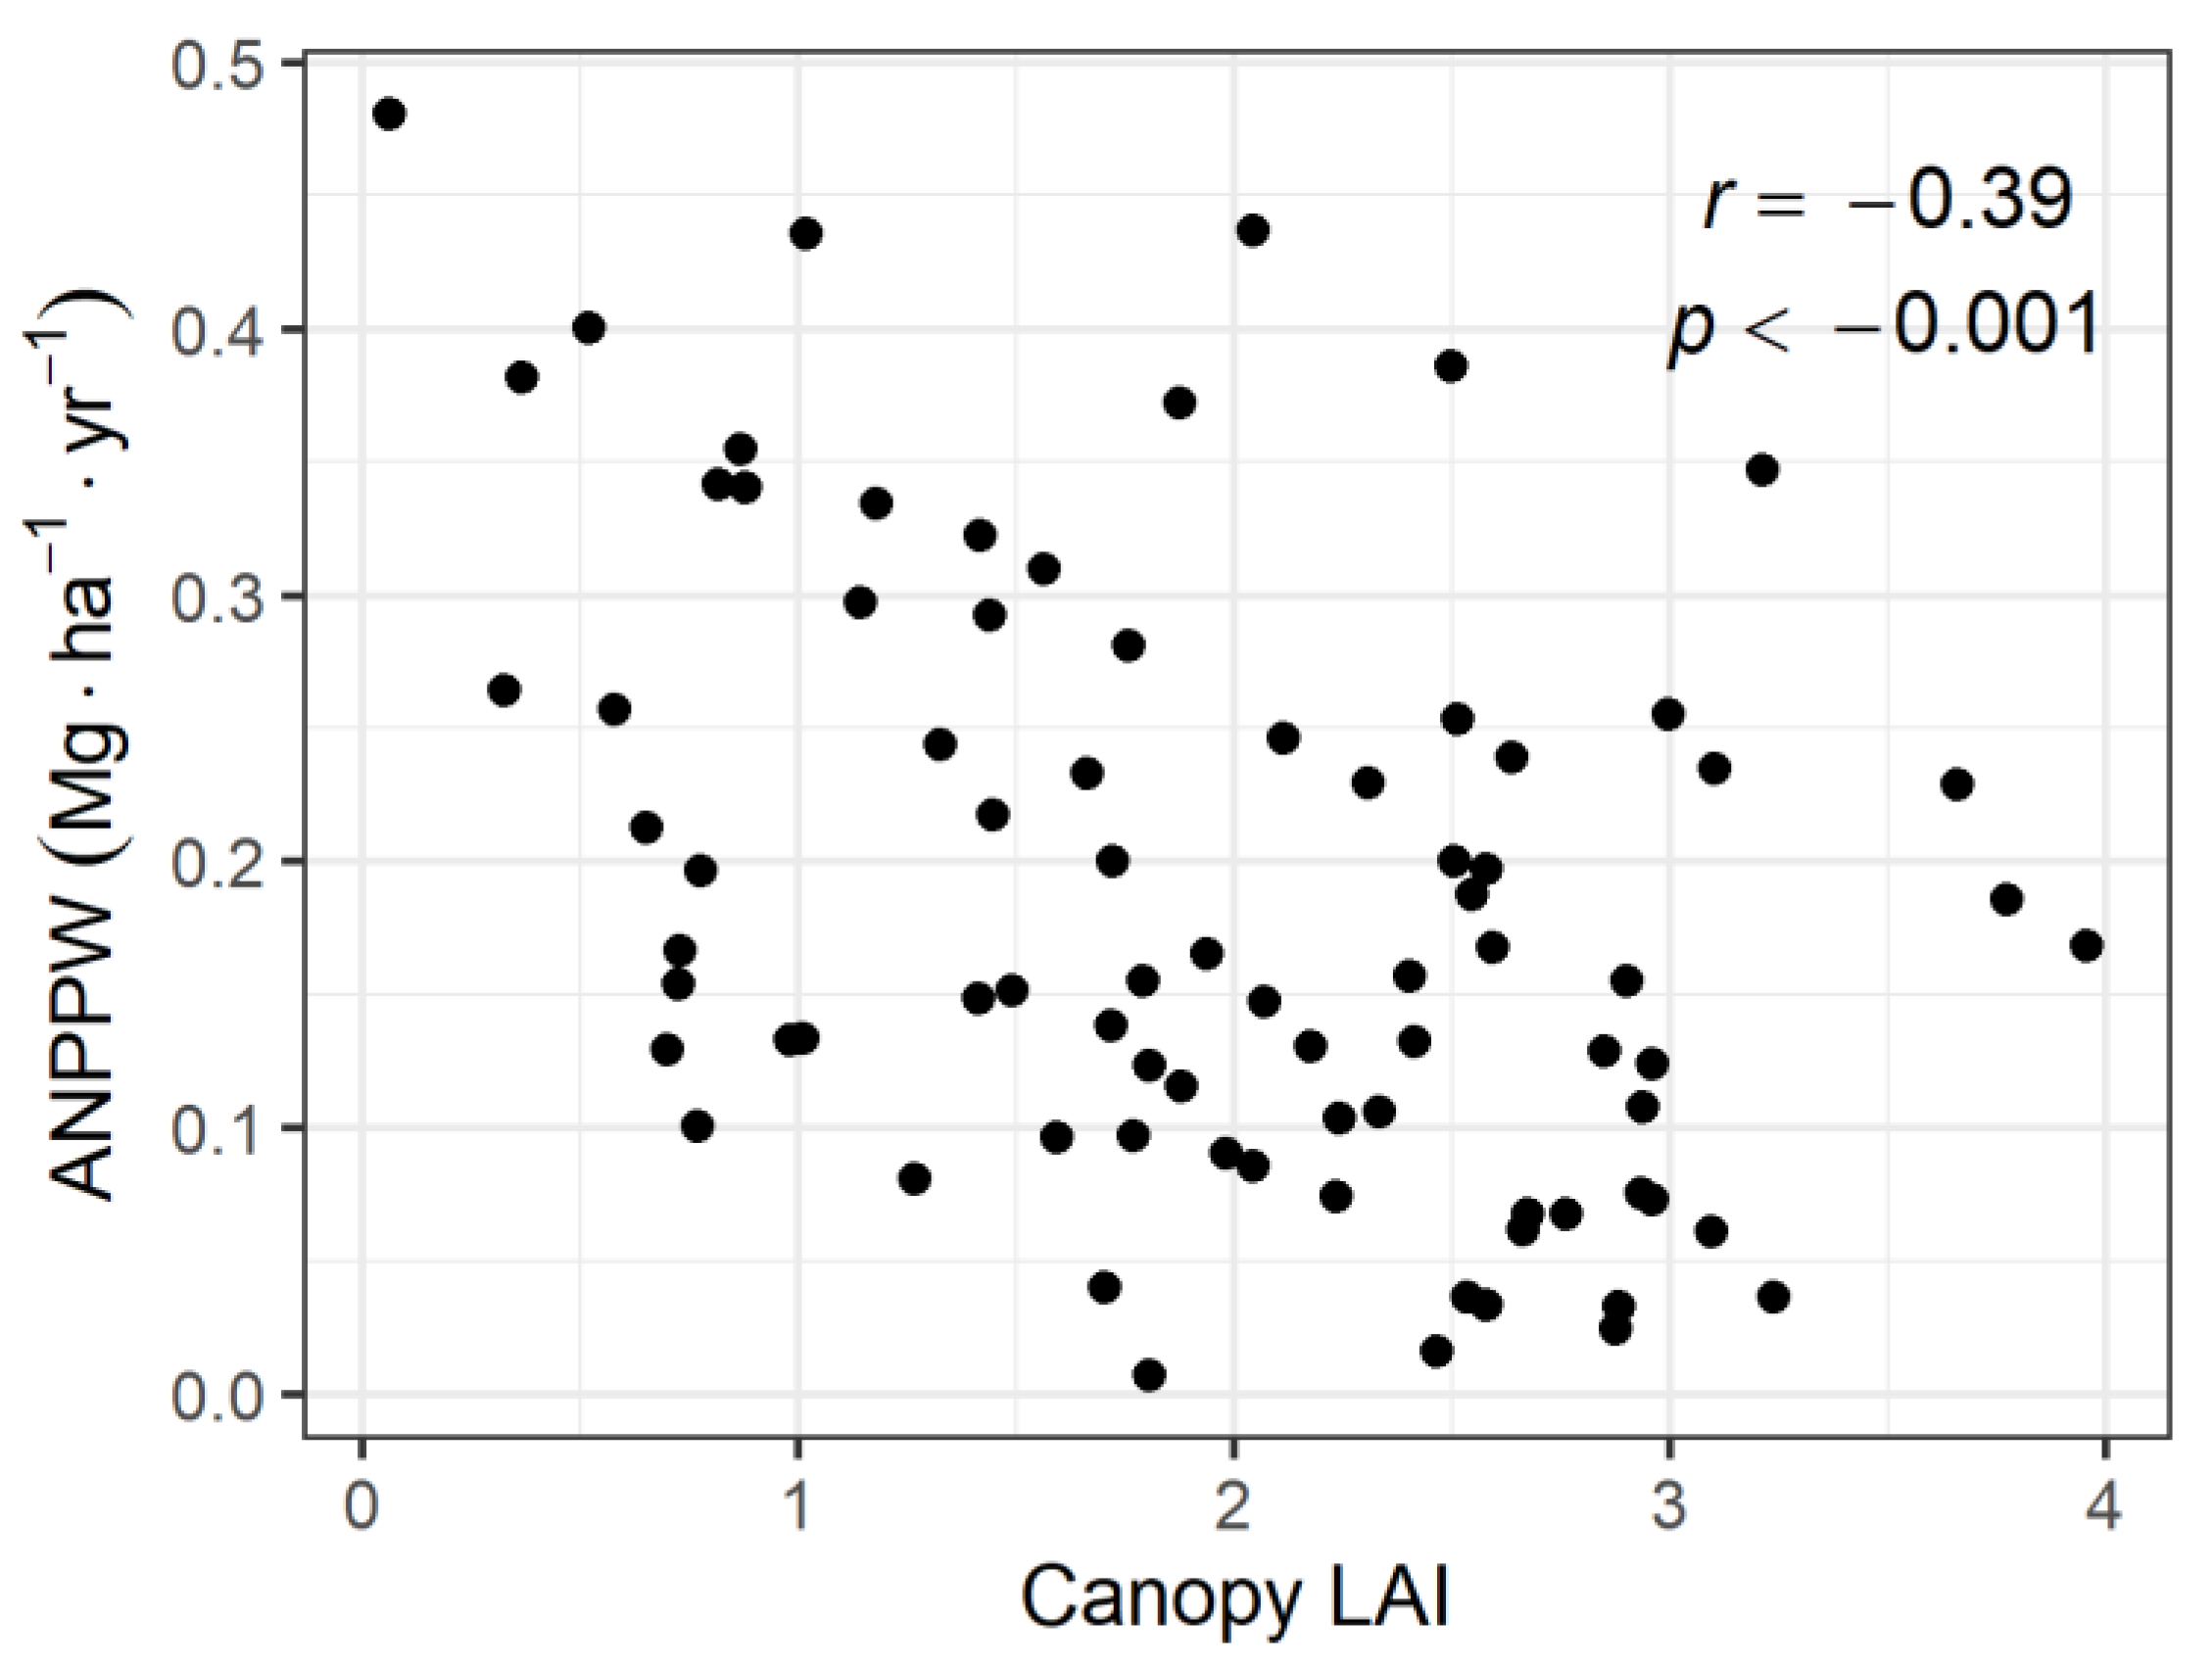
3.2. Relationship between ANPPW and Canopy LAI

The ANPPW of all understory trees in the study plot was 0.19 Mg·ha−1·yr−1, which is 8% of the total ANPPW (including canopy trees) in the study plot. This varied from 0.0072 to 0.48 Mg·ha−1·yr−1 among each subplot. There was a weak negative correlation between the ANPPW of understory trees in each subplot and canopy LAI (r = −0.39, p < 0.001, Figure 6), indicating that the ANPPW of understory trees was larger in gaps than under closed canopy. The ANPPW of understory trees in each subplot correlated with the tree density of individual understory trees (r = 0.83, p < 0.001, Figure 7). This indicates that ANPPW per individual tree is constant in all subplots.

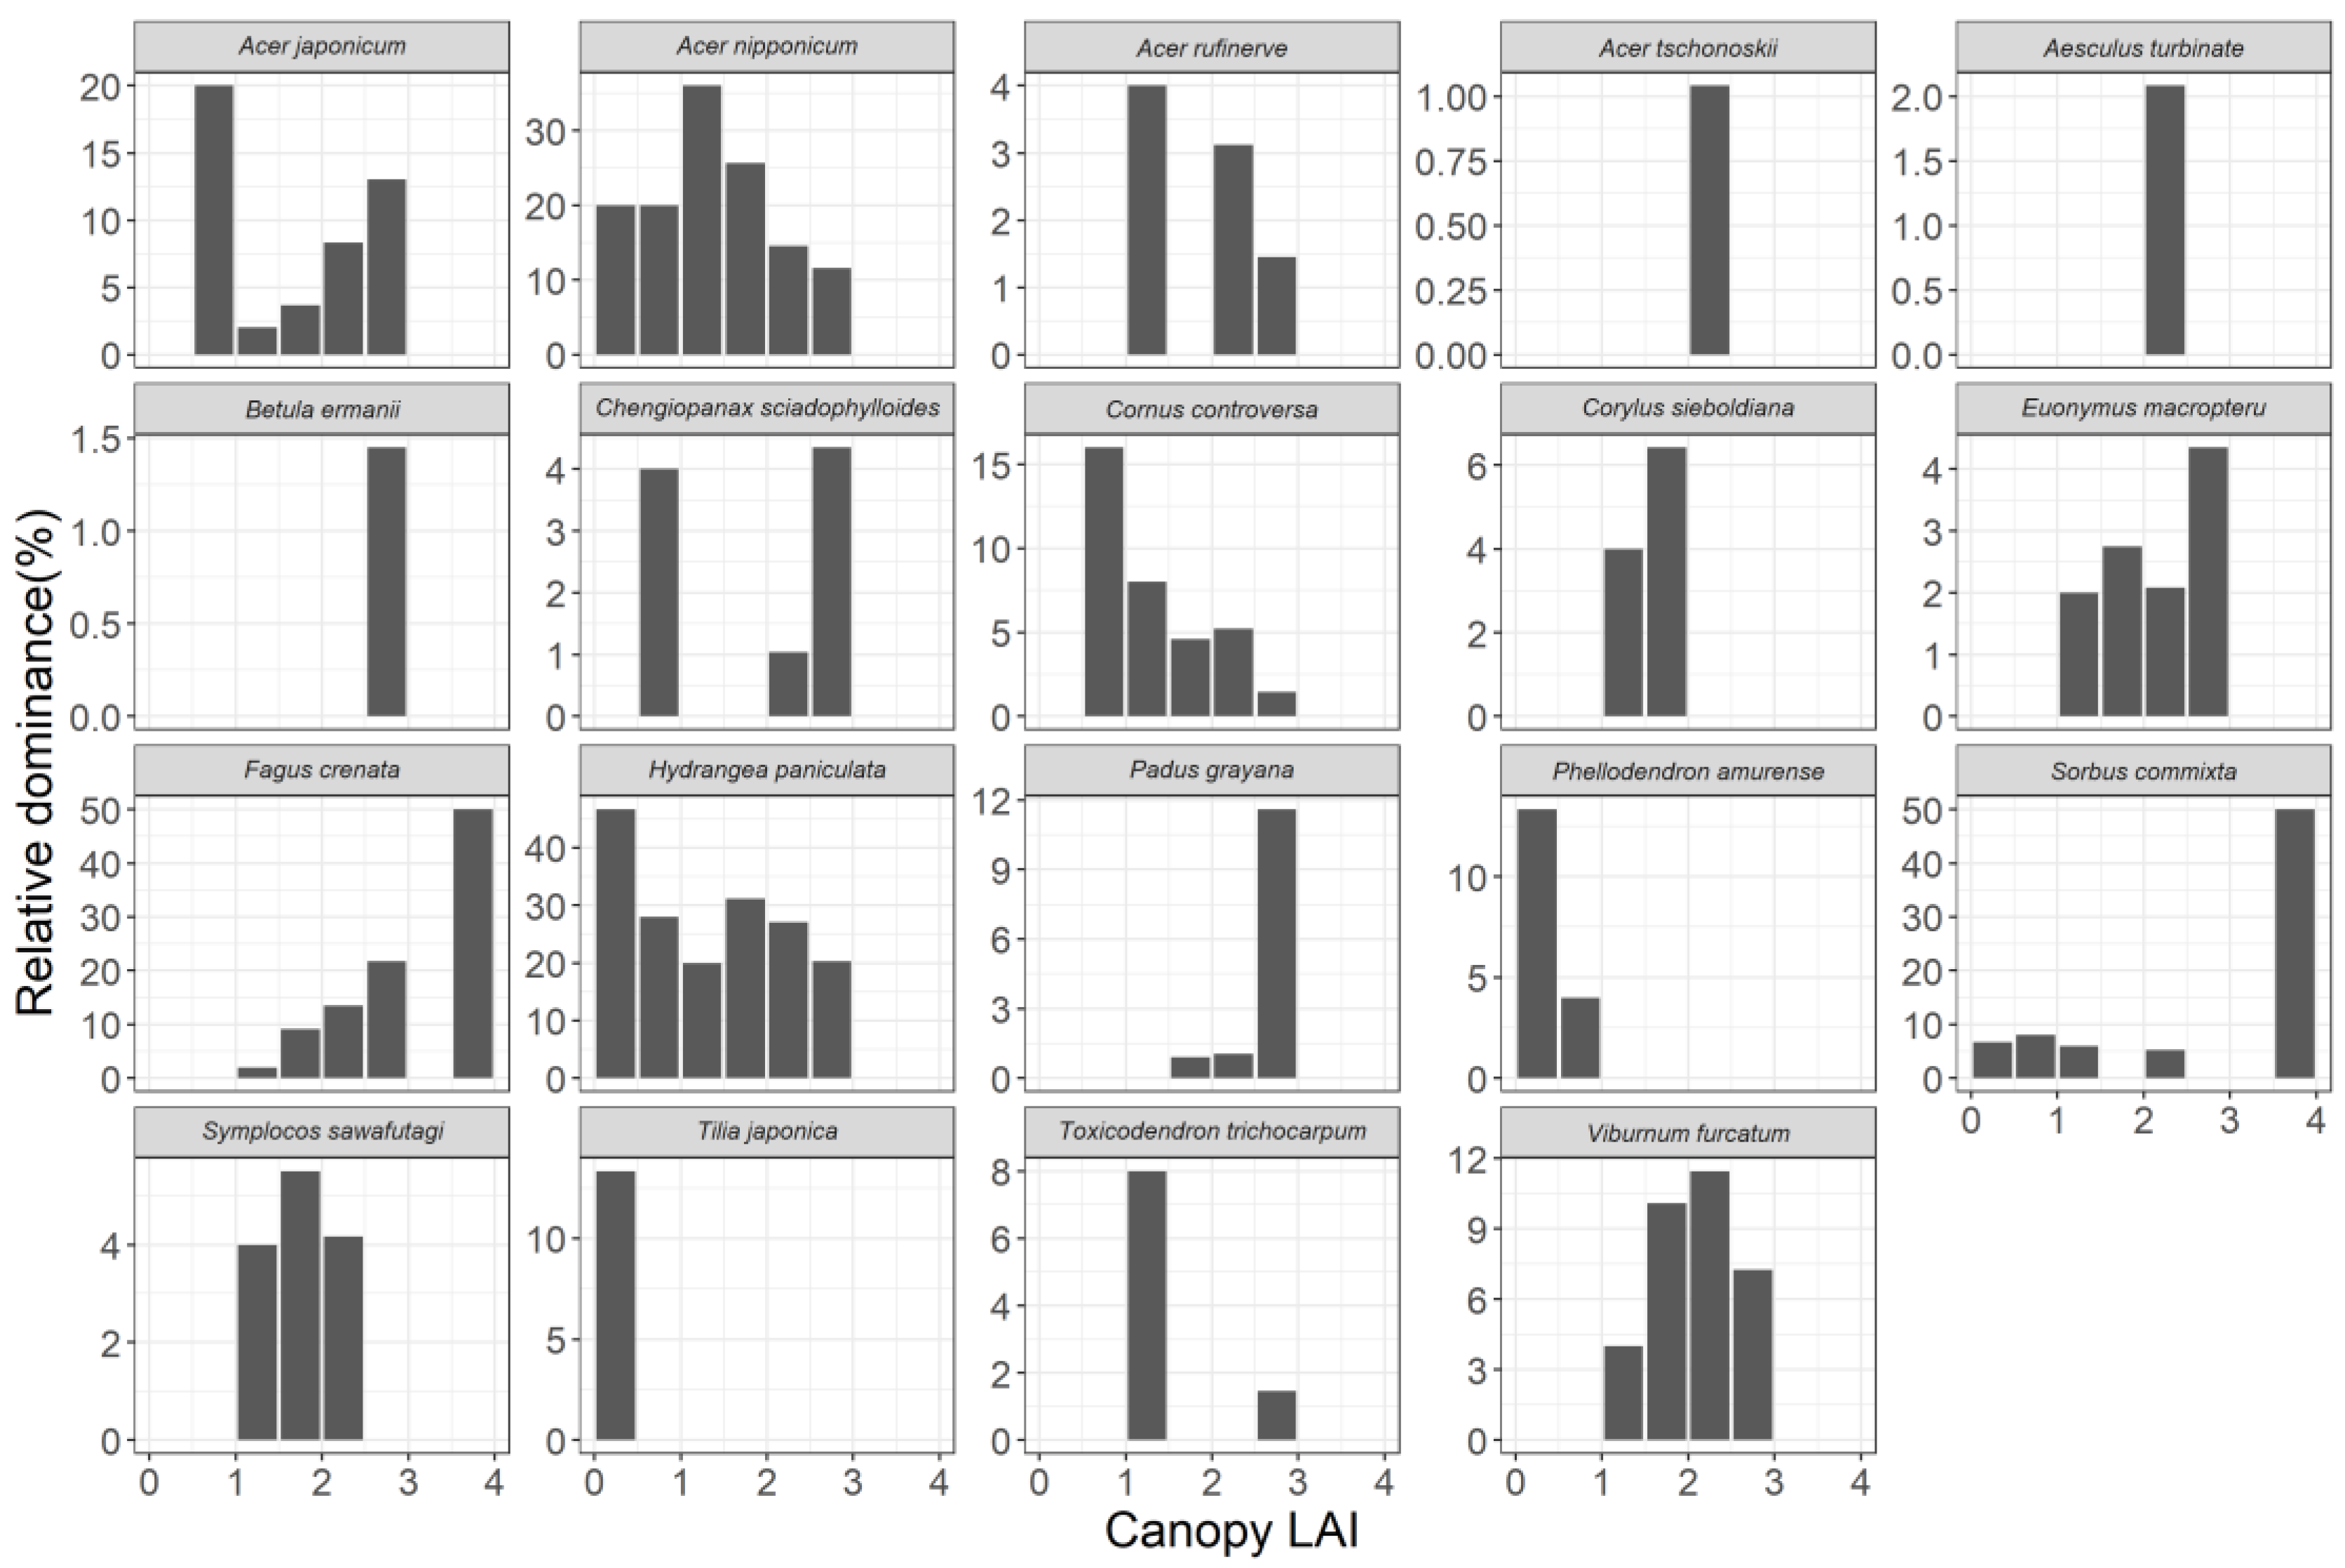
3.3. Relationship between Community Structure and Canopy LAI

The relationship between canopy LAI and the number of individuals in each subplot differed among species (Figure 8). For example, species such as Acer nipponicum, H. paniculata, and Cornus controversa were more abundant in subplots with lower canopy LAI, whereas tree species such as Acer rufinerve, Chengiopanax sciadophylloides, and F. crenata were more abundant in subplots with higher canopy LAI.

4. Discussion

4.1. ANPPW of the Understory Tree Community

The ANPPW of understory trees and canopy LAI were negatively correlated, indicating that light interception by canopy trees has a negative effect on understory trees. The biomass and ANPPW of canopy trees affected the ANPPW of understory vegetation in data from a vegetation inventory database in Canada [28]. As the biomass of canopy trees in tropical forests in South Africa increased, that of understory trees decreased [29]. The ANPPW of canopy trees reduced the ANPPW of understory trees in temperate forests in China [30]. These studies cited the interception of light by canopy trees as the cause of their negative effect on understory trees. Here, we extended this line of inquiry by investigating the relationship between canopy LAI and the ANPPW of understory trees on a fine scale. The spatial scale of variation in canopy LAI is also expected to vary among forests. Although previous studies did not consider the spatial distribution of trees, spatial structure should be considered in order to clarify the relationship between canopy trees and understory trees.
Here, the ANPPW of understory trees accounted for about 8% of the total forest ANPPW. The percentage is expected to be higher in a forest in which gaps occupy a larger area. The average ANPPW of understory trees in a subplot was 0.19 Mg·ha−1·yr−1; however, the maximum ANPPW of understory trees in a subplot was 0.48 Mg·ha−1·yr−1 in which the canopy LAI is 0.06. Although understory trees accounted for only 2.7% of the aboveground stand biomass, they contributed to 8% of the total ANPPW. Thus, the relative growth rate of understory trees was higher than that of canopy trees. However, relative growth rates calculated based on total biomass of understory trees tend to be higher than those of canopy trees because understory trees have smaller dead biomass than canopy trees. If relative biomass was calculated based on living biomass, the relative growth rate of understory trees may not be much higher than that of canopy trees. Understory trees in gaps will have fast turnover and high mortality due to competition between individuals [31]. Gaps may accumulate a large amount of woody litter, including the biomass of the fallen trees that created them. However, the biomass of multi-stemmed species, which tend to have thinner individual trunks, was underestimated because our study included trees with GBH of >15 cm. Furthermore, dwarf bamboo (Sasa senanensis) is also distributed at high density in this forest and has been noted to contribute to primary production [20]. Dwarf bamboo and small-diameter trees and/or shrubs, which were not considered in this study, can also affect understory vegetation structure and production. Future studies will need to include these areas.

4.2. Relationship between Primary Production and Community Structure of the Understory Tree Community

Understory tree density was positively correlated with ANPPW, indicating that understory tree density increases gaps and leads to higher ANPPW, which is consistent with previous findings that understory tree density was higher in gaps created by the mortality of large-diameter trees than under closed canopy [17,32]. The positive correlation observed here indicates that the relative growth rate of understory trees is homogeneous regardless of canopy cover, i.e., available light intensity for understory trees. This implies that light use efficiency is relatively higher for understory trees in the gaps than in the closed canopy. There are several possible explanations. First, species with different light use characteristics may make use of different parts of the heterogeneous light environment (niche differentiation). Our results show that the species composition of understory trees changed with canopy LAI. Trees found under a closed canopy may have a high relative growth rate because they have high shade tolerance. Second, gaps were dominated by shrub species that were no longer growing; we found many shrub species and no beech in the gaps. The efficiency of primary production of shrubs could not increase further because it had already reached its maximum in gaps where light was abundant. Furthermore, shrubs tend to have multiple stems and they grow by increasing the number of their stems or else replacing their old stems for new ones. Therefore, it may be that their growth was hard to detect in their stem width. Third, the growth of understory trees may be suppressed by high competition among understory vegetation in gaps. Such competition should be higher in gaps than under a closed canopy because tree density is higher in gaps. In addition, understory vegetation, such as dwarf bamboo and lianas (Hydrangea petiolaris et al.), sometimes grew densely in gaps at our study site.
Species composition of understory trees changed with canopy LAI (Figure 8). Previous studies have also shown that the species composition of understory trees differs between gaps and under a closed forest canopy [33,34,35]. These studies compared vegetation structure under the binary environmental factors of “gaps” and “closed canopy”. We could determine each species’ preference for gaps or closed canopy by measuring fine-scale canopy LAI, a quantitative environmental index, rather than two discrete categories. Canopy LAI in the study area had a frequency distribution of one peak near the mean, not a binary frequency distribution [22]. This indicates that the light environment changes continuously between gaps and under the closed canopy, and that understory trees can differentiate the niches created by this heterogeneous light environment. Individual species showed the expected light environment distributions. For example, Acer nipponicum and H. paniculata, which possess traits valuable for survival in gaps, were abundant under low-canopy LAI. Both species could maintain a higher electron transport rate under high radiation than other species (data not shown). Hydrangea paniculata is known to take different reproductive forms in gaps and under closed canopy [36]; in gaps it receives sufficient radiation to flower and reproduce sexually. Cornus controversa, which preferred areas of low-canopy LAI, is a shade-intolerant species [37,38]. On the other hand, our results for beech differ from those of previous studies which showed that beech does not grow well in a low-light environment, but grows where canopy trees have died [39,40]. One reason our results may differ from those of previous studies is the plasticity of traits found in beech. At our study site, almost all the beeches have multiple sloping stems, and leaf traits differed between individual stems and branches according to the light environment. In beech forests near the Sea of Japan, young trees tend to have multiple leaning stems that allow them to bear heavy snow weight [41]. The plasticity of leaf traits due to the unique tree form in this study area may allow beech to survive under low canopy LAI. Another possible reason is the dominance of dwarf bamboo (Sasa senanensis) on the forest floor in our plots, especially in gaps, which may result in fewer juvenile beech trees. Dwarf bamboo is a clonal plant, and often dominates the forest floor in East Asia, especially in very snowy areas; once every few decades, the entire genet blooms and then dies out. Under these circumstances, it may not be easy for beech, which produces a large number of seeds every few years, to become established in the gaps. Previous studies have reported a significant increase in the survival of beech seedlings in gaps where bamboo dieback and good seed reproduction occur simultaneously [42]. These two events would seldom overlap, and the gaps will be dominated by shade-tolerant species until regeneration occurs by growing small trees of canopy species, thus forming new canopies.
It is also possible that tree species with small numbers of individuals or multi-stemmed trees may not represent the actual distribution characteristics of the species. For example, Tilia japonica is a shade-tolerant species that has been shown [43,44] to occur in a wide variety of light environments, from within gaps to under closed canopies. We found it only in gaps, but we observed only three individuals, which may not be representative of the full range of light habitats that it can occupy. Similarly, species with easily branched trunks, such as Corylus sieboldiana and Toxicodendron trichocarpum, are prone to having broken individual stems following heavy snow cover. Because we counted only individuals with a DBH larger than the threshold, we underestimated the number of individuals of these species in gaps. We used vegetation data that were already available, but in future studies of the vegetation structure and distribution of understory communities, it would be worthwhile to target trees with smaller DBH, or to incorporate tree shape diversity into the DBH threshold.
Our study site is a secondary forest that had been used as a fuelwood forest. However, it had developed a gap mosaic structure similar to many primary forests. A gap mosaic structure allows the coexistence of tree species with different shade tolerances, and it maintains high diversity. The similarity of the gap mosaic structure found within a natural forest to that found within our site, despite being a secondary forest, was probably caused by the low-use intensity. Selective cutting increases the diversity of understory trees [45], likely because it creates an uneven-aged forest with environmental heterogeneity [46]. Thinning for fuelwood might create a heterogeneous environment and allow the coexistence of early- to late-successional species. Our study indicates that we can increase the diversity and the ANPPW of secondary forests by managing the forests to create a gap mosaic structure. Our study will be important for the future development of secondary forests into highly diverse and functional forests.

4.3. Summary

The ANPPW of understory trees was negatively correlated with canopy LAI, indicating that the high availability of light in gaps leads to higher ANPPW by understory trees. Underlying this relationship between ANPPW of understory trees and canopy LAI, we found higher tree density and different species composition in gaps versus under the canopy. We infer that the species composition of the understory community changes along the canopy LAI gradient according to species-specific shade tolerance. The results of this study suggest that understory trees make efficient use of light through niche differentiation across the spatially heterogeneous light environment of the forest floor, resulting in higher ANPPW of the entire understory layer. 2013.

Author Contributions

Conceptualization, Y.T. and M.H.; methodology, Y.T.; software, Y.T.; validation, Y.T.; formal analysis, Y.T.; investigation, Y.T. and M.H.; resources, M.H. and H.I.; data curation, Y.T. and H.I.; writing—original draft preparation, Y.T. and M.H.; writing—review and editing, M.H. and H.I.; visualization, Y.T.; supervision, M.H.; project administration, M.H.; funding acquisition, M.H. All authors have read and agreed to the published version of the manuscript.

Funding

This study was supported in part by the Master’s Degree Program of the Department of Mountain Studies, University of Tsukuba. This study was supported by Support for Pioneering Research Initiated by the Next Generation Grant Number JPMJSP2124. This study is a part of the Ministry of the Environment’s “Monitoring Sites 1000” Project. This work was supported by JSPS KAKENHI Grant Number JP19H02999.

Institutional Review Board Statement

Not applicable.

Informed Consent Statement

Not applicable.

Data Availability Statement

Not applicable.

Acknowledgments

We thank the members of the Terrestrial Ecosystem Ecology Laboratory, University of Tsukuba, for their assistance in field research.

Conflicts of Interest

The funders had no role in the design of the study; in the collection, analyses, or interpretation of data; in the writing of the manuscript; or in the decision to publish the results.

References

  1. Yamamoto, S.-I. Gap dynamics in climaxFagus crenata forests. Bot. Mag. Tokyo 1989, 102, 93–114. [Google Scholar] [CrossRef]
  2. Attiwill, P.M. The disturbance of forest ecosystems: The ecological basis for conservative management. For. Ecol. Manag. 1994, 63, 247–300. [Google Scholar] [CrossRef]
  3. Diaci, J. Regeneration dynamics in a Norway spruce plantation on a silver fir-beech forest site in the Slovenian Alps. For. Ecol. Manag. 2002, 161, 27–38. [Google Scholar] [CrossRef]
  4. Ritter, E.; Dalsgaard, L.; Einhorn, K.S. Light, temperature and soil moisture regimes following gap formation in a semi-natural beech-dominated forest in Denmark. For. Ecol. Manag. 2005, 206, 15–33. [Google Scholar] [CrossRef]
  5. Ni, X.; Berg, B.; Yang, W.; Li, H.; Liao, S.; Tan, B.; Yue, K.; Xu, Z.; Zhang, L.; Wu, F. Formation of forest gaps accelerates C, N and P release from foliar litter during 4 years of decomposition in an alpine forest. Biogeochemistry 2018, 139, 321–335. [Google Scholar] [CrossRef] [Green Version]
  6. Glatthorn, J.; Feldmann, E.; Pichler, V.; Hauck, M.; Leuschner, C. Biomass Stock and Productivity of Primeval and Production Beech Forests: Greater Canopy Structural Diversity Promotes Productivity. Ecosystems 2018, 21, 704–722. [Google Scholar] [CrossRef]
  7. Majasalmi, T.; Rautiainen, M. The impact of tree canopy structure on understory variation in a boreal forest. For. Ecol. Manag. 2020, 466, 118100. [Google Scholar] [CrossRef] [PubMed]
  8. Mitamura, M.; Yamamura, Y.; Nakano, T. Large-scale canopy opening causes decreased photosynthesis in the saplings of shade-tolerant conifer, Abies veitchii. Tree Physiol. 2008, 29, 137–145. [Google Scholar] [CrossRef] [Green Version]
  9. Tobita, H.; Utsugi, H.; Kitao, M.; Kayama, M.; Uemura, A.; Kitaoka, S.; Maruyama, Y. Variation in photoinhibition among Sasa senanensis, Quercus mongolica, and Acer mono in the understory of a deciduous broad-leaved forest exposed to canopy gaps caused by typhoons. Trees 2010, 24, 307–319. [Google Scholar] [CrossRef]
  10. Poorter, L. Leaf traits show different relationships with shade tolerance in moist versus dry tropical forests. New Phytol. 2009, 181, 890–900. [Google Scholar] [CrossRef] [PubMed]
  11. Poorter, H.; Niinemets, Ü.; Poorter, L.; Wright, I.J.; Villar, R.; Binkley, D.; Campoe, O.C.; Gspaltl, M.; Forrester, D.I.; Hendrik, P.; et al. Causes and consequences of variation in leaf mass per area (LMA): A meta-analysis. New Phytol. 2009, 182, 565–588. [Google Scholar] [CrossRef] [PubMed]
  12. Osada, N.; Yasumura, Y.; Ishida, A. Leaf nitrogen distribution in relation to crown architecture in the tall canopy species, Fagus crenata. Oecologia 2014, 175, 1093–1106. [Google Scholar] [CrossRef]
  13. Abe, S.; Masaki, T.; Nakashizuka, T. Factors influencing sapling composition in canopy gaps of a temperate deciduous forest. Vegetatio 1995, 120, 21–32. [Google Scholar] [CrossRef]
  14. Yamamoto, S. Gap regeneration of major tree species in different forest types of Japan. Vegetatio 1996, 127, 203–213. [Google Scholar] [CrossRef]
  15. Tilman, D. The Influence of Functional Diversity and Composition on Ecosystem Processes. Science 1997, 277, 1300–1302. [Google Scholar] [CrossRef] [Green Version]
  16. Forrester, D.I.; Kohnle, U.; Albrecht, A.T.; Bauhus, J. Complementarity in mixed-species stands of Abies alba and Picea abies varies with climate, site quality and stand density. For. Ecol. Manag. 2013, 304, 233–242. [Google Scholar] [CrossRef]
  17. Muscolo, A.; Bagnato, S.; Sidari, M.; Mercurio, R. A review of the roles of forest canopy gaps. J. For. Res. 2014, 25, 725–736. [Google Scholar] [CrossRef]
  18. Lu, D.; Wang, G.G.; Yu, L.; Zhang, T.; Zhu, J. Seedling survival within forest gaps: The effects of gap size, within-gap position and forest type on species of contrasting shade-tolerance in Northeast China. For. Int. J. For. Res. 2018, 91, 470–479. [Google Scholar] [CrossRef]
  19. Ida, H. Forest structure in a beech (Fagus crenata Blume) stand on a 1-ha permanent plot for the Monitoring Sites 1000 Project in Kayanodaira, central Japanese snowbelt. Bull. Inst. Nat. Educ. Shiga Height. Shinshu Univ. 2013, 50, 33–40. [Google Scholar]
  20. Cai, Y.; Tanioka, Y.; Kitawaga, T.; Ida, H.; Hirota, M. Gross primary production of dwarf bamboo, Sasa senanensis, in a mature beech forest with a substantial gap-mosaic structure. J. Plant Res. 2021, 134, 209–221. [Google Scholar] [CrossRef]
  21. Ishihara, M.I.; Suzuki, S.N.; Nakamura, M.; Enoki, T.; Fujiwara, A.; Hiura, T.; Hoshino, D.; Homma, K.; Hoshizaki, K.; Ida, H.; et al. Forest stand structure, composition, and dynamics in 34 sites over Japan. Ecol. Res. 2011, 26, 1007–1008. [Google Scholar] [CrossRef]
  22. Tanioka, Y.; Cai, Y.; Ida, H.; Hirota, M. A spatial relationship between canopy and understory leaf area index in an old-growth cool-temperate deciduous forest. Forests 2020, 11, 1037. [Google Scholar] [CrossRef]
  23. Komiyama, A.; Nakagawa, M.; Kato, S. Common Allometric Relationships for Estimating Tree Biomasses in Cool Temperate Forests of Japan. J. Jpn. For. Soc. 2011, 93, 220–225. [Google Scholar] [CrossRef] [Green Version]
  24. Kishima, T.; Okamoto, S.; Hayashi, S. Atlas of Wood in Colour; Hoikusha: Osaka, Japan, 1962. [Google Scholar]
  25. Clark, D.A.; Brown, S.; Kicklighter, D.W.; Chambers, J.Q.; Thomlinson, J.R.; Ni, J.; Deborah, A.; Clark Sandra Brown David, W.; Kicklighter Jeffrey, Q.; Chambers John, R.; et al. Measuring net primary production in forests: Concepts and field methods. Ecol. Appl. 2001, 11, 356–370. [Google Scholar] [CrossRef]
  26. Ewers, B.E.; Pendall, E. Spatial patterns in leaf area and plant functional type cover across chronosequences of sagebrush ecosystems. Plant Ecol. 2008, 194, 67–83. [Google Scholar] [CrossRef]
  27. Liu, Z.; Jiang, F.; Zhu, Y.; Li, F.; Jin, G. Spatial heterogeneity of leaf area index in a temperate old-growth forest: Spatial autocorrelation dominates over biotic and abiotic factors. Sci. Total Environ. 2018, 634, 287–295. [Google Scholar] [CrossRef]
  28. Zhang, Y.; Chen, H.Y.H.; Taylor, A.R. Positive species diversity and above-ground biomass relationships are ubiquitous across forest strata despite interference from overstorey trees. Funct. Ecol. 2017, 31, 419–426. [Google Scholar] [CrossRef]
  29. Mensah, S.; Du Toit, B.; Seifert, T. Diversity–biomass relationship across forest layers: Implications for niche complementarity and selection effects. Oecologia 2018, 187, 783–795. [Google Scholar] [CrossRef] [PubMed]
  30. Xu, W.; Luo, W.; Zhang, C.; Zhao, X.; von Gadow, K.; Zhang, Z. Biodiversity-ecosystem functioning relationships of overstorey versus understorey trees in an old-growth temperate forest. Ann. For. Sci. 2019, 76, 64. [Google Scholar] [CrossRef]
  31. Kumar, P.; Chen, H.Y.H.; Searle, E.B.; Shahi, C. Dynamics of understorey biomass, production and turnover associated with long-term overstorey succession in boreal forest of Canada. For. Ecol. Manag. 2018, 427, 152–161. [Google Scholar] [CrossRef]
  32. Zhu, J.; Lu, D.; Zhang, W. Effects of gaps on regeneration of woody plants: A meta-analysis. J. For. Res. 2014, 25, 501–510. [Google Scholar] [CrossRef]
  33. Shibano, S.; Watanabe, S. Stratification of a Fagus crenata stand in the Ohira-yama area. Trans. Meet. Hokkaido Branch Jpn. For. Soc. 1989, 37, 64–66. [Google Scholar] [CrossRef]
  34. Ishida, M.; Kikuzawa, K.; Asai, T.; Mizui, N.; Seiwa, K. Distribution and height growth of young trees in the canopy gap and in the closed stand. J. Jpn. For. Soc. 1991, 73, 145–150. [Google Scholar]
  35. Chávez, V.; Macdonald, S.E. The influence of canopy patch mosaics on understory plant community composition in boreal mixedwood forest. For. Ecol. Manag. 2010, 259, 1067–1075. [Google Scholar] [CrossRef]
  36. Kanno, H.; Seiwa, K. Sexual vs. vegetative reproduction in relation to forest dynamics in the understorey shrub, Hydrangea paniculata (Saxifragaceae). Plant Ecol. Former. Veg. 2004, 170, 43–53. [Google Scholar] [CrossRef]
  37. Masaki, T.; Tanaka, H.; Tanouchi, H.; Sakai, T.; Nakashizuka, T. Structure, dynamics and disturbance regime of temperate broad-leaved forests in Japan. J. Veg. Sci. 1999, 10, 805–814. [Google Scholar] [CrossRef]
  38. Masaki, T.; Nakashizuka, T. Seedling demography of Swida controversa: Effect of light and distance to conspecifics. Ecology 2002, 83, 3497–3507. [Google Scholar] [CrossRef]
  39. Wagner, S.; Collet, C.; Madsen, P.; Nakashizuka, T.; Nyland, R.D.; Sagheb-Talebi, K. Beech regeneration research: From ecological to silvicultural aspects. For. Ecol. Manag. 2010, 259, 2172–2182. [Google Scholar] [CrossRef]
  40. Feldmann, E.; Drößler, L.; Hauck, M.; Kucbel, S.; Pichler, V.; Leuschner, C. Canopy gap dynamics and tree understory release in a virgin beech forest, Slovakian Carpathians. For. Ecol. Manag. 2018, 415–416, 38–46. [Google Scholar] [CrossRef]
  41. Fujita, N. One-sided distribution of the component species of the Japanese beech forest along either the Pacific or the Japan Sea. Acta Phytotaxon. Geobot. 1987, 38, 311–329. [Google Scholar]
  42. Abe, M.; Miguchi, H.; Nakashizuka, T. An interactive effect of simultaneous death of dwarf bamboo, canopy gap, and predatory rodents on beech regeneration. Oecologia 2001, 127, 281–286. [Google Scholar] [CrossRef]
  43. Komiyama, A. Tree age composition and the regeneration process of a secondary deciduous broad-leaved forest. J. Jpn. For. Soc. 1989, 71, 374–379. [Google Scholar]
  44. Kato, S.; Komiyama, A. Distribution patterns of understory trees and diffuse light under the canopy of a beech forest. Jpn. J. Ecol. 1999, 49, 10. [Google Scholar]
  45. Duguid, M.C.; Ashton, M.S. A meta-analysis of the effect of forest management for timber on understory plant species diversity in temperate forests. For. Ecol. Manag. 2013, 303, 81–90. [Google Scholar] [CrossRef]
  46. Bartels, S.F.; Chen, H.Y.H. Is understory plant species diversity driven by resource quantity or resource heterogeneity? Ecology 2010, 91, 1931–1938. [Google Scholar] [CrossRef] [PubMed]
Figure 1. Map of (a) Japan and (b) the study site location.
Forests 13 00494 g001
Figure 2. (a) Aerial photograph of the study plot taken in October 2019. (b) Schematic of LAI measurement points. x and y indicate coordinates in the study plot; ○ LAI measurement points.
Forests 13 00494 g002
Figure 3. The relationship between diameter at breast height (DBH) and understory tree height. Solid line shows the results of the linear model.
Forests 13 00494 g003
Figure 4. Semivariogram of LAI. The horizontal axis is the distance between the measurement points, and the vertical axis is the semivariance. A high semivariance indicates a weak correlation between data points collected at that distance.
Forests 13 00494 g004
Figure 5. Subplots (large circles) and LAI measurement points (small circles) in the study plot.
Forests 13 00494 g005
Figure 6. The relationship between canopy LAI and ANPPW in each subplot. Each point indicates one subplot (n = 81).
Forests 13 00494 g006
Figure 7. The relationship between tree density and ANPPW of understory trees in each subplot. Each point indicates one subplot (n = 81).
Forests 13 00494 g007
Figure 8. The relationship between the relative dominance of each species and canopy LAI in the subplots.
Forests 13 00494 g008
Table 1. Vegetation structure of the study plot (species are listed in descending order of relative dominance).
Species NameTrees (Trees/ha)Mean DBH 1 (cm)Maximum DBH (cm)Basal Area 2 (m2/ha)Relative Dominance 3 (%)
Fagus crenata21729.95101.2527.0382.17
Betula ermanii548.1976.551.173.57
Aesculus turbinata1722.5050.170.952.89
Acer nipponicum1907.5419.320.932.84
Hydrangea paniculata1356.9812.320.541.63
Chengiopanax
sciadophylloides
2215.3138.610.521.57
Acer japonicum758.2018.560.441.35
Viburnum furcatum856.188.850.260.79
Phellodendron amurense1014.0926.070.190.59
Sorbus commixta347.8214.170.180.54
Cornus controversa526.219.170.160.49
Padus grayana217.7210.980.100.31
Acer pictum134.7034.700.100.29
Acer rufinerve118.9411.840.070.22
Euonymus macropterus186.748.500.070.20
Symplocos sawafutagi225.767.160.060.18
Tilia japonica79.6216.230.060.17
Corylus sieboldiana205.566.690.050.15
Toxicodendron
trichocarpum
55.706.400.010.04
Acer tschonoskii27.428.090.010.03
Vegetation data were provided by the Ministry of the Environment Monitoring Sites 1000 Project (SIN01.zip, downloaded from http://www.biodic.go.jp/moni1000/findings/data/index.html accessed on 19 June 2020). 1 Trunk diameter at breast height (1.3 m). 2 The sum of the area at breast height (basal area, BA) of each stem. 3 Species total BA as a percentage of site total BA.
Table 2. Number of total and understory trees of each species and understory trees as a percentage of total trees for each species.
Species NameDensity, All Trees (Trees/ha)Density, Understory Trees (Trees/ha)Understory Trees as a Percentage of Total (%)
Fagus crenata2176630.42
Betula ermanii5120.00
Aesculus turbinata17423.53
Acer nipponicum19016285.26
Hydrangea paniculata13512794.07
Chengiopanax sciadophylloides22731.82
Acer japonicum755776.00
Viburnum furcatum8585100.00
Phellodendron amurense10330.00
Sorbus commixta342882.35
Cornus controversa5252100.00
Padus grayana211780.95
Acer pictum100.00
Acer rufinerve11872.73
Euonymus macropterus1818100.00
Symplocos sawafutagi2222100.00
Tilia japonica7342.86
Corylus sieboldiana2020100.00
Toxicodendron trichocarpum55100.00
Acer tschonoskii22100.00
Total94968772.392
Publisher’s Note: MDPI stays neutral with regard to jurisdictional claims in published maps and institutional affiliations.

