Article

Tree-Ring Stable Carbon Isotope as a Proxy for Hydroclimate Variations in Semi-Arid Regions of North-Central China

1
Key Laboratory of Desert and Desertification, Northwest Institute of Eco-Environment and Resources, Chinese Academy of Sciences, Lanzhou 730000, China
2
Department of Geography, Swansea University, Singleton Park, Swansea SA2 8PP, UK
3
College of Water Conservancy and Hydropower Engineering, Gansu Agricultural University, Lanzhou 730070, China
*
Author to whom correspondence should be addressed.
Forests 2022, 13(4), 492; https://doi.org/10.3390/f13040492
Submission received: 29 January 2022 / Revised: 9 March 2022 / Accepted: 20 March 2022 / Published: 22 March 2022
(This article belongs to the Section Forest Ecology and Management)

Abstract

:
Carbon and oxygen isotope ratios (δ13C and δ18O) were measured in annual tree-ring cellulose samples dated from 1756 to 2015 CE. These samples were extracted from Chinese pine (Pinus tabulaeformis Carr.) trees located in a semi-arid region of north-central China. We found that tree-ring δ13C and δ18O values both recorded similar climatic signals (e.g., temperature and moisture changes), but found that tree-ring δ13C exhibited a stronger relationship with mean temperature, precipitation, average relative humidity, self-calibrating Palmer drought severity index (scPDSI), and standard precipitation evaporation index (SPEI) than δ18O during the period 1951–2015 CE. The strongest correlation observed was between tree-ring δ13C and scPDSI (previous June to current May), which explains ~43% of the variance. The resulting 130-year reconstruction reveals severe drought events in the 1920s and a sustained drying trend since the 1980s. This hydroclimate record based on tree-ring δ13C data also reveals similar dry and wet events to other proxy data (i.e., tree-ring width and historical documentation) that have allowed reconstructions to be made across the northern fringe of the Asian summer monsoon region. Our results suggest that both large-scale modes of climate variability (e.g., El Niño-Southern Oscillation, Pacific Decadal Oscillation, and North Atlantic Oscillation) and external forcing (e.g., solar variability) may have modulated moisture variability in this region. Our results imply that the relationship between tree-ring δ18O and local climate is less well-characterized when compared to δ13C and may be affected more strongly by the influences of these different atmospheric circulation patterns. In this semi-arid region, tree-ring δ13C appears to represent a better tool with which to investigate historical moisture changes (scPDSI).

1. Introduction

Recent changes in the distribution of precipitation along the northern fringe of the Asian summer monsoon (ASM) region in north-central China are believed to have been influenced by the changing intensity of the Asian monsoon and westerly atmospheric circulation patterns in the semi-arid zone [1]. The Ha Si Mountain (HSM) nature reserve is located at the northern edge of the ASM and on the boundary of several semi-arid regions. The HSM is bordered to the north by the Tengger Desert, to the southeast by the Yellow River, and to the west by the north-eastern Tibetan Plateau. This unique geographical position makes the HSM one of China’s most important water conservation regions. The western and southern part of the HSM is influenced by a westerly wind and the ASM system, respectively. Therefore, changes to hydroclimate have important effects on agriculture and the economy in this region. Severe drought events in the past millennium have occurred over different timescales and have had negative socio-economic impacts on regions near the HSM [2,3]. Recent studies suggest that drought events will intensify and become more frequent with global warming, largely due to decreased precipitation and increased evaporation [4]. An improved understanding of long-term moisture variability and the complex moisture sources that influence this particular region is needed to manage resources more effectively and to further reduce uncertainties in climate models used to describe the effects of global warming.
Over the past decades, substantial efforts have been made to reconstruct past climate changes across East Asia using tree rings [5,6,7,8]. Tree-ring stable isotopes data require fewer samples to be analyzed compared to the interpretation of ring widths in classical dendroclimatology [9]. Tree-ring stable isotopes can track temporal changes in how trees use carbon dioxide and water and record how these changes relate to environmental (climatic) controls. Tree-ring δ18O data reflect the isotopic composition of local moisture, rainfall, or atmospheric circulation patterns, which may be modified by environmental or physiological factors [10]. Tree-ring stable isotopes, therefore, have become an important proxy for reconstructing paleoclimate variations with the advantages of precise physiological mechanisms [11] and more reliable climate signals [12,13,14,15,16]. Previous tree-ring research in China has demonstrated that δ18O variability may be sensitive to changes in hydroclimate [17,18,19,20,21,22]. Stable carbon isotopes in tree rings should reflect environmental controls affecting carbon assimilation (i.e., related to solar insolation and temperature) and stomatal conductance (i.e., related to hydroclimate and moisture stress) [23,24]. Studies of tree-ring δ13C in China have shown instability in the climate signals preserved in trees from the Qinghai-Tibetan Plateau [25] and western China [26]. More research is required to better understand these indicators and to determine the dominant (local) climatic controls on tree-ring δ18O and δ13C.
Previous studies have focused on the suitability of tree-ring widths as a record of the Palmer drought severity index [27] or tree-ring δ18O as a proxy for relative humidity [28] in HSM regions. However, it remains unclear to what extent tree-ring δ13C could be a potential proxy for climate variability in these regions. This study evaluates the relationships between tree-ring δ13C and regional climate changes and assesses the suitability of tree-ring δ13C as a proxy for changes in moisture in this region, which may, in turn, be useful for monitoring and predicting monsoon variability through time.

2. Materials and Methods
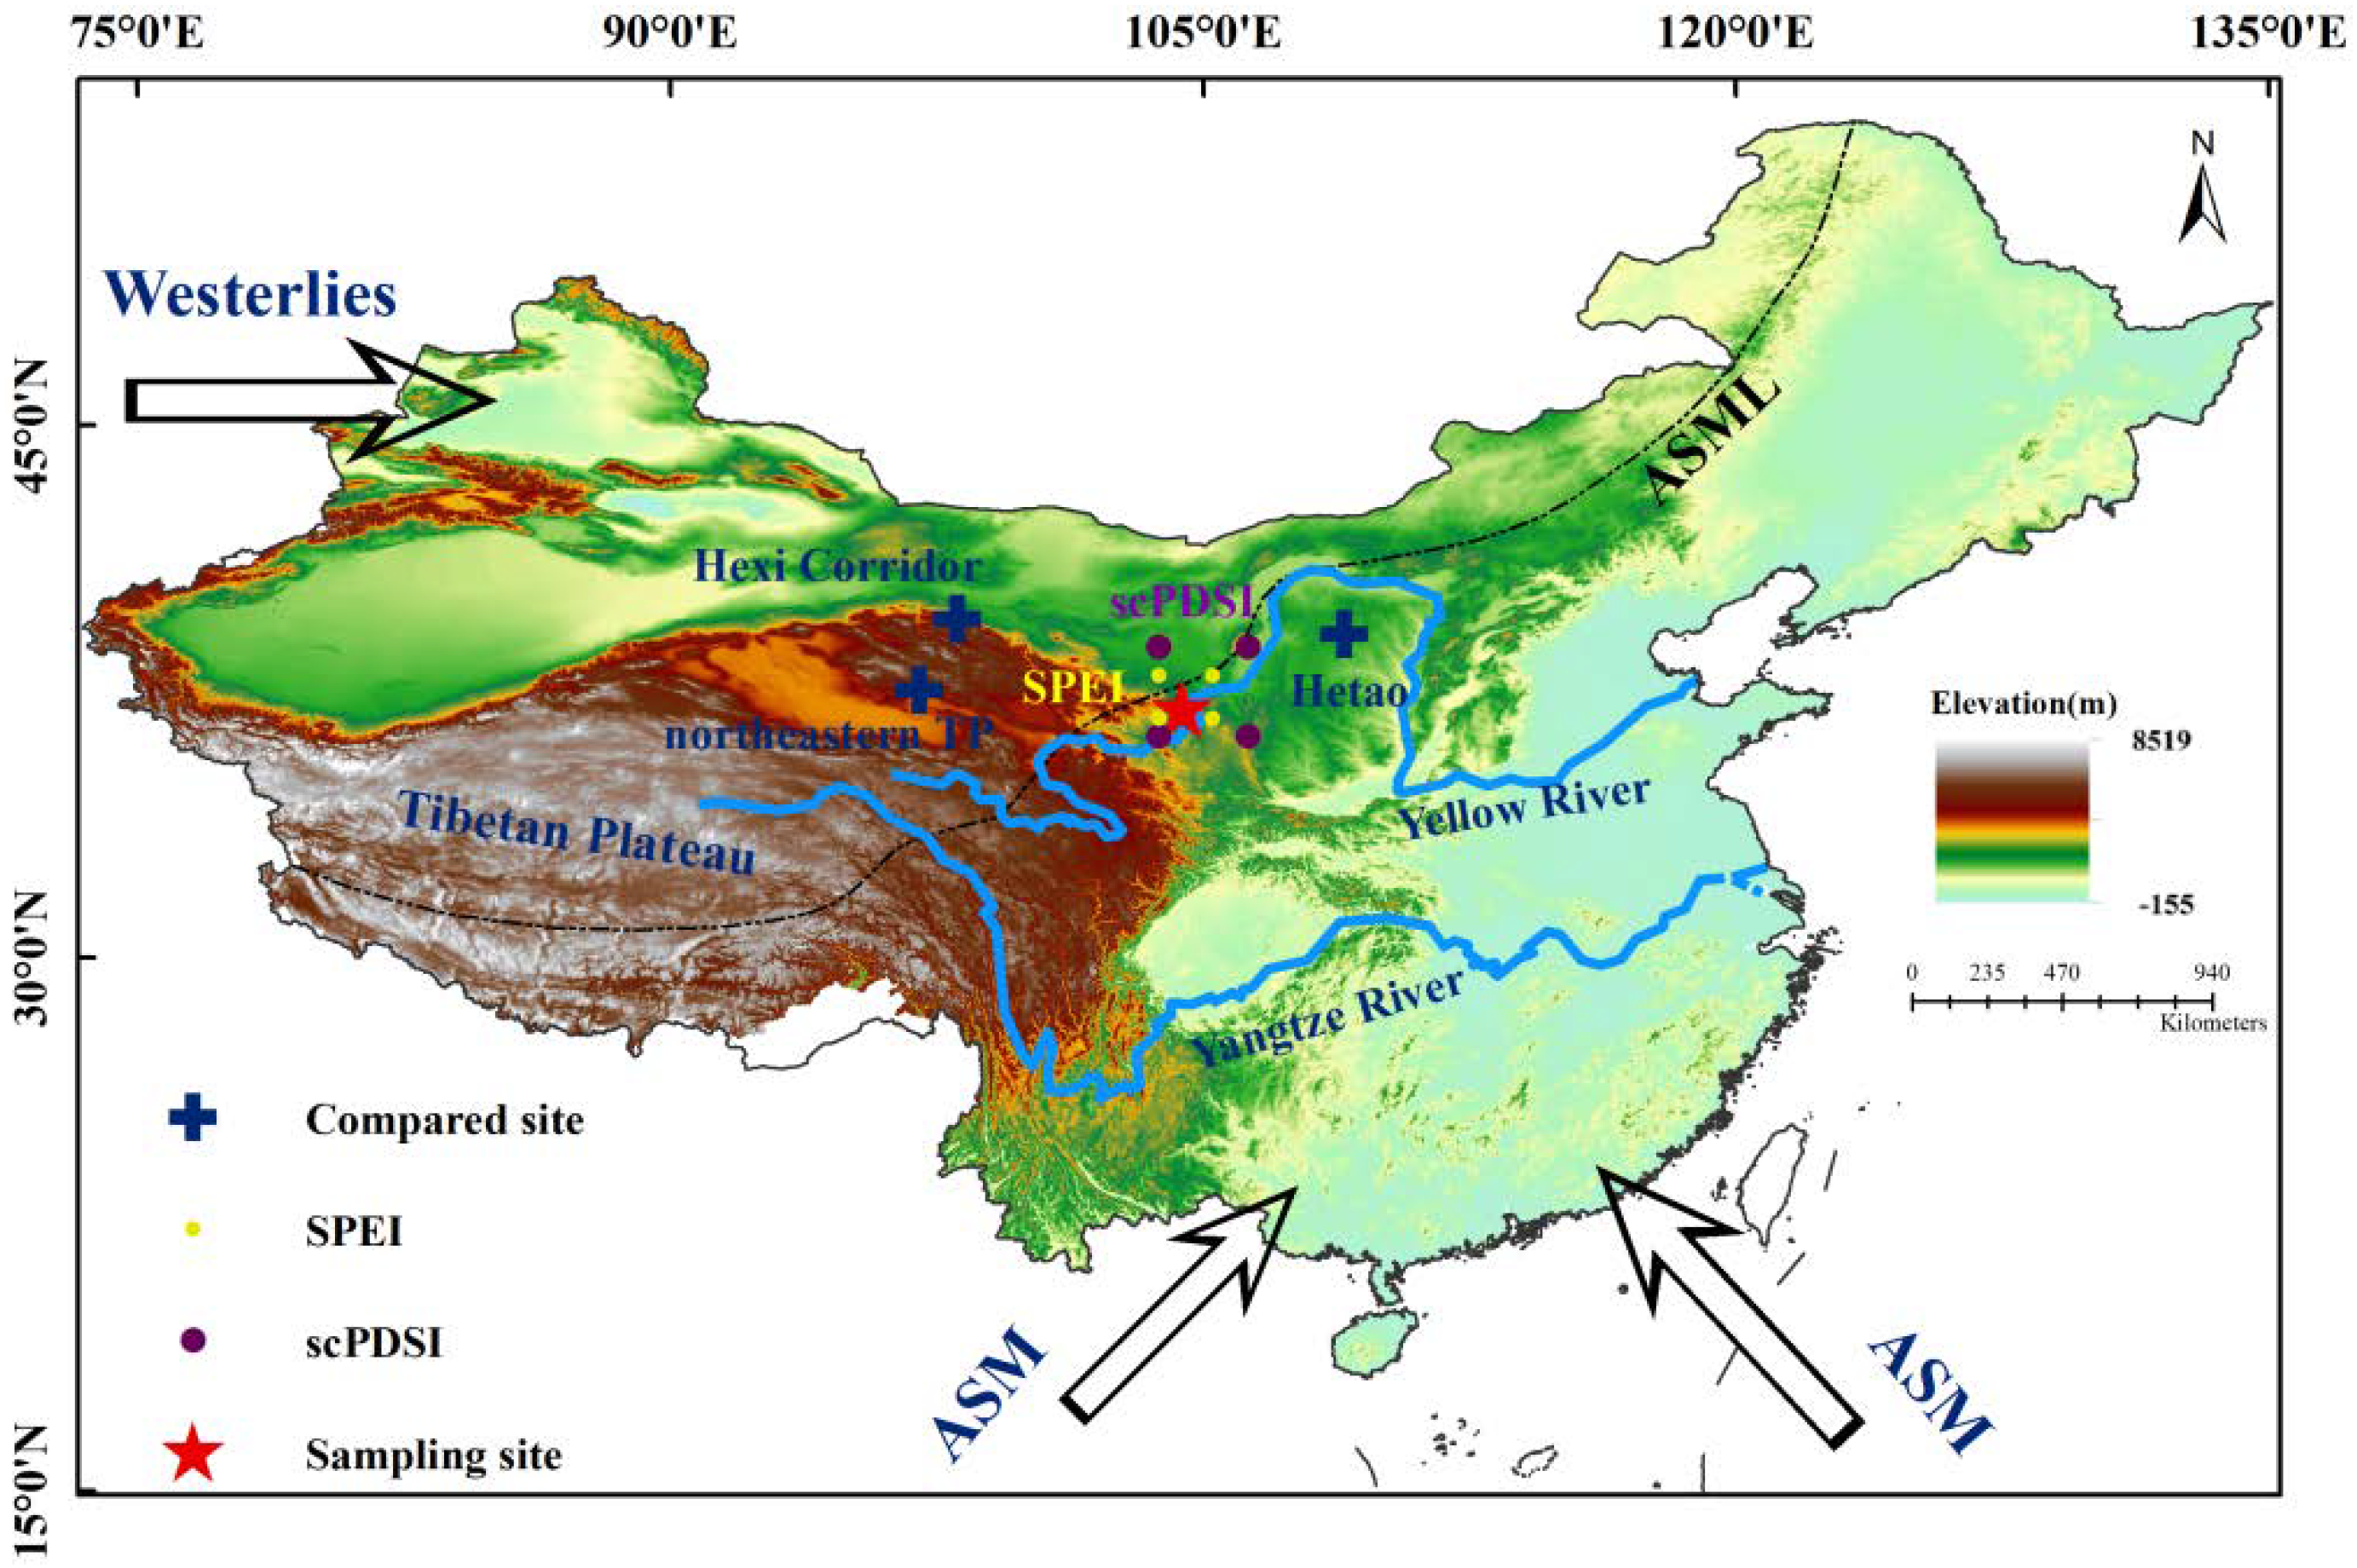
2.1. Sampling Site

Tree-ring samples were extracted from Chinese pine (Pinus tabulaeformis Carr.) trees situated in the HSM nature reserve (104.6° E, 37° N, 2400–3017 m above sea level) in the Jingyuan County, Gansu Province (Figure 1). The average annual precipitation at the Jingyuan meteorological station during the period 1951–2015 CE was 232 mm, with more than 55% of the annual precipitation concentrated in the summer months (i.e., from June to August). Mean annual precipitation trend (−0.42 mm/year) and summer rain trend (−0.39 mm/year) showed a similar decreasing trend from 1951 to 2015 CE (Figure 2). The average annual temperature in the study region was 9.14 °C, which increased by around 0.04 °C/year after 1977 (Figure 2). Relative humidity decreased by −0.037% each year over the entire period of meteorological observation.

2.2. Sample Processing and Chronological Assessment

Chinese pine is the dominant species in the study area but grows sparsely on the northern slope of the HSM. A tree-ring width chronology covering the period 1681 to 2010 CE was first developed in this region by [27]. Twenty-two new cores were collected in the same region in the year 2015 CE to update this tree-ring width chronology, with these samples also being subjected to stable isotope analysis. We extracted the samples with increment borers at the breast height, following the common dendrochronological standard [31,32].
Nine of the dated tree cores that exhibited the smallest number of narrow or locally absent rings were selected for stable isotope analysis. The whole annual ring (early-and late-wood) was cut into thin slivers using a scalpel under a binocular microscope before preparation of α-cellulose [33,34]. Subsequently, 0.30–0.35 mg of dry α-cellulose was weighed into silver capsules for pyrolysis into CO, and mass spectrometry was performed using a Flash HT elemental analyzer interfaced with a Delta V IRMS. Both carbon and oxygen isotope ratios were measured simultaneously [35,36]. The analytical precision of the tree-ring and cellulose standards was typically better than 0.1‰ and 0.3‰ for δ13CVPDB and δ18OVSMOW, respectively.
The δ13C “Suess” correction method [23] was used to adjust the tree-ring δ13C series for post-industrial changes in the δ13C value of atmospheric carbon dioxide. Each corrected tree-ring δ13C series was then adjusted for changes in the physiological response of trees to increases in CO2 concentration [37]. No corrections were made to the oxygen isotope series.
The 9 samples that underwent stable isotope analyses were 90–260 years old, and 7 of the trees had pith preserved. In order to avoid possible “juvenile” trends, we discarded the first 30 years of isotope data when conducting further analyses [38].

2.3. Climatic Data and Statistical Analyses

The expressed population signal (EPS) and mean inter-series correlation (Rbar) [39] were calculated to determine the strength of the common signal between tree-ring δ13C and the δ18O series. Monthly temperature, precipitation, and relative humidity data acquired by the Jingyuan meteorological station from 1951 to 2015 CE were calculated and correlated with both stable isotope series. Self-calibrating Palmer drought severity index (scPDSI) [40] data and global standard precipitation evaporation index (SPEI; with a 24-month timescale) data were obtained from the climatic research unit (CRU) from 1951 to 2015 CE. The obtained scPDSI and SPEI data completely cover the HSM area (Figure 1). The responses and correlation analysis between climatic data and each stable isotope series were performed using the DendroClim2002 software [41].
A linear regression model was employed to reconstruct climate from tree-ring δ13C data. To verify the reconstruction, we calculated the correlation coefficient (R), the variance determined by the regression model (R2), the reduction of error statistic (RE), the coefficient of efficiency (CE), and performed leave-one-out verification analysis. We also calculated the ±1 root mean square error (RMSE) in the reconstruction analysis.
The spatial relationship of correlations between reconstruction series and climatic data was explored using the KNMI Climate Explorer software (Royal Netherlands Meteorological Institute; https://climexp.knmi.nl/, accessed on 5 November 2021). We applied the multi-taper method (MTM) [42] of spectral analysis to investigate the periodicity of the reconstruction.

3. Results and Discussion

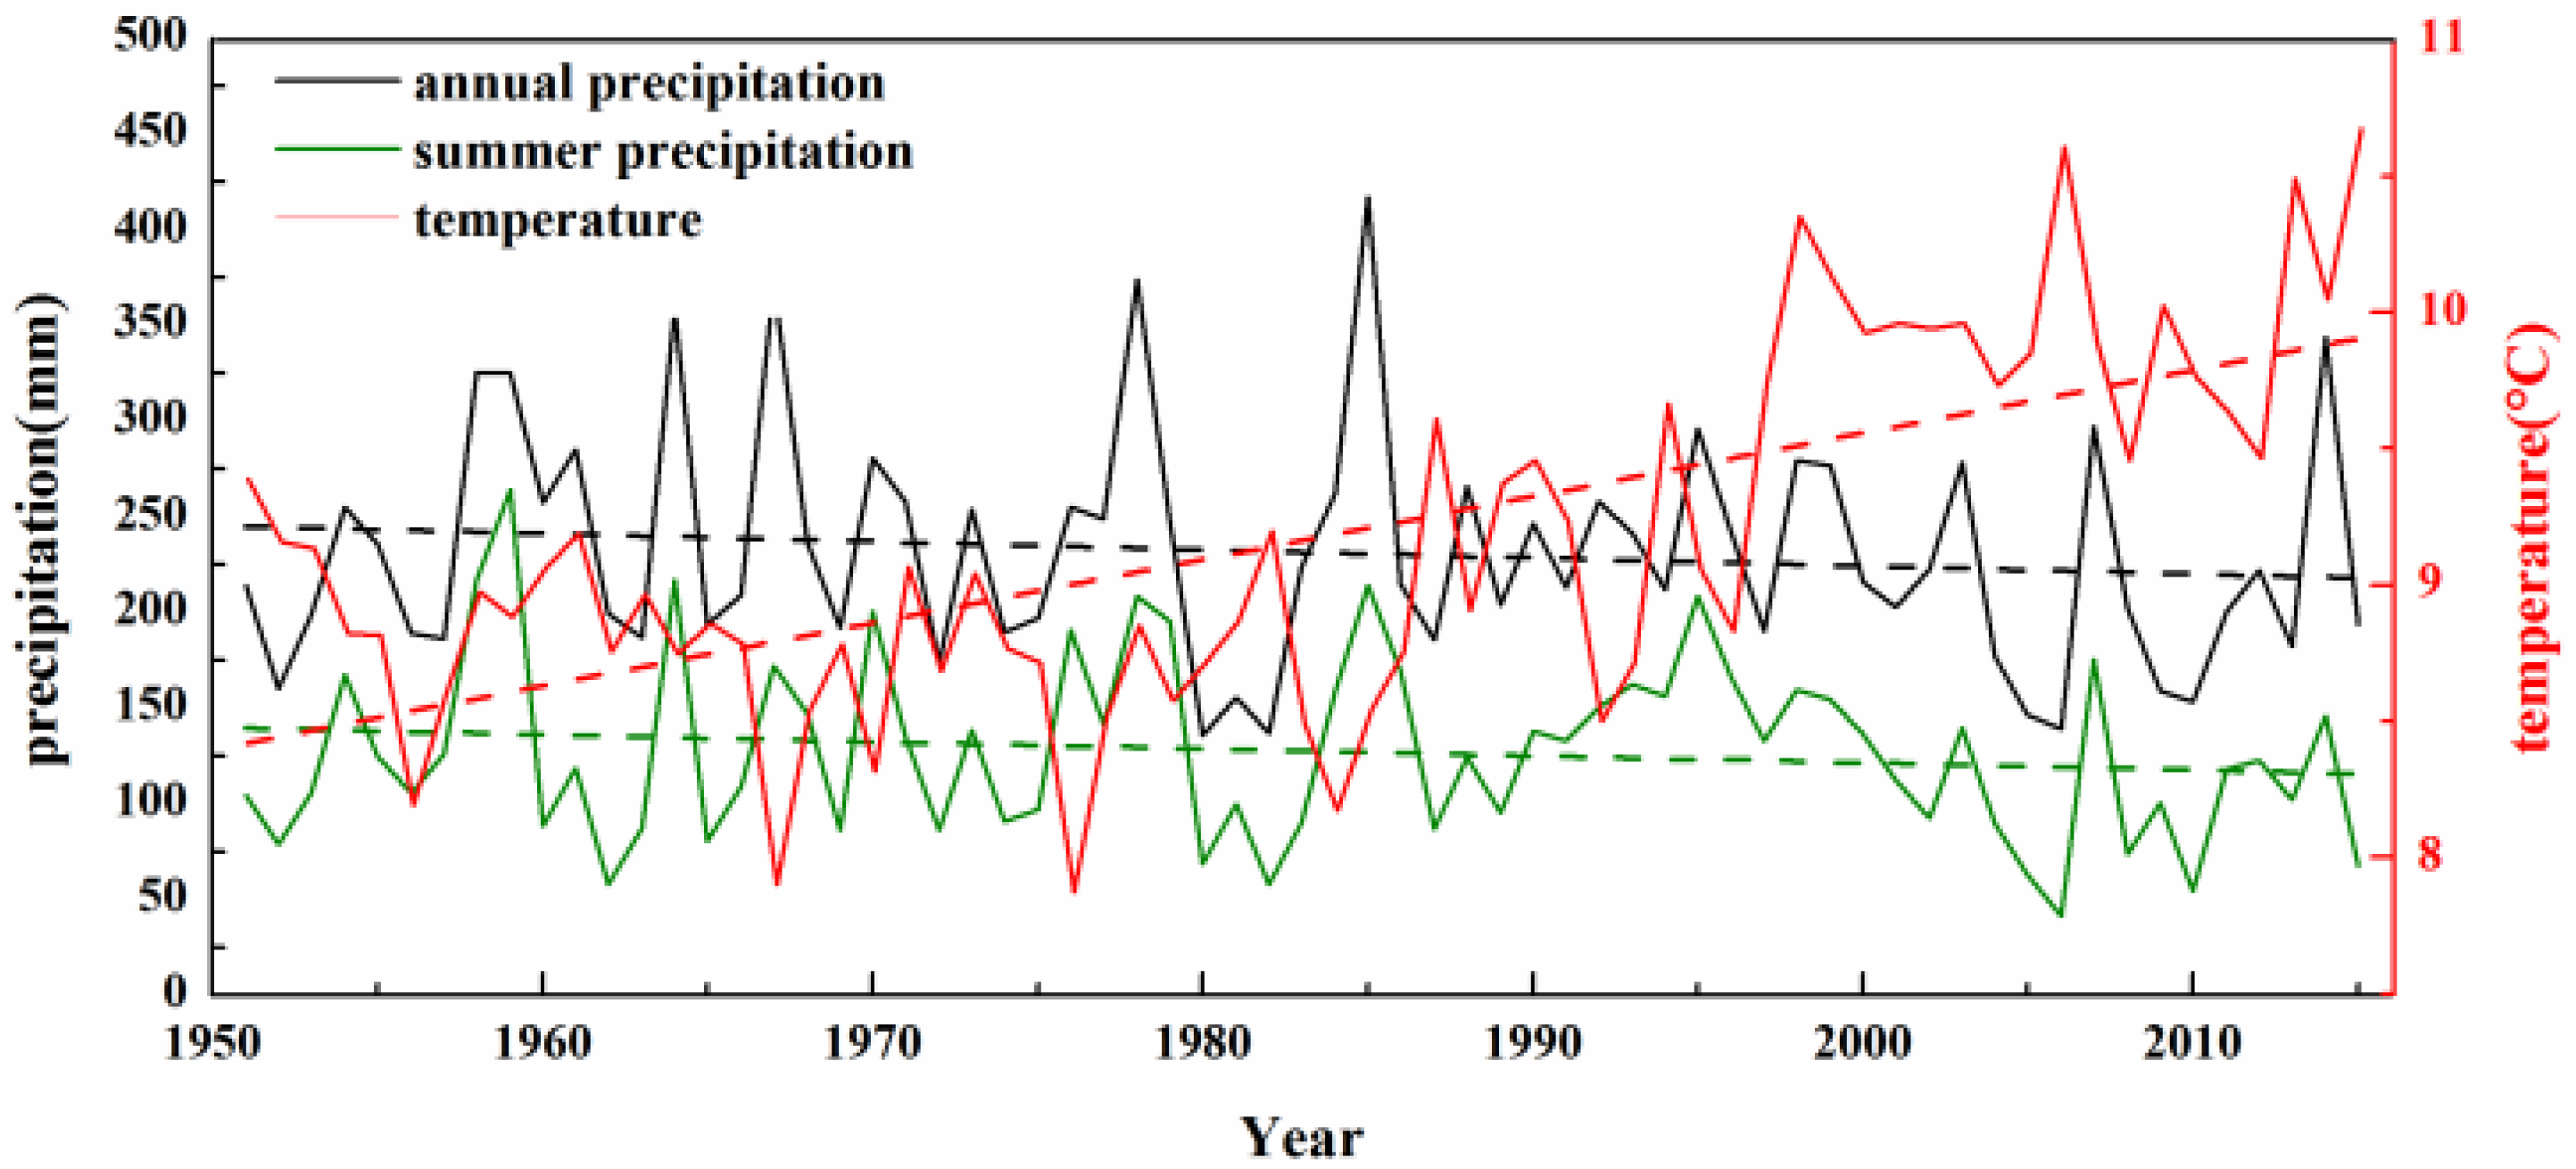
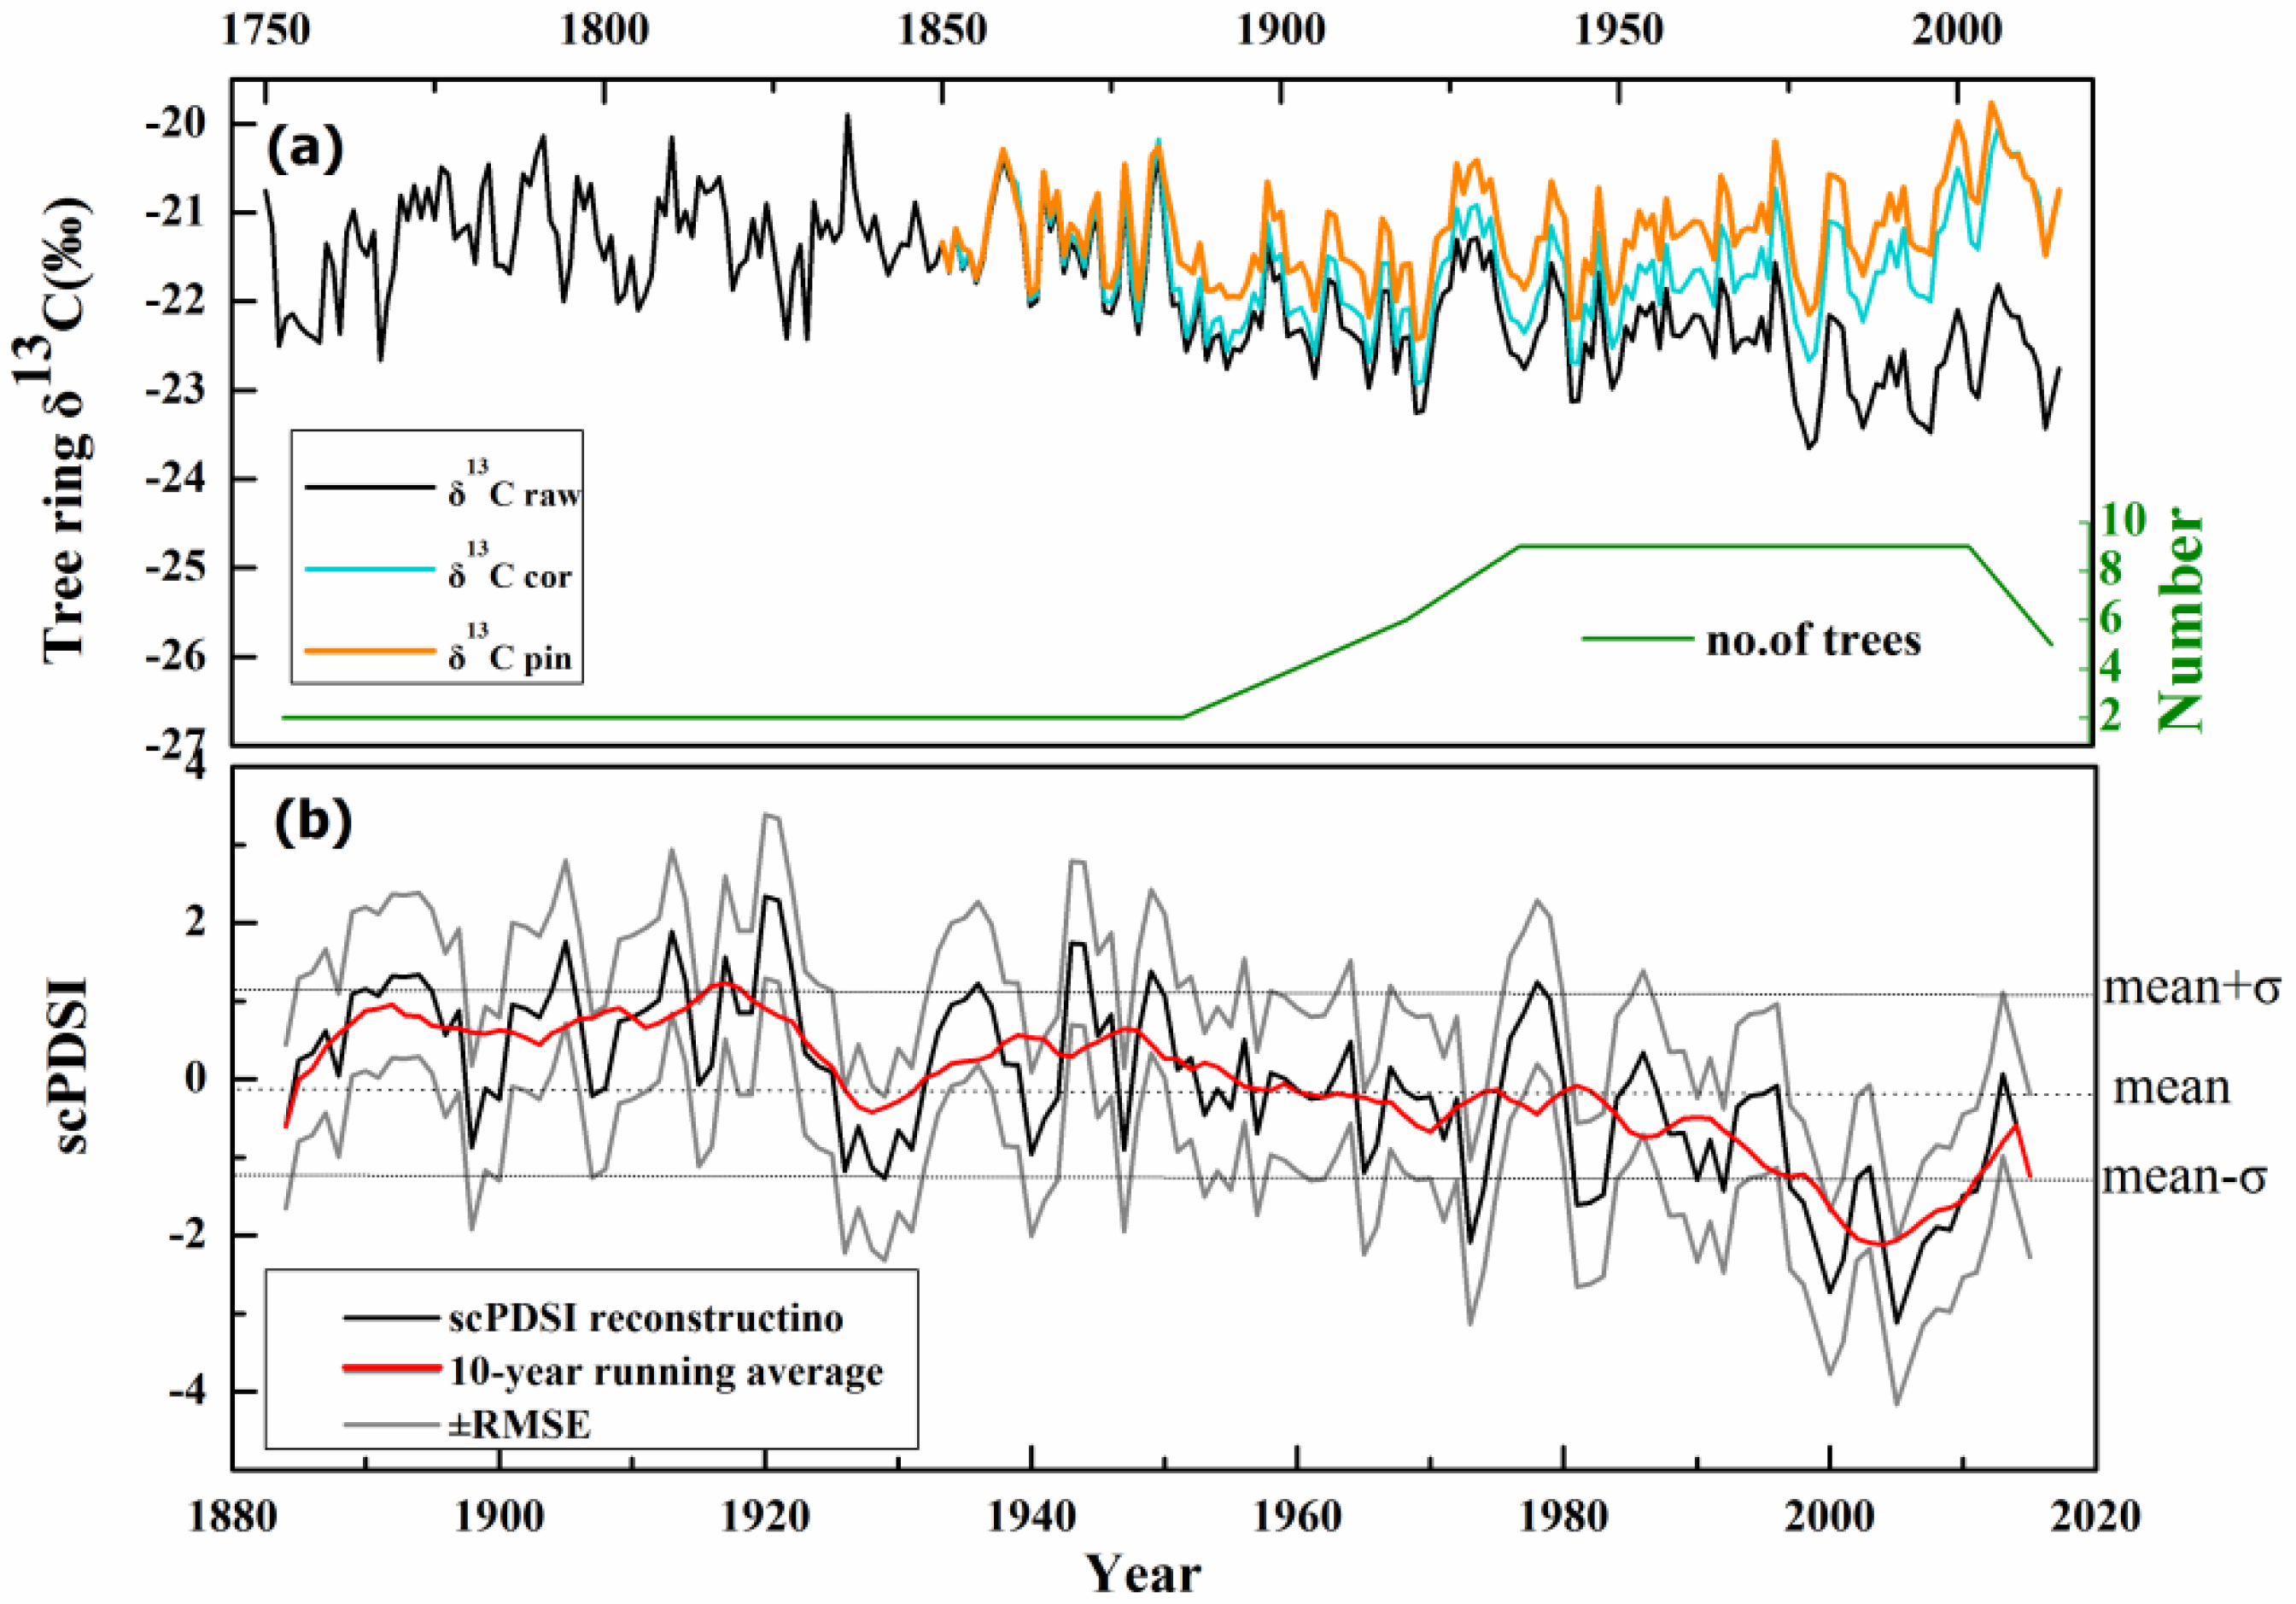
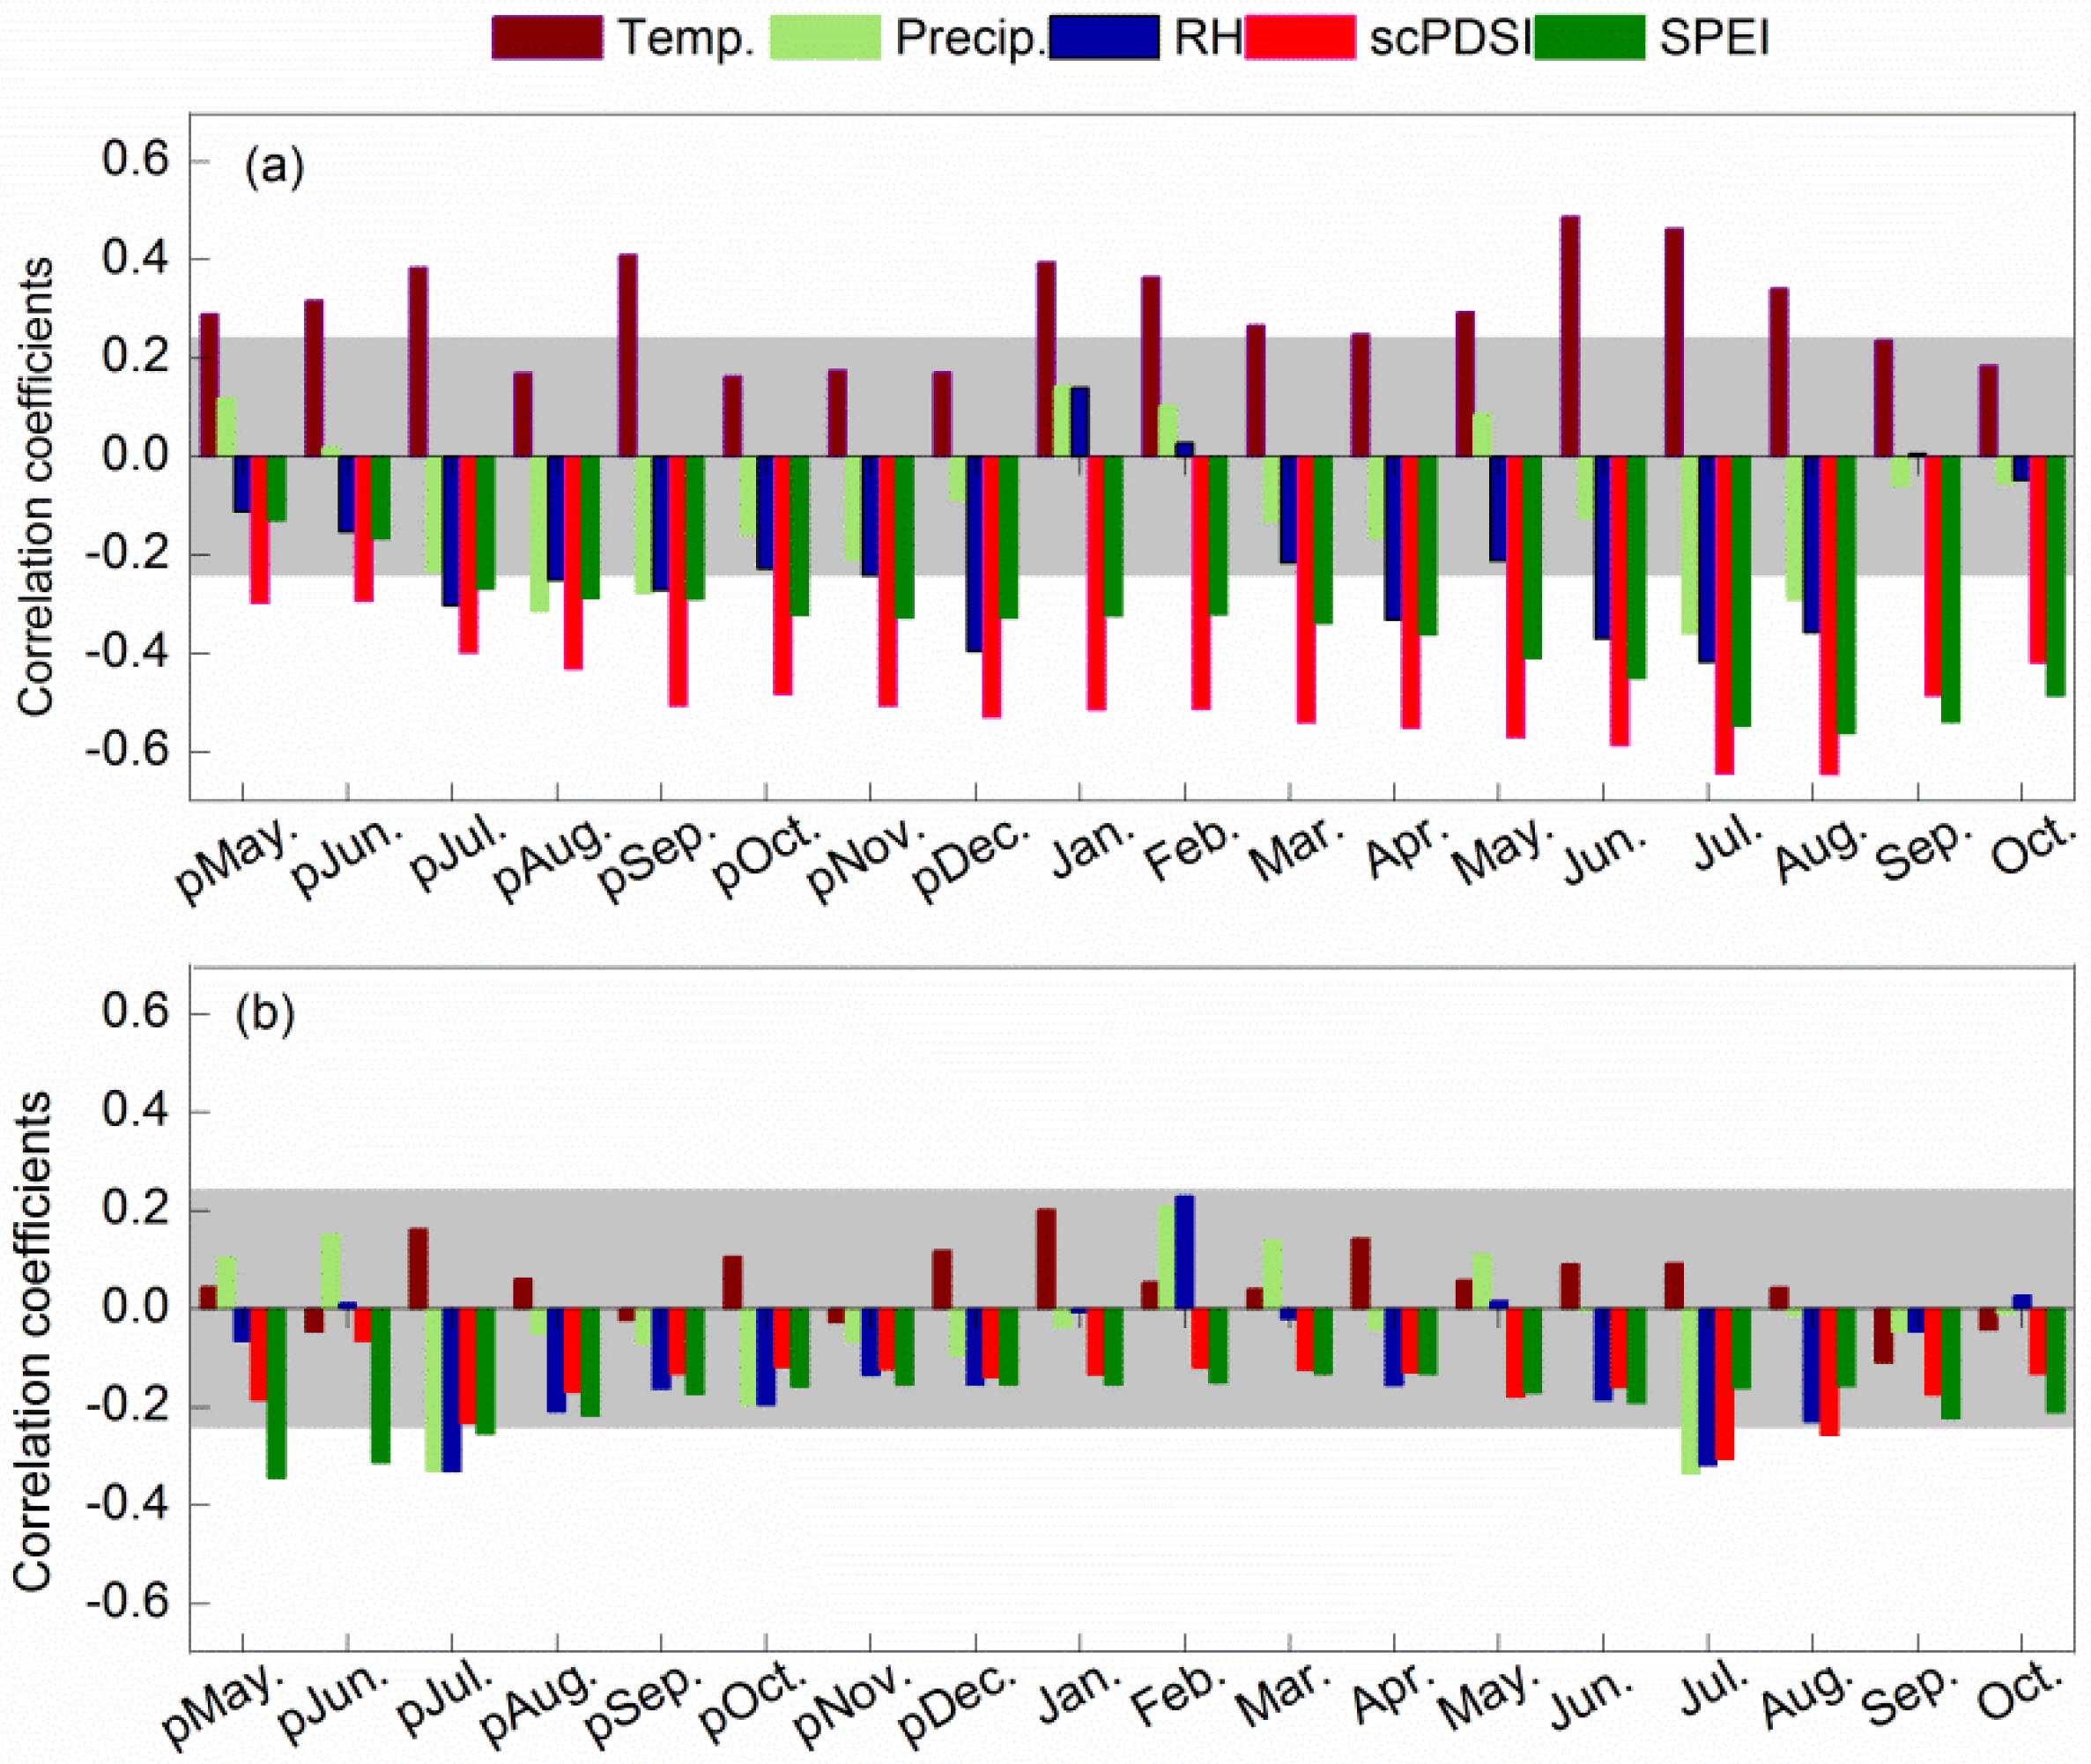
3.1. Climate and Tree-Ring δ13C and δ18O Chronology

Table 1 shows the average correlation among each δ13C and δ18O series. The correlation among each δ13C series was stronger than that of each δ18O series. Table 2 shows the statistical properties of the δ13C and δ18O series. Compared with the corresponding δ18O series, the EPS and Rbar for the δ13C series were also stronger (Table 2). The adjusted δ13C series and the sample depth of δ13C chronology are present in Figure 3a. Based on the threshold of EPS is exceeding 0.85 for the robustness of a chronology [39], we found that the most confident period of δ13C chronology was from 1884 to 2015 CE.
Correlation analyses were applied between our tree-ring isotope chronologies and monthly meteorological observation data collected from previous May to October in the following year for the period 1951–2015 CE. These observed meteorological data included average temperature, total precipitation, and average relative humidity data. Our results suggest significant positive correlations between tree-ring δ13C chronology and the mean temperature, but mostly negative correlations between tree-ring δ13C chronology and total precipitation and average relative humidity (Figure 4a). Compared to correlations between meteorological records and tree-ring δ13C chronology, weaker correlations occurred between tree-ring δ18O chronology and monthly mean temperature, total precipitation, and average relative humidity during the period with shared instrumental data (Figure 4a).
The observed correlations strengthen when evaluated over a three-month-long period of meteorological data are combined together. The strongest significant correlation at the 0.05 level was found between tree-ring δ13C chronology and mean June, July, and August (JJA) relative humidity (r = −0.59). A second significant positive correlation was found between tree-ring δ13C chronology and temperature during JJA (r = 0.55). Other significant correlations were found between tree-ring δ13C chronology and total precipitation for June and July (JJ) of each year (r = −0.48). By contrast, tree-ring δ18O chronology had a less significant correlation with JJA average relative humidity (r = −0.3). A significant negative correlation was found between tree-ring δ18O chronology and JJ total precipitation (r = −0.3). Furthermore, no significant correlation was noted between tree-ring δ18O chronology and JJA mean temperature.
The results of correlation analyses suggest that humidity exerts a strong control on tree growth in this semi-arid region. Further comparison of monthly mean scPDSI and SPEI data from May in the previous year to the following October during 1951–2015 with tree-ring δ13C chronology suggests a stronger correlation than with tree-ring δ18O chronology, except for May to June data for mean SPEI (Figure 4b).
The strongest correlation between tree-ring δ13C chronology and seasonal combinations of mean scPDSI data was obtained from June to August (r = −0.662). The correlation coefficients between the tree-ring δ13C chronology and the spring (March to May), autumn (September to November), and winter (December to February) seasons’ mean scPDSI values were −0.581, −0.450, and −0.519, respectively. The strongest correlation coefficients were observed for the combination of annual mean scPDSI from June in the previous year to May in the current year with tree-ring δ13C chronology (r = −0.656, p < 0.05).
We also calculated the correlation for first-difference data between annual mean scPDSI and tree-ring δ13C chronology (r = −0.48, p < 0.05) to explore climatic trends without the influence of long-term trend effects. We calculated the 31-year running correlations between our tree-ring δ13C chronology and the scPDSI (Figure 5). The results show the correlations between tree-ring δ13C chronology and scPDSI generally exceeded −0.30 and are significant at the 95% level over the instrumental periods (Figure 5). There were no climatic trends that influenced the long-term trend.

3.2. Reconstruction of scPDSI Using Tree-Ring δ13C

Based on correlation analysis performed between stable isotopes chronologies and the climatic data, tree-ring δ13C chronology was used to develop reconstructions of annual mean scPDSI from previous June to current May. A linear regression model explains 42.6% of scPDSI variance in the period 1951–2015. The reduction of error (RE) and coefficient of efficiency (CE) were both positive, and CE was smaller than RE (Table 3), which illustrates that the linear regression model is accurate [43]. This model was used to reconstruct the scPDSI history in this region for the period 1884 to 2015 CE (Figure 3b).
The mean value of our reconstructed scPDSI was −0.08, which is within the range of the defined near normal status (±0.5) [44]. To identify the presence of wet and dry conditions in our reconstruction, positive and negative values indicate wet and dry periods of the same category [44], respectively. The standard deviation (σ) value is 1.1 for the whole chronology time span. We compared the severely wet and dry periods with nearby regions of drought reconstructions based on tree-ring and to avoid overestimation of the frequency of wet and drought conditions, scPDSI values that were more than one standard deviation (σ) above or below the average value [28,45] were defined as slightly wet or dry years, respectively.
On an annual timescale, the years 1889–1895, 1904–1905, 1912–1914, 1917, 1920–1922, 1936, 1943–1944, 1949–1950, and 1978–1979 experienced slightly wet conditions (Figure 3b). The years 1926, 1928–1929, 1965, 1973–1974, 1981–1983, 1990, 1992, 1997–2002, 2004–2011, and 2015 experienced slightly dry conditions (Figure 3b). On the decadal timescale, drought periods were identified in the 1920s and after 1980 (Figure 3b). The reconstruction of 10-year running mean values showed that the climate from 1884 to 1920 CE was notably wet, although there was an extremely dry event in the 1920s. After that event, a period with substantial rainfall lasted for around 30 years (from 1930 to 1960 CE), and then for a 10-year period in the 1970s. During those decadal periods, moisture characteristics fluctuated slightly, and short drought events were noted; however, a period of clear and prolonged drought occurred from 1980 to the present day (Figure 3b).

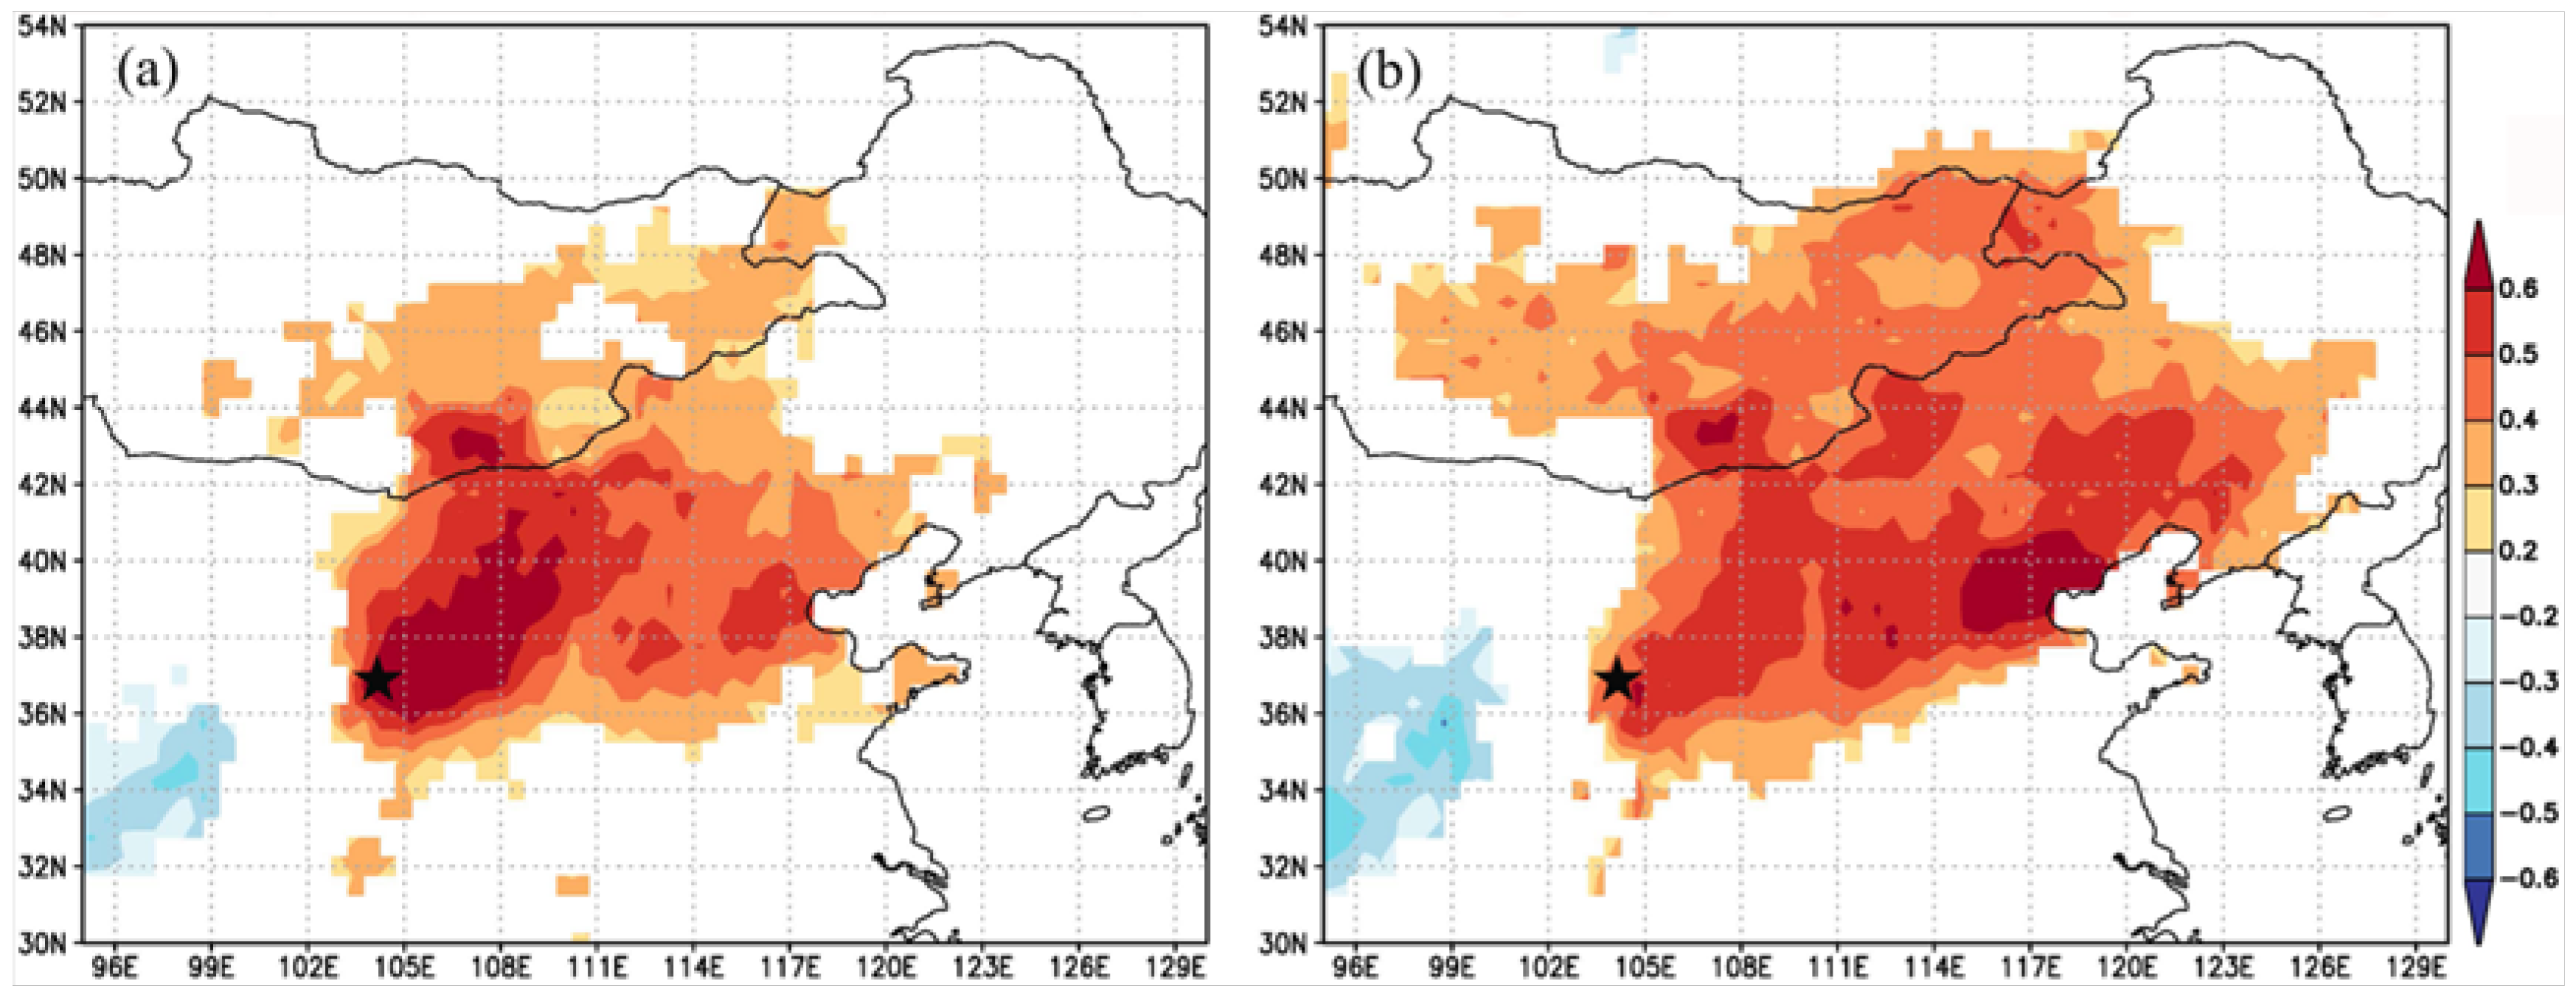
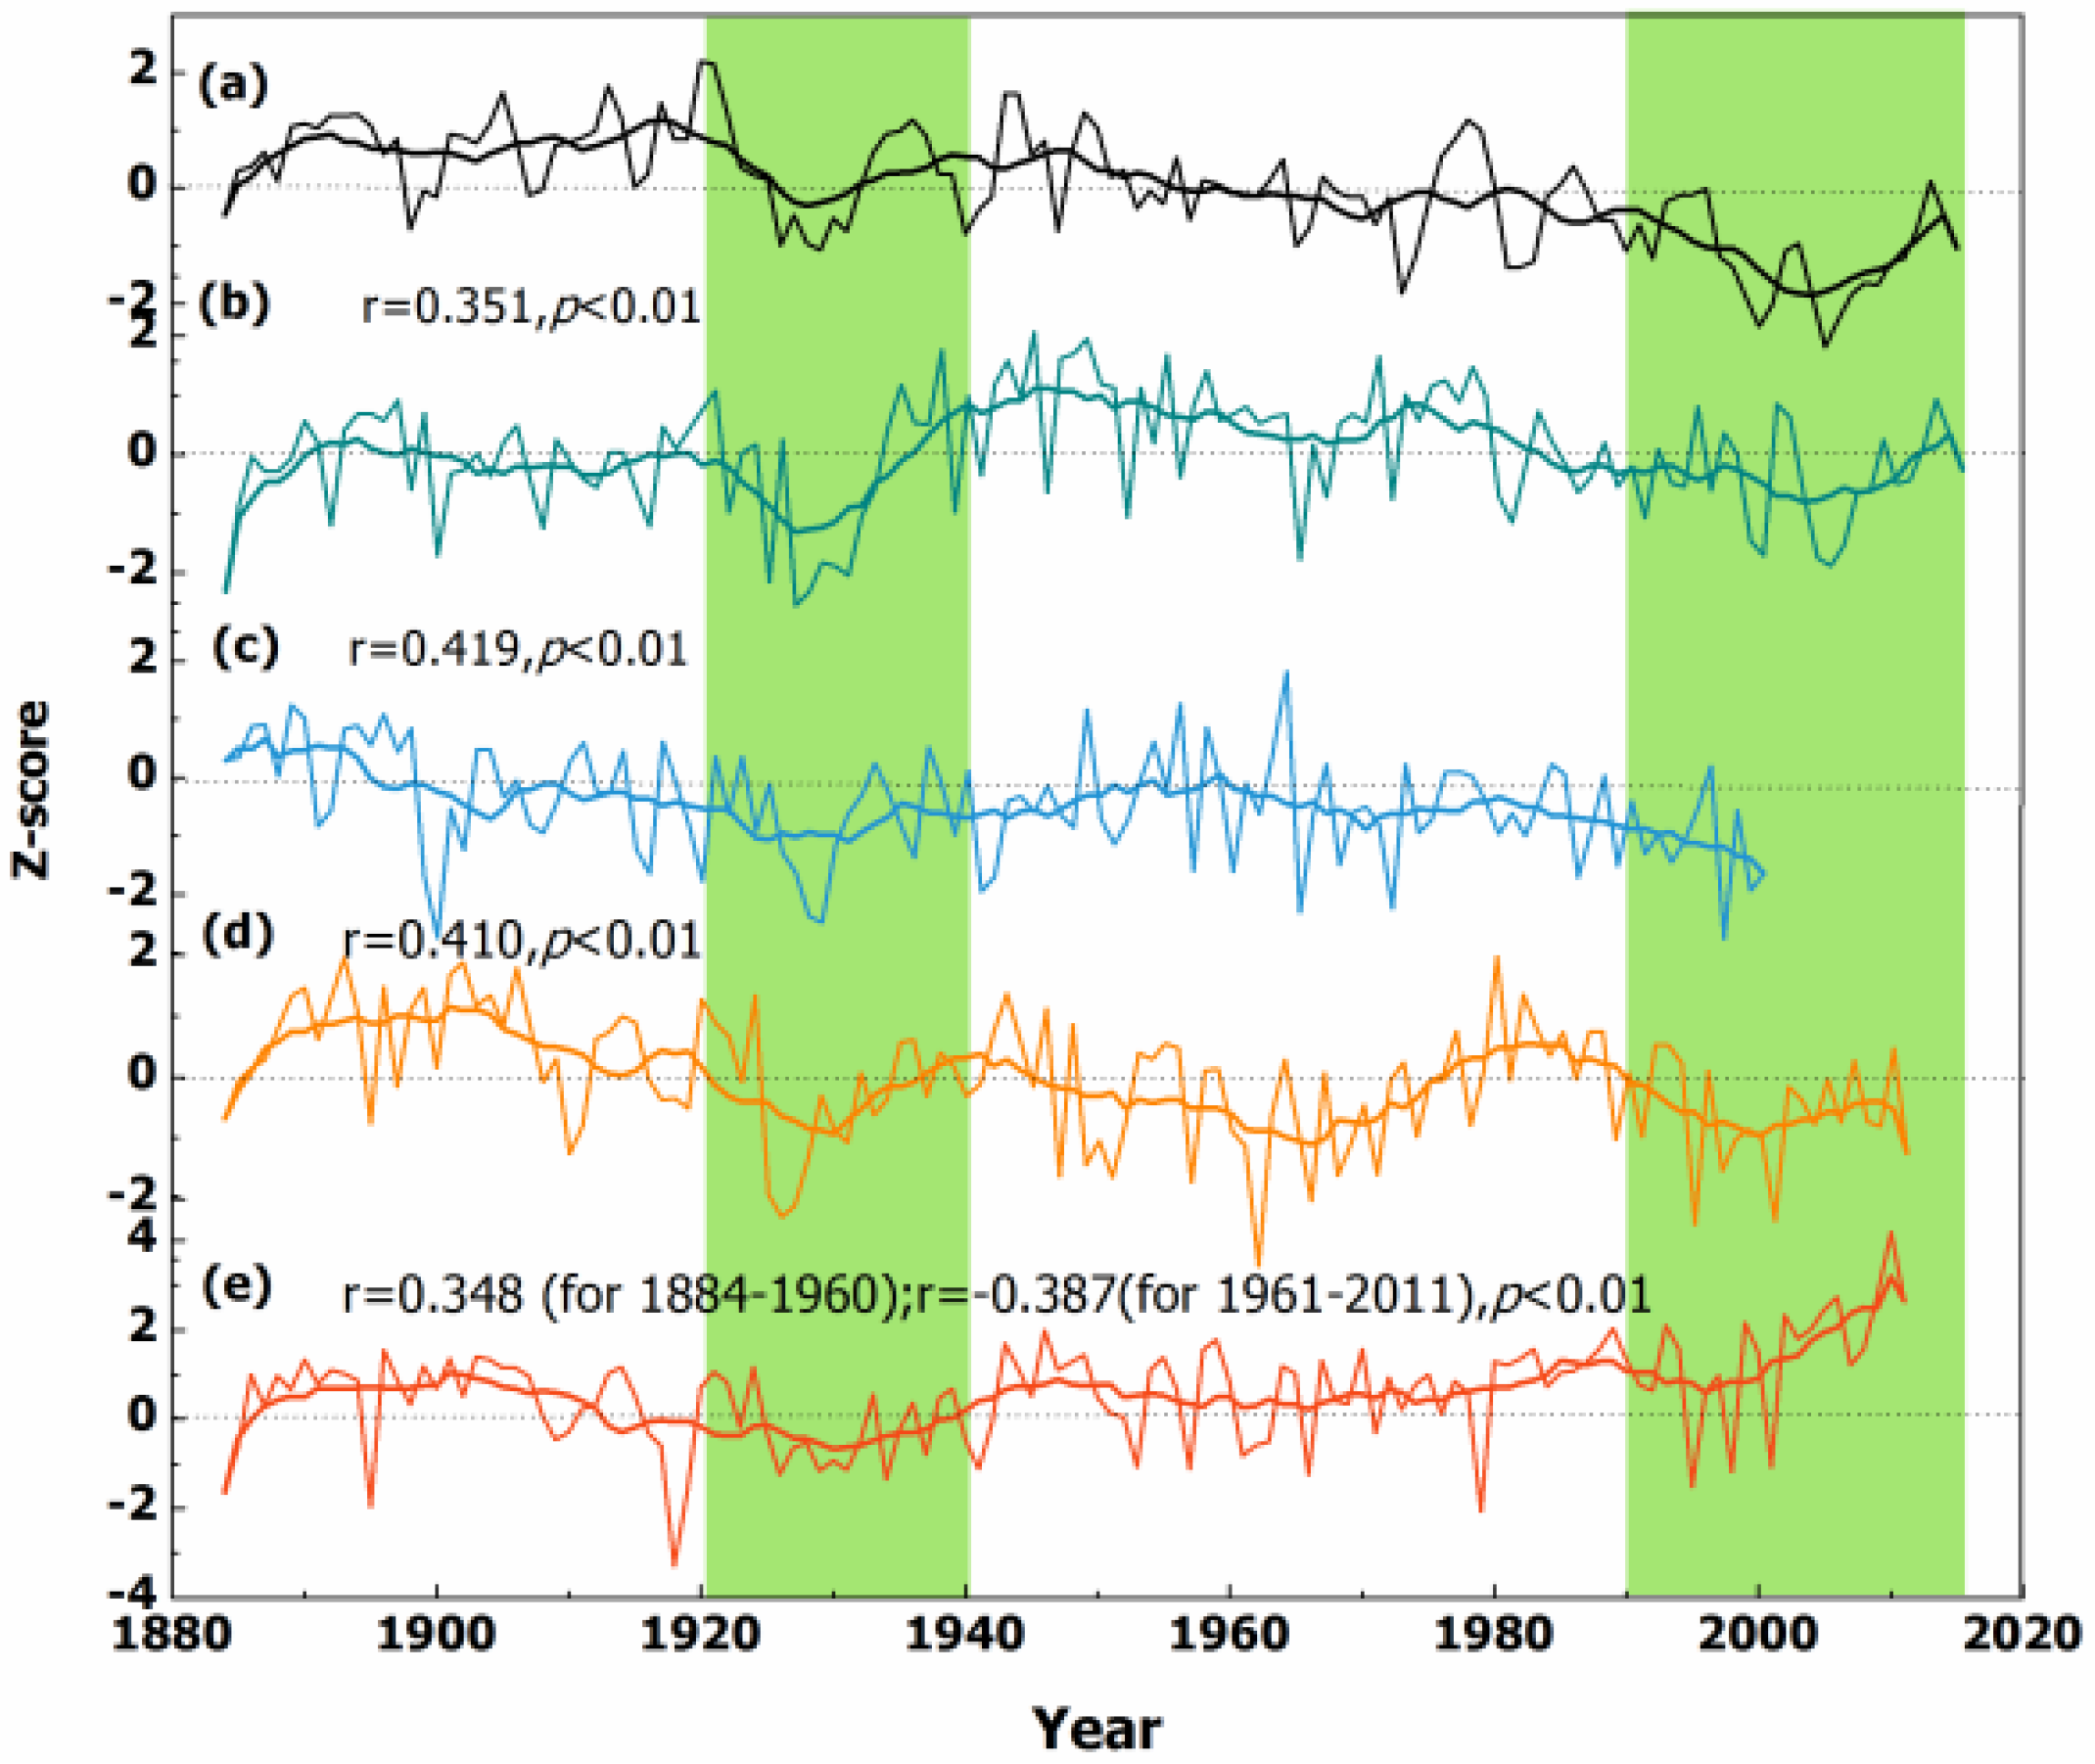
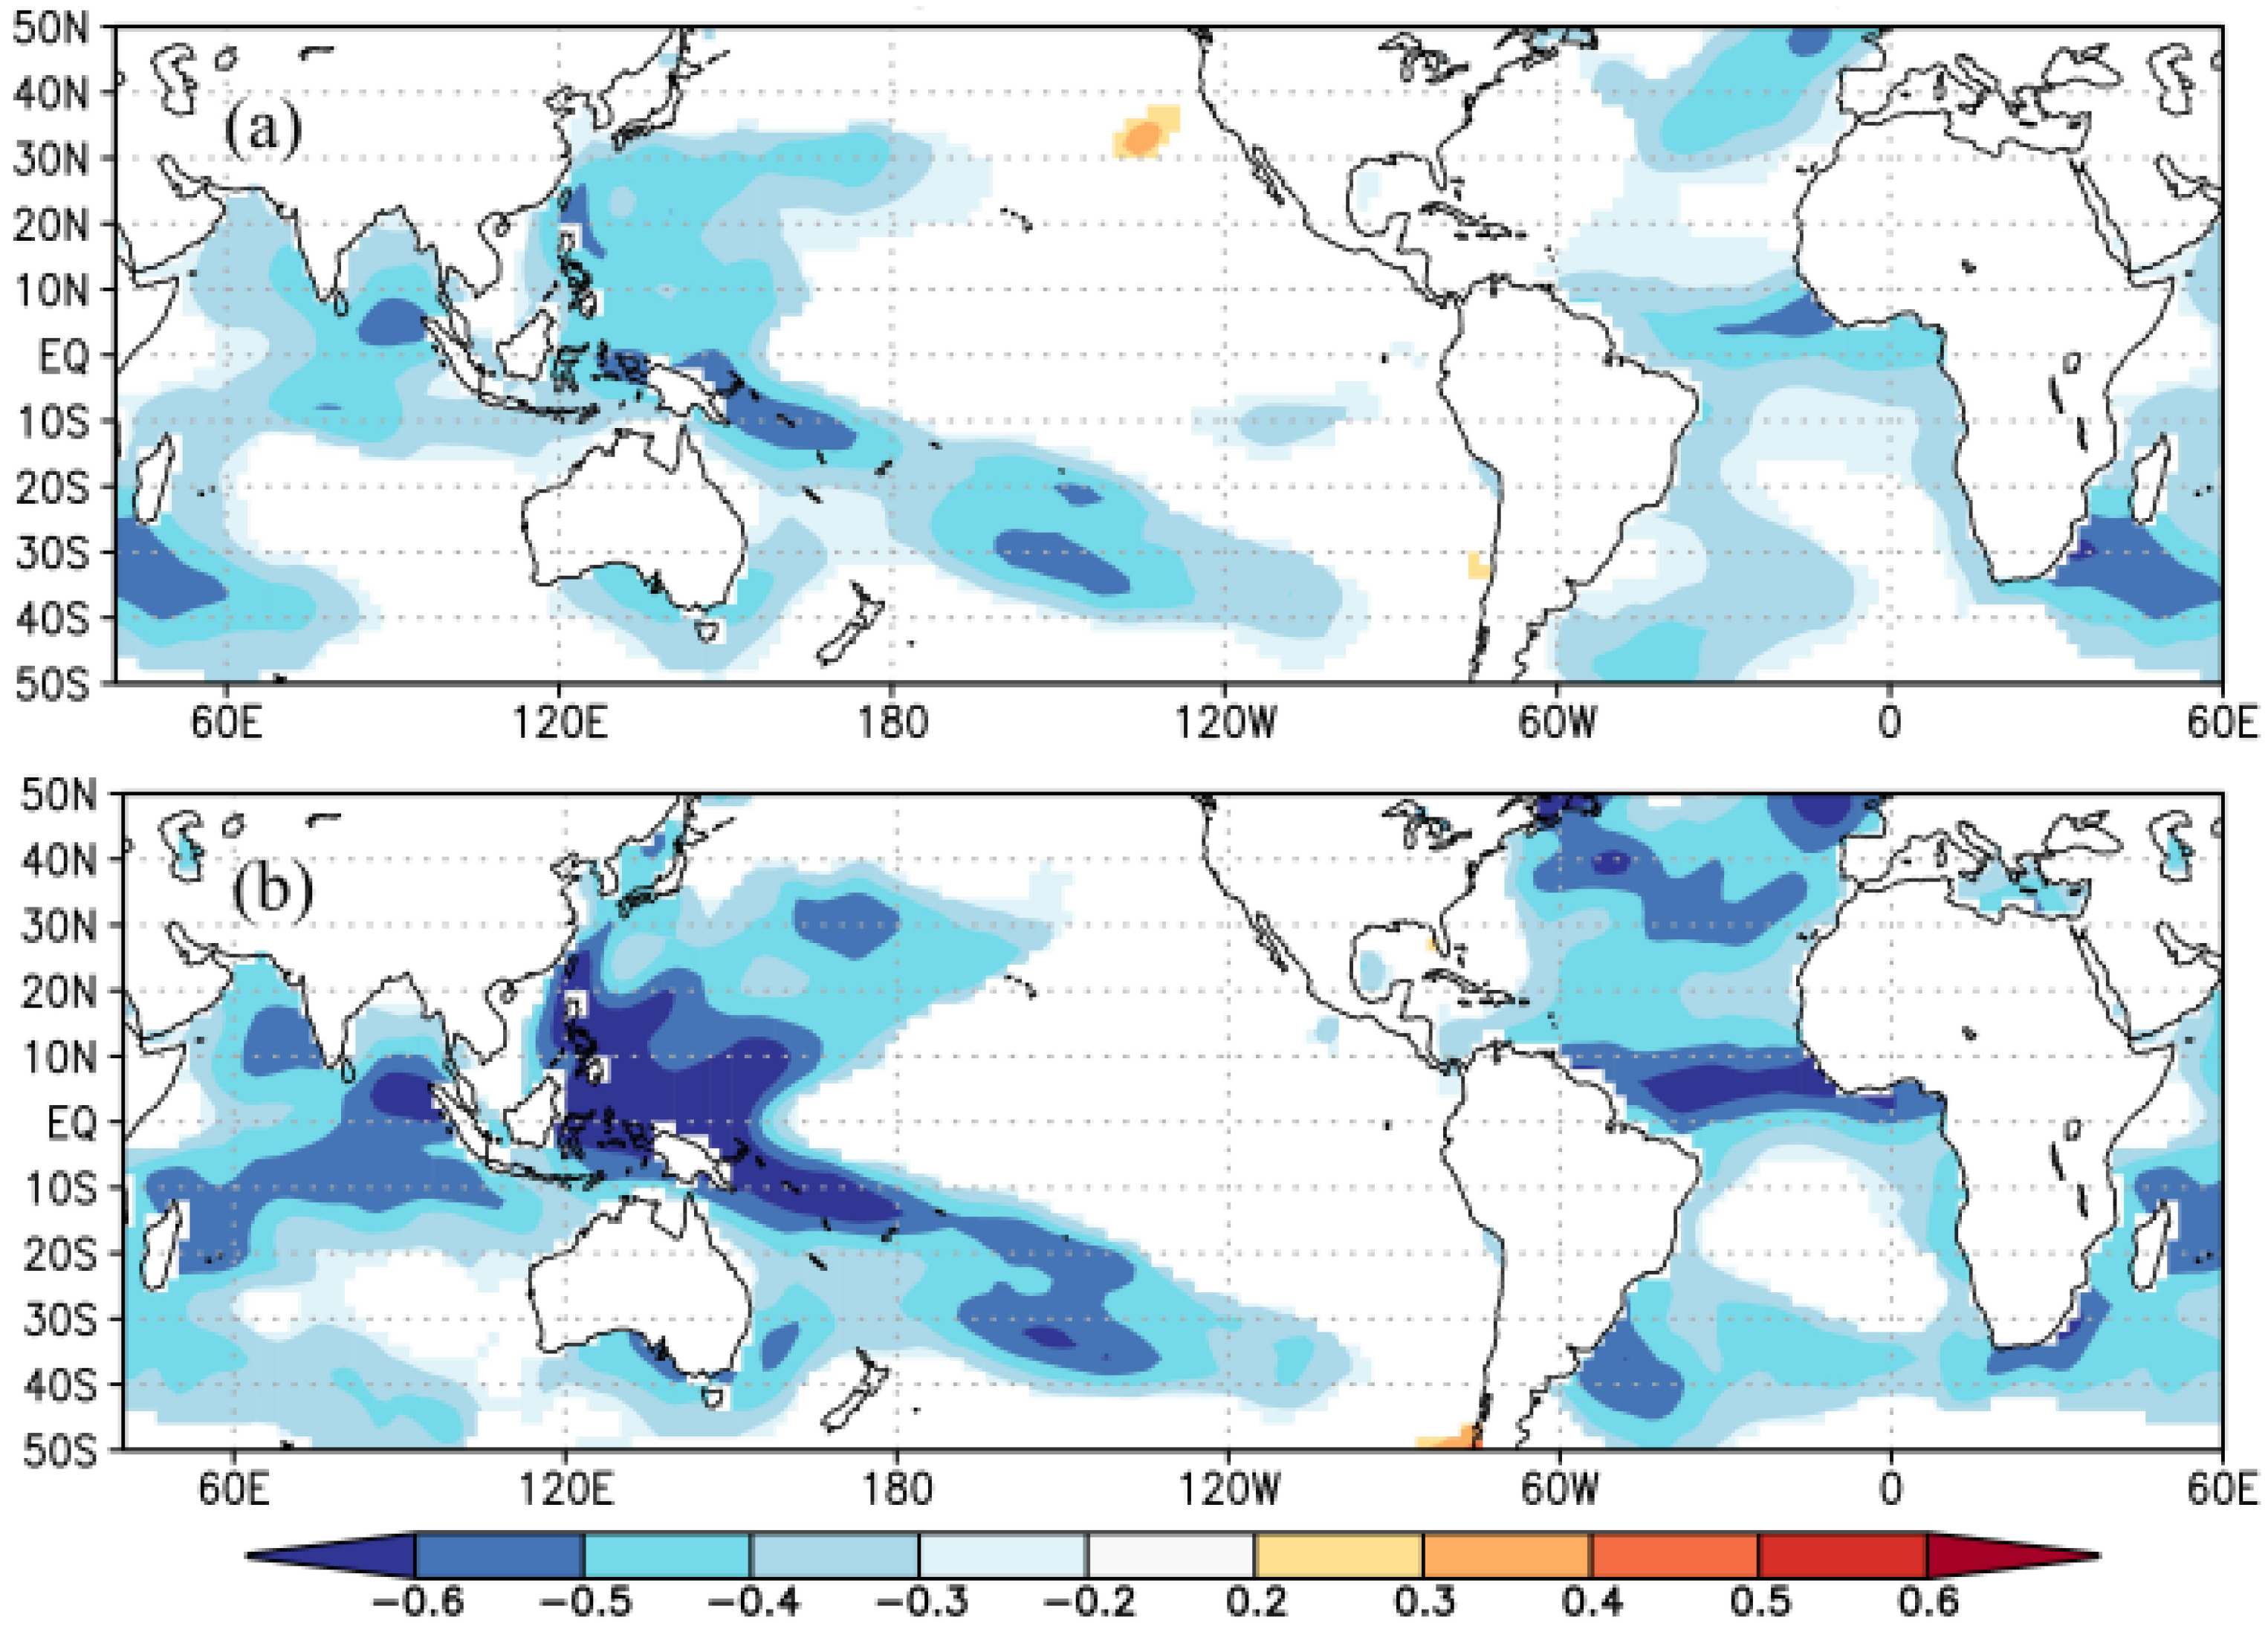
3.3. The Spatial Representation of Moisture Changes

The reconstructed scPDSI covers a wide spatial area during the period 1951 to 2015 (Figure 6). The strongest spatial correlation indices between our reconstruction and CRU scPDSI values are over 0.6 (p < 0.05) and are located across the north-eastern fringe of the ASM in China. This strong correlation indicates that tree-ring δ13C can reliably record moisture variability in the northern fringe of the ASM region.
We compared our scPDSI reconstruction against the PDSI reconstruction generated by tree-ring width data in the HSM [27], an annual precipitation reconstruction [29] for Hetao based on historical documents, and early summer moisture reconstructions [8] in the Hexi Corridor (Figure 7a–d). The comparisons indicate that reconstructions share similar trends over the last 130 years and consistently capture drought signals in the 1920s and after the year 1990 to present at both annual and inter-annual timescales (Figure 7a–d). By contrast, precipitation reconstructions based on tree-ring widths in the north-eastern Tibetan Plateau (i.e., northwest of the HSM; Figure 1) clearly show climatic conditions from 1940 to the present day that are dominated by rainfall [30] (Figure 7e).
Discrepancies in moisture variation trends for HSM and the north-eastern Tibetan Plateau for the 56-year period from 1960 to 2015 CE may have been caused by increases in temperature. Analyses performed by [8,30] indicate that increased rainfall during the 20th century is consistent with higher temperatures in the north-eastern Tibetan Plateau; however, changes in moisture levels in the Hexi Corridor, where the drying trend is similar to that for the HSM, are predominantly limited by both temperature and precipitation [8]. The Hexi Corridor has become more arid, with global warming during the 20th century has caused increased evapotranspiration [8]. This difference suggests that temperature was highly influential on hydroclimatic conditions in the 20th century.

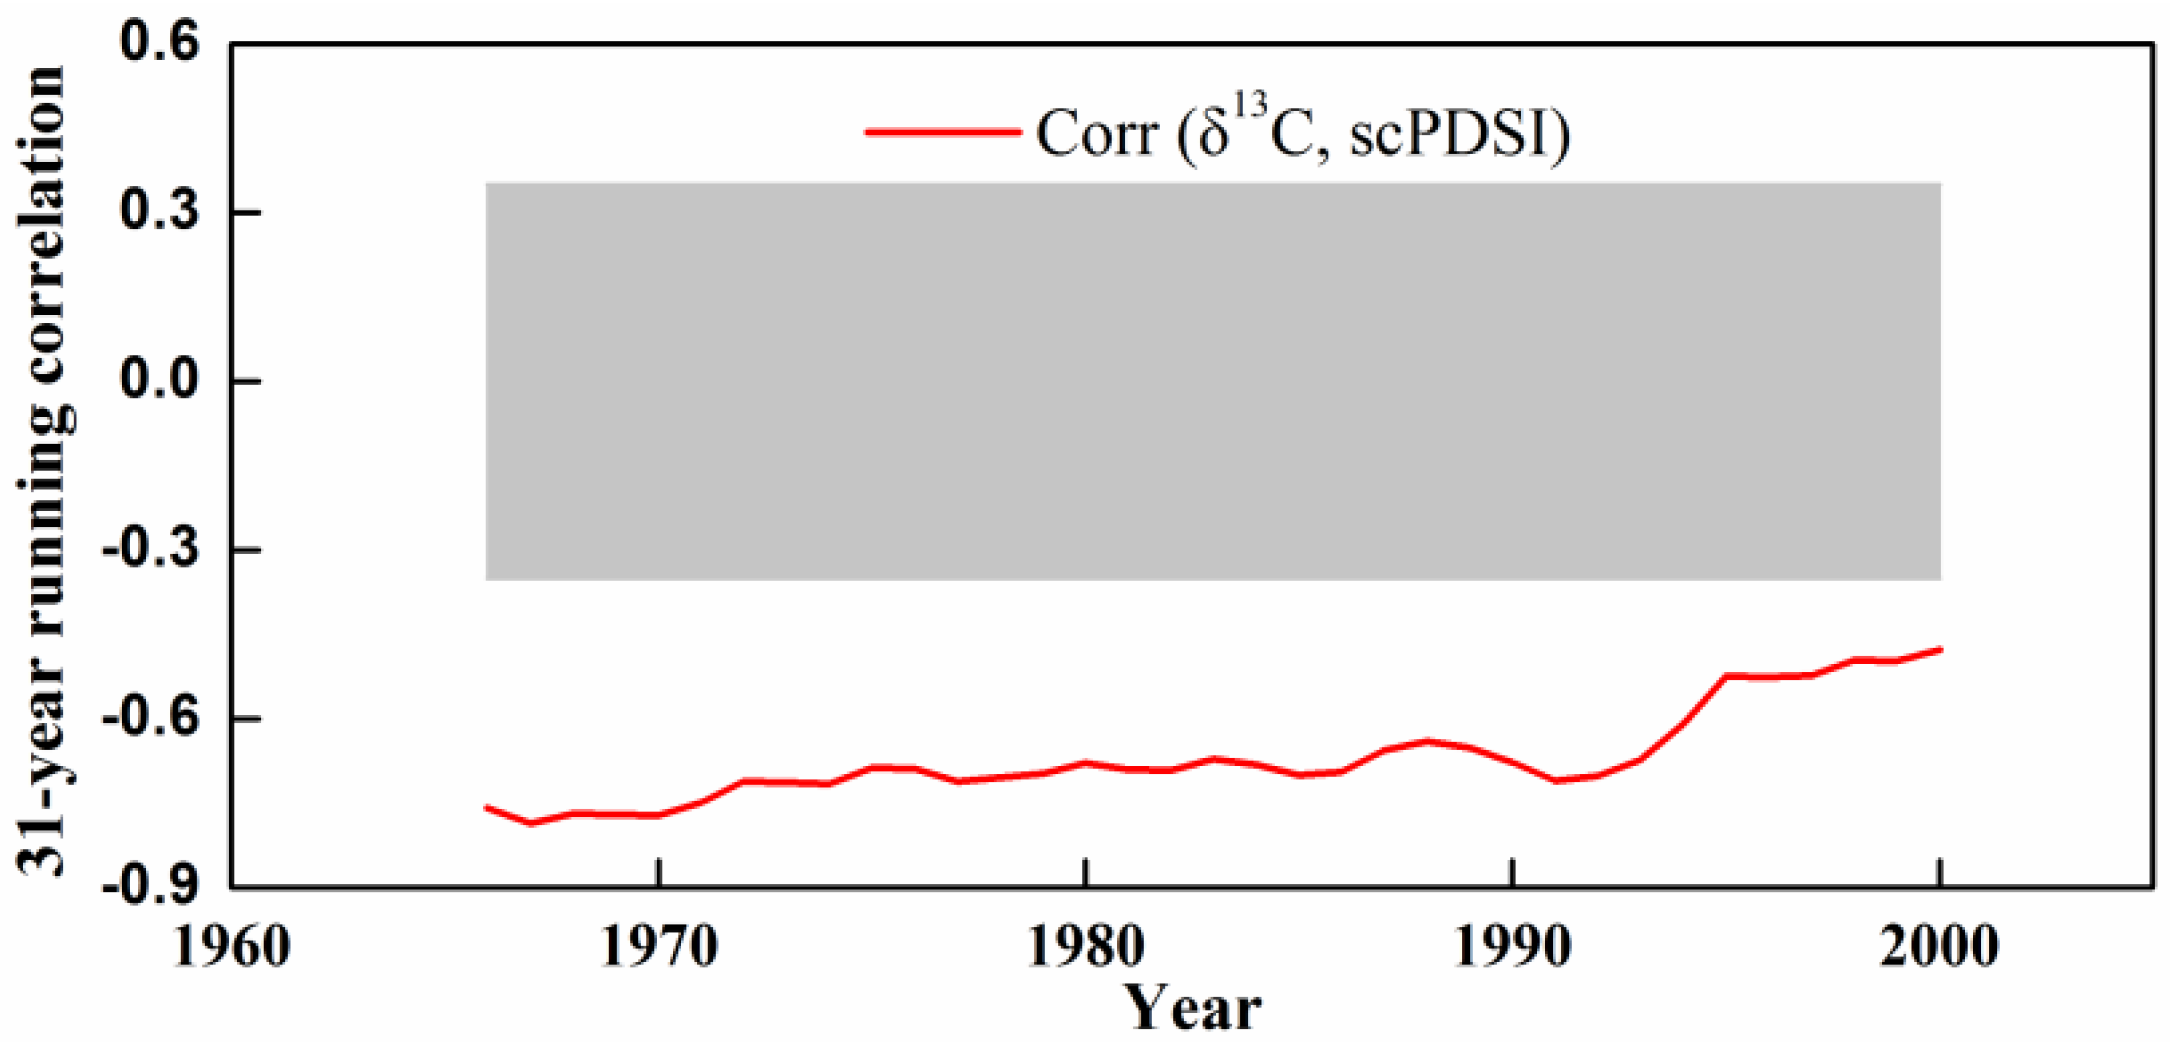
3.4. Forcing Factors of Hydroclimate Variability

The Hexi Corridor is located in the northwest corner of the ASM region, while the HSM and Hetao areas are located in the north-eastern fringes of the ASM region. Despite being situated far apart, the proxy records in each reveal that there were periods of drought and periods of wetness common to each, which may have been caused by similar broad-scale driving forces.
A MTM-method spectrum analysis was applied to extract the periodicities of our scPDSI reconstruction over the period 1884–2015 CE. The results show a 2- to 4-year inter-annual cycle and 11- year, 22- to 24-year decadal cycles at the 90% confidence level. The inter-annual spectral properties are possibly related to variation in the El Niño-Southern Oscillation (ENSO) intensity [46,47], and inter-decadal spectral properties may be associated with high-frequency solar activity [48], Pacific Decadal Oscillation (PDO) cycles [49], and North Atlantic Oscillation (NAO) periodicity [50,51].
Figure 8 shows a significant negative (p < 0.01) spatial correlation between our scPDSI reconstruction and sea surface temperature (SST) in the Indian Ocean, South China Sea, Pacific Ocean, and Atlantic Ocean during 1951–2015. These correlations indicated that moisture conditions in our study region were directly associated with large-scale ocean-land circulation systems. We found significant correlation coefficients between the South Asian Summer Monsoon index [52], East Asian Summer Monsoon index (EASM) [53], PDO index [54], and instrumental summer NAO (https://climexp.knmi.nl/; accessed on 5 November 2021) with our reconstruction of 0.23 (p < 0.05, n = 117 for 1884–2000 CE), 0.22 (p < 0.05, n = 117 for 1884–2000 CE), −0.21 (p < 0.05, n = 132 for 1884–2015 CE), and 0.25 (p < 0.01, n = 129 for 1884–2012 CE), respectively.Further work is required to explore the nature and stability of these teleconnections.
Previous studies based on stalagmite data [55] have suggested that water vapor and precipitation in China are mainly sourced from southwest air currents that originate from the Indian Ocean. Atmospheric activity over the Pacific Ocean in subtropical highs can affect the transmission of water vapor in the southwest airflow, which in turn affects the amount of water vapor transported by the southeast monsoon from the Pacific Ocean to mainland China. The western Pacific subtropical high therefore plays an important role in modulating the water vapor distribution in the East Asian monsoon region [55]. When the Indian Ocean and the Middle East Pacific SST were low, the West Pacific subtropical high region receded to the north and weakened. As the monsoon in China is mainly controlled by the intertropical convergence zone (ITCZ), more water vapor provided from the Southern Indian Ocean [55] leads to increased precipitation in the monsoonal region of North China (i.e., the HSM). When the Middle East Pacific SST is high, the PDO is in a warm phase, meaning that a weaker EASM occurs over northern China and less water vapor transportation northwards, which reduces the amount of rainfall that falls in North China [56]. The dry periods in the HSM in the 1920s are consistent with PDO warm phases in the 1920s–1940s and very strong El Niño events in 1925 and 1926 [57].
The NAO is another well-known global atmospheric pressure field that records the intensity of westerly circulation [58]. Recent studies have shown that the summer NAO may affect the EASM [59]. It is worth noting that the EASM has been weakening since 1960 [53], concurrent with the phase reversal of the summer NAO in the 1960s [60]. In addition, a transition from a cool PDO phase to a warm PDO phase occurred in the mid-1970s [56], which has been associated with a period of drought that initiated in 1960 CE (Figure 3b). No notably wet conditions were predicted after 1980 CE (Figure 3b) in our reconstruction.
Based on the above discussion, the moisture conditions in our study region are clearly influenced by several different circulation modes. Moreover, the HSM is located at the margins of monsoonal regions, such that moisture fluxes may come from westerly and northerly winds, monsoons, and more local circulation patterns. Such complex water vapor sources may lead to tree-ring δ18O values recording hydroclimate signals that are more difficult to characterize using station data than tree-ring δ13C values. The fractionation of tree-ring δ13C is mainly controlled by stomatal conductance and the rate of photosynthesis [23,24]; however, the influence of large-scale atmospheric circulation on tree-ring δ13C can be neglected in the semi-arid HSM region. Therefore, tree-ring δ13C is an effective proxy in monsoon-margin regions to decipher the local hydroclimatic signal. Whereas precipitation in the north-eastern Tibetan Plateau [30] primarily comes from the recycling of continental moisture through convective processes during the summer, tree-ring δ18O data in this arid region can still preserve strong climate signals [3]. Further analyses are nevertheless needed to further verify these findings and better characterize the climate sensitivity of tree-ring δ13C and δ18O values from different climates and geographic regions.

4. Conclusions

Tree-ring δ13C and δ18O data from nine Chinese pines (Pinus tabulaeformis Carr.) growing on the northern fringe of the ASM region were measured to test their effectiveness as potential climate proxies. Tree-ring δ13C was found to be strongly and negatively correlated with scPDSI and was used to develop a scPDSI reconstruction from 1884 to 2015 CE that explained 42.6% of the variability in scPDSI during the instrumental period. Tree-ring δ18O data showed significant correlations with precipitation amount and relative humidity. The scPDSI reconstruction showed that there were 26 years of drought and 23 years of heavy rainfall when data were analyzed at an annual timescale, and periods of prolonged drought were identified in the 1920s and since 1980 to the present day when the data were analyzed at a decadal timescale. Analysis of trends in scPDSI reconstructions based upon tree-ring δ13C data and other hydroclimate reconstructions of nearby regions showed similar dry-wet fluctuations, especially during periods of extreme drought. Indeed, MTM analysis identified inter-annual cycles with 2- to 4-year periods and 11-year, 22- to 24-year decadal cycles in our reconstruction, which may indicate linkages with ENSO, solar activity, PDO, and NAO, which have been shown in other studies to directly impact hydroclimatic variability in our study region and modulate climate variations in north-central China. The complexity of water sources in HSM is a possible reason why tree-ring δ18O records exhibit weaker climate signals against station data than tree-ring δ13C. Whilst further work is required to develop the interpretation of these isotope proxies, our study has demonstrated that tree-ring δ13C data in this region record a stable hydroclimate signal that is suitable for development as a palaeoclimate record and potential source of information with which to inform water-resource management.

Author Contributions

Conceptualization, S.K. and J.W.; methodology, N.J.L., S.K. and J.W.; software, S.K. and J.W.; validation, N.J.L., J.W., J.L. and C.Q.; formal analysis, C.Q.; investigation, N.J.L. and M.S.; resources, N.J.L., J.W. and C.Q.; data curation, S.K.; writing-original draft preparation, S.K.; writing-review and editing, N.J.L., J.W., J.L. and M.S.; supervision, J.W.; project administration, S.K. and N.J.L.; funding acquisition, J.W. All authors have read and agreed to the published version of the manuscript.

Funding

This research was funded by the National Natural Science Foundation of China, grant numbers 42130511, 41405085, and 41602192. J.W. acknowledges the support by the Youth Innovation Promotion Association Foundation of the Chinese Academy of Sciences (no. 2018471).

Data Availability Statement

The data presented in this study are available on request from the corresponding author. The data are not publicly available due to privacy restrictions.

Acknowledgments

The authors gratefully acknowledge the valuable assistance provided by Bao Yang for his generous offer to review this manuscript.

Conflicts of Interest

The authors declare that there are no conflict of interest.

References

  1. Wang, B. The Asian Monsoon; Praxis Publishing Ltd.: Chichester, UK, 2006; pp. 173–194. [Google Scholar]
  2. Yang, B.; Kang, S.; Ljungqvist, F.C.; He, M.; Yan, Z.; Qin, C. Drought variability at the northern fringe of the Asian summer monsoon region over the past millennia. Clim. Dyn. 2014, 43, 845–859. [Google Scholar] [CrossRef]
  3. Yang, B.; Qin, C.; Achim, B.; Osborn, T.J.; Trouete, V.; Ljungqvist, F.C.; Esper, J.; Schneider, L.; Grießinger, J.; Büntgen, U.; et al. Long-term decrease in Asian monsoon rainfall and abrupt climate change events over the past 6700 years. Proc. Natl. Acad. Sci. USA 2021, 118, e2102007118. [Google Scholar] [CrossRef]
  4. Dai, A. Increasing drought under global warming in observations and models. Nat. Clim. Change 2013, 3, 52–58. [Google Scholar] [CrossRef]
  5. Wang, J.; Yang, B.; Zheng, J.; Zhang, X.; Wang, Z.; Fang, M.; Shi, F.; Liu, J. Evaluation of multidecadal and longer-term temperature changes since 850 CE based on Northern Hemisphere proxy-based reconstructions and model simulations. Sci. China Earth Sci. 2020, 63, 1126–1143. [Google Scholar] [CrossRef]
  6. Song, M.; Yang, B.; Ljungqvist, F.C.; Shi, F.; Qin, C.; Wang, J. Tree-ring-based winter temperature reconstruction for East Asia over the past 700 years. Sci. China Earth Sci. 2021, 64, 872–889. [Google Scholar] [CrossRef]
  7. Gou, X.H.; Gao, L.L.; Deng, Y.; Chen, F.H.; Yang, M.X.; Still, C. An 850-year tree-ring-based reconstruction of drought history in the western Qilian Mountains of northwestern China. Int. J. Climatol. 2015, 35, 3308–3319. [Google Scholar] [CrossRef]
  8. Yang, B.; Wang, J.L.; Liu, J.J.; He, M.H.; Melvin, T.M.; Osborn, T.J.; Briffa, K.R. A 1556 year-long early summer moisture reconstruction for the Hexi Corridor, Northwestern China. Sci. China Earth Sci. 2019, 62, 953–963. [Google Scholar] [CrossRef]
  9. Liu, X.H.; An, W.L.; Leavitt, S.W.; Wang, W.Z.; Xu, G.B.; Zeng, X.M.; Qin, D.H. Recent strengthening of correlations between tree-ring δ13C and δ18O in mesic western China: Implications to climatic reconstruction and physiological responses. Glob. Planet. Change 2014, 113, 23–33. [Google Scholar] [CrossRef]
  10. Roden, J.S.; Lin, G.; Ehleringer, J.R. A mechanistic model for interpretation of hydrogen and oxygen isotope ratios in tree-ring cellulose. Geochim. Cosmochim. Acta 2000, 64, 21–35. [Google Scholar] [CrossRef]
  11. Szymczak, S.; Joachimski, M.M.; Bräuning, A.; Hetzer, T.; Kuhlemann, J. Are pooled tree ring δ13C and δ18O series reliable climate archives?—A case study of Pinus nigra spp. laricio (Corsica/France). Chem. Geol. 2012, 308–309, 40–49. [Google Scholar] [CrossRef]
  12. Liu, Y.; Wang, R.; Leavitt, S.W.; Song, H.; Linderholm, H.W.; Li, Q.; An, Z.S. Individual and pooled tree-ring stable-carbon isotope series in Chinese pine from the Nan Wutai region, China: Common signal and climate relationships. Chem. Geol. 2012, 330, 17–26. [Google Scholar] [CrossRef]
  13. Liu, X.H.; Zeng, X.M.; Leavitt, S.W.; Wang, W.; An, W.; Xu, G.; Sun, W.; Yang, Y.; Qin, D.; Ren, J. A 400-year tree-ring δ18O chronology for the southeastern Tibetan Plateau: Implications for inferring variations of the regional hydroclimate. Glob. Planet. Change 2013, 104, 23–33. [Google Scholar] [CrossRef]
  14. Schollaen, K.; Heinrich, I.; Neuwirth, B.; Krusic, P.J.; D’Arrigo, R.D.; Karyanto, O.; Helle, G. Multiple tree-ring chronologies (ring width, δ13C and δ18O) reveal dry and rainy season signals of rainfall in Indonesia. Quat. Sci. Rev. 2013, 73, 170–181. [Google Scholar] [CrossRef] [Green Version]
  15. Poussart, P.F.; Evans, M.N.; Schrag, D.P. Resolving seasonality in tropical trees: Multi-decade, high-resolution oxygen and carbon isotope records from Indonesia and Thailand. Earth Planet. Sci. Lett. 2004, 218, 301–316. [Google Scholar] [CrossRef]
  16. Qin, C.; Yang, B.; Brauning, A.; Griessginger, J.; Wernicke, J. Drought signals in tree-ring stable oxygen isotope series of Qilian juniper from the arid north-eastern Tibetan Plateau. Glob. Planet. Change 2015, 125, 48–59. [Google Scholar] [CrossRef]
  17. Liu, Y.; Wang, L.; Li, Q.; Cai, Q.F.; Song, H.M.; Sun, C.F.; Liu, R.S.; Mei, R.C. Asian summer monsoon-related relative humidity recorded by tree ring δ18O during last 205 years. J. Geophys. Res. Atmos. 2019, 124, 9824–9838. [Google Scholar] [CrossRef]
  18. Liu, Y.; Ren, M.; Li, Q.; Song, H.M.; Liu, R.S. Tree-ring δ18O-based July-August relative humidity reconstruction on Mt.Shimen, China, for the last 400 years. Atmos. Res. 2020, 243, 105024. [Google Scholar] [CrossRef]
  19. Li, Q.; Liu, Y.; Nakatsuka, T.; Fang, K.Y.; Song, H.M.; Liu, R.S.; Sun, C.F.; Li, G.; Wang, K. East Asian Summer Monsoon moisture sustains summer relative humidity in the southwestern Gobi Desert, China: Evidence from δ18O of tree rings. Clim. Dyn. 2019, 52, 6321–6337. [Google Scholar] [CrossRef]
  20. An, W.l.; Xu, C.X.; Liu, X.H.; Tan, N.; Sano, M.; Li, M.Q.; Shao, X.M.; Nakatsuka, T.; Guo, Z.T. Specific response of earlywood and latewood δ18O from the east and west of Mt. Qomolangma to the Indian summer monsoon. Sci. Total Environ. 2019, 689, 99–108. [Google Scholar] [CrossRef]
  21. Xu, C.X.; Shi, J.F.; Zhao, Y.; Nakatsuka, T.; Sano, M.; Shi, S.Y.; Guo, Z.T. Early summer precipitation in the lower Yangtze River basin for AD 1845-2011 based on tree-ring cellulose oxygen isotopes. Clim. Dyn. 2019, 52, 1583–1594. [Google Scholar] [CrossRef]
  22. Xu, G.B.; Liu, X.H.; Trouet, V.; Treydte, K.; Wu, G.J.; Chen, T.; Sun, W.Z.; An, W.L.; Wang, W.Z.; Zeng, X.M.; et al. Regional drought shifts (1710–2010) in East Central Asia and linkages with atmospheric circulation recorded in tree-ring δ18O. Clim. Dyn. 2019, 52, 713–727. [Google Scholar] [CrossRef] [Green Version]
  23. McCarroll, D.; Loader, N.J. Stable isotopes in tree rings. Quat. Sci. Rev. 2004, 23, 771–801. [Google Scholar] [CrossRef]
  24. Loader, N.J.; Young, G.H.F.; Grudd, H.; McCarroll, D. Stable carbon isotopes from Torneträsk, northern Sweden provide a millennial length reconstruction of summer sunshine and its relationship to Arctic circulation. Quat. Sci. Rev. 2013, 62, 97–113. [Google Scholar] [CrossRef]
  25. Wang, W.Z.; Liu, X.H.; Xu, G.B.; Zeng, X.M.; Wu, G.J.; Zhang, X.W.; Qin, D.H. Temperature signal instability of tree-ring δ13C chronology in the north-eastern Qinghai-Tibetan Plateau. Glob. Planet. Change 2016, 139, 165–172. [Google Scholar] [CrossRef]
  26. Liu, Y.; Wang, Y.C.; Li, Q.; Song, H.M.; Hans, W.L.; Steven, W.L.; Wang, R.Y.; An, Z.S. Tree-ring stable carbon isotope-based May-July temperature reconstruction over Nanwutai, China, for the past century and its record of 20th century warming. Quat. Sci. Rev. 2014, 93, 67–76. [Google Scholar] [CrossRef]
  27. Kang, S.Y.; Yang, B.; Qin, C. Recent tree-growth reduction in north central China as a combined result of a weakened monsoon and atmospheric oscillations. Clim. Change 2012, 115, 519–536. [Google Scholar] [CrossRef]
  28. Wang, Y.; Liu, Y.; Li, Q.; Song, H.M.; Sun, C.F.; Fang, C.X. An Asian Summer Monsoon-Related Relative Humidity Record from Tree-Ring δ18O in Gansu Province, North China. Atmosphere 2020, 11, 984. [Google Scholar] [CrossRef]
  29. Kang, S.Y.; Yang, B. Precipitation variability at the northern fringe of the Asian summer monsoon in northern China and its possible mechanism over the past 530 years. Quat. Sci. 2015, 35, 1185–1193. (In Chinese) [Google Scholar]
  30. Yang, B.; Qin, C.; Wang, J.; He, M.; Melvin, T.M.; Osborn, T.J.; Briffa, K.R. A 3500-year tree-ring record of annual precipitation on the north-eastern Tibetan Plateau. Proc. Natl. Acad. Sci. USA 2014, 111, 2903–2908. [Google Scholar] [CrossRef] [Green Version]
  31. Fritts, H.C. Tree Rings and Climate; Cambridge University Press: Cambridge, UK, 1976; p. 567. [Google Scholar]
  32. Speer, J.H. Fundamentals of Tree Ring Research; The University of Arizona Press: Tucson, AZ, USA, 2010. [Google Scholar]
  33. Loader, N.J.; Robertson, I.; Barker, A.C.; Switsur, V.R.; Waterhouse, J.S. An improved technique for the batch processing of small wholewood samples to α-cellulose. Chem.Geol. 1997, 136, 313–317. [Google Scholar] [CrossRef]
  34. Rinne, K.T.; Loader, N.J.; Switsur, V.R.; Waterhouse, J.S. 400-year May-August precipitation reconstruction for Southern England using isotopes in tree rings. Quat. Sci. Rev. 2013, 60, 13–25. [Google Scholar] [CrossRef]
  35. Young, G.H.F.; Loader, N.J.; McCarroll, D. A large scale comparative study of stable carbon isotope ratios determined using on-line combustion and low-temperature pyrolysis techniques. Palaeogeogr. Palaeocl. 2011, 300, 23–28. [Google Scholar] [CrossRef]
  36. Young, G.H.F.; Loader, N.J.; McCarroll, D.; Bale, R.J.; Demmler, J.C.; Miles, D.; Nayling, N.T.; Rinne, K.T.; Robertson, I.; Watts, C.; et al. Oxygen stable isotope ratios from British oak tree rings provide a strong and consistent record of past changes in summer rainfall. Clim. Dyn. 2015, 45, 3609–3622. [Google Scholar] [CrossRef]
  37. McCarroll, D.; Gagen, M.H.; Loader, N.J.; Robertson, I.; Anchukaitis, K.J.; Los, S.; Young, G.H.F.; Jalkanen, R.; Kirchhefer, A.; Waterhouse, J.S. Correction of tree ring stable carbon isotope chronologies for changes in the carbon dioxide content of the atmosphere. Geochim. Cosmochim. Acta 2009, 73, 1539–1547. [Google Scholar] [CrossRef]
  38. Esper, J.; Frank, D.C.; Battipalagia, G.; Büntgen, U.; Holert, C.; Treydte, K.S.; Siegwolf, R.; Saurer, M. Low-frequency noise in δ13C and δ18O tree ring data: A case study of Pinus uncinata in the Spanish Pyrenees. Glob. Biogeochem. Cycles 2010, 24, GB4018. [Google Scholar] [CrossRef] [Green Version]
  39. Wigley, T.; Briffa, K.R.; Jones, P.D. On the average value of correlated time series, with applications in dendroclimatology and hydrometeorology. J. Appl. Meteorol. Climatol. 1984, 23, 201–213. [Google Scholar] [CrossRef]
  40. Wells, N.; Goddard, S.; Hayes, M.J. A self-calibrating Palmer Drought Severity Index. J. Clim. 2004, 17, 2335–2351. [Google Scholar] [CrossRef]
  41. Biondi, F.; Waikul, K. DENDROCLIM2002: A C++ program for statistical calibration of climate signals in tree-ring chronologies. Comput. Geosci. 2004, 30, 303–331. [Google Scholar] [CrossRef]
  42. Mann, M.E.; Lees, J. Robust estimation of background noise and signal detection in climatic time series. Clim. Change 1996, 33, 409–445. [Google Scholar] [CrossRef]
  43. Cook, E.R.; Meko, D.M.; Stahle, D.W.; Cleaveland, M.K. Drought reconstructions for the continental United States. J. Clim. 1999, 12, 1145–1162. [Google Scholar] [CrossRef] [Green Version]
  44. Van der Schrier, G.; Barichivich, J.; Briffa, K.R.; Jones, P.D. A scPDSI-based global data set of dry and wet spells for 1901–2009. J. Geophys. Res. Atmos. 2013, 118, 4025–4048. [Google Scholar] [CrossRef]
  45. Xiao, S.; Peng, X.; Tian, Q.; Ding, A. Drought variation recorded by growth rings of the shrub Sabina vulgaris in the middle Qilian Mountains, northwest China. Dendrochronologia 2021, 66, 125813. [Google Scholar] [CrossRef]
  46. Sun, M.F.; Wang, H.J. Relationship and its instability of ENSO-Chinese variations in droughts and wet spells. Sci. China Ser. D Earth. Sci. 2007, 50, 145–152. [Google Scholar] [CrossRef]
  47. Tourre, Y.M.; Rajagopalan, B.; Kushnir, Y. Patterns of coherent decadal and interdecadal climate signals in the Pacific Basin during the 20th Century. Geophys. Res. Lett. 2001, 28, 2069–2072. [Google Scholar] [CrossRef] [Green Version]
  48. Attolini, M.R.; Cecchini, S.; Galli, M.; Kocharov, G.E.; Nanni, T. 400 Year record of Δ14C in tree rings: The solar-activity cycle before, during and after maunder minimum and the longer cycles in tree rings: The solar-activity cycle before, during and after maunder minimum and the longer cycles. IL Nuovo Cim. C 1993, 16, 419–436. [Google Scholar] [CrossRef]
  49. Pumijumnong, N.; Muangsong, C.; Buajan, S.; Cai, B.G.; Kunkoon, T.; Malimart, K. Effects of the Pacific Decadal Oscillation on Thailand monsoon rainfall derived from a 194-year tree ring width chronology of teak trees from northwestern Thailand. Int. J. Biometeorol. 2020, 64, 1481–1495. [Google Scholar] [CrossRef]
  50. Hurrell, J.W.; Van, L.H. Decadal variations in climate associated with the North Atlantic Oscillation. Clim. Change 1997, 36, 301–326. [Google Scholar] [CrossRef]
  51. Chen, W.; Zhou, Q.; Xue, X. Solar cycle modulation of the relationship between the boreal pring Northern Atlantic Oscillation and the East and Southeast Asian summer climate. Meteorol. Atmos. Phys. 2020, 132, 287–295. [Google Scholar] [CrossRef]
  52. Shi, F.; Li, J.; Wilson, R. A tree-ring reconstruction of the South Asian summer monsoon index over the past millennium. Sci. Rep. 2014, 4, 6739. [Google Scholar] [CrossRef] [Green Version]
  53. Guo, Q.Y.; Cai, J.N.; Shao, X.M.; Sha, W.Y. Studies on the Variations of East-Asian Summer Monsoon during AD 1873–2000. Chin. J. Atmos. Sci. 2004, 28, 206–215. (In Chinese) [Google Scholar]
  54. Huang, B.Y.; Thorne, P.W.; Banzon, V.F.; Boyer, T.; Chepurin, G.; Lawrimore, J.H.; Menne, M.J.; Smith, T.M.; Vose, R.S.; Zhang, H.M. Extended Reconstructed Sea Surface Temperatures Version 5 (ERSSTv5): Upgrades, Validations, and Intercomparisons. J. Clim. 2017, 30, 8179–8205. [Google Scholar] [CrossRef]
  55. Tan, M. Circulation effect: Climatic significance of the short term variability of the oxygen isotopes in stalagmites from monsoonal China-dialogue between paleoclimate records and modern climate research. Quat. Sci. 2009, 29, 851–862. [Google Scholar]
  56. Ma, Z. The interdecadal trend and shift of dry/wet over the central part of North China and their relationship to the Pacific Decadal Oscillation (PDO). Chin. Sci. Bull. 2007, 52, 2130–2139. [Google Scholar] [CrossRef]
  57. Quinn, W.H.; Neal, V.T. The Historical Record of El Nino Events. In Climate Since AD 1500; Bradley, R.S., Jones, P.D., Eds.; Routledge: London, UK, 1992; pp. 623–648. [Google Scholar]
  58. Pinto, J.G.; Raible, C.C. Past and recent changes in the North Atlantic oscillation. Wiley Interdiscip. Rev. Clim.Change 2012, 3, 79–90. [Google Scholar] [CrossRef] [Green Version]
  59. Linderholm, H.W.; Ou, T.H.; Jeong, J.H.; Folland, C.K.; Gong, D.Y.; Liu, H.B.; Liu, Y.; Chen, D.L. Interannual teleconnections between the summer North Atlantic Oscillation and the East Asian summer monsoon. J. Geophys. Res. Atmos. 2011, 116, D13107. [Google Scholar] [CrossRef]
  60. Linderholm, H.W.; Seima, A.; Ou, T.H.; Jeong, J.H.; Liu, Y.; Wang, X.C.; Bao, G.; Folland, C. Exploring teleconnections between the summer NAO (SNAO) and climate in East Asia over the last four centuries-A tree-ring perspective. Dendrochronologia 2013, 31, 297–331. [Google Scholar] [CrossRef]
Figure 1. Sampling site (red star) within the HSM. Blue cross symbols represent comparison sites in Hetao [29], the Hexi Corridor [8], and the north-eastern Tibetan Plateau (TP) [30]. ASML and ASM are the mean Asian summer monsoon limit and Asian summer monsoon, respectively.
Forests 13 00492 g001
Figure 2. Mean annual precipitation, summer precipitation, and average annual temperature for the Jingyuan meteorological station during the period 1951–2015 CE. The dashed line indicates linear trend.
Forests 13 00492 g002
Figure 3. (a) shows tree-ring δ13Craw series derived from raw data, corrected tree-ring δ13Ccor based on the method of [23], and tree-ring δ13Cpin based on the method of [37]. (b) shows reconstructed annual scPDSI values for June (previous year) to May (current year) for the period from 1884 to 2015 CE. RMSE is the root mean square error.
Forests 13 00492 g003
Figure 4. Correlation coefficients for tree-ring δ13C (a) and δ18O (b) series with temperature, precipitation, relative humidity, scPDSI, and SPEI from June each year to October of the following year during the period from 1951 to 2015. Grey shaded bands indicate the 95% confidence level.
Forests 13 00492 g004
Figure 5. The 31-year running correlations between tree-ring δ13C chronology and scPDSI with significant ones at 95% confidence level expressing as falling outside of grey shading.
Forests 13 00492 g005
Figure 6. Spatial correlation results between reconstructed (a) and instrumental (b) scPDSI values with UCAR scPDSI collected from the period 1951 to 2015. The black star represents sampling site. Significant correlations at the 90% level are marked.
Forests 13 00492 g006
Figure 7. Tree-ring δ13C reconstruction in our study (a) compared with (b) PDSI reconstructions based on tree-ring width data from the HSM [27], (c) an annual precipitation reconstruction for Hetao [29], (d) an early summer moisture reconstruction in the Hexi Corridor [8], and (e) a precipitation reconstruction for the north-eastern Tibetan Plateau [30]. Common drought periods are indicated by green shaded bars. The r is the correlation coefficient between our reconstructions and other reconstructions in the common measurement periods (p < 0.01). All of the series were normalized and smoothed with a 10-year moving average.
Forests 13 00492 g007
Figure 8. Spatial correlation coefficient of the reconstructed scPDSI (a) and a 10-year running average scPDSI value (b) with the SST over the common measurement period from 1951 to 2014. Significant correlations at the 90% level have been marked.
Forests 13 00492 g008
Table 1. The average correlations among each tree-ring δ13C and δ18O series.
SamplesTree-Ring δ13CTree-Ring δ18O
2345678923456789
10.480.260.710.570.510.330.410.310.06−0.040.540.330.150.390.160.00
2 0.400.790.630.600.300.580.10 0.400.380.430.18−0.120.130.25
3 0.560.340.550.450.280.49 0.260.490.13−0.070.230.25
4 0.660.750.480.520.34 0.560.470.470.360.27
5 0.550.500.430.31 0.260.250.510.35
6 0.630.590.49 0.500.200.27
7 0.290.66 0.130.03
8 0.26 0.36
Table 2. Characteristics of measured tree-ring δ13C and δ18O series.
Tree-Ring δ13CTree-Ring δ18O
Time span (CE)1750–20151750–2015
Mean (‰)−21.8732.61
Minimun (‰)−23.6529.18
Maximun (‰)−19.9036.63
Mean EPS0.890.76
Mean Rbar0.480.27
Table 3. Regression model statistics for different calibration and verification periods.
Calibration
(1951–1980)
Verification
(1981–2015)
Calibration
(1984–2015)
Verification
(1951–1983)
Full Calibration
(1951–2015)
R0.690.410.740.410.66
R20.480.170.550.1742.6%
R2adj0.460.140.540.14-
RE0.56-0.49-0.40 L
CE-0.53-0.47-
R—correlation coefficient; R2—variance explained by the regression model; R2adj—adjusted explained variance of the regression model; RE—reduction of error statistic; CE—coefficient of efficiency; and L—leave-one-out verification; L—the value is calculated from the leave-one-out method.
Publisher’s Note: MDPI stays neutral with regard to jurisdictional claims in published maps and institutional affiliations.

