Comparative Ecophysiology of Black Spruce between Lichen Woodlands and Feathermoss Stands in Eastern Canada

Abstract
1. Introduction
2. Methods
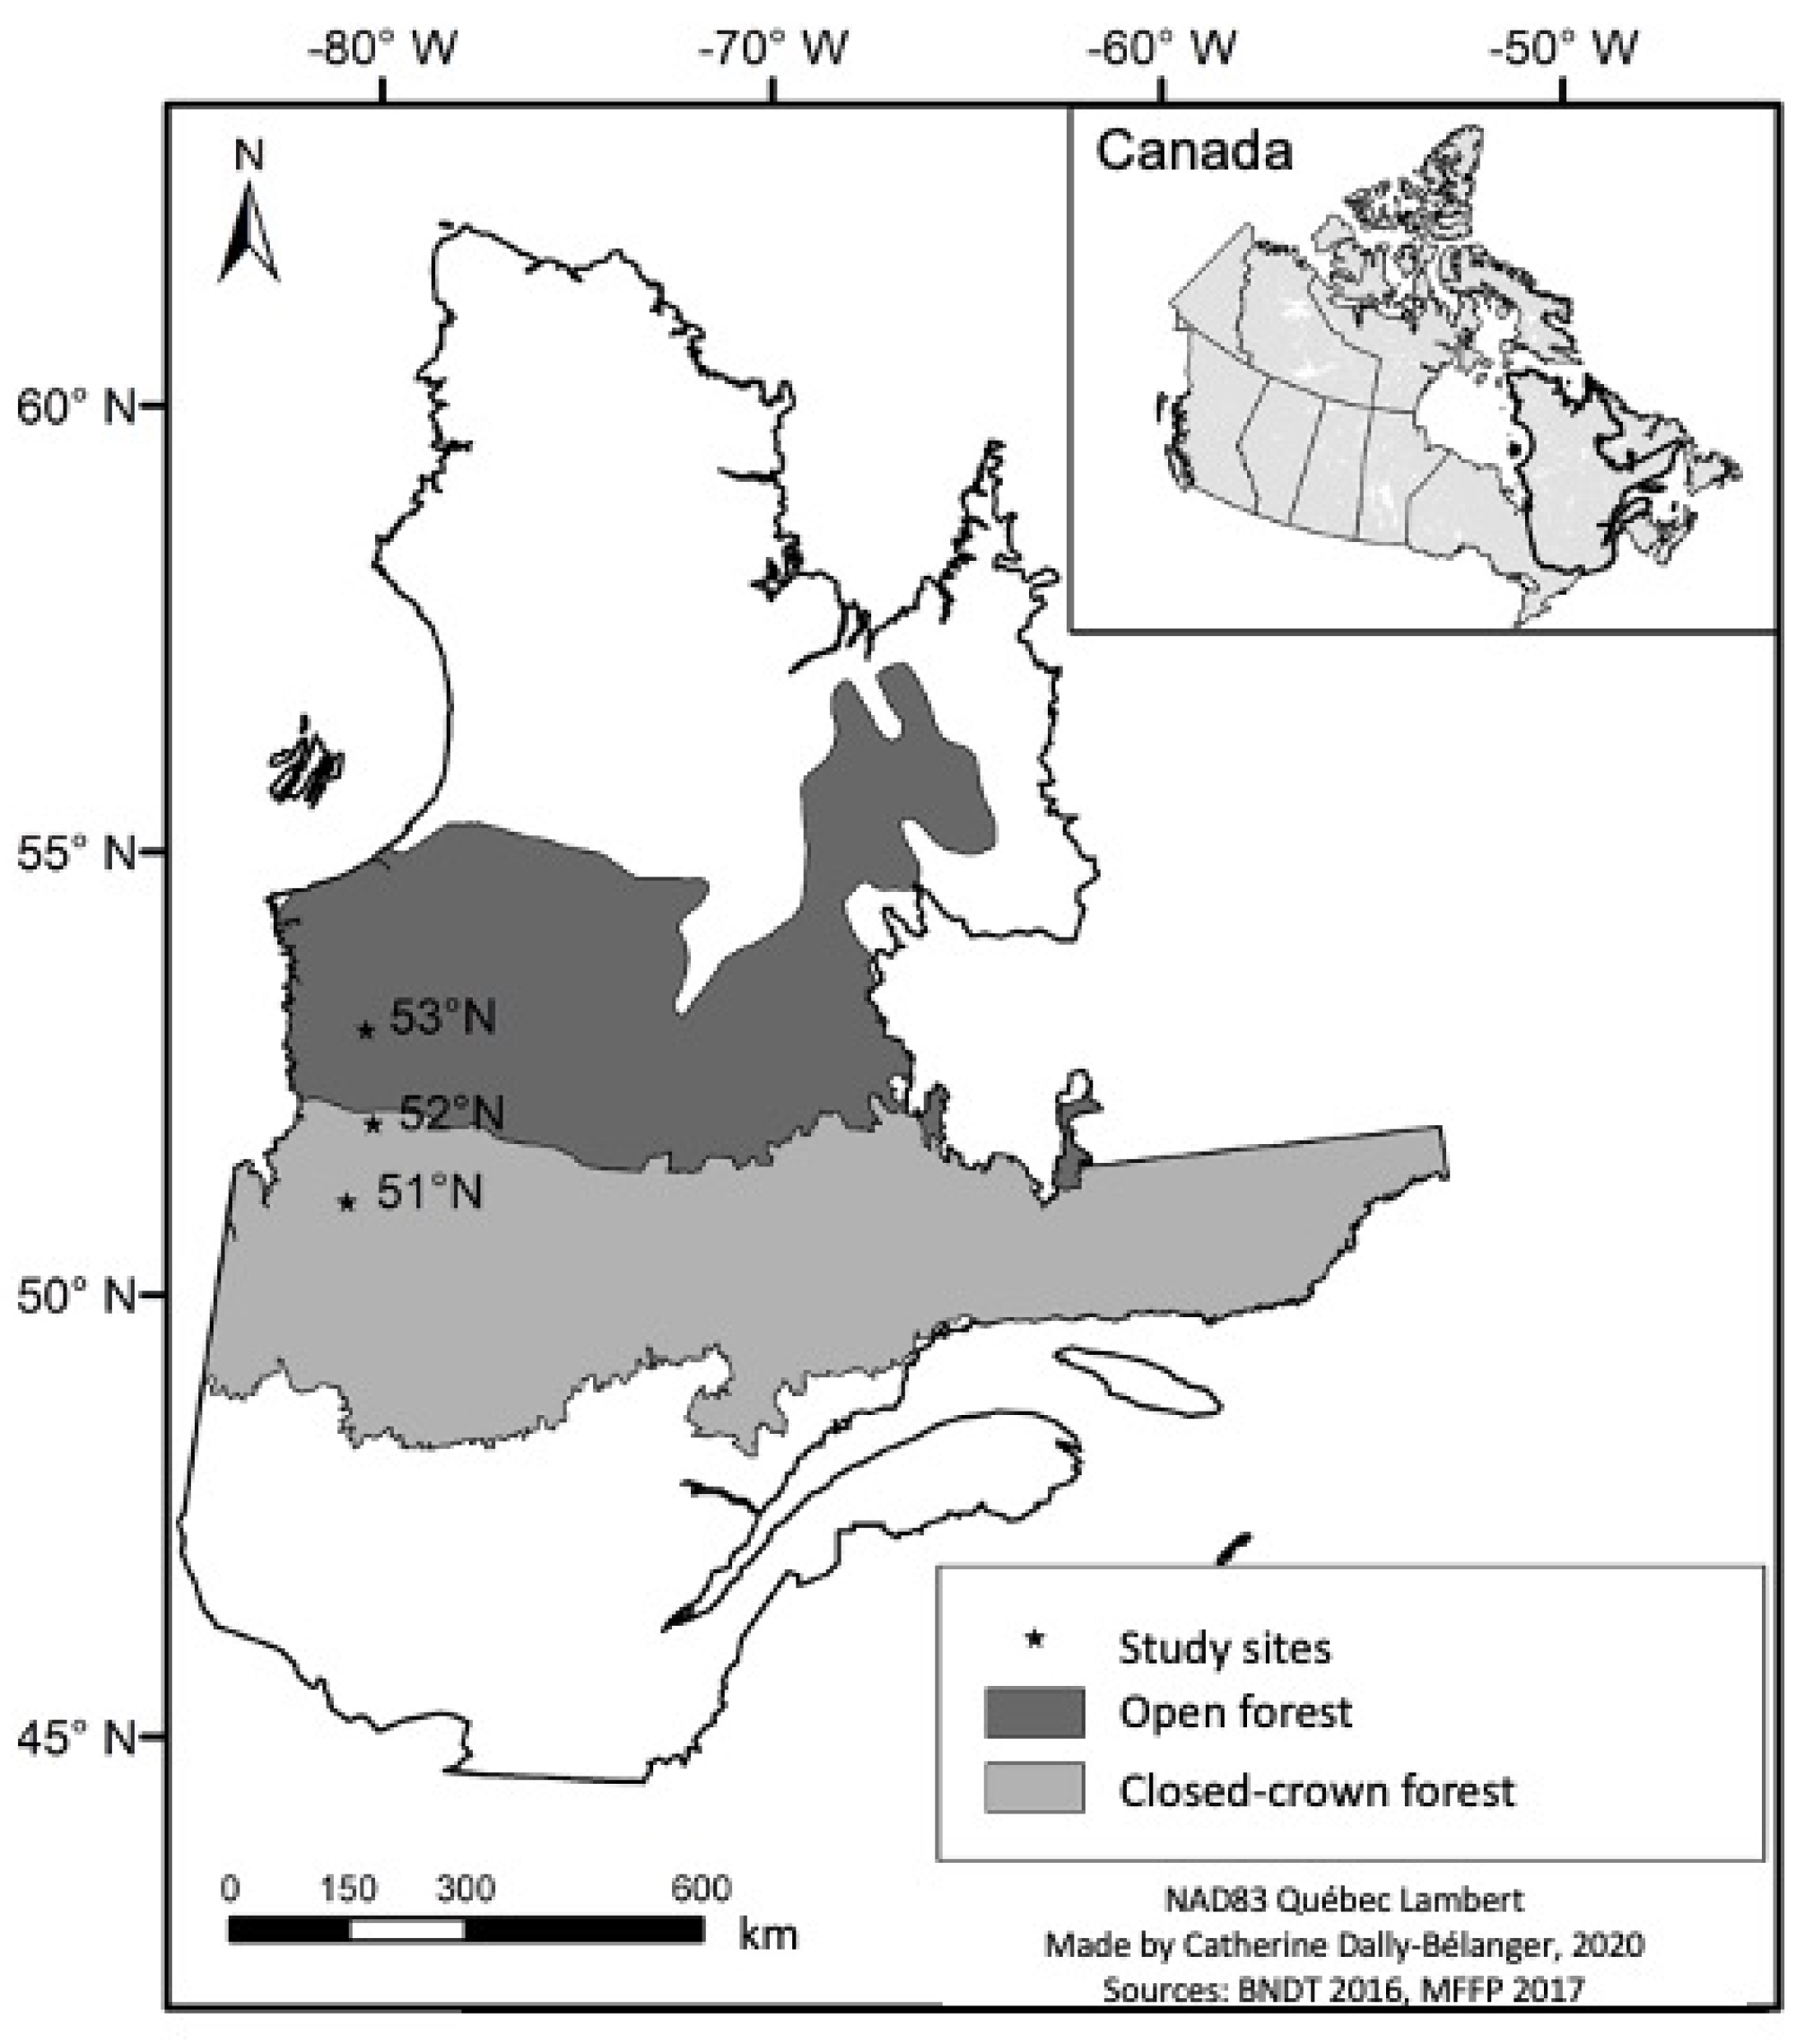
2.1. Study Area
2.2. Sampling Periods
2.3. Experimental Design
2.4. Field Sampling
2.5. Ecophysiology
2.6. CO2 Response Curves (RACiR)
2.7. Correction of Ecophysiological Data by Leaf Area
2.8. Maximum Photosynthetic Rate (Amax)
3. Data Analysis
4. Results
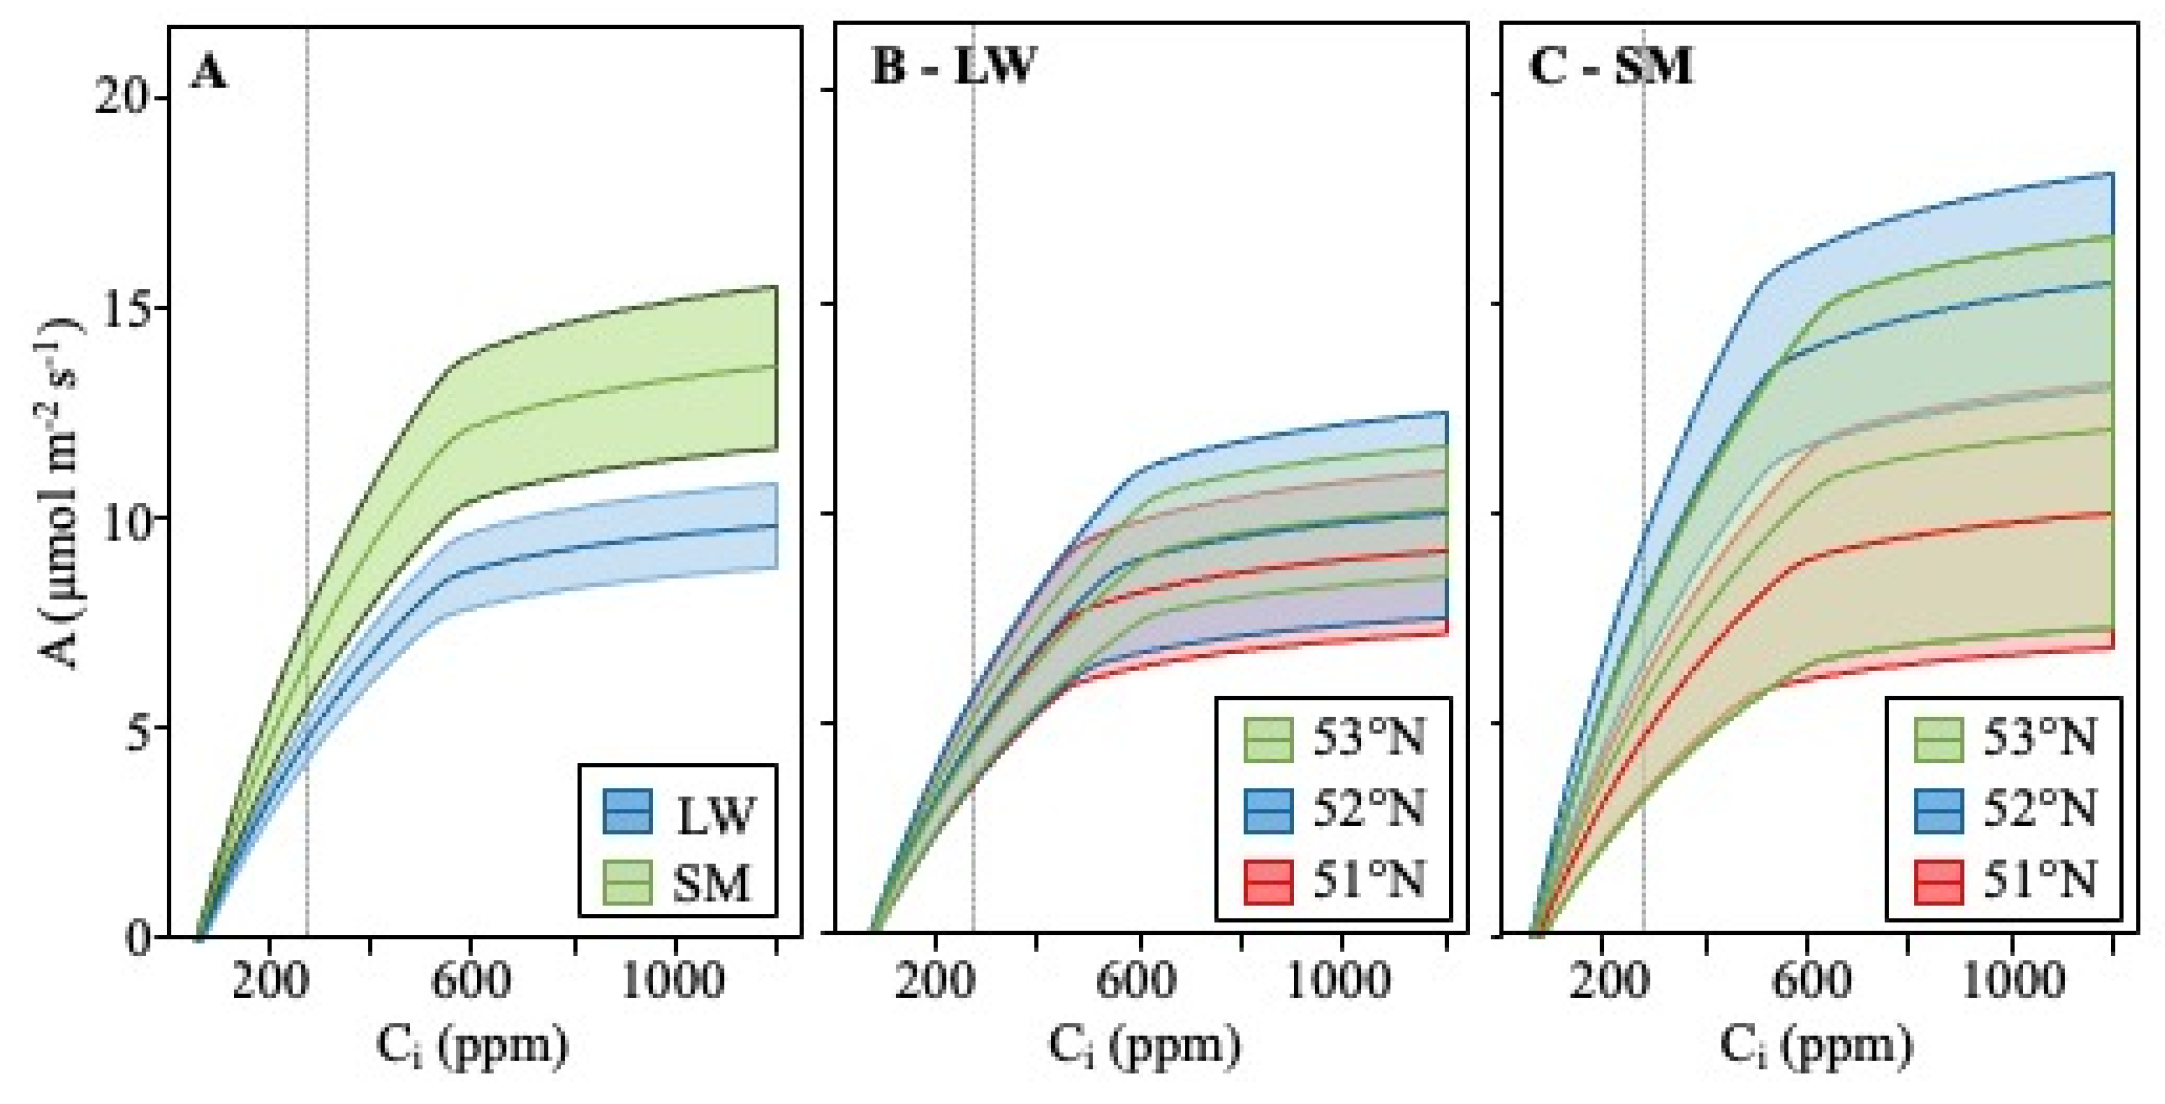
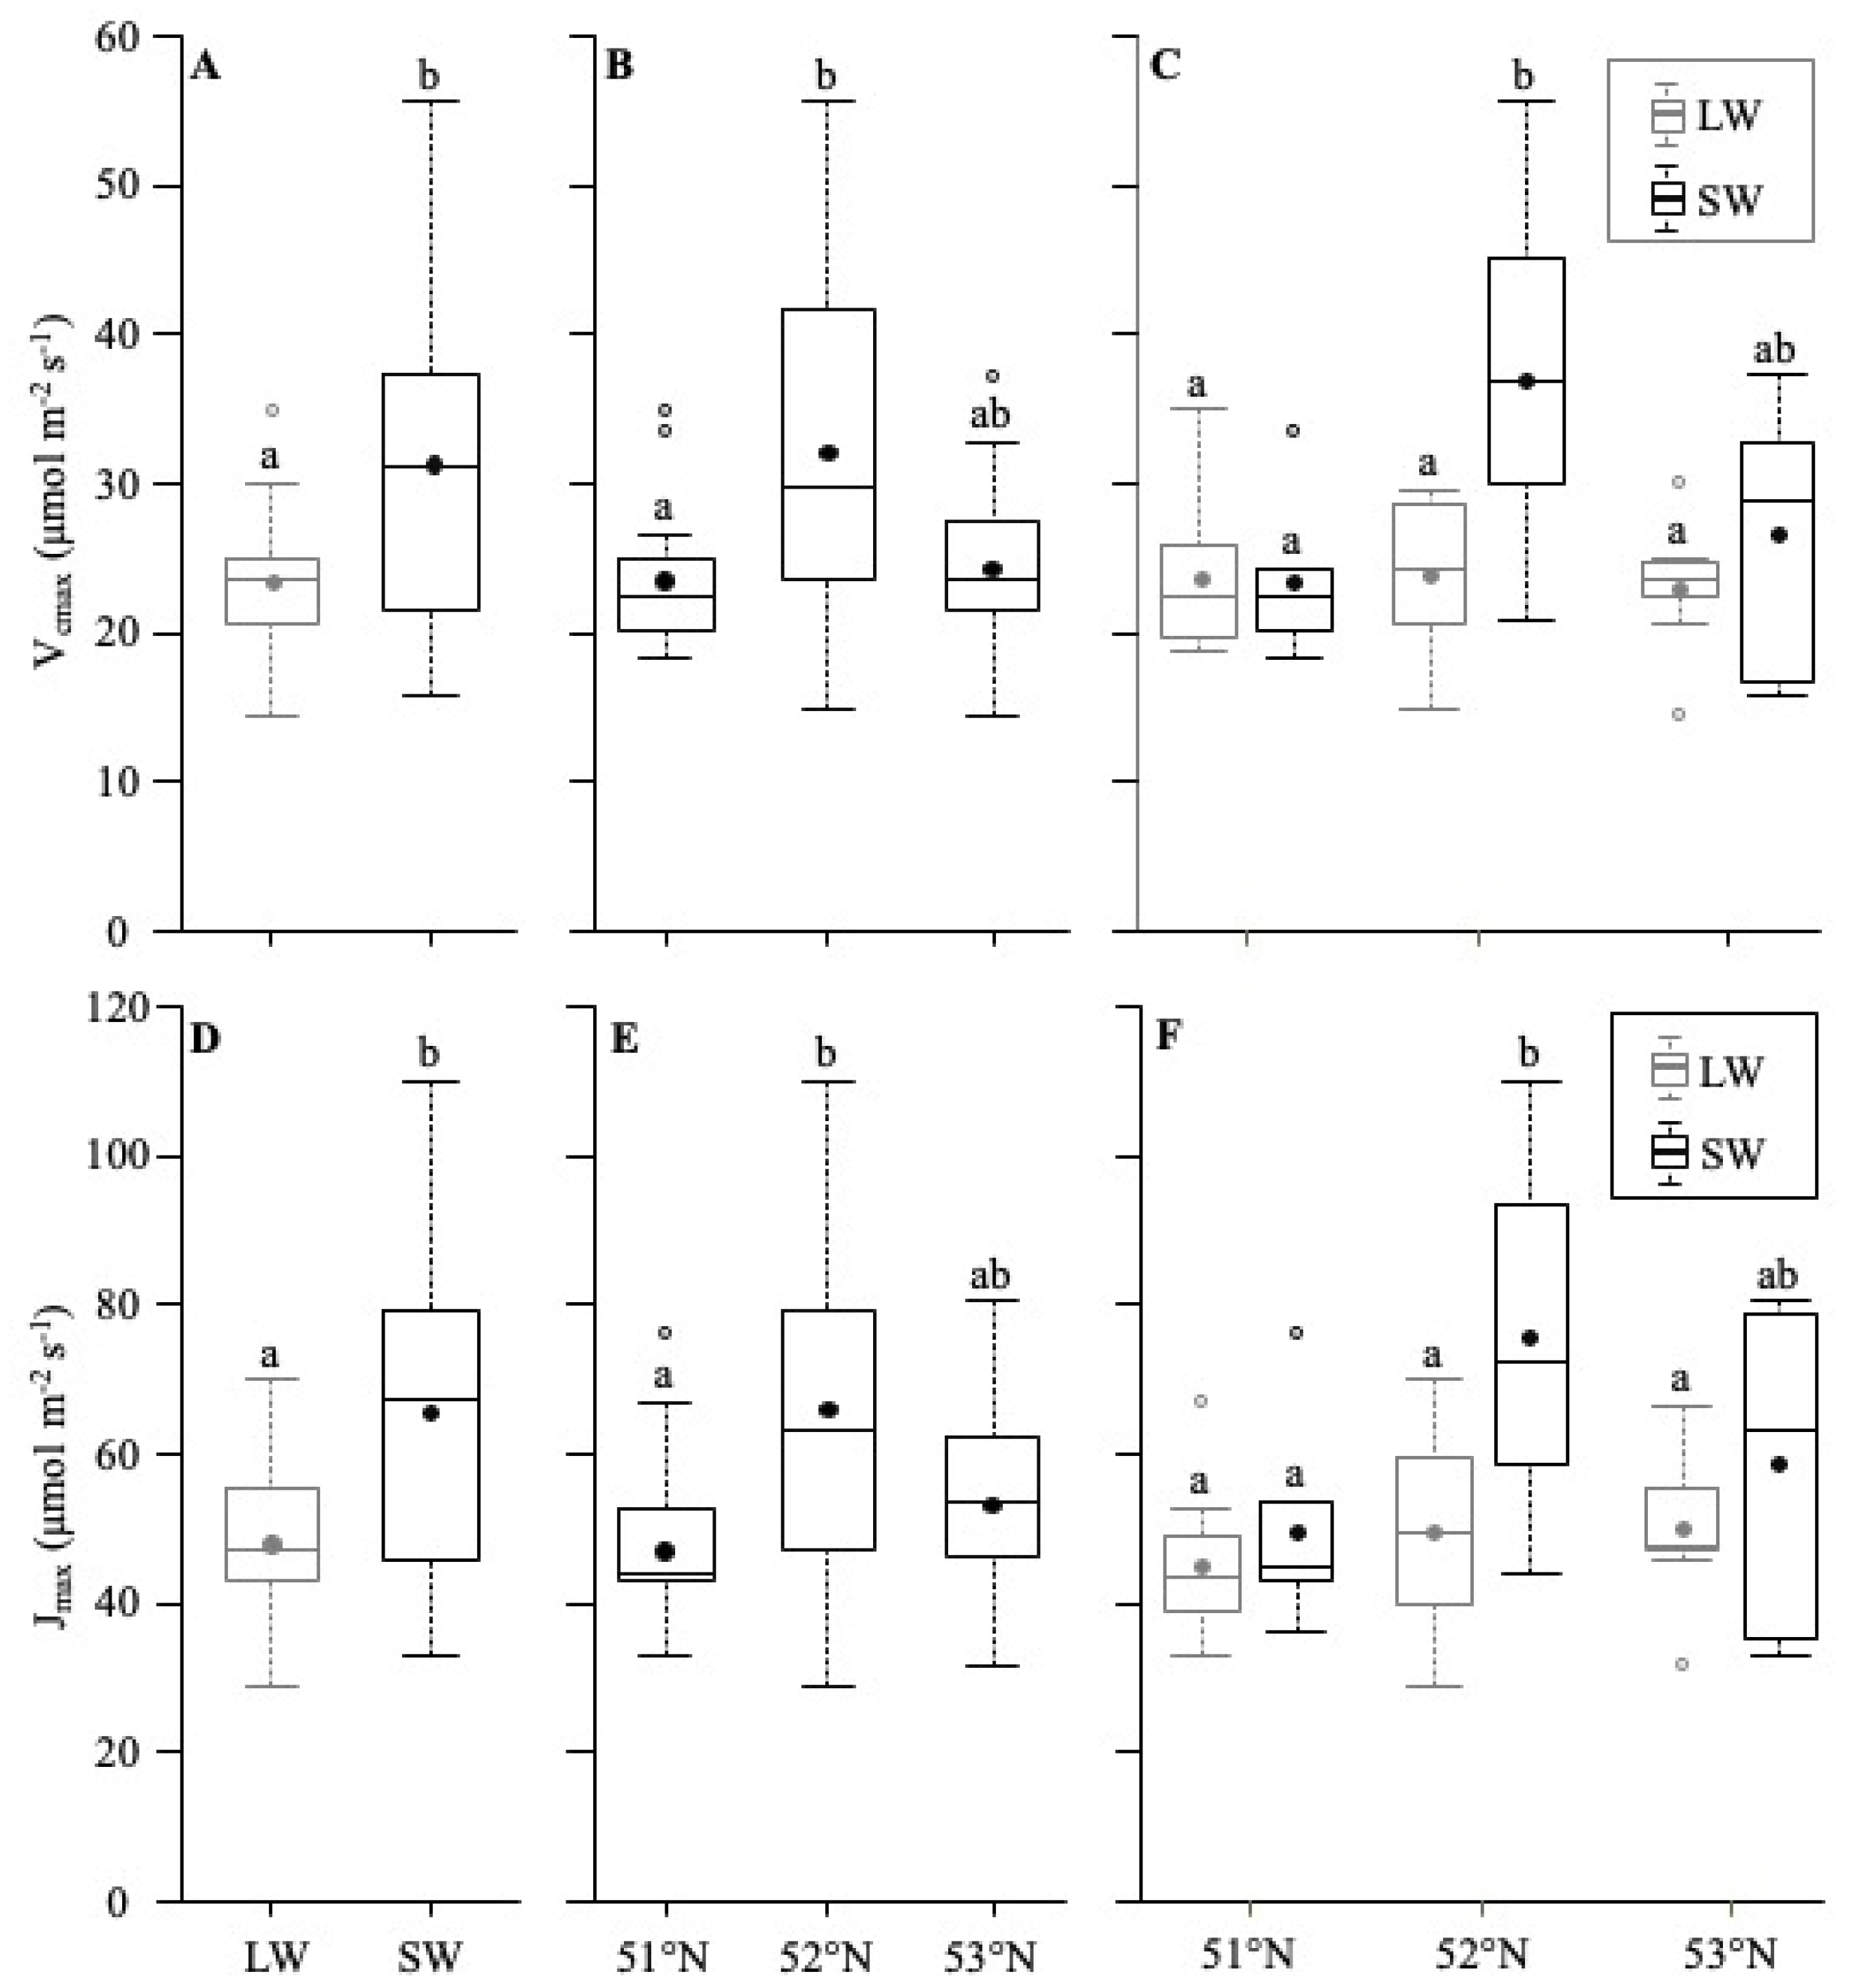
4.1. CO2 Response Curve
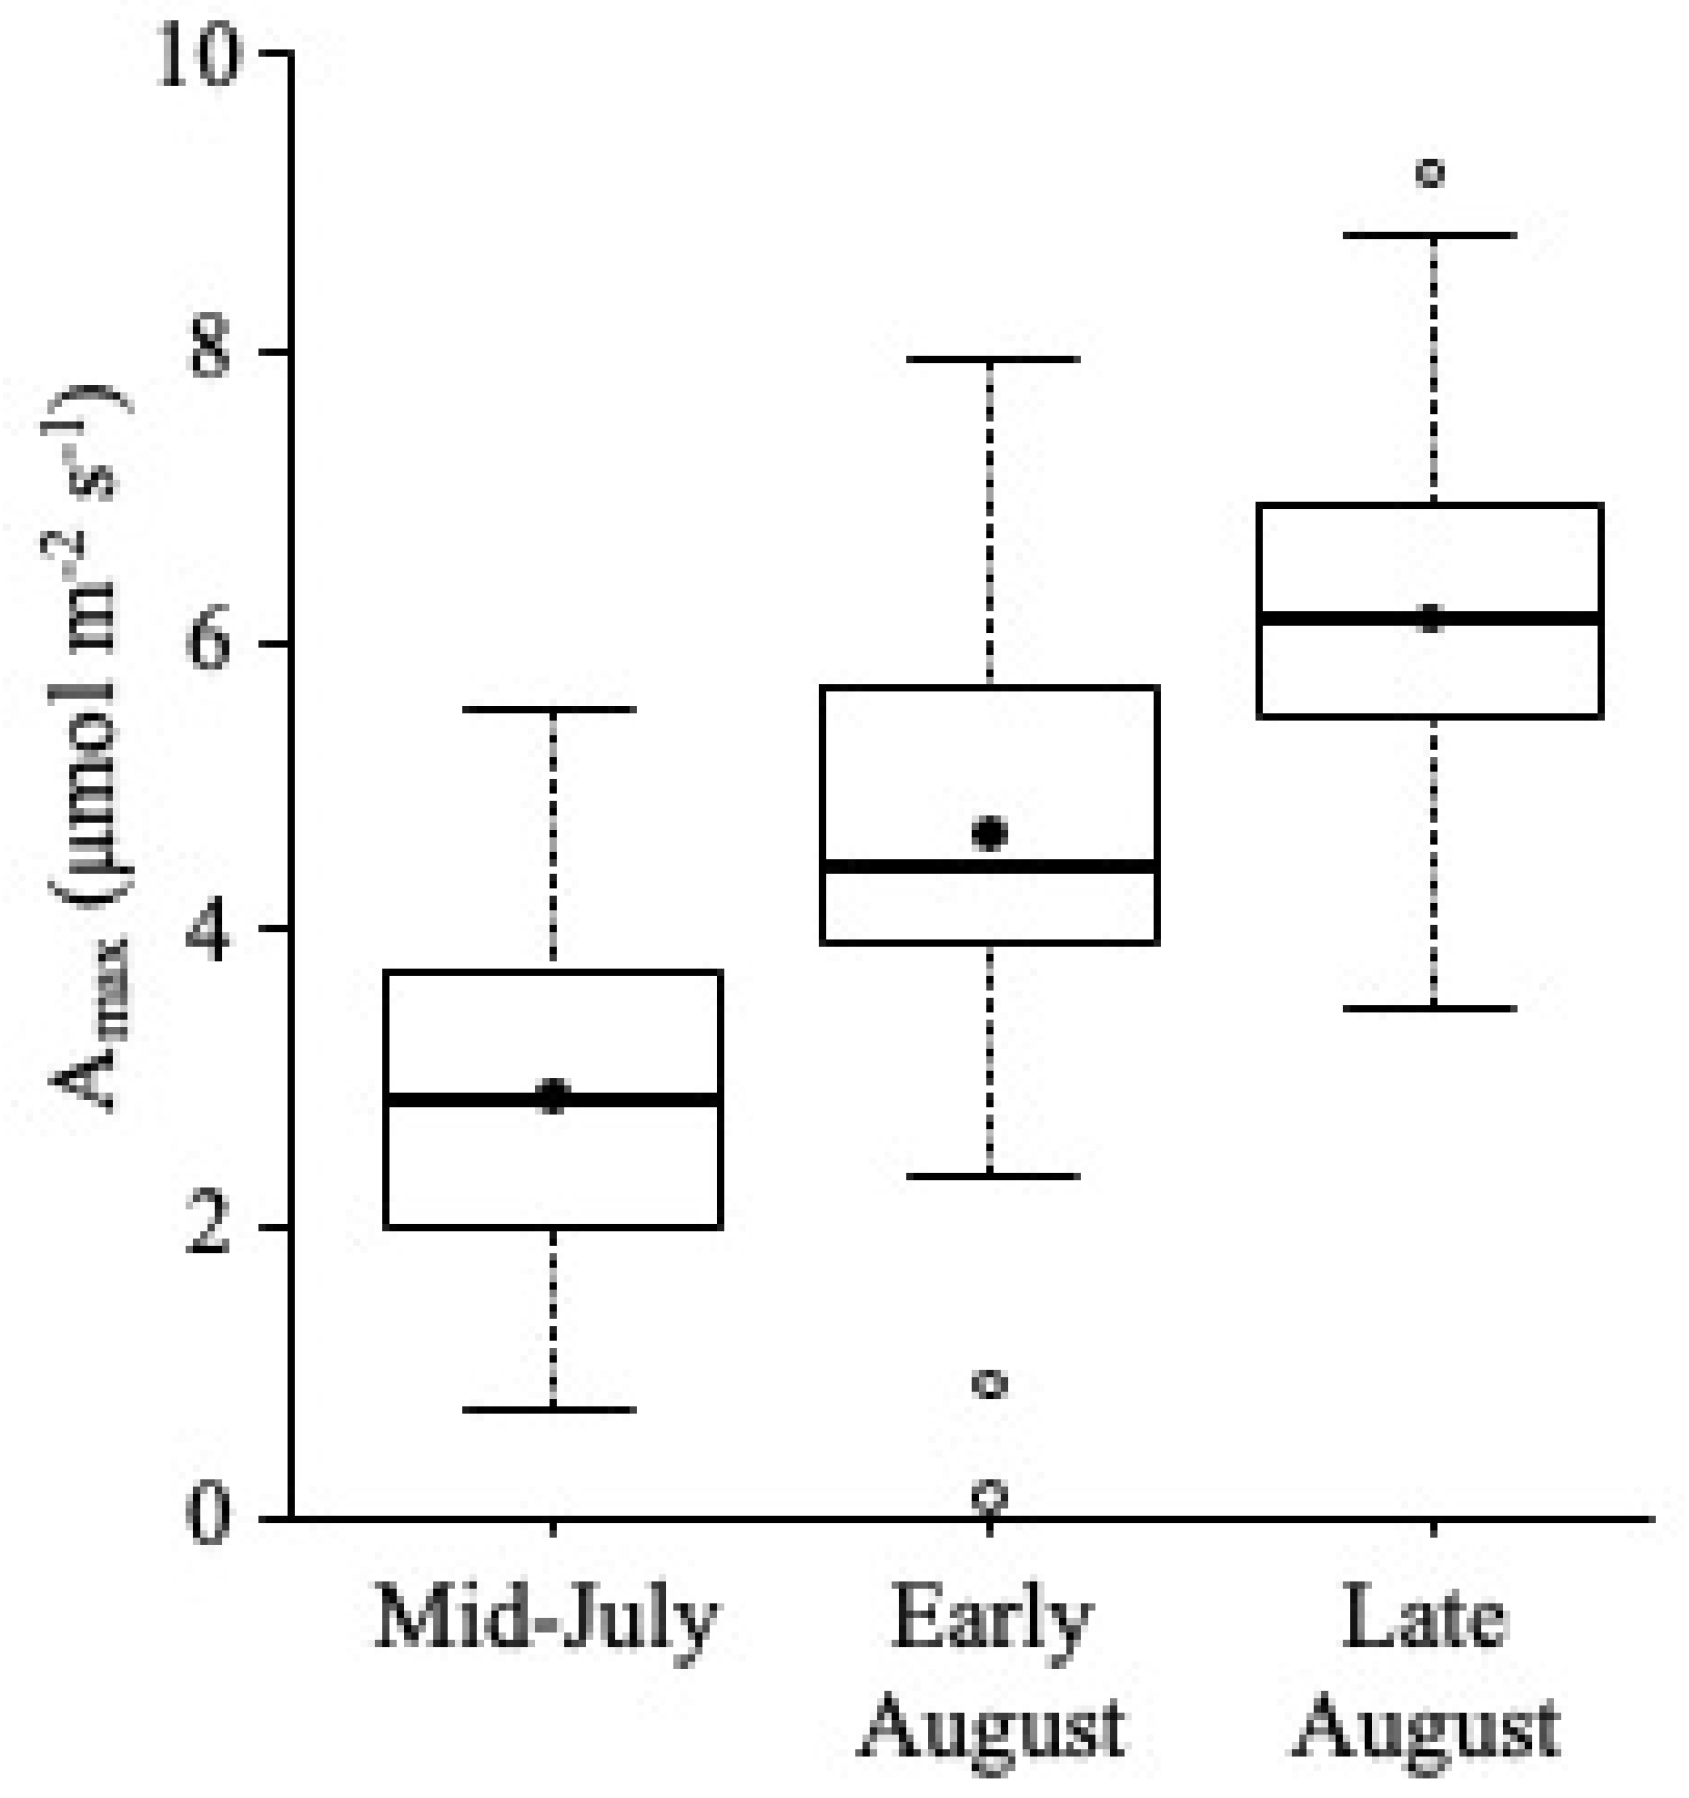
Amax
5. Discussion
5.1. Differences between SM and LW
5.2. Latitude
5.3. Growth Season
6. Conclusions
Author Contributions
Funding
Institutional Review Board Statement
Informed Consent Statement
Data Availability Statement
Acknowledgments
Conflicts of Interest
References
- Jasinski, J.P.P.; Payette, S. The creation of alternative stable states in the southern boreal forest, Québec, Canada. Ecol. Monogr. 2005, 75, 561–583. [Google Scholar] [CrossRef]
- Girard, F.; Payette, S.; Gagnon, R. Origin of the lichen-spruce woodland in the closed-crown forest zone of eastern Canada. Glob. Ecol. Biogeogr. 2009, 18, 291–303. [Google Scholar] [CrossRef]
- Girard, F.; Payette, S.; Gagnon, R. Rapid expansion of lichen woodlands within the closed-crown boreal forest zone over the last 50 years caused by stand disturbances in eastern Canada. J. Biogeogr. 2008, 35, 529–537. [Google Scholar] [CrossRef]
- Simard, M.; Payette, S. Reduction of black spruce seed bank by spruce budworm infestation compromises postfire stand regeneration. Can. J. For. Res. 2005, 35, 1686–1696. [Google Scholar] [CrossRef]
- Johnstone, J.F.; Hollingsworth, T.N.; Chapin III, F.S.; Mack, M.C. Changes in fire regime break the legacy lock on successional trajectories in Alaskan boreal forest. Glob. Chang. Biol. 2010, 16, 1281–1295. [Google Scholar] [CrossRef]
- Payette, S.; Bhiry, N.; Delwaide, A.; Simard, M. Origin of the lichen woodland at its southern range limit in eastern Canada: The catastrophic impact of insect defoliators and fire on the spruce-moss forest. Can. J. For. Res. 2000, 30, 288–305. [Google Scholar] [CrossRef]
- Dobbertin, M. Tree growth as indicator of tree vitality and of tree reaction to environmental stress: A review. Eur. J. For. Res. 2005, 124, 319–333. [Google Scholar] [CrossRef]
- McCarter, C.P.; Price, J.S. The hydrology of the Bois-des-Bel peatland restoration: Hydrophysical properties limiting connectivity between regenerated Sphagnum and remnant vacuum harvested peat deposit. Ecohydrology 2015, 8, 173–187. [Google Scholar] [CrossRef]
- Greene, D.F.; Noël, J.; Bergeron, Y.; Rousseau, M.; Gauthier, S. Recruitment of Picea mariana, Pinus banksiana, and Populus tremuloides across a burn severity gradient following wildfire in the southern boreal forest of Quebec. Can. J. For. Res. 2004, 34, 1845–1857. [Google Scholar] [CrossRef]
- Perrault-Hébert, M.; Boucher, Y.; Fournier, R.; Girard, F.; Auger, I.; Thiffault, N.; Grenon, F. Ecological drivers of post-fire regeneration in a recently managed boreal forest landscape of eastern Canada. For. Ecol. Manag. 2017, 399, 74–81. [Google Scholar] [CrossRef]
- Sedia, E.G.; Ehrenfeld, J.G. Lichens and mosses promote alternate stable plant communities in the New Jersey Pinelands. Oikos 2003, 100, 447–458. [Google Scholar] [CrossRef]
- Soudzilovskaia, N.A.; van Bodegom, P.M.; Cornelissen, J.H. Dominant bryophyte control over high-latitude soil temperature fluctuations predicted by heat transfer traits, field moisture regime and laws of thermal insulation. Funct. Ecol. 2013, 27, 1442–1454. [Google Scholar] [CrossRef]
- Bernier, P.; Desjardins, R.; Karimi-Zindashty, Y.; Worth, D.; Beaudoin, A.; Luo, Y.; Wang, S. Boreal lichen woodlands: A possible negative feedback to climate change in eastern North America. Agric. For. Meteorol. 2011, 151, 521–528. [Google Scholar] [CrossRef]
- Plasse, C.; Payette, S. Frost hollows of the boreal forest: A spatiotemporal perspective. J. Ecol. 2015, 103, 669–678. [Google Scholar] [CrossRef]
- Dy, G.; Payette, S. Frost hollows of the boreal forest as extreme environments for black spruce tree growth. Can. J. For. Res. 2007, 37, 492–504. [Google Scholar] [CrossRef]
- Macias Fauria, M.; Helle, T.; Niva, A.; Posio, H.; Timonen, M. Removal of the lichen mat by reindeer enhances tree growth in a northern Scots pine forest. Can. J. For. Res. 2008, 38, 2981–2993. [Google Scholar] [CrossRef]
- Sedia, E.G.; Ehrenfeld, J.G. Differential effects of lichens and mosses on soil enzyme activity and litter decomposition. Biol. Fertil. Soils 2006, 43, 177–189. [Google Scholar] [CrossRef]
- DeLuca, T.; Zackrisson, O.; Bergman, I.; Hörnberg, G. Historical land use and resource depletion in spruce-Cladina forests of subarctic Sweden. Anthropocene 2013, 1, 14–22. [Google Scholar] [CrossRef]
- Pacé, M.; Fenton, N.J.; Paré, D.; Bergeron, Y. Ground-layer composition affects tree fine root biomass and soil nutrient availability in jack pine and black spruce forests under extreme drainage conditions. Can. J. For. Res. 2017, 47, 433–444. [Google Scholar] [CrossRef]
- Manter, D.K.; Kerrigan, J. A/C i curve analysis across a range of woody plant species: Influence of regression analysis parameters and mesophyll conductance. J. Exp. Bot. 2004, 55, 2581–2588. [Google Scholar] [CrossRef]
- Wullschleger, S.D. Biochemical limitations to carbon assimilation in C3 plants—a retrospective analysis of the A/Ci curves from 109 species. J. Exp. Bot. 1993, 44, 907–920. [Google Scholar] [CrossRef]
- Bonan, G.B.; Lawrence, P.J.; Oleson, K.W.; Levis, S.; Jung, M.; Reichstein, M.; Lawrence, D.M.; Swenson, S.C. Improving canopy processes in the Community Land Model version 4 (CLM4) using global flux fields empirically inferred from FLUXNET data. J. Geophys. Res. Biogeosci. 2011, 116. [Google Scholar] [CrossRef]
- Zaehle, S.; Friend, A. Carbon and nitrogen cycle dynamics in the O-CN land surface model: 1. Model description, site-scale evaluation, and sensitivity to parameter estimates. Glob. Biogeochem. Cycles 2010, 24, 1–13. [Google Scholar] [CrossRef]
- Farquhar, G.D.; von Caemmerer, S.; Berry, J.A. A biochemical model of photosynthetic CO2 assimilation in leaves of C3 species. Planta 1980, 149, 78–90. [Google Scholar] [CrossRef]
- Jensen, A.M.; Warren, J.M.; Hanson, P.J.; Childs, J.; Wullschleger, S.D. Needle age and season influence photosynthetic temperature response and total annual carbon uptake in mature Picea mariana trees. Ann. Bot. 2015, 116, 821–832. [Google Scholar] [CrossRef]
- Bronson, D.R.; Gower, S.T. Ecosystem warming does not affect photosynthesis or aboveground autotrophic respiration for boreal black spruce. Tree Physiol. 2010, 30, 441–449. [Google Scholar] [CrossRef]
- Goudiaby, V.; Brais, S.; Grenier, Y.; Berninger, F. Thinning effects on jack pine and black spruce photosynthesis in eastern boreal forests of Canada. Silva Fenn. 2011, 45, 595–609. [Google Scholar] [CrossRef]
- Whitehead, D.; Gower, S.T. Photosynthesis and light-use efficiency by plants in a Canadian boreal forest ecosystem. Tree Physiol. 2001, 21, 925–929. [Google Scholar] [CrossRef]
- D’Orangeville, L.; Houle, D.; Duchesne, L.; Phillips, R.P.; Bergeron, Y.; Kneeshaw, D. Beneficial effects of climate warming on boreal tree growth may be transitory. Nat. Commun. 2018, 9, 1–10. [Google Scholar] [CrossRef]
- Johnsen, K.H.; Seiler, J.R.; Major, J.E. Growth, shoot phenology and physiology of diverse seed sources of black spruce: II. 23-year-old field trees. Tree Physiol. 1996, 16, 375–380. [Google Scholar] [CrossRef]
- Goulden, M.L.; Daube, B.C.; Fan, S.-M.; Sutton, D.J.; Bazzaz, A.; Munger, J.W.; Wofsy, S.C. Physiological responses of a black spruce forest to weather. J. Geophys. Res. 1997, 102, 28987–28996. [Google Scholar] [CrossRef]
- Martel, M.-C.; Margolis, H.A.; Coursolle, C.; Bigras, F.J.; Heinsch, F.A.; Running, S.W. Decreasing photosynthesis at different spatial scales during the late growing season on a boreal cutover. Tree Physiol. 2005, 25, 689–699. [Google Scholar] [CrossRef]
- Bauerle, W.L.; Oren, R.; Way, D.A.; Qian, S.S.; Stoy, P.C.; Thornton, P.E.; Bowden, J.D.; Hoffman, F.M.; Reynolds, R.F. Photoperiodic regulation of the seasonal pattern of photosynthetic capacity and the implications for carbon cycling. Proc. Natl. Acad. Sci. USA 2012, 109, 8612–8617. [Google Scholar] [CrossRef] [PubMed]
- Rayment, M.B.; Loustau, D.; Jarvis, P.G. Photosynthesis and respiration of black spruce at three organizational scales: Shoot, branch and canopy. Tree Physiol. 2002, 22, 219–229. [Google Scholar] [CrossRef]
- Mueller-Dombois, D.; Ellenberg, H. Aims and Methods of Vegetation Ecology; John Wiley & Sons: New York, NY, USA, 1974; p. 547. [Google Scholar]
- Stinziano, J.R.; Morgan, P.B.; Lynch, D.J.; Saathoff, A.J.; McDermitt, D.K.; Hanson, D.T. The rapid A-Ci response: Photosynthesis in the phenomic era. Plant Cell Environ. 2017, 40, 1256–1262. [Google Scholar] [CrossRef] [PubMed]
- Dang, Q.-L.; Cheng, S. Effects of soil temperature on ecophysiological traits in seedlings of four boreal tree species. For. Ecol. Manag. 2004, 194, 379–387. [Google Scholar] [CrossRef]
- Bigras, F.; Bertrand, A. Responses of Picea mariana to elevated CO2 concentration during growth, cold hardening and dehardening: Phenology, cold tolerance, photosynthesis and growth. Tree Physiol. 2006, 26, 875–888. [Google Scholar] [CrossRef]
- Hébert, F.; Thiffault, N.; Munson, A.D. Field Photosynthesis Measurements on Black Spruce (Picea mariana): Does Needle Age Matter? Commun. Soil Sci. Plant Anal. 2011, 42, 2738–2750. [Google Scholar] [CrossRef]
- Islam, M.A.; Macdonald, S.E. Effects of variable nitrogen fertilization on growth, gas exchange, and biomass partitioning in black spruce and tamarack seedlings. Botany 2005, 83, 1574–1580. [Google Scholar] [CrossRef]
- Lichtenthaler, H.K.; Rinderle, U. The role of chlorophyll fluorescence in the detection of stress conditions in plants. Crit. Rev. Anal. Chem. 1988, 19, S29–S85. [Google Scholar] [CrossRef]
- DeLucia, E.H.; Smith, W.K. Air and soil temperature limitations on photosynthesis in Engelmann spruce during summer. Can. J. For. Res. 1987, 17, 527–533. [Google Scholar] [CrossRef]
- Damesin, C. Respiration and photosynthesis characteristics of current-year stems of Fagus sylvatica: From the seasonal pattern to an annual balance. New Phytol. 2003, 158, 465–475. [Google Scholar] [CrossRef]
- Räim, O.; Kaurilind, E.; Hallik, L.; Merilo, E. Why does needle photosynthesis decline with tree height in Norway spruce? Plant Biol. 2012, 14, 306–314. [Google Scholar] [CrossRef]
- Way, D.A.; Sage, R.F. Elevated growth temperatures reduce the carbon gain of black spruce [Picea mariana (Mill.) BSP]. Glob. Chang. Biol. 2008, 14, 624–636. [Google Scholar] [CrossRef]
- Gaumont-Guay, D.; Margolis, H.; Bigras, F.; Raulier, F. Characterizing the frost sensitivity of black spruce photosynthesis during cold acclimation. Tree Physiol. 2003, 23, 301–311. [Google Scholar] [CrossRef] [PubMed][Green Version]
- Dumais, D.; Coursolle, C.; Bigras, F.J.; Margolis, H.A. Simulated root freezing in the nursery: Effects on the growth and physiology of containerized boreal conifer seedlings after outplanting. Can. J. For. Res. 2002, 32, 605–615. [Google Scholar] [CrossRef]
- Coursolle, C.; Otis Prud’Homme, G.; Lamothe, M.; Isabel, N. Measuring Rapid A-Ci Curves in Boreal Conifers: Black Spruce and Balsam fir. Front. Plant. Sci. 2019, 10, 1276. [Google Scholar] [CrossRef]
- Hebert, F.; Boucher, J.; Bernier, P.; Lord, D. Growth response and water relations of 3-year-old planted black spruce and jack pine seedlings in site prepared lichen woodlands. For. Ecol. Manag. 2006, 223, 226–236. [Google Scholar] [CrossRef]
- Paquin, R.; Margolis, H.A.; Doucet, R.; Coyea, M.R. Physiological responses of black spruce layers and planted seedlings to nutrient addition. Tree Physiol. 2000, 20, 229–237. [Google Scholar] [CrossRef]
- Duursma, R.A. Plantecophys-an R package for analysing and modelling leaf gas exchange data. PLoS ONE 2015, 10, e0143346. [Google Scholar] [CrossRef]
- Ripullone, F.; Grassi, G.; Lauteri, M.; Borghetti, M. Photosynthesis–nitrogen relationships: Interpretation of different patterns between Pseudotsuga menziesii and Populus euroamericana in a mini-stand experiment. Tree Physiol. 2003, 23, 137–144. [Google Scholar] [CrossRef] [PubMed]
- Hsu, H.; Lachenbruch, P.A. Paired t test. Encycl. Biostat. 2005, 6, 1–3. [Google Scholar]
- Shaw, R.G.; Mitchell-Olds, T. ANOVA for unbalanced data: An overview. Ecology 1993, 74, 1638–1645. [Google Scholar] [CrossRef]
- Abdi, H.; Williams, L.J. Newman-Keuls test and Tukey test. In Encyclopedia of Research Design; Sage: Thousand Oaks, CA, USA, 2010; pp. 1–11. [Google Scholar]
- Way, D.A.; Sage, R.F. Thermal acclimation of photosynthesis in black spruce [Picea mariana (Mill.) B.S.P.]. Plant Cell Environ. 2008, 31, 1250–1262. [Google Scholar] [CrossRef]
- Tremblay, P.; Boucher, J.-F.; Tremblay, M.; Lord, D. Afforestation of boreal open woodlands: Early performance and ecophysiology of planted black spruce seedlings. Forests 2013, 4, 433–454. [Google Scholar] [CrossRef]
- Walker, A.P.; Beckerman, A.P.; Gu, L.; Kattge, J.; Cernusak, L.A.; Domingues, T.F.; Scales, J.C.; Wohlfahrt, G.; Wullschleger, S.D.; Woodward, F.I. The relationship of leaf photosynthetic traits—Vcmax and Jmax—to leaf nitrogen, leaf phosphorus, and specific leaf area: A meta-analysis and modeling study. Ecol. Evol. 2014, 4, 3218–3235. [Google Scholar] [CrossRef]
- Maire, V.; Martre, P.; Kattge, J.; Gastal, F.; Esser, G.; Fontaine, S.; Soussana, J.F. The coordination of leaf photosynthesis links C and N fluxes in C3 plant species. PLoS ONE 2012, 7, e38345. [Google Scholar] [CrossRef]
- Sharkey, T.D.; Bernacchi, C.J.; Farquhar, G.D.; Singsaas, E.L. Fitting photosynthetic carbon dioxide response curves for C3 leaves. Plant Cell Environ. 2007, 30, 1035–1040. [Google Scholar] [CrossRef]
- Quebbeman, J.; Ramirez, J. Optimal allocation of leaf-level nitrogen: Implications for covariation of Vcmax and Jmax and photosynthetic downregulation. J. Geophys. Res. Biogeosci. 2016, 121, 2464–2475. [Google Scholar] [CrossRef]
- Walker, X.J.; Baltzer, J.L.; Cumming, S.G.; Day, N.J.; Johnstone, J.F.; Rogers, B.M.; Solvik, K.; Turetsky, M.R.; Mack, M.C. Soil organic layer combustion in boreal black spruce and jack pine stands of the Northwest Territories, Canada. Int. J. Wildland Fire 2018, 27, 125–134. [Google Scholar] [CrossRef]
- Damman, A. Effect of vegetation changes on the fertility of a Newfoundland forest site. Ecol. Monogr. 1971, 41, 253–270. [Google Scholar] [CrossRef]
- Haughian, S.R.; Burton, P.J. Microhabitat associations of lichens, feathermosses, and vascular plants in a caribou winter range, and their implications for understory development. Botany 2015, 93, 221–231. [Google Scholar] [CrossRef]
- Van Cleve, K.; Oechel, W.C.; Hom, J.L. Response of black spruce (Picea mariana) ecosystems to soil temperature modification in interior Alaska. Can. J. For. Res. 1990, 20, 1530–1535. [Google Scholar] [CrossRef]
- Elser, J.J.; Bracken, M.E.; Cleland, E.E.; Gruner, D.S.; Harpole, W.S.; Hillebrand, H.; Ngai, J.T.; Seabloom, E.W.; Shurin, J.B.; Smith, J.E. Global analysis of nitrogen and phosphorus limitation of primary producers in freshwater, marine and terrestrial ecosystems. Ecol. Lett. 2007, 10, 1135–1142. [Google Scholar] [CrossRef]
- Hébert, F.; Boucher, J.-F.; Walsh, D.; Tremblay, P.; Côté, D.; Lord, D. Black spruce growth and survival in boreal open woodlands 10 years following mechanical site preparation and planting. Forestry 2014, 87, 277–286. [Google Scholar] [CrossRef]
- Pacé, M.; Fenton, N.J.; Paré, D.; Stefani, F.O.; Massicotte, H.B.; Tackaberry, L.E.; Bergeron, Y. Lichens contribute to open woodland stability in the boreal forest through detrimental effects on pine growth and root ectomycorrhizal development. Ecosystems 2019, 22, 189–201. [Google Scholar] [CrossRef]
- Wardle, D.A.; Bardgett, R.D.; Klironomos, J.N.; Setälä, H.; Van Der Putten, W.H.; Wall, D.H. Ecological linkages between aboveground and belowground biota. Science 2004, 304, 1629–1633. [Google Scholar] [CrossRef]
- Bongi, C.; Loreto, F. Gas-exchange properties of saltstressed olive (Olea europaea L.) leaves. Plant Physiol. 1989, 90, 1408–1416. [Google Scholar] [CrossRef]
- Delfine, S.; Loreto, F.; Alvino, A. Drought-stress effects on physiology, growth and biomass production of rainfed and irrigated bell pepper plants in the Mediterranean region. J. Am. Soc. Horti. Sci. 2001, 126, 297–304. [Google Scholar] [CrossRef]
- Drake, J.E.; Power, S.A.; Duursma, R.A.; Medlyn, B.E.; Aspinwall, M.J.; Choat, B.; Creek, D.; Eamus, D.; Maier, C.; Pfautsch, S.; et al. Stomatal and non-stomatal limitations of photosynthesis for four tree species under drought: A comparison of model formulations. Agric. For. Meteorol. 2017, 247, 454–466. [Google Scholar] [CrossRef]
- Hébert, F.; Thiffault, N.; Ruel, J.-C.; Munson, A.D. Ericaceous shrubs affect black spruce physiology independently from inherent site fertility. For. Ecol. Manag. 2010, 260, 219–228. [Google Scholar] [CrossRef]
- Bergh, J.; Linder, S. Effects of soil warming during spring on photosynthetic recovery in boreal Norway spruce stands. Glob. Chang. Biol. 1999, 5, 245–253. [Google Scholar] [CrossRef]
- Yin, H.J.; Liu, Q.; Lai, T. Warming effects on growth and physiology in the seedlings of the two conifers Picea asperata and Abies faxoniana under two contrasting light conditions. Ecol. Res. 2008, 23, 459–469. [Google Scholar] [CrossRef]
- Suvorova, G.G.; Yankova, L.S.; Kopytova, L.D. Photosynthetic productivity of three coniferous species in Baikal Siberia, Eastern Russia. Eurasian J. For. Res. 2009, 12, 47–56. [Google Scholar]
- Farquhar, G.D.; Sharkey, T.D. Stomatal conductance and photosynthesis. Ann. Rev. Plant. Phys. 1982, 33, 317–345. [Google Scholar] [CrossRef]
- Winner, W.E.; Thomas, S.C.; Berry, J.A.; Bond, B.J.; Cooper, C.E.; Hinckley, T.M.; Ehleringer, J.R.; Fessenden, J.E.; Lamb, B.; McCarthy, S. Canopy carbon gain and water use: Analysis of old-growth conifers in the Pacific Northwest. Ecosystems 2004, 7, 482–497. [Google Scholar] [CrossRef]
- Greenway, K.J.; Macdonald, S.E.; Lieffers, V.J. Is long-lived foliage in Picea mariana an adaptation to nutrient-poor conditions? Oecologia 1992, 91, 184–191. [Google Scholar] [CrossRef]
- Long, S.P.; Bernacchi, C.J. Gas exchange measurements, what can they tell us about the underlying limitations to photosynthesis? Procedures and sources of error. J. Exp. Bot. 2003, 54, 2393–2401. [Google Scholar] [CrossRef]
- Ellis, R.J. Tackling unintelligent design. Nature 2010, 463, 164–165. [Google Scholar] [CrossRef]
- Kattge, J.; Knorr, W. Temperature acclimation in a biochemical model of photosynthesis: A reanalysis of data from 36 species. Plant Cell Environ. 2007, 30, 1176–1190. [Google Scholar] [CrossRef]
- Yamori, W.; Noguchi, K.; Hikosaka, K.; Terashima, I. Phenotypic plasticity in photosynthetic temperature acclimation among crop species with different cold tolerances. Plant Physiol. 2010, 152, 388–399. [Google Scholar] [CrossRef] [PubMed]
- Girard, F.; Vennetier, M.; Guibal, F.; Corona, C.; Ouarmim, S.; Herrero, A. Pinus halepensis Mill. crown development and fruiting declined with repeated drought in Mediterranean France. Eur. J. For. Res. 2011, 131, 919–931. [Google Scholar] [CrossRef]
- Garcia-Forner, N.; Sala, A.; Biel, C.; Savé, R.; Martínez-Vilalta, J. Individual traits as determinants of time to death under extreme drought in Pinus sylvestris L. Tree Physiol. 2016, 36, 1196–1209. [Google Scholar] [CrossRef] [PubMed]
- Huang, J.; Tardif, J.C.; Bergeron, Y.; Denneler, B.; Berninger, F.; Girardin, M.P. Radial growth response of four dominant boreal tree species to climate along a latitudinal gradient in the eastern Canadian boreal forest. Glob. Chang. Biol. 2010, 16, 711–731. [Google Scholar] [CrossRef]
- Benomar, L.; Lamhamedi, M.S.; Pepin, S.; Rainville, A.; Lambert, M.-C.; Margolis, H.A.; Bousquet, J.; Beaulieu, J. Thermal acclimation of photosynthesis and respiration of southern and northern white spruce seed sources tested along a regional climatic gradient indicates limited potential to cope with temperature warming. Ann. Bot. 2018, 121, 443–457. [Google Scholar] [CrossRef]
- Jach, M.; Ceulemans, R. Effects of season, needle age and elevated atmospheric CO2 on photosynthesis in Scots pine (Pinus sylvestris). Tree Physiol. 2000, 20, 145–157. [Google Scholar] [CrossRef]
- Lamhamedi, M.S.; Bernier, P.Y. Ecophysiology and field performance of black spruce (Picea mariana): A review. Ann. For. Sci. 1994, 51, 529–551. [Google Scholar] [CrossRef]
- Urban, O. Physiological impacts of elevated CO2 concentration ranging from molecular to whole plant responses. Photosynthetica 2003, 41, 9–20. [Google Scholar] [CrossRef]
- Tjoelker, M.; Oleksyn, J.; Reich, P.B. Seedlings of five boreal tree species differ in acclimation of net photosynthesis to elevated CO2 and temperature. Tree Physiol. 1998, 18, 715–726. [Google Scholar] [CrossRef]


| Measurements | [CO2] | RH | PPFD | Tneedle | Fan | Flow |
|---|---|---|---|---|---|---|
| (ppm) | (%) | (µmol m−2 s−1) | (°C) | (rpm) | (µmol mol−1) | |
| Amax | Ambient 405 | 50 | Ambient and saturating 1700 | Ambient Uncontrolled | 10,000 | 500 |
| RACiR | Variable 0–1500 | 50 | Saturating 2000 | 30 | 10,000 | 500 |
| Factors | Vcmax | Jmax | ||
|---|---|---|---|---|
| χ2 | p-Value | χ2 | p-Value | |
| Type of stand | 6.45 | 0.011 | 7.85 | 0.005 |
| Latitude | 8.26 | 0.016 | 7.31 | 0.026 |
| Type: Latitude | 7.04 | 0.030 | 4.43 | 0.109 |
| Factors | Amax | gs | Tambient | |||
|---|---|---|---|---|---|---|
| χ2 | p-Value | χ2 | p-Value | χ2 | p-Value | |
| Type of stand | 0.64 | 0.424 | 1.82 | 0.178 | 0.53 | 0.465 |
| Latitude | 0.91 | 0.634 | 0.79 | 0.675 | 0.09 | 0.958 |
| Growth season | 347.87 | <0.001 | 42.13 | <0.001 | 2114.40 | <0.001 |
| Type: Latitude | 5.07 | 0.079 | 0.01 | 0.998 | 0.20 | 0.904 |
| Type: Season | 1.25 | 0.535 | 3.90 | 0.142 | 18.41 | <0.001 |
| Latitude: Season | 14.56 | 0.006 | 4.75 | 0.313 | 122.17 | <0.001 |
| Type: Latitude: Season | 2.60 | 0.626 | 1.03 | 0.905 | 7.64 | 0.106 |
Publisher’s Note: MDPI stays neutral with regard to jurisdictional claims in published maps and institutional affiliations. |
© 2022 by the authors. Licensee MDPI, Basel, Switzerland. This article is an open access article distributed under the terms and conditions of the Creative Commons Attribution (CC BY) license (https://creativecommons.org/licenses/by/4.0/).
Share and Cite
Dally-Bélanger, C.; Girard, F. Comparative Ecophysiology of Black Spruce between Lichen Woodlands and Feathermoss Stands in Eastern Canada. Forests 2022, 13, 491. https://doi.org/10.3390/f13040491
Dally-Bélanger C, Girard F. Comparative Ecophysiology of Black Spruce between Lichen Woodlands and Feathermoss Stands in Eastern Canada. Forests. 2022; 13(4):491. https://doi.org/10.3390/f13040491
Chicago/Turabian StyleDally-Bélanger, Catherine, and Francois Girard. 2022. "Comparative Ecophysiology of Black Spruce between Lichen Woodlands and Feathermoss Stands in Eastern Canada" Forests 13, no. 4: 491. https://doi.org/10.3390/f13040491
APA StyleDally-Bélanger, C., & Girard, F. (2022). Comparative Ecophysiology of Black Spruce between Lichen Woodlands and Feathermoss Stands in Eastern Canada. Forests, 13(4), 491. https://doi.org/10.3390/f13040491