Abstract
Climate change has a significant impact on species population size and distribution, global biodiversity, and ecological status. The Liriodendron genus contains two species: Liriodendron chinense and Liriodendron tulipifera, both playing important roles in timber, medicinal, and landscape purposes. However, little is known about their population distribution characteristics and important climatic factors shaping their suitability. In this research, we used the geological record data, 19 climate components, MaxEnt, and ArcGIS to recreate and analyze the potential population distribution and their alterations of Liriodendron within the world beneath the current and future scenarios of RCP 2.6, RCP 4.5, and RCP 8.5 in 2050 and 2070. Our results showed that: Liriodendron is suitable to grow in subtropical monsoon climate areas, and that the climatic factor of precipitation of warmest quarter exerts the greatest impact on L. chinense, with a contribution rate of 57.6%. Additionally, we showed that the climatic factor of precipitation of the driest month exerts the greatest impact on L. tulipifera, with a contribution rate of 60.5%. Further analysis exhibited that low temperature and temperature fluctuations are major temperature factors affecting L. chinense and L. tulipifera, respectively. Therefore, we predicted that by the 2050s and 2070s, the areas of Liriodendron suitable habitats would increase first and then decrease in three scenarios; except the area of L. tulipifera suitable habitats under RCP8.5, which shows a slight increase. We then conclude that the Liriodendron suitable areas would shift to high latitudes due to global climate warming. The information gained from this study will provide a reference for developing forest cultivation, management, and conservation strategies for these two important tree species, and also a basis for subsequent biogeographic research.
1. Introduction
The geographical distribution of species is a spatial feature influenced by the environment and human activities. Climate change is the main environmental factor affecting species population distribution, geographical distribution, biodiversity of species, composition, richness, and the structure and function of ecosystems [1,2,3]. Consequently, it is of inordinate significance to analyze the potential geographical distribution of species under changed climatic conditions for biodiversity conservation, ecological restoration, and sustainable ecosystem maintenance.
According to past reports, the climate is changing definitely and the worldwide temperature is expanding year by year [4,5], resulting in constant temperature fluctuations, and extreme precipitation and temperatures ranges [6]. The annual global temperature is expected to continuously increase, exhibiting an unimaginable impact on the biodiversity and ecosystem of the earth [4,5], global warming can promote the migration of plants to regions with high altitudes and latitudes [7,8]. It is found that climate change has caused some European forest tree species to face severe habitat shrinkage [9]. Zhang et al. [10] predicted the geographical distribution of 2319 woody plants in Yunnan, China, and found that the maximum extinction rate was about 6% under the most extreme climate change scenario. They further estimated that about 1400 species would lose more than 30% of their current range under the most extreme climate change scenario [10]. On the contrary, changes in species population distribution would also affect climate change of the whole area due to that surface vegetation strongly affects atmospheric characteristics [11]. In the consideration of global warming, the climate has become a decisive factor affecting species distribution. Predicting the spatial change and migration trend of the suitable distribution areas of endangered species threatened by climate has become one of the latest research hotspots in conservation biology and forest ecology [12,13].
Liriodendron is a relic plant of the Tertiary period. Due to the influence of climate change in the late Tertiary and Quaternary glacial period, there are only two natural species in the genus Liriodendron, Liriodendron chinense (Hemsl.) Sarg. in East Asia and Liriodendron tulipifera Linn. in North America [14]. Liriodendron is a tall deciduous forest tree, one of the main street trees with important and ornamental purposes [15], medicinal purposes [16,17], and a high-quality timber tree [17]. The Liriodendron plants have important scientific value and status in population genetics, paleogeography, paleoclimate, and evolution, and also have great economic and ecological value. However, the population of Liriodendron has decreased sharply due to its reproductive characteristics and extremely low natural seed reproduction rate, and changes in climate and environment. In particular, L. chinense is in the near-endangered state in the Red List of Endangered Species of the World Conservation Union [18]. Therefore, it is necessary to study the spatial range of suitable areas of Liriodendron under climate change and to understand the ecological requirements of Liriodendron under current and future climate scenarios. Qiu et al. [19] found that the distribution area of L. chinense in China within a year period first exhibits a constantly increasing trend in 2050 followed by a decreasing trend proportional to time increase. However, Zhai et al. [20] showed a significant increase in L. chinense distribution area under medium concentration greenhouse gas emissions conditions, which was significantly reduced under high concentration greenhouse gas emissions conditions during the period 2061–2080.
To gain population distribution characteristics of genus Liriodendron and the climate factors affecting their habitat suitability, the MaxEnt model and the geographical distribution data of Liriodendron were used in this research. The suitable areas of L. chinense and L. tulipifera under modern climatic conditions were evaluated globally based on the occurrence records of these two species. Three carbon emission scenarios were used to identify the most important climatic factors affecting the distribution of suitable areas, and to predict the potential suitable distribution and the shift in the distribution of suitable habitat of these two species in 2050 and 2070. This study will help to understand the biogeography of Liriodendron and formulate protection strategies to reduce the potential impact of climate change.
2. Materials and Methods
2.1. Collection and Processing of Species Distribution Data
Global-level geographic information data of L. chinense and L. tulipifera were collected from the National Specimen Information Infrastructure (http://www.nsii.org.cn/, accessed on 18 May 2021) and the Global Biodiversity Information Facility (http://www.gbif.org/, accessed on 10 August 2021). Recent specimen data (1960–2020) were elected to screen out the duplicate coordinates. Only one point was kept in the 10 km×10 km grid, fuzzy records and artificial cultivation records were screened out. A total of 144 records of L. tulipifera specimens and 116 records of L. chinense specimens were obtained, which were processed by EXCEL for the subsequent construction of the MaxEnt model, into a CSV format file containing only three columns of information (name, longitude, and latitude).
2.2. Collection and Processing of Climate Factor Data
Nineteen climate factors were obtained from the World Climate Data (http://www.worldclim.org/, accessed on 10 May 2021), and the description of each environmental variable is shown in Table 1. The model CCSM4 developed by National Center for Atmospheric Research (NCAR) was adopted for future climate data [21]. RCP2.6, RCP4.5, and RCP8.5 progressively represent future climate assumptions about different carbon emission scenarios [14]. There are six climate scenario combinations in total: RCP 2.6-2050, RCP 2.6-2070, RCP 4.5-2050, RCP 4.5-2070, RCP 8.5-2050, and RCP 8.5-2070. The spatial resolution of all climate data was 2.5 min. In ArcGIS10.6, all climate factors were converted to ASCII format.

Table 1.
Percentage contributions of the bioclimatic variables included in the Maxent models for Liriodendron.
2.3. Construction of Model and Evaluations of Suitable Habitat Distribution
All environmental variables and coordinate files of L. chinense and L. tulipifera were imported in MaxEnt v3.4.1. For each species, 25% distribution data were used as a test set to verify the accuracy, and 75% distribution data were used as a training set to drive the model. The operation was repeated 10 times, ‘logistic’ was selected as the output value, and the output was in the form of probability for easy description. Selected ‘create response curve’ to draw the curve of how climate factors determine the predicted occurrence probability and selected ‘do jackknife’ to output the contribution rate of each climate factor. Other parameters were set by default, and files were output in ASCII type. The world map from Natural Earth (https://www.naturalearthdata.com/, accessed on 10 May 2021) was used as the base map. The calculation results from MaxEnt were loaded into ArcGIS v10.6, and the classification and visualization of fitness grades were carried out to obtain the potential distribution map of species. The changes in the potential distribution area and suitable habitat distribution center of L. chinense and L. tulipifera in the future scenarios were mainly counted by the SDM toolbox in ArcGIS10.6. This toolkit is based on the Python language [22]. The statistics of the area showed three types of changing areas: expanding, unchanged, and shrinking. According to the statistics of suitable habitat distribution centers, the distribution range was reduced to a single center point, which is called centroid, and a vector file was created to calculate the position and direction of the centroid change of suitable habitats in different periods. By tracking the core distributional shifts of Liriodendron in different subsequent scenes, the spatial pattern change of its geographical distribution was analyzed.
3. Results
3.1. Accuracy Test of MaxEnt Model
The receiver operating characteristic (ROC) curve was used to evaluate the prediction accuracy of the MaxEnt model. Each value of the predicted result was taken as a possible judging threshold, the corresponding sensitivity (1-specificity) and specificity (1-omission rate) were calculated. Then a curve was drawn with these two as horizontal and vertical coordinates. The value of the area under the curve (AUC) is determined by the area enclosed by the curve and the horizontal coordinate. Average AUC values of 0.993 and 0.990 were obtained in 10 training sets of L. chinense and that of L. tulipifera, respectively, which showed a very high prediction accuracy [23,24]. The group with the largest value was selected for analysis from the 10 operation results. The largest set of training in L. chinense sets was 0.994, followed by the test sets with 0.992, and the largest set of training sets in L. tulipifera was 0.991 and test sets had 0.992 (Figure S1). Therefore, the geographical distribution areas of L. chinense and L. tulipifera were predicted with high accuracy and the model was reliable when based on the MaxEnt model.
3.2. Influence of Different Climatic Factors
Due to a large number of variables, some had similar attributes and high statistical correlation. To avoid data redundancy, correlation analysis among climate factors was performed (Table S1), and the dominant climate factors were selected from the results obtained by Jackknife [25]. If the absolute value of correlation was ≥0.8 among the climate factors with similar attributes, the one with the highest contribution rate was selected to determine the dominant climate factor (Table 1).
Among the 19 climatic factors, precipitation of warmest quarter (Bio18) was the foremost imperative climatic factor influencing the dispersion of reasonable ranges of L. chinense, and its commitment rate to MaxEnt was 57.6%. Temperature seasonality (Bio4) made a contribution rate of 23.2%. The entire commitment rate of these two factors summed to 80.8% and were fundamental components to reenact the appropriate ranges of L. chinense. The commitment rate of precipitation of wettest month (Bio13), mean temperature of coldest quarter (Bio11), and mean temperature of driest quarter (Bio9) summed to 11.1%, 0.6%, and 0.4%, respectively. These factors slightly influenced the development and generation of L. chinense. Precipitation of driest month (Bio14) was the most important climatic factor affecting the distribution of suitable areas of L. tulipifera, and its contribution rate to the MaxEnt model reached 60.5%. Secondly, the contribution rate of temperature seasonality (Bio4) was 13.9%. The cumulative contribution rate of these two variables reached 74.4%, and these were important for simulating the suitable areas of L. tulipifera. The contribution rate of precipitation seasonality (coefficient of variation) (Bio15) was 4.9%, temperature annual range (Bio7) contributed 2.7%, and min temperature of coldest month (Bio6) contributed 1.3%. These variables also had a certain influence on the growth and reproduction of L. tulipifera.
3.3. Suitable Habitat Areas of Liriodendron under Modern Climate
3.3.1. Suitable Habitat Areas of Liriodendron chinense
Under modern climate conditions, the suitable habitat areas of L. chinense were mainly distributed in the southeast of Asia at 20°~41° N and 72°~142° E, covering 11 countries in total (Figure 1, Figure S1, Table 2). The highly suitable habitats of L. chinense covered a total area of 2.51 × 10⁵ km2, of which China accounted for 2.50 × 10⁵ km2, which was mainly divided into two major areas: one was the eastern part of Sichuan Province, the southwest and central part of Chongqing, the other was the central to northern part of Jiangxi Province and the area at the junction of Jiangxi Province, Hubei Province, and Anhui Province. In addition, there were small island-like highly suitable habitats at the border of Hunan, southeastern Chongqing, and southwestern Hubei. Jiangsu, Shandong, Zhejiang, Guangxi also had scattered distribution. Compared to China, North Korea, South Korea, and Japan had extremely small highly suitable habitats, totaling about 1.81 × 10³ km2.
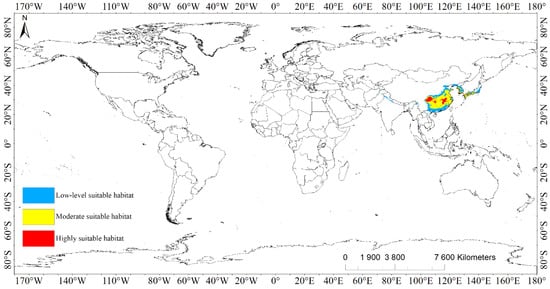
Figure 1.
Population distribution of Liriodendron chinense under current scenario.
Table 2.
Current distribution area of Liriodendron chinense.
The moderately suitable habitats of L. chinense covered a total area of 1.28 × 10⁶ km2, which were mainly distributed from the coastal areas of Shandong in the north of China to the northern areas of Guangdong and Guangxi in the south. Characterized by highly suitable habitats and a small number of low-level suitable habitats embedded inside. Northern and Southern Korea was shown to be banded with moderately suitable habitats with a total area of about 16.59 × 10⁴ km2 along the Yellow Sea coast and the southern coast of Japan.
The low-level suitable habitats of L. chinense expanded from the medium-level to two levels, with a huge span and a total coverage of approximately 9.75 × 10⁵ km2. It is worth specifying that the belt region along the Himalayas also had a long, contract, and low-level suitable habitat, which was the root and asylum of psychrophytes [26]. Additionally, the southern incline of the region was shown to be warm and muggy, and the evergreen broad-leaved timberland was predicted to thrive [27].
3.3.2. Suitable Habitat Areas of Liriodendron tulipifera
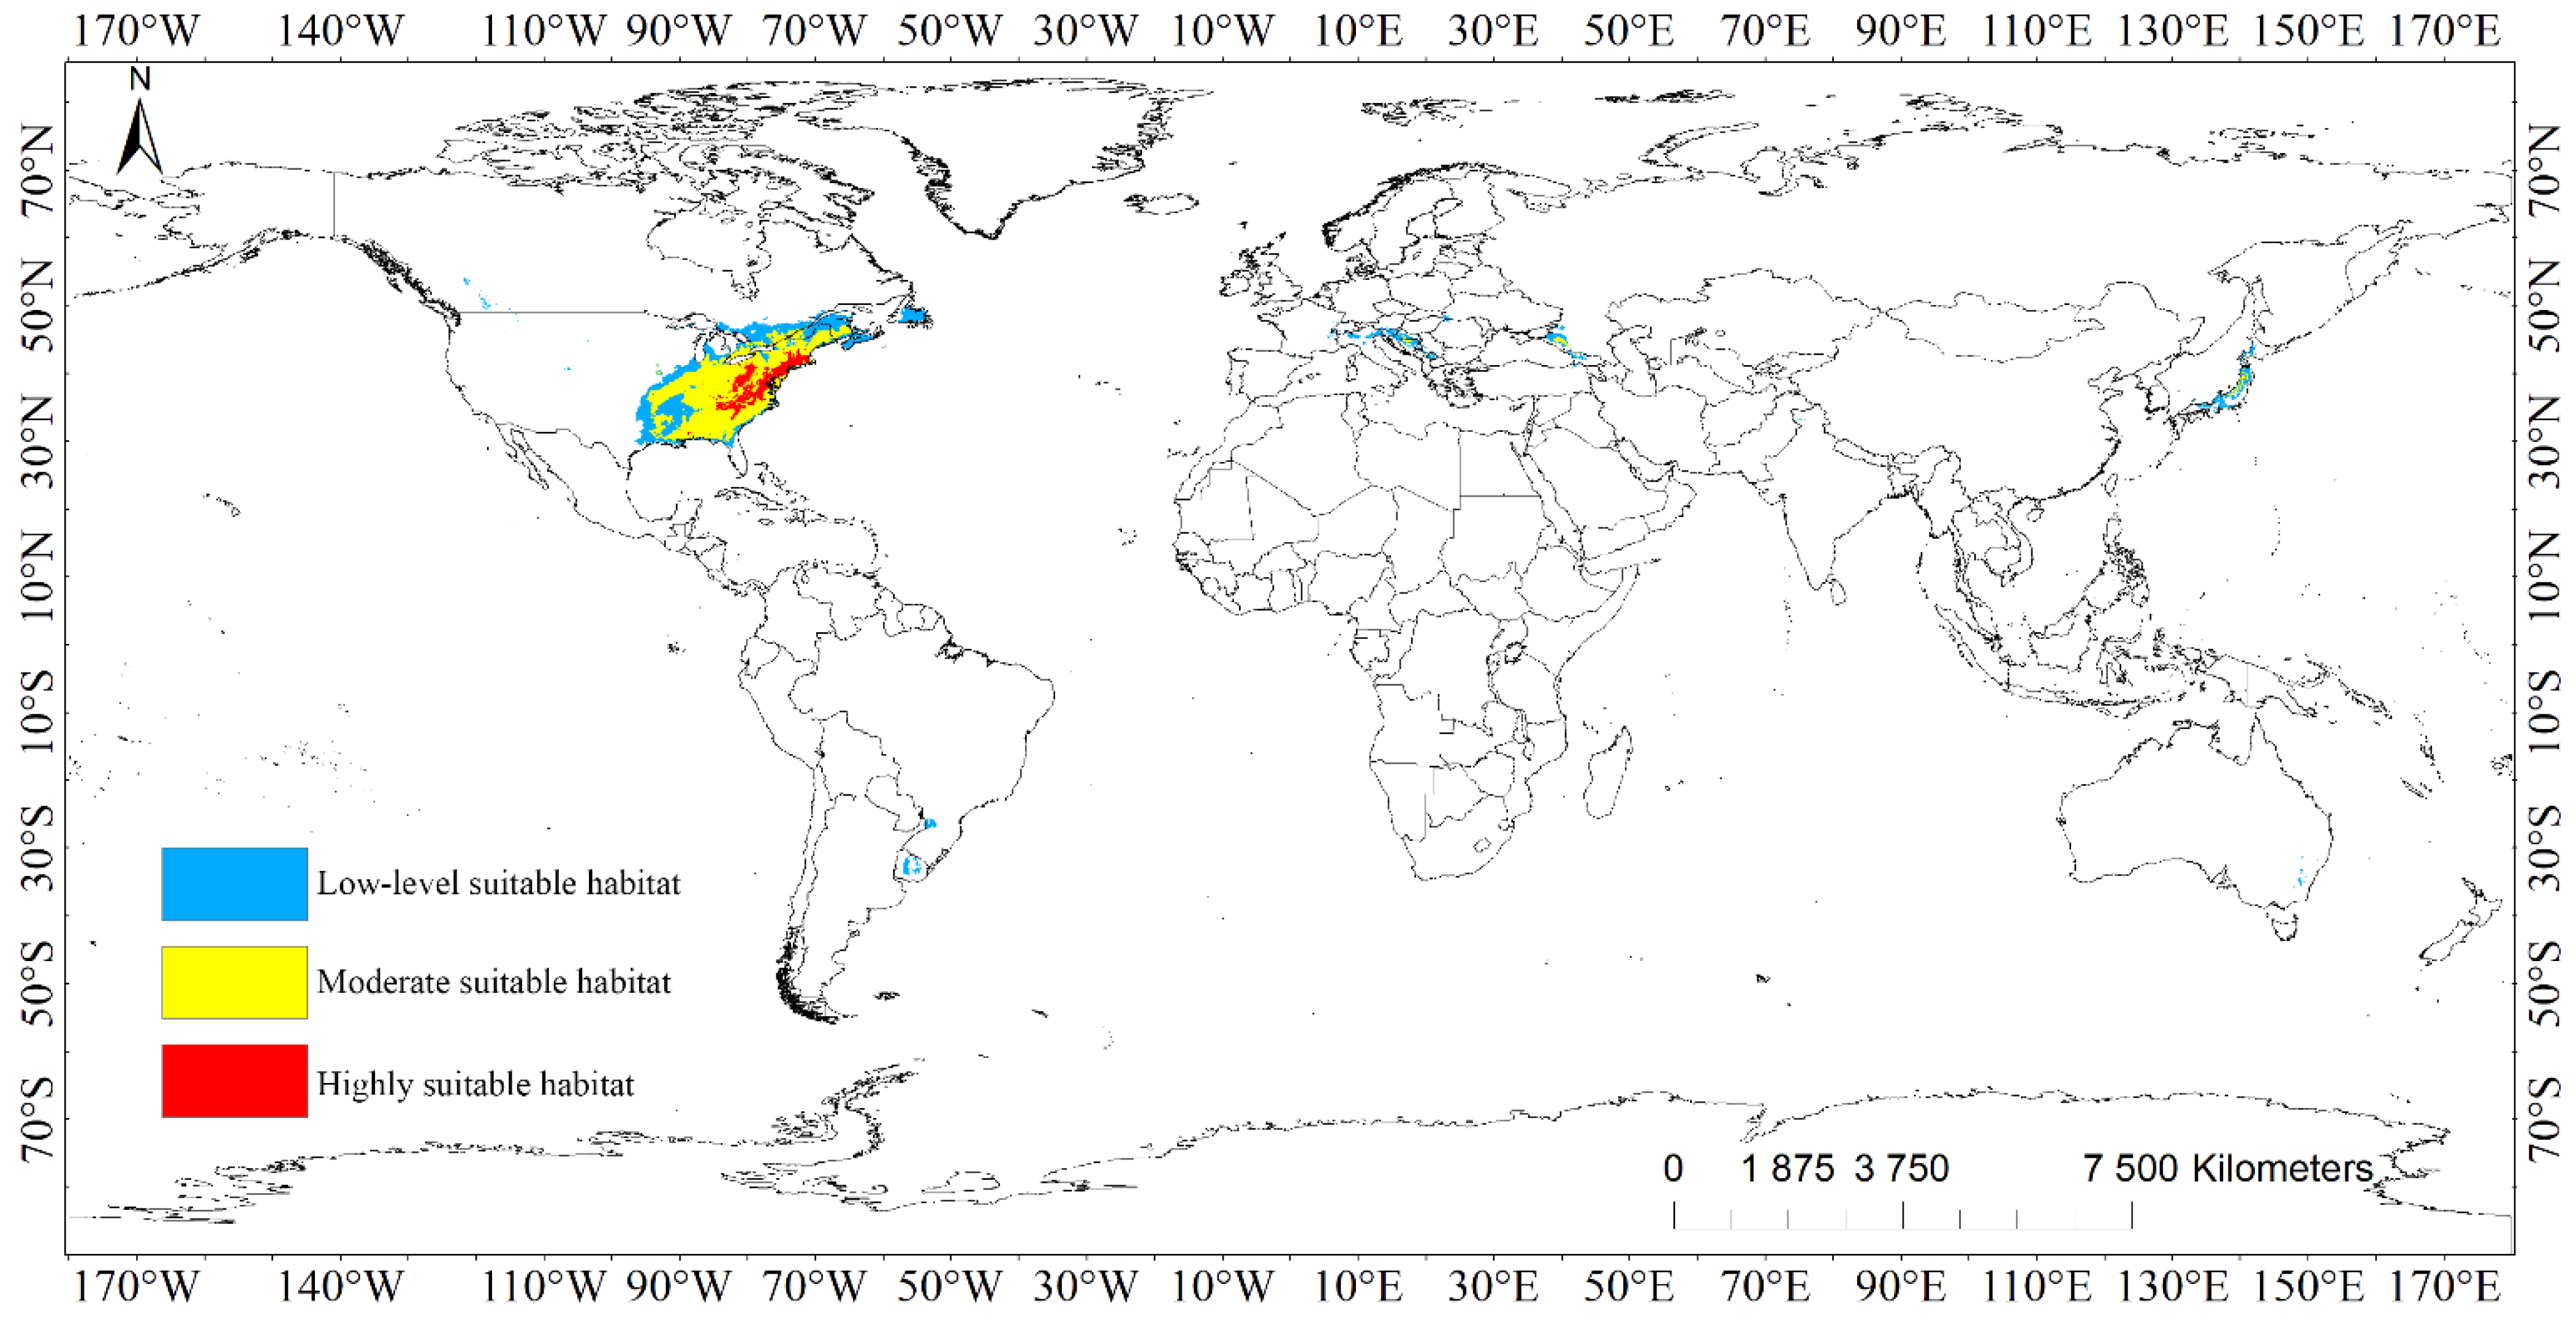
The suitable areas of L. tulipifera were distributed in a wide range, mainly concentrated in North America, especially in the eastern part of the United States (Figure 2, Figure S2, Table 3). The main distribution areas in North America were 29°~53° N and 53°~97° W, and the rest were distributed in patches or banded suitable areas in South America, Europe, Asia, and Oceania.
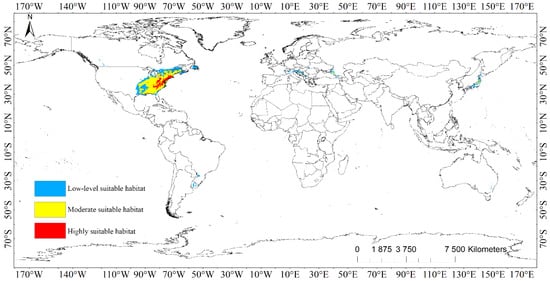
Figure 2.
Population distribution of Liriodendron tulipifera under current scenario.
Table 3.
Current distribution area of Liriodendron tulipifera.
The highly suitable habitats of L. tulipifera covered a total area of 3.35 × 10⁵ km2, which is mainly distributed in the eastern United States, covering Massachusetts, Connecticut, Rhode Island, New York, New Jersey, Pennsylvania, Ohio, Maryland, Delaware, West Virginia, Virginia, North Carolina, South Carolina, Kentucky, Tennessee, and Georgia. The spots or strips of moderately suitable habitats were embedded inside, but these areas were generally a whole patch area, except Alabama and Georgia. Except for the United States, only the southern part of Canada and the main island of Japan had a very small range of highly suitable habitats, totaling 4.17 × 10² km2.
The area of moderately suitable habitats of L. tulipifera was 1.67 × 10⁶ km2. It was mainly distributed in North America, including plots surrounding highly suitable habitats in the eastern part of the United States, and also distributed in Ontario, Quebec, and New Brunswick provinces, where Canada is adjacent to the United States. In Europe, moderately suitable spots were distributed in southwest Russia, Bosnia and Herzegovina, Croatia, Italy, Austria, Kosovo, Georgia, and Japan in Asia, with a total coverage of 4.90 × 10⁴ km2.
The low-level suitable habitats emanated from the moderately suitable habitats to the surrounding land, so they were primarily conveyed in North America. The southern portion of the United States encompassed the moderately suitable habitats and amplified to the southeast of Canada, whereas Newfoundland was nearly all low-level suitable habitat, and there were divided spots in British Columbia, Montana, Idaho, Colorado, and North Dakota. Brazil, Uruguay, and Argentina in South America, Spain, France, Germany, Switzerland, Italy, Slovenia, Austria, Croatia, Slovakia, Bosnia and Herzegovina, Kosovo, Romania, Ukraine, Hungary, the southwestern border of Russia in Europe, Georgia, Turkey, India, coastal regions of Zhejiang in China, Japan in Asia, and Australia in Oceania were all disseminated. The total area of low-level suitable habitats was 1.42 × 10⁶ km2.
3.4. Climatic Characteristics of Suitable Habitat Areas of Liriodendron
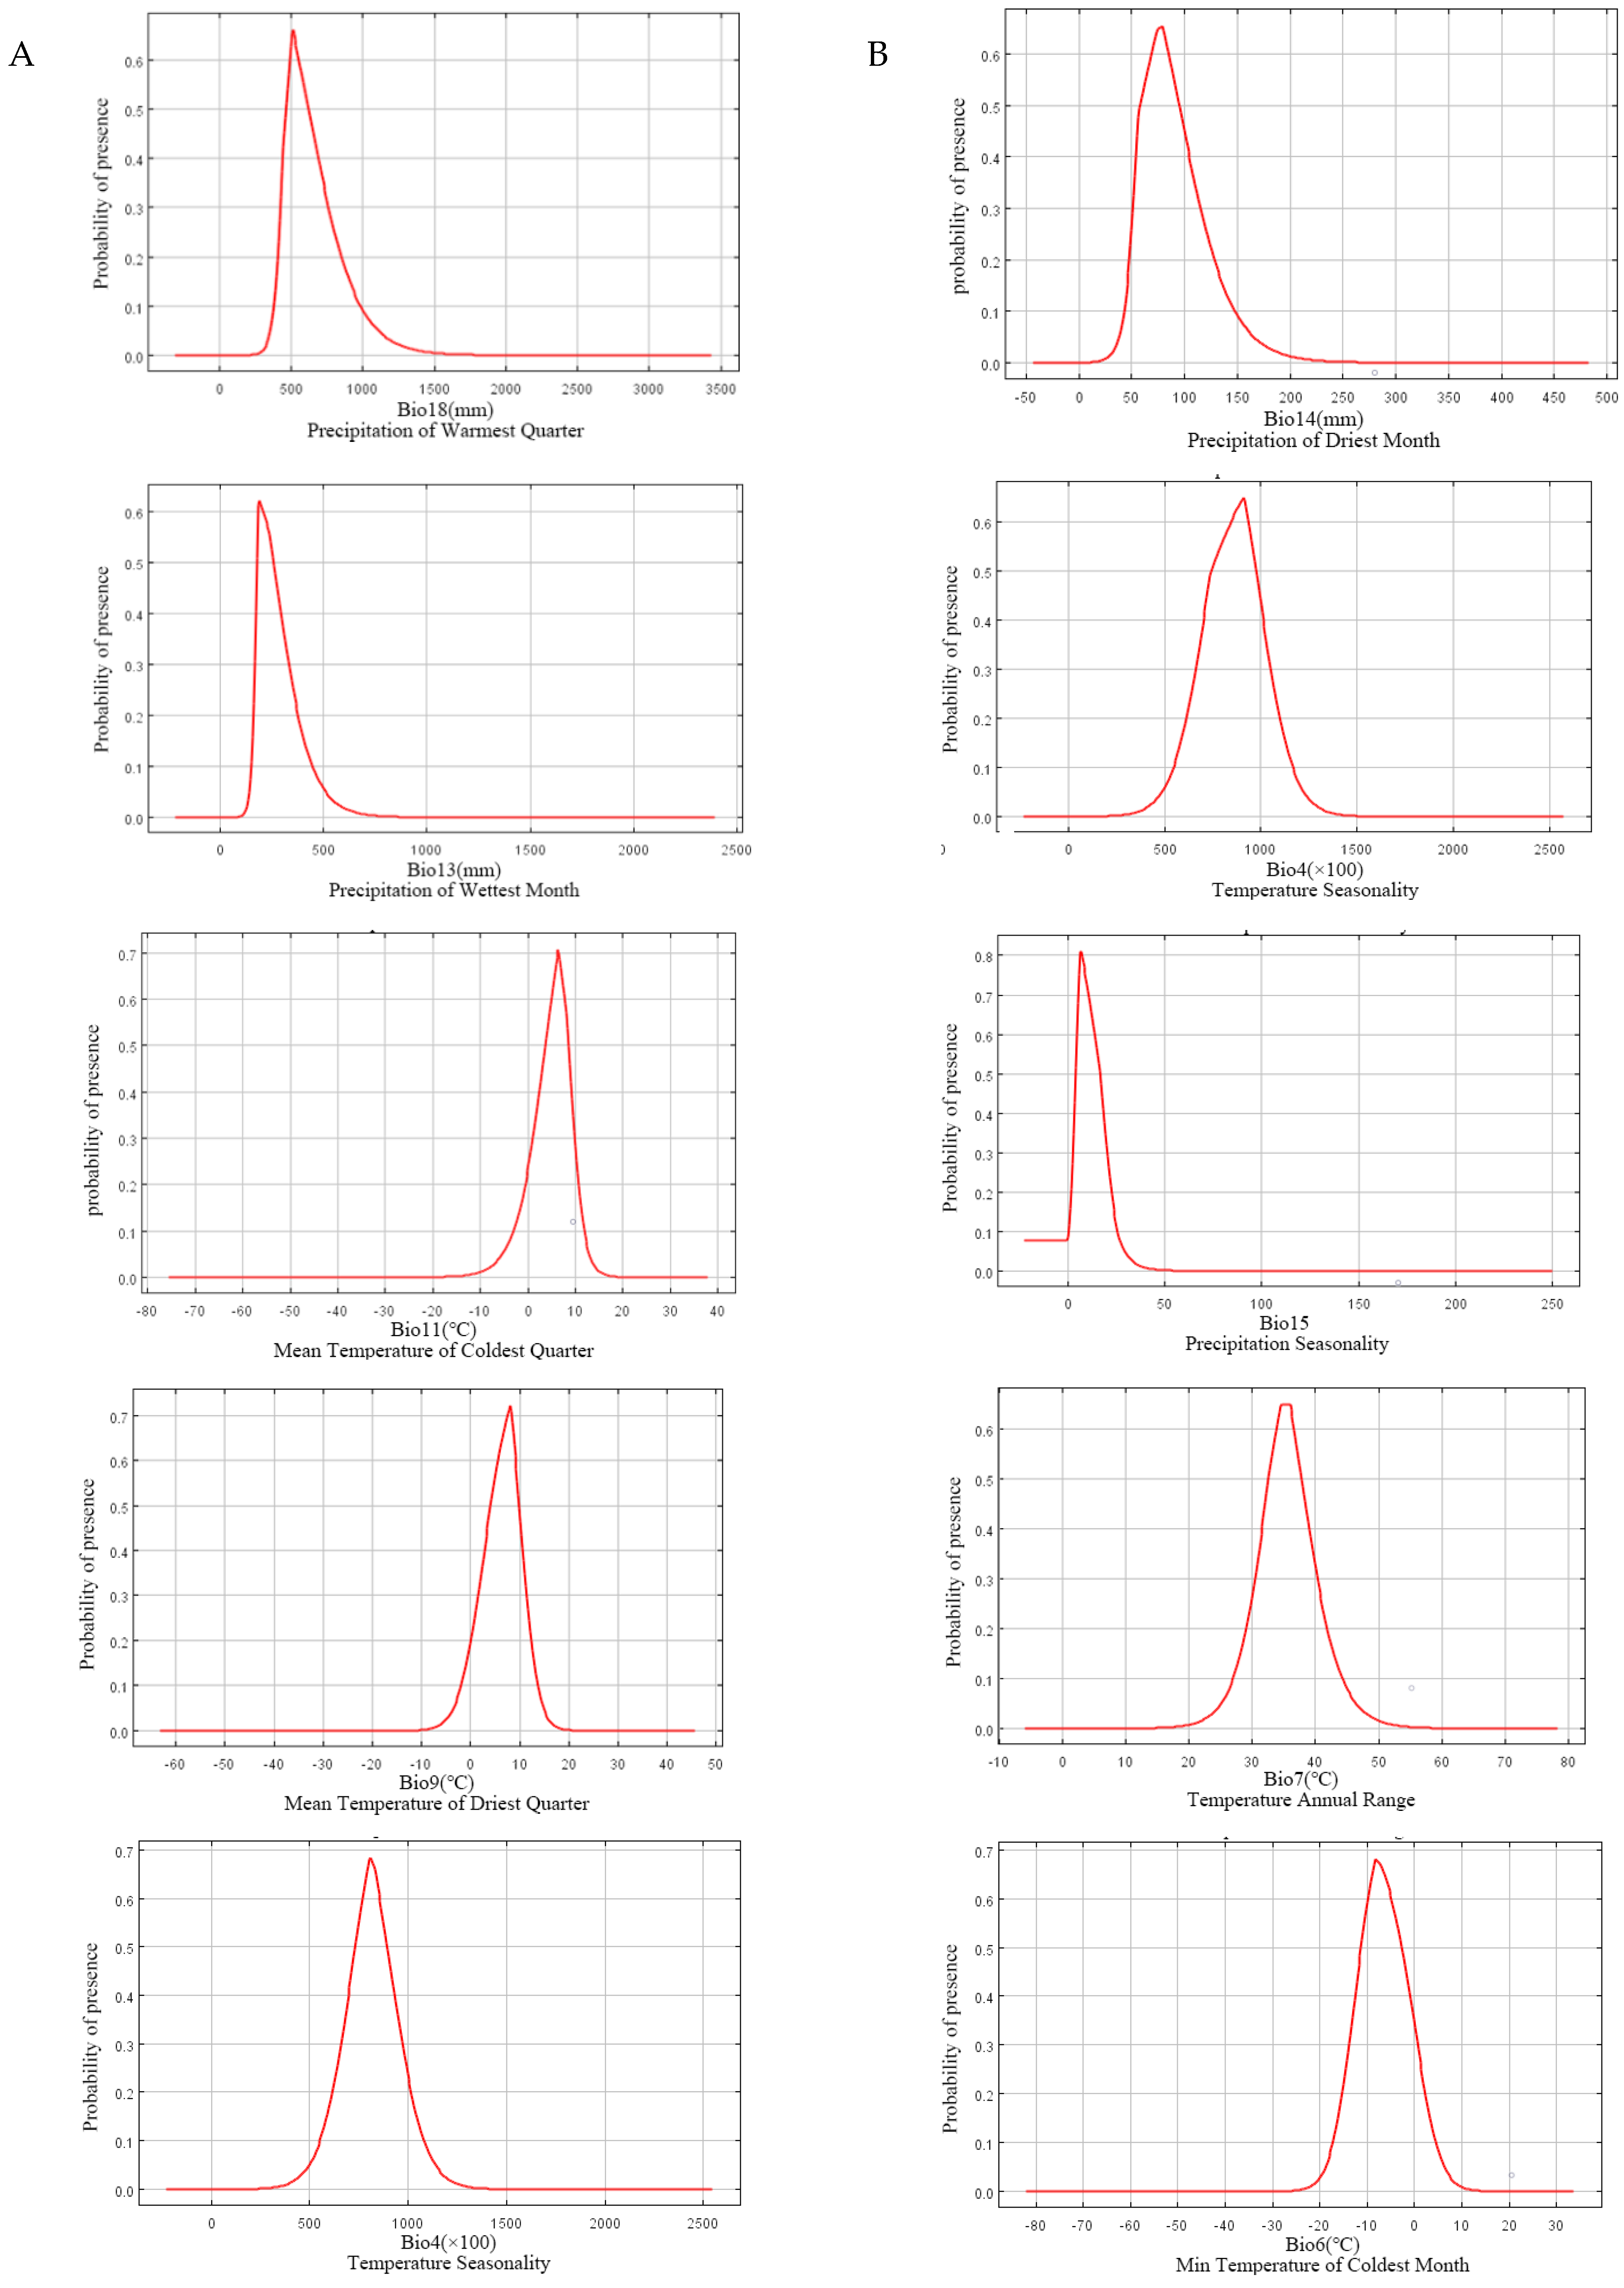
It could be seen from the five dominant climatic factors of L. chinense that precipitation was the most important factor affecting the distribution of L. chinense (Figure 3A), which indicated that the existence probability of L. chinense was very low when Bio18 (precipitation of warmest quarter) was less than 250 mm. With the increase in this precipitation, the existence rate rose greatly and reached the maximum value where the Bio18 was about 500 mm. When the Bio18 continued to increase, the existence rate dropped sharply. The trend of Bio13 (precipitation of wettest month) was consistent with that of the warmest quarter. When the Bio13 was less than 100 mm, the existence probability of L. chinense was very low. With the increase in Bio13, the existence rate rose sharply and reached the maximum value when the Bio13 was about 200 mm, and then decreased when the Bio13 was more than 200 mm. While the existence probability of L. chinense was very low, the Bio11 (mean temperature of the coldest quarter) was less than −15°C, and with this temperature rising, the existence probability rose rapidly, reaching the highest value at 6°C, and then dropped rapidly. The trends of Bio9 (mean temperature of the driest quarter) and Bio4 (temperature seasonality) were consistent with that of Bio11. When the Bio9 was less than −10°C, the existence probability was close to zero. When the Bio9 was about 8 °C, the existence probability was the highest, and when the Bio9 was more than 20 °C, the existence rate was close to zero again. The existence probability was very low when the Bio4 was less than 4 °C, the highest was reached when the Bio4 was about 8 °C, and then the existence probability decreased with the increase in Bio4.
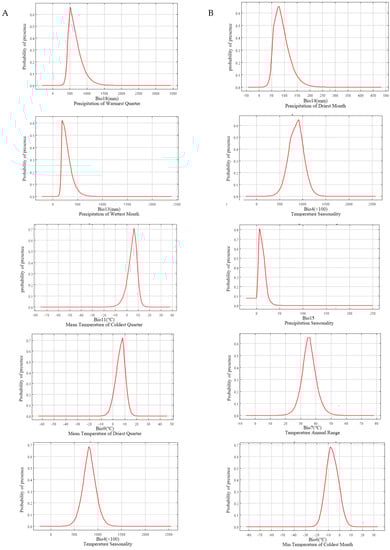
Figure 3.
Response curves for important environmental predictors in the species distribution model for Liriodendron chinense (A) and Liriodendron tulipifera (B).
According to the influence curves of five variable factors of L. tulipifera (Figure 3B), it could be concluded that the existence probability of L. tulipifera was extremely low when Bio14 (precipitation of driest month) was less than 25 mm, and it rose with the increase in Bio14, reaching the maximum at 75 mm, and then decreased with the increase in Bio14. The Bio4 curve of L. tulipifera was almost identical to that of L. chinense. The difference was that the increase in the L. tulipifera curve slightly decreased below 7 °C, and the temperature seasonality at the highest existence probability was 9 °C. Bio15 (precipitation seasonality) initiated at 0 °C, and with the increase in its value, the existence probability of L. tulipifera increased and reached its maximum when the coefficient was 8, and then decreased with the increase in the coefficient. The existence probability reached the highest when Bio7 (temperature annual range) was 4.5–6.5 °C. After that, with the increase in temperature annual range, the probability of existence decreased until the temperature annual range was more than 50 °C. When Bio6 (min temperature of the coldest month) was lower than −0 °C, the existence probability was close to zero, then it increased with this temperature rising, and reached its maximum at −9 °C. The existence probability gradually decreased with the increase in Bio6.
3.5. Changes of Suitable Habitat Area of Liriodendron under Future Scenarios
3.5.1. Suitable Habitat Area of L. chinense under Future Scenarios
It was predicted that the whole region of suitable zones of L. chinense would increase in the 2050s and further decrease within the 2070s under RCP2.6, RCP4.5, and RCP8.5 scenarios (Table 4).
Table 4.
Areas of potential distribution of Liriodendron chinense under different climate scenarios.
In the RCP2.6 scenario, all suitable areas of L. chinense were also forecasted to enlarge by 2.87 × 10⁵ km2 within the 2050s, extending the suitable areas of diverse grades. The most extended regions would include the north of China, northeast of Japan, and South Asia. In the 2070s, the total area was predicted to decrease by 3.08 × 10⁵ km2 as compared to the 2050s, as were the three suitable areas. The areas of low and moderately suitable habitats were expected to be smaller compared to the present ones. However, the highly suitable habitats would be slightly larger than in current times, with main growth areas of highly suitable habitats in Hunan and Hubei provinces in China (Figure S2).
The changing trend under the RCP4.5 and RCP2.6 scenarios was expected to be consistent, and the total area was predicted to increase by 1.61 × 10⁵ km2, nonetheless, the area of highly suitable habitats under the RCP4.5 scenario would be the largest in all periods and scenarios. In the 2050s, the RCP4.5 scenario showed a more obvious northward movement trend than the RCP2.6 scenario. In the 2070s, the area of the suitable habitats under the RCP4.5 scenario was expected to decrease by 8.69 × 10³ km2 compared to the present one. The area would mainly decrease in southwest China (Figure S3).
Under the RCP8.5 scenario, the total area of suitable habitats would increase by 1.42 × 10⁵ km2 in the 2050s. The expansion of original suitable habitats in Northern Henan and Shanxi would be not as large as that of RCP2.6 and RCP4.5, while that in western Sichuan and Yunnan would not be as large as RCP4.5 but slightly more than RCP2.6. The expansion ratio in Japan would be slightly more than that of RCP2.6, while the contraction in the south of Guangdong and Guangxi would be more than that in the previous two scenarios. The area growth of the Himalayas would be similar to the RCP4.5 scenario but more fragmented, and the extension length would be less than that of Yunnan. In the 2070s, the suitable habitats would decrease by 2.10 × 10⁵ km2, which is the largest decrease among the three scenarios (Figure S4).
Among several scenarios, RCP4.5 was the most suitable for L. chinense. Although the suitable habitats of L. chinense would first increase wholly and then decrease in different scenarios, the suitable habitats in the 2050s and 2070s would be larger than that in current times, and the highly suitable habitats in the RCP4.5 scenario would be the largest in the same era. Under the RCP2.6 scenario, the total area growth in the 2050s would be higher than RCP4.5, but the area of moderately and high suitable habitats would be smaller. Moreover, the area would decrease more in the 2070s. However, the area of the highly suitable habitats under the RCP8.5 would be lower than that of current times in the 2050s and 2070s.
3.5.2. Suitable Habitat Area of L. tulipifera under Future Conditions
From current times to 2070s, the full suitable habitat area of L. tulipifera would firstly increase, and then diminish under the RCP2.6 and RCP4.5 scenarios but would proceed to extend under the RCP8.5 scenario, and the whole zone under the RCP8.5 scenario would continuously be the largest among three scenarios (Table 5).
Table 5.
Areas of potential distribution of Liriodendron tulipifera under different climate scenarios.
Under the RCP2.6 scenario, the main changes in the 2050s would be concentrated in the low-level suitable habitats. Moreover, there would be newly added spot areas in the southern coastal mountains of North America, West Asia and Central Asia, Hunan, and Jiangxi Provinces of China. Although the low suitable areas would have changed greatly, increasing by about 61%, the growth of the medium-high suitable areas would not be obvious. The reduction in suitable areas in the 2070s was mainly denoted by the reduction in low-level suitable habitats (Figure S5).
Under the RCP4.5 scenario, the suitable areas in North America were predicted to expand towards the north by the 2050s. Due to the eastward contraction of the original suitable areas in western America, the change of low-level suitable habitats would not be large. It is worth mentioning that the originally narrow strip-shaped and island-shaped suitable areas in the eastern United States would be connected into larger blocks and expand inland to a certain extent. Up to the 2070s, the suitable areas would change minorly to 5.82 × 10⁶ km2 (Figure S6).
The trend of the suitable area under the RCP8.5 scenario is similar to that of the RCP2.6 scenario, denoted by an increase at first and then a decrease in the total suitable area, which would be 7.97 × 10⁶ km2 and 7.03 × 10⁶ km2 in the 2050s and 2070s respectively (Figure S7). In the 2050s, new suitable areas were also forecasted to emanate in North America, Canada, Quebec, Ontario, Newfoundland, Rocky Mountains, Coastal Mountains, and the Midwest of the United States. In the 2070s, the northward shift in North America would be mainly characterized by contraction, while the moderately suitable habitats will be the most obvious and shrinking to the northern coastal areas. The moderately suitable habitats in Mississippi, Louisiana, Arkansas, and Alabama in the United States were also expected to migrate northward (Figure S7).
3.6. Core Distributional Shifts of Liriodendron under Different Climatic Scenarios
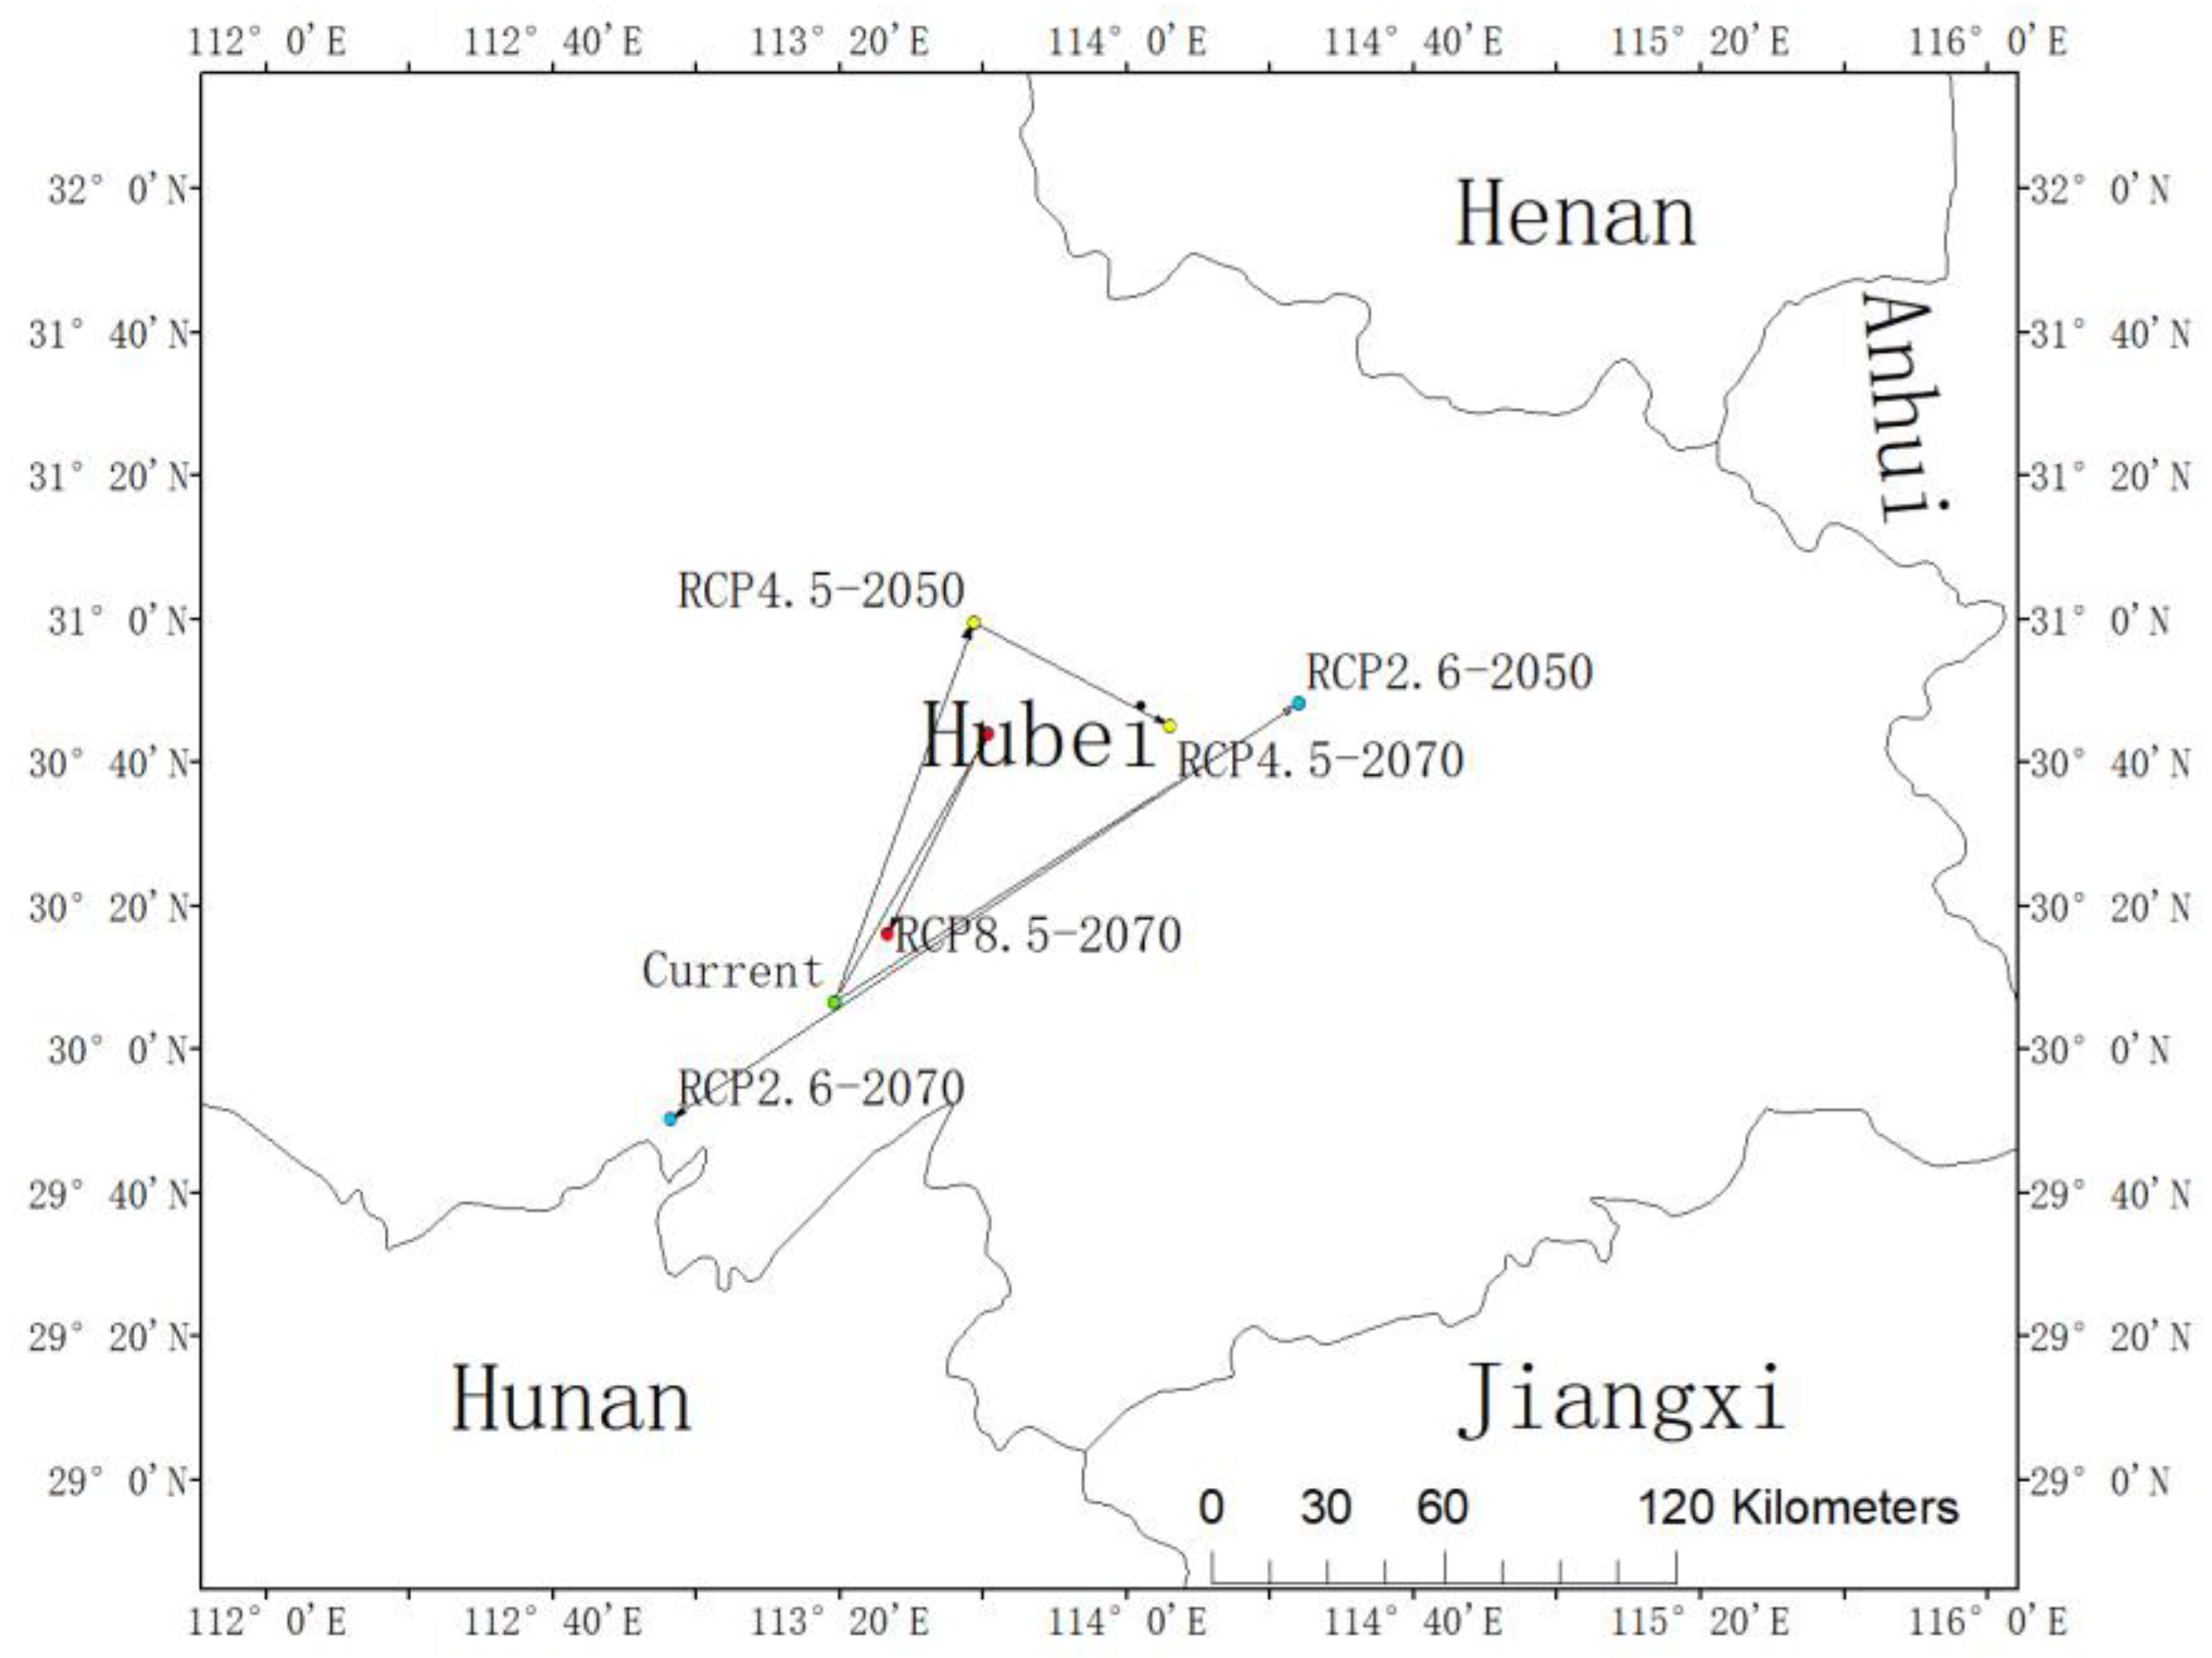
The centroid of the current habitat of L. chinense is located at the position of 30.11° N and 113.32° E in Honghu City and Jingzhou City, Hubei Province, China (Figure 4). The centroid under the RCP2.6-2050 scenario was predicted to be located in Huangpi District, Wuhan City, Hubei Province (30.81° N, 114.40° E), and in Jianli City, Jingzhou City, Hubei Province (29.84° N, 112.94° E). The distribution centroid under the RCP4.5-2050 scenario was also predicted to be located in Yingcheng City, Xiaogan City, Hubei Province (31.00° N, 113.64° E) while the distribution centroid under the RCP4.5-2070 scenario was also predicted to be located in Dongxihu District, Wuhan City, Hubei Province (30.75° N, 114.01° E). Furthermore, the distribution centroid under the RCP8.5-2050 scenario would be located in Honghu City, Jingzhou City, Hubei Province (30.11° N, 113.32° E), and the distribution centroid under the RCP8.5-2070 scenario would be located in Xiantao City, Hubei Province (30.27° N, 113.44° E). In the RCP2.6 and RCP8.5 scenarios, the potential distribution centroid of L. chinense was predicted to expand to high latitudes from present to future, then showing a returning trend to the distribution centroid under current circumstances. This trend would be more obvious under the RCP8.5, and it would surpass the current distribution center and distribute in the southwest of it in 2070. The slant of RCP4.5 from current to 2050 would be steady with that of RCP2.6 and RCP8.5, and both of them would shift to high latitudes, but the trend from 2050 to 2070 would be distinctive and move to the southeast (Figure 4).
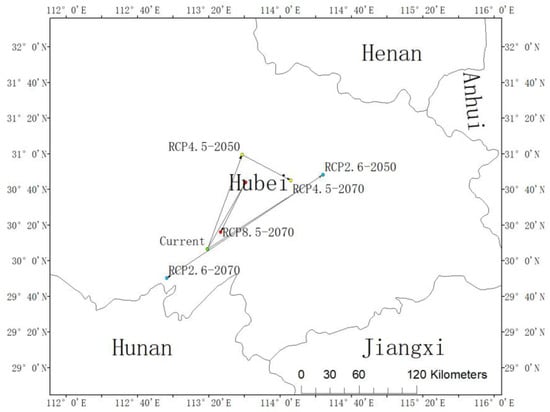
Figure 4.
The core distributional shifts of Liriodendron chinense under different climate scenarios in China.
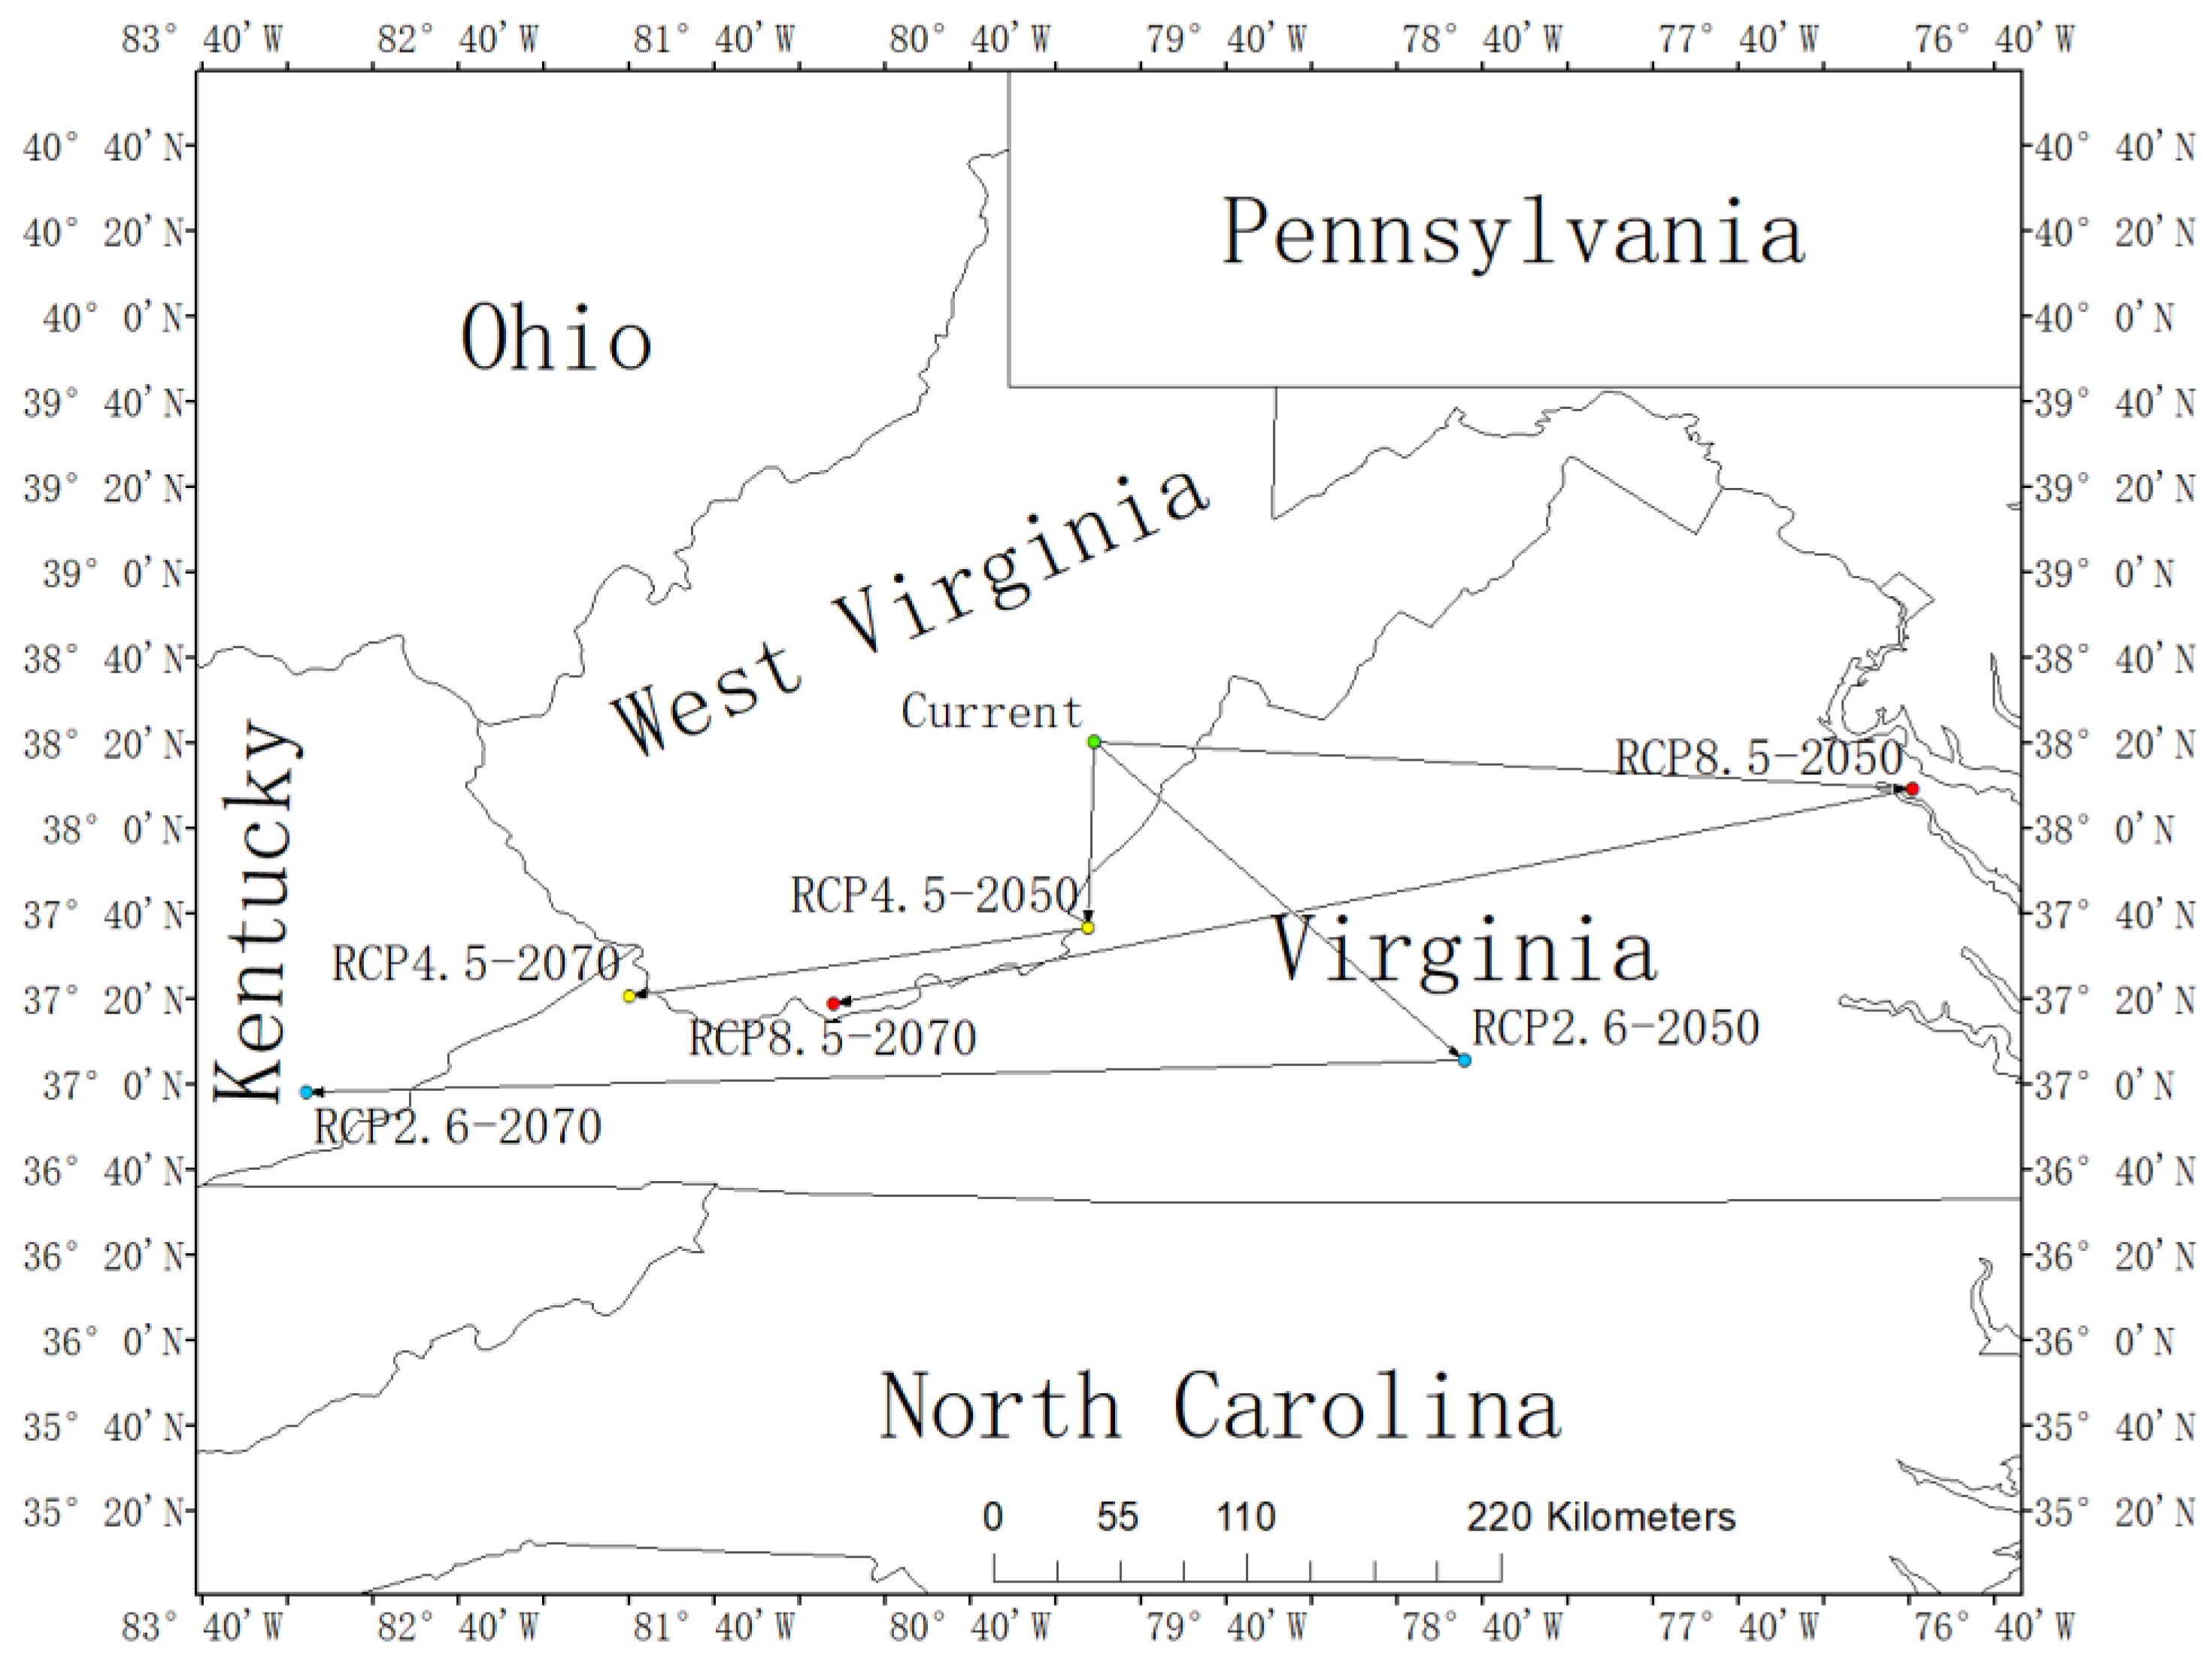
The centroid of the current habitat of L. tulipifera was located in Woodrow, West Virginia, USA, with the coordinates 38.34° N and 80.18° W. Under the RCP2.6-2050 scenario, the centroid would relocate to Phoenix, Virginia (37.10° N, 78.74° W), and to Big Laurel, Kentucky (36.97° N, 83.26° W) in the RCP2.6-2070 scenario. Under the RCP4.5-2050, the centroid would locate in Potts Creek, Virginia (37.61° N, 80.21° W), while under the RCP4.5-2070, the centroid would relocate to Wolford, Virginia (37.35° N, 82.00° W). Moreover, the distribution center under the RCP8.5-2050 scenario would locate in Nash Town, Virginia (38.15° N, 76.99° W), and the centroid under the RCP8.5-2070 scenario would relocate in Littlesburg, West Virginia (37.32° N, 81.20° W). It was predicted that the centroid of L. tulipifera in the future in all three scenarios would move to low latitudes. In the 2050s, the centroids of RCP2.6 and RCP8.5 would move to the coast, and the trend of RCP8.5 would be more obvious. RCP4.5 would be the most stable, and the deviation of longitude and latitude would be the smallest. However, in the 2070s, all of them would keep shifting to low latitudes, and the distribution centers of the three situations would be concentrated in the border areas of Kentucky, West Virginia, and Virginia (Figure 5).
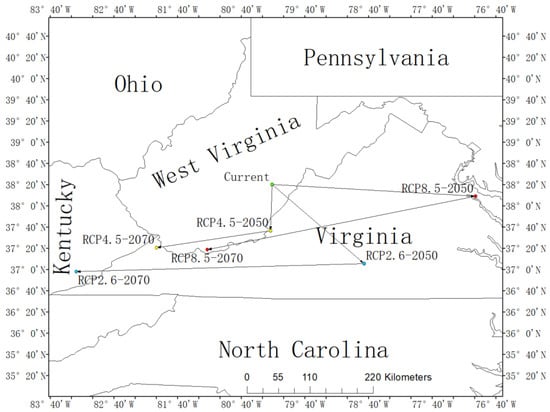
Figure 5.
The core distributional shifts of Liriodendron tulipifera under different climate scenarios in USA.
4. Discussion
In this research, the whole world was taken as a target scope to construct the model, which aided in discovering new suitable areas, and can give a reference for the introduction and protection of non-native zones [28]. Previous studies focused on the study of L. chinense [19,20,29], while this study compared the two species of Liriodendron at the same time, that made up for the deficiency in the research of L. tulipifera and provided the basic support of geography and climate for the study of the evolutionary relationship between the two species. In this study, three scenarios (RCP2.6, RCP4.5, and RCP8.5) were selected to simulate and predict the changes of the suitable areas of Liriodendron in the future, while most of the previous studies only used two idealized scenarios [30,31,32,33], which could not well reflect the general climate change in the future, so adding an intermediate scenario in this paper could better reflect the changing trend.
The predicted optimum temperature range of Liriodendron in this study was consistent with the temperature range of broad-leaved forests in the world as predicted by Woodward et al. [34]. Tang et al. [35] also studied the dark diversity of L. chinense and found that its dark diversity model was mostly consistent with the MaxEnt model [34,35]. All of these studies concur that precipitation-related factors are environmental factors that have the greatest impact on the suitability of L. chinense. Recently, Yang et al. [36] and Qiu et al. [19] also researched the distribution of L. chinense and concluded that precipitation-related factors have the greatest impact on the suitability of L. chinense. Our findings were also in accordance with these findings that the precipitation factor Bio18 has the greatest impact on the suitability of L. chinense, which may be related to the availability of different variables or data ranges involved in building the model [36]. We showed that the cumulative contribution rate of precipitation-related factors reached 69.4%. Among them, the contribution rate of precipitation of warmest quarter was the highest, and the model predicted that the precipitation of warmest quarter was 500~600 mm, which is the most suitable for the survival of L. chinense.
The potential highly suitable habitats of L. chinense were mainly distributed in the Yangtze River basin from central to eastern China, which was consistent with the actual distribution range of L. chinense (Figure 1). This area belongs to a subtropical monsoon climate, which is hot and rainy in summer and mild and less rainy in winter; the high-speed growth period of L. chinense is the warmest quarter in its suitable habitats [37], which may be an important reason affecting its survival. According to previous studies in the forest community, Liriodendron has a long generation cycle and low reproductive capacity, the flowering period of Liriodendron is from the end of April to the beginning of June, which is the period of abundant rainfall in its suitable habitats. It is possible that rainfall has a considerable impact on its pollination and reproduction [29]. This is one of the important reasons why precipitation-related factors have become the main factors affecting the distribution of L. chinense.
The foremost vital natural components influencing the dispersion of L. tulipifera were precipitation of driest month and temperature seasonality (Table 1). In the west of America, there was a highly suitable habitat separated by a moderately suitable habitat, which was distributed in West Virginia and western Pennsylvania. This result was consistent with the actual distribution of L. tulipifera. This area is similar to the above-mentioned highly suitable habitat of L. chinense and has a subtropical monsoon climate; however, the monsoon phenomenon is not as significant as that in China [38]. Among the precipitation-related factors affecting the distribution of L. tulipifera, precipitation of driest quarter had the second contribution, which means that drought has a great influence on the growth and reproduction of L. tulipifera (Table 1). Previous studies have also shown that drought has a significant impact on the growth of L. tulipifera [39,40]. We suggest further research on the water sensitivity of L. tulipifera. The most suitable distribution of Liriodendron was located in the subtropical monsoon climate zone [19,20]. This study only took into consideration climate components; properties of suitable areas in these zones need to be further analyzed considering other eco-environmental factors such as soil, elevation, slope direction, etc.
Due to global warming, the temperature and precipitation in eastern Asia, northern and eastern Europe, eastern and western North America, and South America have increased [41]. The northward expansion trend of L. chinense is mainly due to the increase in precipitation [42]. Nevertheless, with the continuous increase in temperature and precipitation, the suitable area of L. chinense would finally begin to decline. The temperature in North America is expected to increase in the future, with more precipitation in the east (including the northeast) and the mid-west of the United States, characterized as a wet climate [43]. The reason for the shrinkage of L. tulipifera in the north of North America would be the excessive precipitation, while the growth areas in the west would become a suitable area for L. tulipifera to survive because of the increase in the precipitation which was low at first (Figure 1; Figure 2; Figures S2–S7 ). Studies have shown that the continuous increase in temperature will advance the phenology of plants in spring and delay the phenology in autumn [44,45,46,47]. The reproductive growth and vegetative growth of Liriodendron have a high overlap regarding resource allocation and time [48], and studies have shown that the flowering period of plants will be prolonged in different degrees under the high carbon emission scenario (RCP8.5) [48,49], which may solve the problem that the flowering period of Liriodendron overlaps with the rainy season and affects insect pollination.
Additionally, from the changes of suitable areas, it was found that the suitable areas of L. chinense would increase at first then diminish up until 2070 under the RCP2.6, RCP4.5, and RCP8.5 scenarios. Likewise, the suitable areas of L. tulipifera would first increase then decrease under the RCP2.6 and RCP4.5 scenarios, but proceed to extend under the RCP8.5 scenarios. This study has predicted that long-term high carbon emissions would in the long run lead to the reduction in suitable habitats of Liriodendron.
5. Conclusions
Estimating the population distribution alteration and shift of genus Liriodendron affected by climate change is of vital importance for its cultivation, management, and conservation. The results of this research indicated that the suitable habitat for L. chinense and L. tulipifera would increase at first then decrease under two scenarios for low and medium concentrations of greenhouse gas emissions (RCP2.6 and RCP4.5). However, under the scenario with higher concentrations of emissions (RCP8.5), it was predicted that the suitable habitat range of L. chinense would decrease while L. tulipifera would slightly increase. The projected spatial and temporal shift pattern of population distribution for L. chinense and L. tulipifera could be a useful reference in developing forest management and conservation strategies for these two economically and ecologically important tree species.
Supplementary Materials
The following are available online at https://www.mdpi.com/article/10.3390/f13030488/s1. Figure S1: ROC curve of MaxEnt model onLiriodendron chinense (A) and Liriodendron tulipifera (B); Table S1: Correlation analysis of climate factors; Figure S2: Population distribution of Lirio-dendron chinense under RCP2.6 scenario in 2050s (upper) and 2070s (bottom); Figure S3: Pop-ulation distribution of Liriodendron chinense under RCP4.5 scenario in 2050s (upper) and 2070s (bottom); Figure S4: Population distribution of Liriodendron chinense under RCP8.5 scenario in 2050s (upper) and 2070s (bottom); Figure S5: Population distribution of Liriodendron tulipifera under RCP2.6 scenario in 2050s (upper) and 2070s (bottom); Figure S6: Population distribution of Liriodendron tulipifera under RCP4.5 scenario in 2050s (upper) and 2070s (bottom); Figure S7: Population distribution of Liriodendron tulipifera under RCP8.5 scenario in 2050s (upper) and 2070s (bottom).
Author Contributions
Conceptualization, Y.C. and L.Y.; methodology and software, Y.C. and H.W.; validation, D.H., B.A. and H.W.; formal analysis, resources and data curation, Y.C. and J.F.; writing—original draft preparation, Y.C. and J.F.; writing—review and editing, D.H. and B.A.; visualization, H.W.; supervision, J.C. and L.Y.; funding acquisition, L.Y. All authors have read and agreed to the published version of the manuscript.
Funding
This This research was funded by the National Natural Science Foundation of China (No. 31971682), and the Research Startup Fund for High-Level and High-Educated Talents of Nanjing Forestry University.
Data Availability Statement
Data is contained within the article or Supplementary Materials. It is also available from the correspondence author.
Acknowledgments
We thank then editors and reviewers for the effort and time spent on giving helpful comments to improve our work.
Conflicts of Interest
The authors declare no conflict of interest.
References
- Scheffers, B.R.; De Meester, T.C.L.; Bridge, A.A.; Hoffmann, J.M. The broad footprint of climate change from genes to biomes to people. Science 2016, 354, 6313. [Google Scholar] [CrossRef] [PubMed]
- Thuiller, W.; Lavergne, C.; Roquet, I.; Boulangeat, B. Consequences of climate change on the tree of life in Europe. Nature 2011, 470, 531–534. [Google Scholar] [CrossRef] [PubMed]
- Thuiller, W.; Lavorel, S.; Araújo, M.B.; Sykes, M.T.; Prentice, I.C. Climate change threats to plant diversity in Europe. Proc. Natl. Acad. Sci. USA 2005, 102, 8245–8250. [Google Scholar] [CrossRef] [Green Version]
- Farias, A.A.; Svensson, G.L. Ecoregional Vulnerability Assessment for the Functional Richness of South American Carnivorans (Mammalia: Carnivora). J. Mamm. Evol. 2014, 21, 437–450. [Google Scholar] [CrossRef]
- Stocker, T. Climate Change 2013: The Physical Science basis: Working Group I Contribution to the Fifth Assessment Report of the Intergovernmental Panel on Climate Change; Cambridge University Press: Cambridge, UK, 2014. [Google Scholar]
- Bailey, R. Ecosystem Geography: From Ecoregions to Sites, 2nd ed.; Springer: New York, NY, USA, 2009; p. 251. [Google Scholar]
- García, M.; Toledo-Aceves, T. Is there potential in elevational assisted migration for the endangered Magnolia vovidesii? J. Nat. Conserv. 2020, 53, 125782. [Google Scholar] [CrossRef]
- Rodrigues, E.; Cohen, M.C.; Liu, K.-B.; Pessenda, L.C.; Yao, Q.; Ryu, J.; Rossetti, D.; de Souza, A.; Dietz, M. The effect of global warming on the establishment of mangroves in coastal Louisiana during the Holocene. Geomorphology 2021, 381, 107648. [Google Scholar] [CrossRef]
- Dyderski, M.K.; Paź, S.; Frelich, L.E.; Jagodziński, A.M. How much does climate change threaten European forest tree species distributions? Glob. Chang. Biol. 2018, 24, 1150–1163. [Google Scholar] [CrossRef] [PubMed]
- Zhang, M.-G.; Zhou, K.-Z.; Chen, W.-Y.; Cannon, C.H.; Raes, N.; Ferry Slik, J.W. Major declines of woody plant species ranges under climate change in Yunnan, China. Divers. Distrib. 2014, 20, 405–415. [Google Scholar] [CrossRef]
- Yu, L.; Liu, Y.; Liu, T.; Yan, F. Impact of recent vegetation greening on temperature and precipitation over China. Agric. For. Meteorol. 2020, 295, 108197. [Google Scholar] [CrossRef]
- Bellard, C.; Bertelsmeier, C.; Leadley, P.; Thuiller, W.; Courchamp, F. Impacts of climate change on the future of biodiversity. Ecol. Lett. 2012, 15, 365–377. [Google Scholar] [CrossRef] [PubMed] [Green Version]
- Lawler, J.J.; Shafer, S.L.; White, D.; Kareiva, P.; Maurer, E.P.; Blaustein, A.R.; Bartlein, P.J. Projected climate-induced faunal change in the Western Hemisphere. Ecology 2009, 90, 588–597. [Google Scholar] [CrossRef] [PubMed] [Green Version]
- Chen, M.; Lin, E. Global Greenhouse Gas Emission Mitigation Under Representative Concentration Pathways Scenarios and Challenges to China. Adv. Clim. Chang. Res. 2010, 80, 436–442. [Google Scholar]
- Ma, B.; Sun, J. Predicting the distribution of Stipa purpurea across the Tibetan Plateau via the MaxEnt model. BMC Ecol. 2018, 18, 1–12. [Google Scholar] [CrossRef] [Green Version]
- Pan, J.; Zhang, C.; Shi, M.; Guo, F.; Liu, J.; Li, L.; Ren, Q.; Tao, S.; Tang, M.; Ye, H.; et al. Ethanol extract of Liriodendron chinense (Hemsl.) Sarg barks attenuates hyperuricemic nephropathy by inhibiting renal fibrosis and inflammation in mice. J. Ethnopharmacol. 2020, 264, 113278. [Google Scholar] [CrossRef] [PubMed]
- Quassinti, L.; Ortolani, M.; Lupidi, F. Exploring new applications of tulip tree (Liriodendron tulipifera L.): Leaf essential oil as apoptotic agent for human glioblastoma. Environ. Sci. Pollut. Res. Int. 2019, 29, 30485–30497. [Google Scholar] [CrossRef]
- IUCN Red List of Threatened Species. Liriodendron chinense (Chinese Tulip Tree). Available online: https://www.iucnredlist.org/species/31284/2803363 (accessed on 5 March 2022).
- Qiu, H.J.; Sun, J.J.; Xu, D.; Shen, A.H. MaxEnt model-based prediction of potential distribution of Liriodendron chinense in China. J. Zhejiang A&F Univ. 2020, 37, 1–8. (In Chinese) [Google Scholar] [CrossRef]
- Zhai, X.Y.; Shen, Y.F.; Zhu, S.H.; Tu, Z.H.; Zhang, C.G.; Li, H.G. Potential Impacts of Climate Change in Future on the Geo-graphical Distributions of Relic Liriodendron chinense. J. Trop. Subtrop. Bot. 2021, 29, 151–161. [Google Scholar] [CrossRef]
- Otto-Bliesner, B.L.; Marshall, S.J.; Overpeck, J.T.; Miller, G.H.; Hu, A.; Members, C.L.I.P. Simulating Arctic Climate Warmth and Icefield Retreat in the Last Interglaciation. Sciences 2006, 311, 1751–1753. [Google Scholar] [CrossRef] [Green Version]
- Etherington, T.R. Python based GIS tools for landscape genetics: Visualising genetic relatedness and measuring landscape connectivity. Methods Ecol. Evol. 2010, 2, 52–55. [Google Scholar] [CrossRef]
- Tan, Y.F.; Zuo, X.Q. Studies on Potential Suitable Growth Areas and Protection of Camellia nitidissima Based on GIS and Maxent Model. J. Trop. Subtrop. Bot. 2018, 26, 24–32. [Google Scholar]
- Zhou, H.T.; Na, X.D.; Zang, S.Y.; Xie, R. Applications of Maximum Entropy (Maxent) Model in Species Habitat Study. Environ. Sci. Manag. 2016, 41, 149–151. [Google Scholar]
- Ma, D.X.; Zhou, Y.; Yin, X.J.; Zhou, S.Y. Study on climate suitability of 11 species of common broad-leaved trees in Yunnan based on MaxEnt model. J. Northeast. For. Univ. 2020, 40, 64–72. (In Chinese) [Google Scholar]
- Ding, W.-N.; Ree, R.H.; Spicer, R.A.; Xing, Y.-W. Ancient orogenic and monsoon-driven assembly of the world’s richest temperate alpine flora. Sciences 2020, 369, 578–581. [Google Scholar] [CrossRef]
- Ashton, P.; Zhu, H. The tropical-subtropical evergreen forest transition in East Asia: An exploration. Plant Divers. 2020, 42, 255–280. [Google Scholar] [CrossRef] [PubMed]
- Pärtel, M.; Szava-Kovats, R.; Zobel, M. Dark diversity: Shedding light on absent species. Trends Ecol. Evol. 2011, 26, 124–128. [Google Scholar] [CrossRef] [PubMed]
- Zhang, F.; Zhao, Y. Advance of study on Liriodendron. Yunnan Nong ye da xue due bao. J. Yunnan Agric. Univ. 2005, 20, 697–701. [Google Scholar]
- Çoban, H.O.; Örücü, Ö.K.; Arslan, E.S. MaxEnt Modeling for Predicting the Current and Future Potential Geographical Dis-tribution of Quercus libani Olivier. Sustainability 2020, 12, 2671. [Google Scholar] [CrossRef] [Green Version]
- Zhang, K.; Yao, L.; Meng, J.; Tao, J. Maxent modeling for predicting the potential geographical distribution of two peony species under climate change. Sci. Total Environ. 2018, 634, 1326–1334. [Google Scholar] [CrossRef]
- Qin, A.L.; Liu, B.; Guo, Q.S.; Bussmann, R.W.; Ma, F.; Jian, Z.; Xu, G.; Pei, S. Maxent modeling for predicting impacts of climate change on the potential dis-tribution of Thuja sutchuenensis Franch., an extremely endangered conifer from southwestern China. Glob. Ecol. Conserv. 2017, 10, 139–146. [Google Scholar] [CrossRef]
- Ma, J.; Wei, L.; Li, J.; Li, H. The Analysis of Genes and Phytohormone Metabolic Pathways Associated with Leaf Shape De-velopment in Liriodendron chinense via De Novo Transcriptome Sequencing. Genes 2018, 9, 577. [Google Scholar] [CrossRef] [Green Version]
- Woodward, F.I.; Lomas, M.R.; Kelly, C.K. Global climate and the distribution of plant biomes. Philos. Trans. R. Soc. B Biol. Sci. 2004, 359, 1465–1476. [Google Scholar] [CrossRef] [PubMed] [Green Version]
- Tang, L.; Wang, R.; He, K.S.; Shi, C.; Yang, T.; Huang, Y.; Zheng, P.; Shi, F. Throwing light on dark diversity of vascular plants in China: Predicting the distribution of dark and threatened species under global climate change. PeerJ 2019, 7, e6731. [Google Scholar] [CrossRef] [PubMed]
- Yang, A.; Dick, C.W.; Yao, X.; Huang, H. Impacts of biogeographic history and marginal population genetics on species range limits: A case study of Liriodendron chinense. Sci. Rep. 2016, 6, 25632. [Google Scholar] [CrossRef] [Green Version]
- Zhang, S.Y.; Ding, B.Y. Flora of Zhejiang; Zhejiang Science and Technology Publishing House: Hangzhou, China, 1993; pp. 76–77. [Google Scholar]
- Chang, L.; Jinhai, H.E.; Li, Q.I.; Wen, M. A study of the different characteristics of seasonal variations of the precipitation and large-scale circulation between East Asia and eastern North America and its possible mechanism. Acta Meteorologica Sinica 2013, 6, 1074–1088. [Google Scholar] [CrossRef]
- Kannenberg, S.; A Novick, K.; Phillips, R.P. Coarse roots prevent declines in whole-tree non-structural carbohydrate pools during drought in an isohydric and an anisohydric species. Tree Physiol. 2017, 38, 582–590. [Google Scholar] [CrossRef]
- Elliott, K.J.; Miniat, C.F.; Pederson, N.; Laseter, S.H. Forest tree growth response to hydroclimate variability in the southern Appalachians. Glob. Chang. Biol. 2015, 21, 4627–4641. [Google Scholar] [CrossRef] [PubMed]
- Cubasch, U.; Meehl, G.; Boer, G.; Ronald, S.; Dix, M.; Noda, A. Projections of future climate change. In Climate Change: The Scientific Basis. Contribution of WG1 to the Third Assessment Report of the IPCC (TAR); University of Cambridge Press: New York, NY, USA, 2001; pp. 525–582. ISBN 978-052-180-767-8. [Google Scholar]
- Jiang, Z.H.; Zhang, X.; Wang, J. Projection of climate change in China in the 21st century by IPCC-AR4 Models. Geo Res. 2008, 27, 787–799. [Google Scholar]
- Karmalkar, A.V.; Bradley, R.S. Consequences of Global Warming of 1.5 degrees C and 2 degrees C for Regional Temperature and Precipitation Changes in the Contiguous United States. PLoS ONE 2017, 12, e0168697. [Google Scholar] [CrossRef] [Green Version]
- Mc Ewan, R.W.; Brecha, R.; Geiger, D.R.; John, G.P. Flowering phenology change and climate warming in southwestern Ohio. Plant Ecol. 2010, 212, 55–61. [Google Scholar] [CrossRef] [Green Version]
- Ahas, R. Long-term phyto-, ornitho- and ichthyophenological time-series analyses in Estonia. Int. J. Biometeorol. 1999, 42, 119–123. [Google Scholar] [CrossRef]
- Yu, H.; Luedeling, E.; Xu, J. Winter and spring warming result in delayed spring phenology on the Tibetan Plateau. Proc. Natl. Acad. Sci. USA 2010, 107, 22151–22156. [Google Scholar] [CrossRef] [Green Version]
- Fitter, A.H.; Fitter, R.S.R. Rapid Changes in Flowering Time in British Plants. Science 2002, 296, 1689–1691. [Google Scholar] [CrossRef] [PubMed]
- Fang, Y.M.; Zhang, X.P.; Wang, Z.S. Reproductive Ecology of Liriodendron chinense: Reproductive Allocation and Life-history Strategy. J. Northeast. For. Univ. 2004, 47, 71. [Google Scholar]
- Li, D.; Barve, N.; Brenskelle, L.; Earl, K.; Barve, V. Climate, urbanization, and species traits interactively drive flowering du-ration. Glob. Chang. Biol. 2021, 27, 892–903. [Google Scholar] [CrossRef] [PubMed]

Publisher’s Note: MDPI stays neutral with regard to jurisdictional claims in published maps and institutional affiliations. |
© 2022 by the authors. Licensee MDPI, Basel, Switzerland. This article is an open access article distributed under the terms and conditions of the Creative Commons Attribution (CC BY) license (https://creativecommons.org/licenses/by/4.0/).