Topography, Diversity, and Forest Structure Attributes Drive Aboveground Carbon Storage in Different Forest Types in Northeast China


Abstract
:1. Introduction
2. Materials and Methods
2.1. Site Description
2.2. Quantification of Variables Used in Analyses
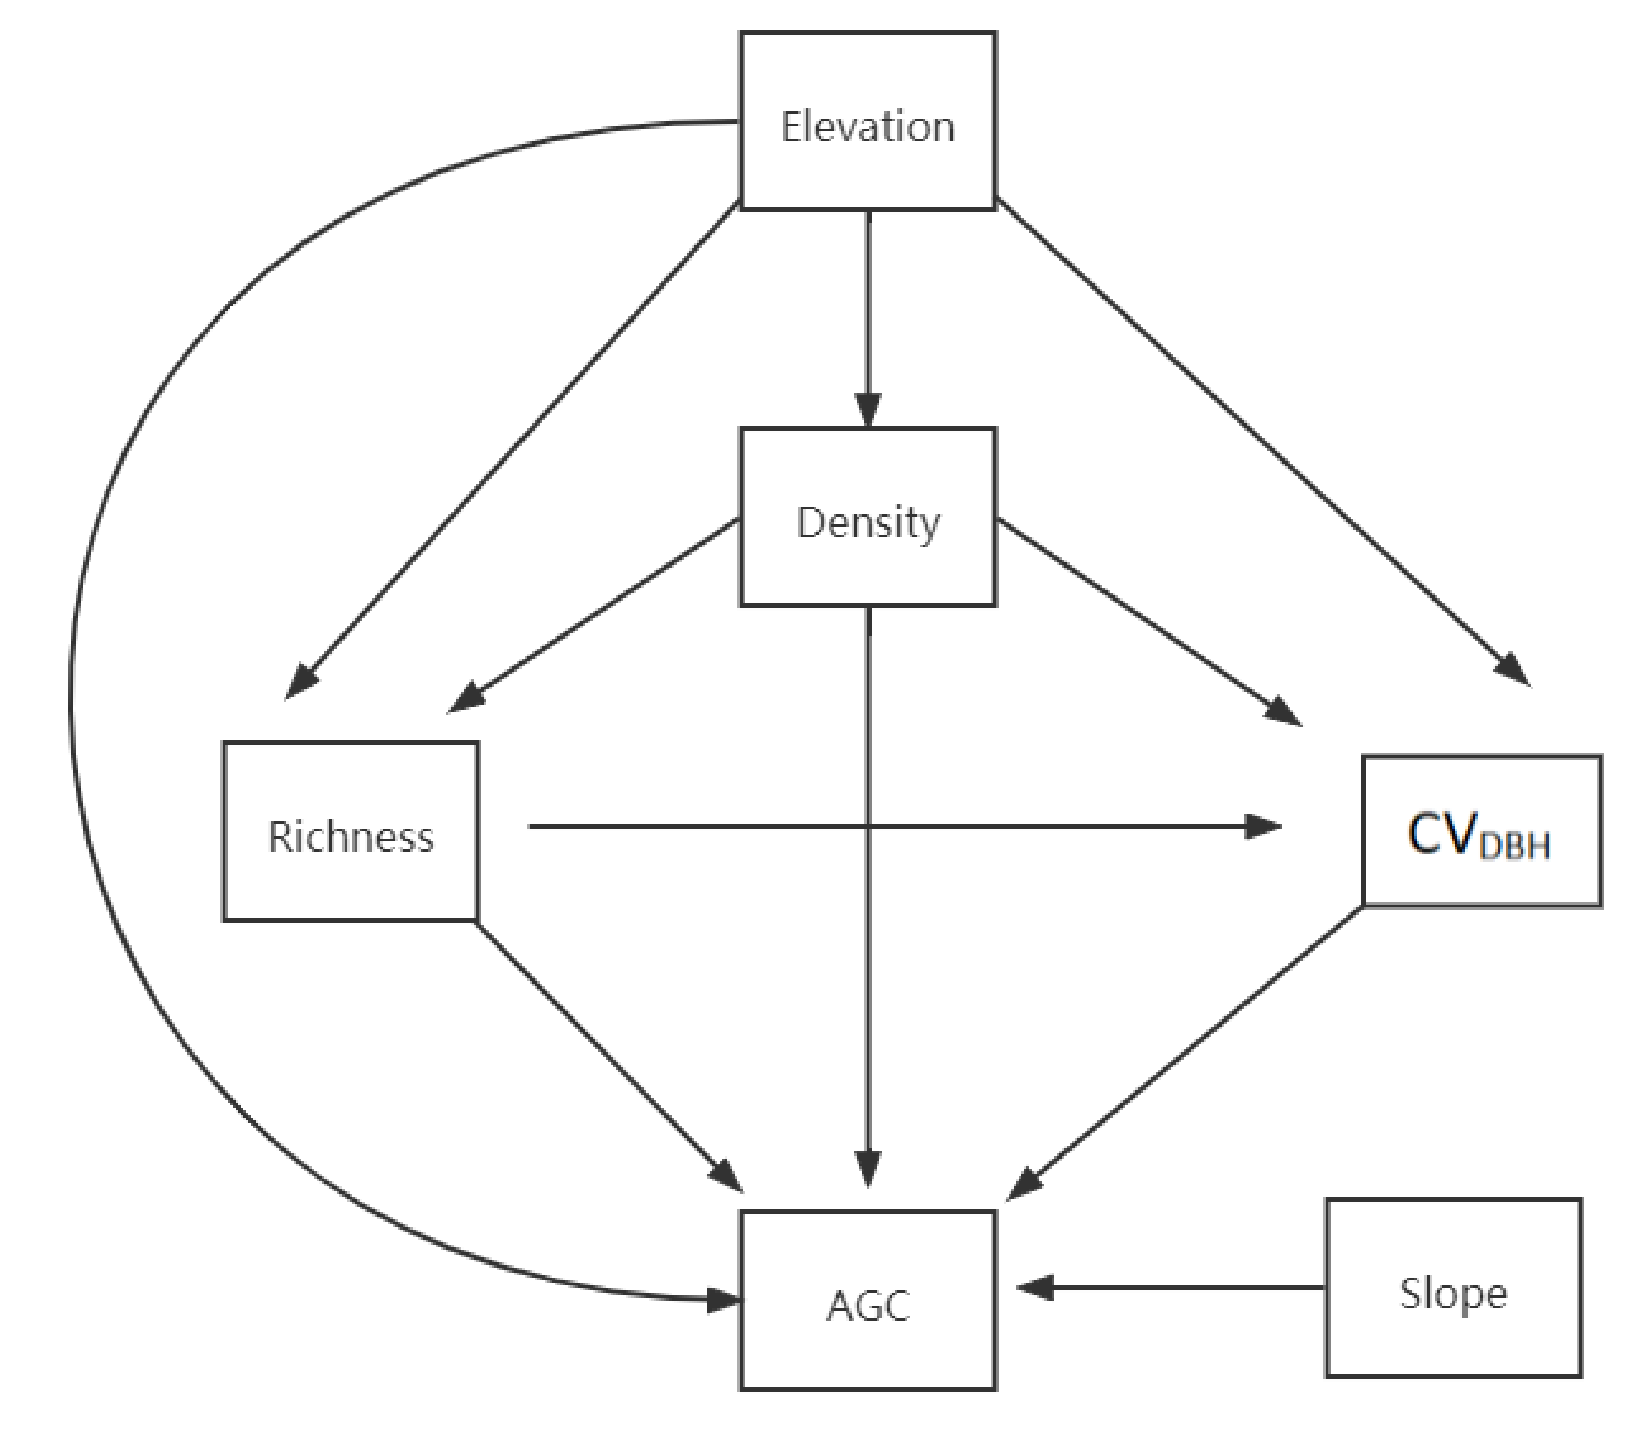
2.3. Statistical Analysis
3. Results
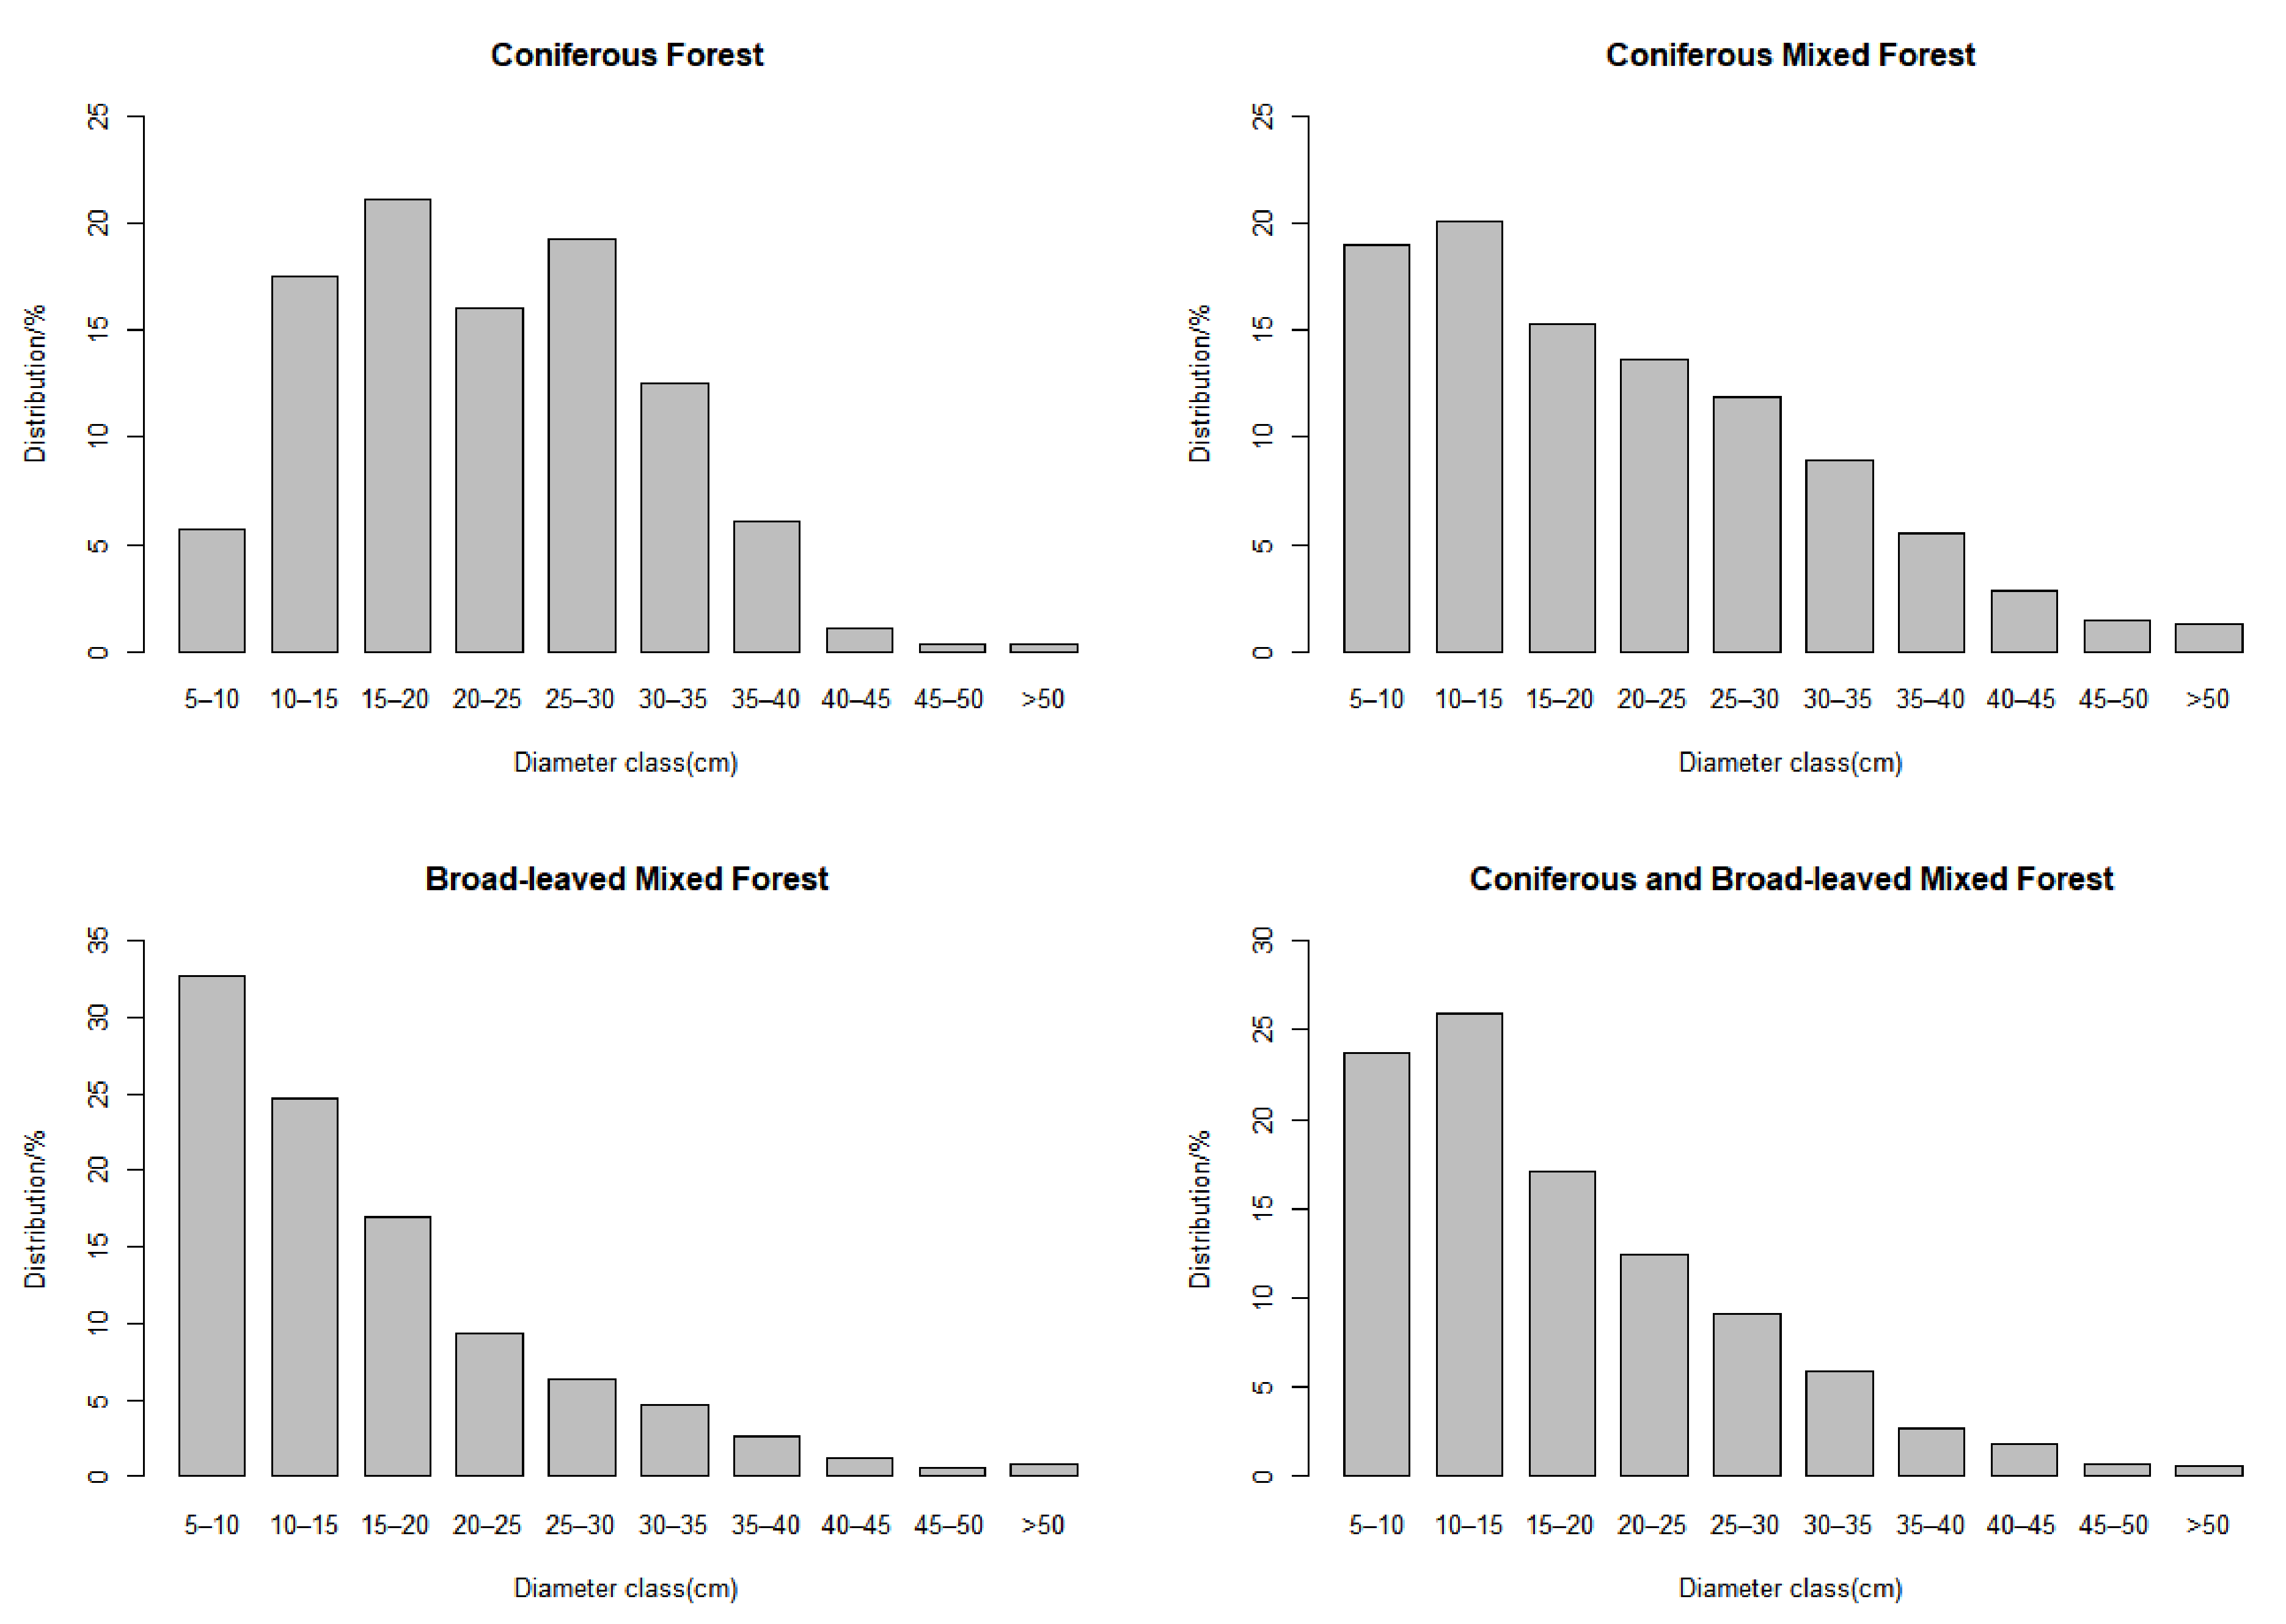
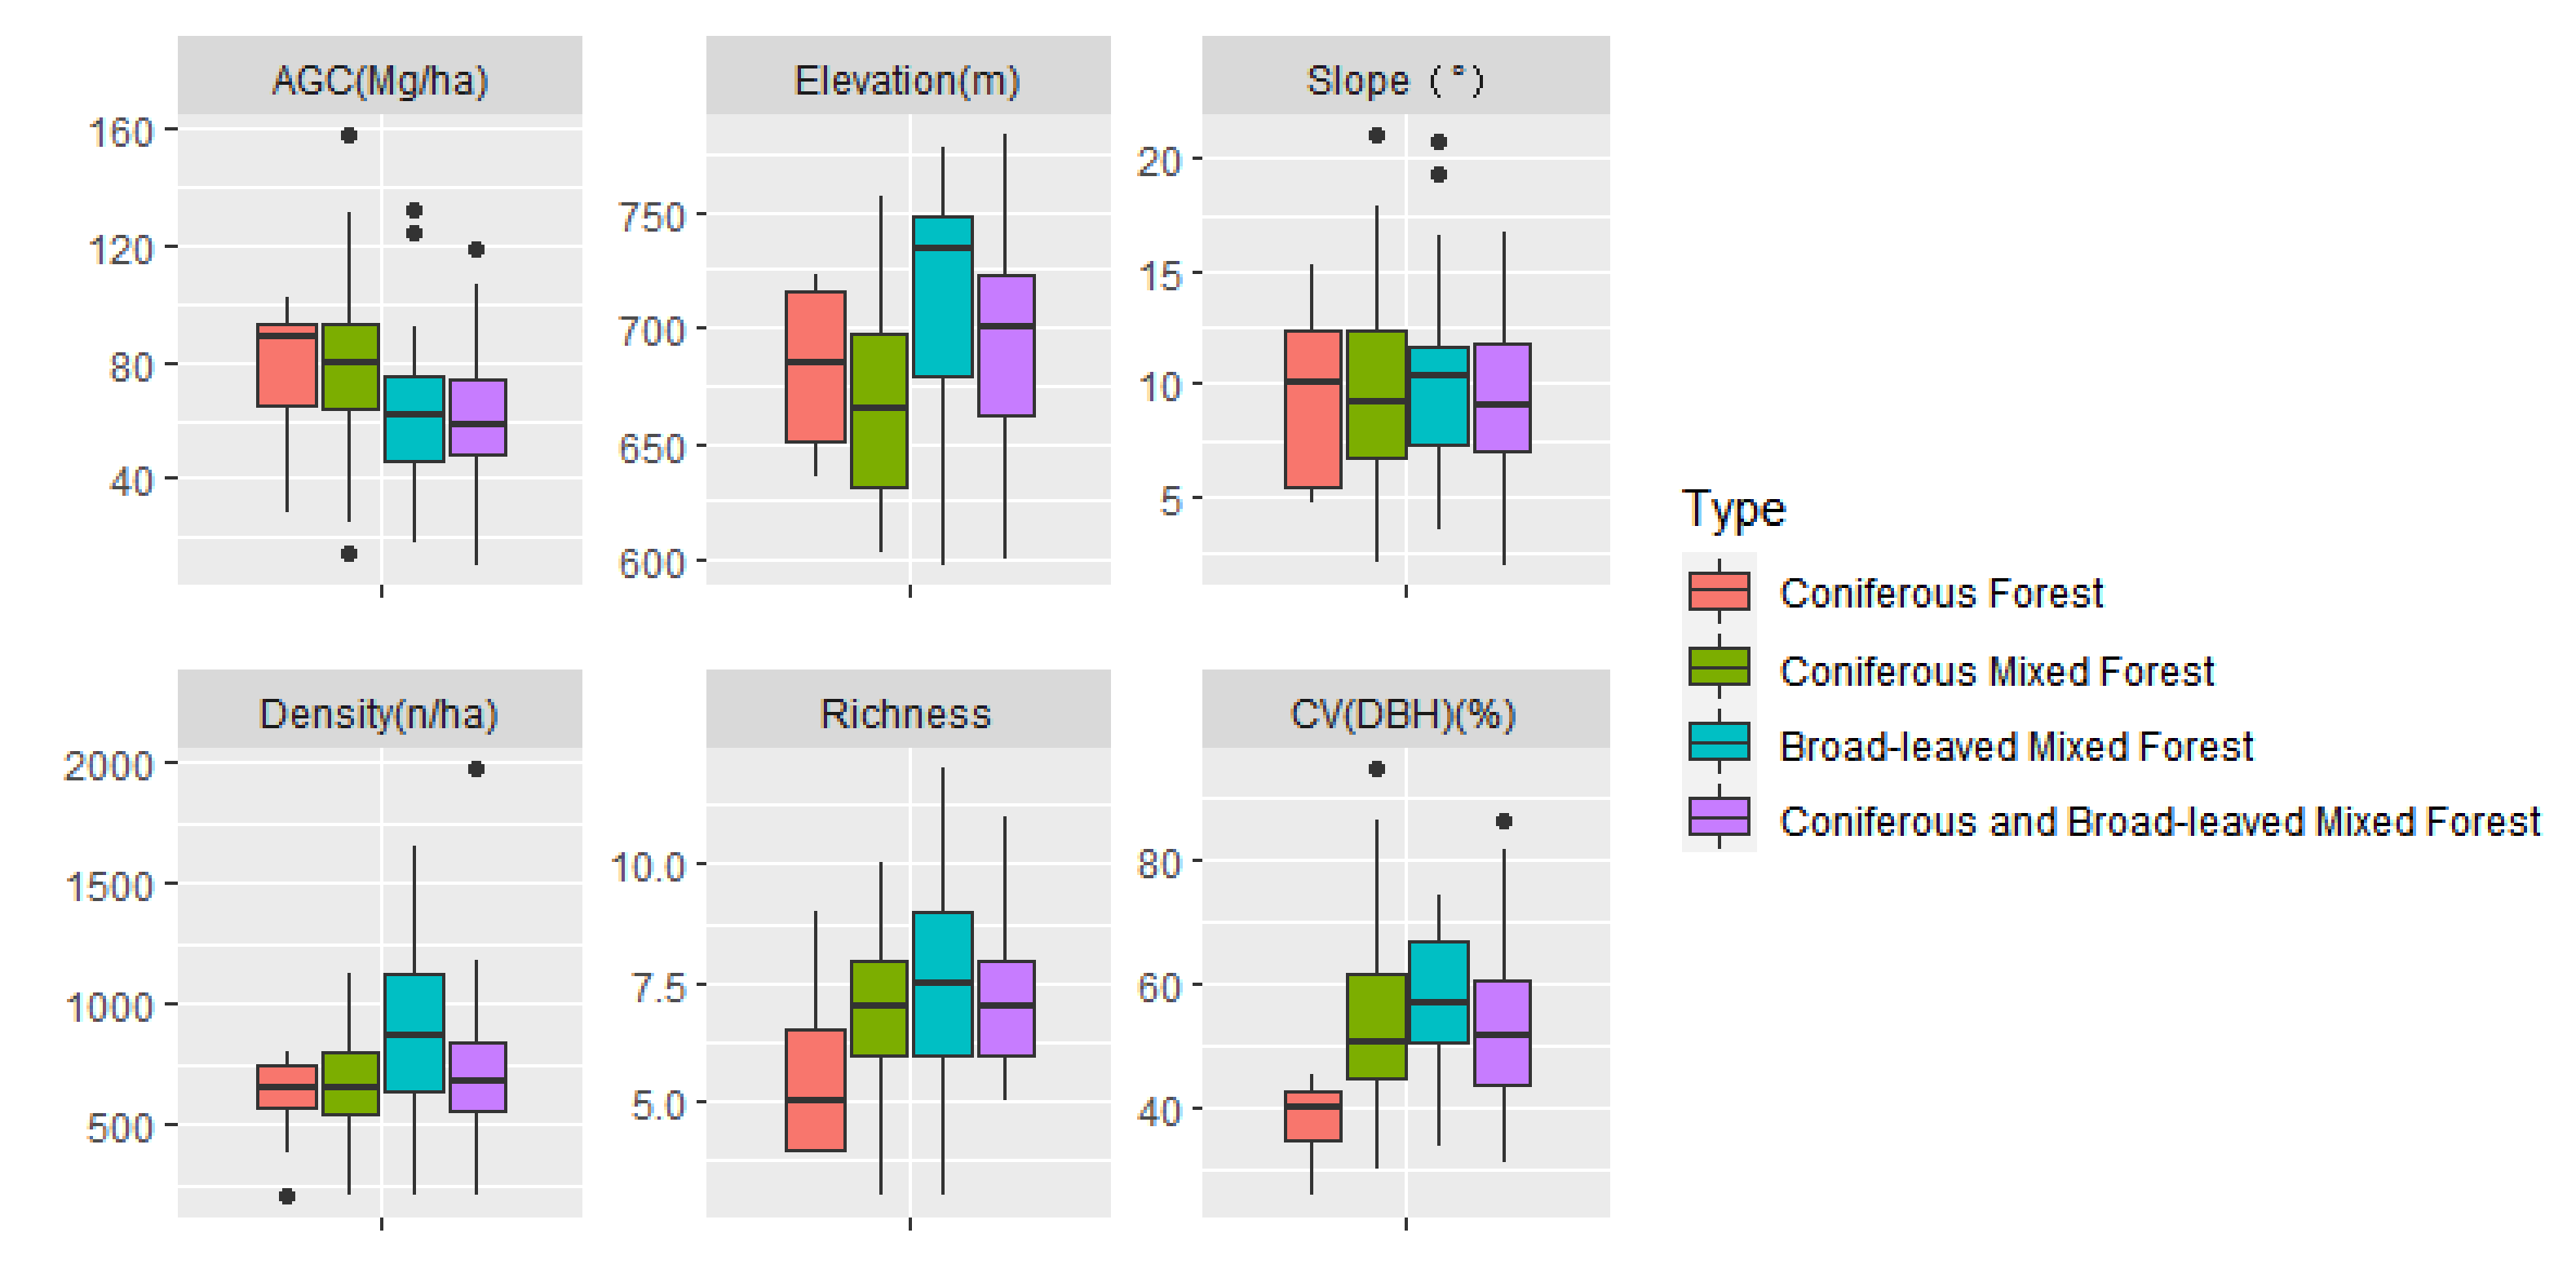
3.1. General Description
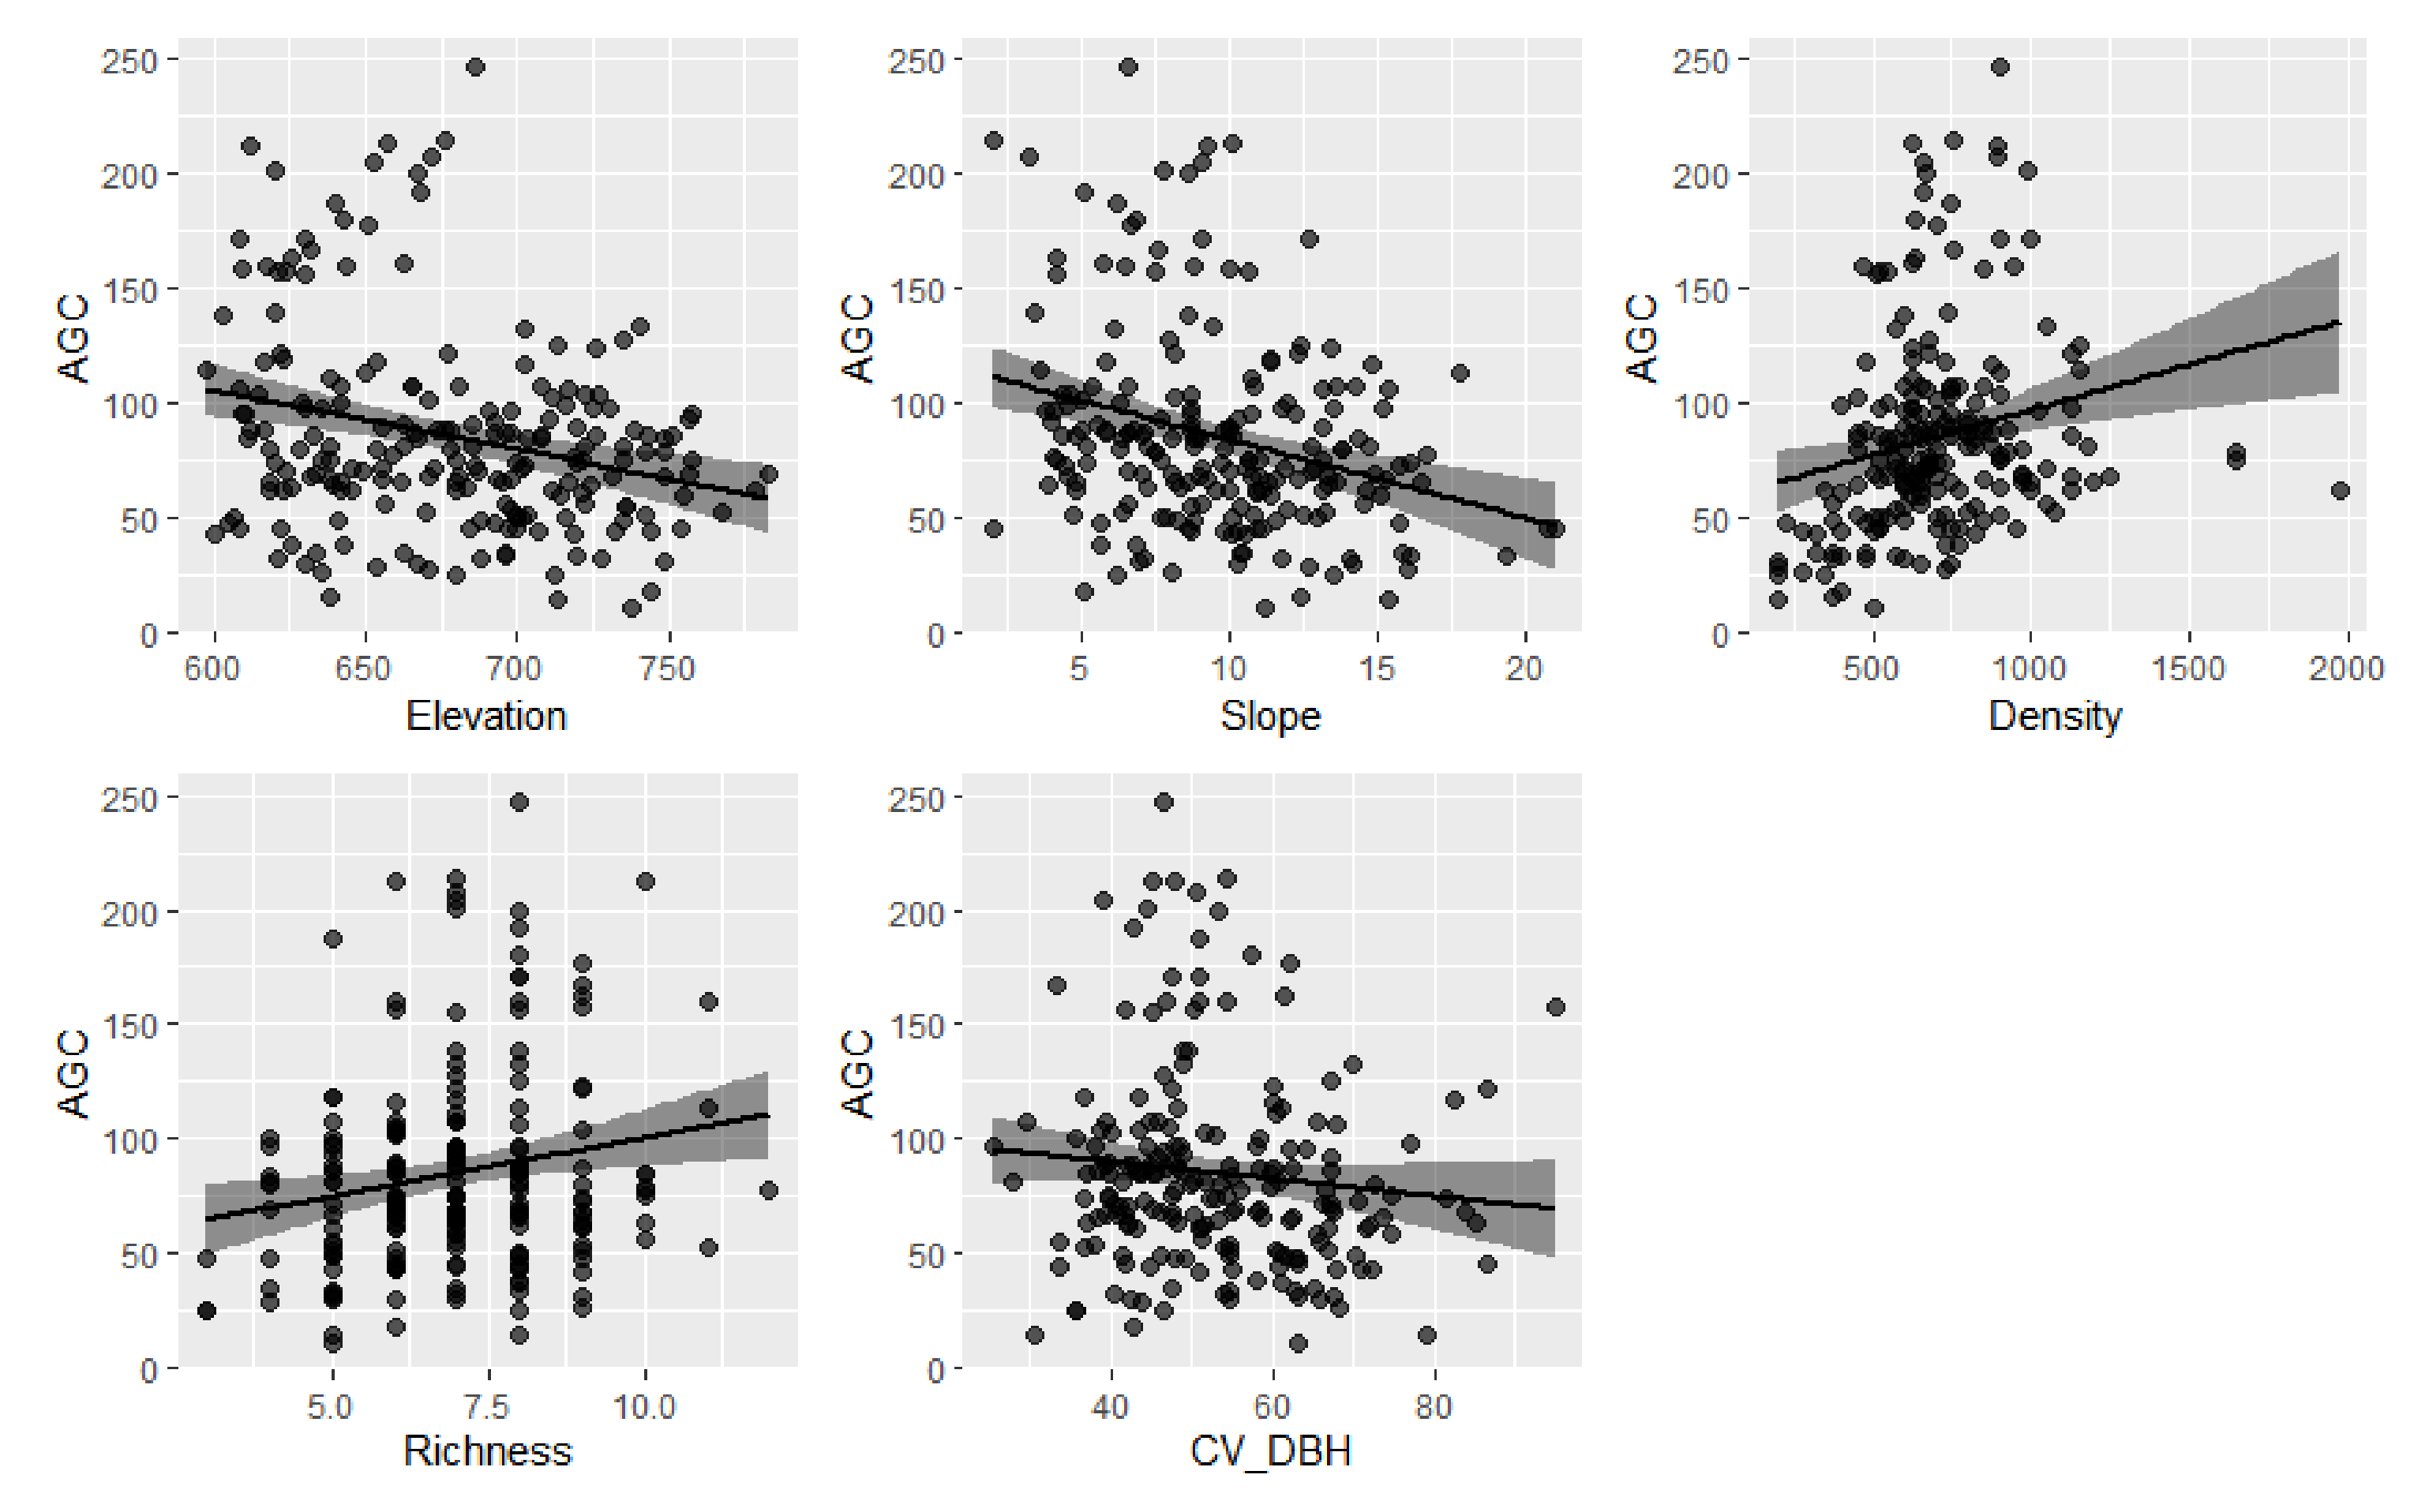
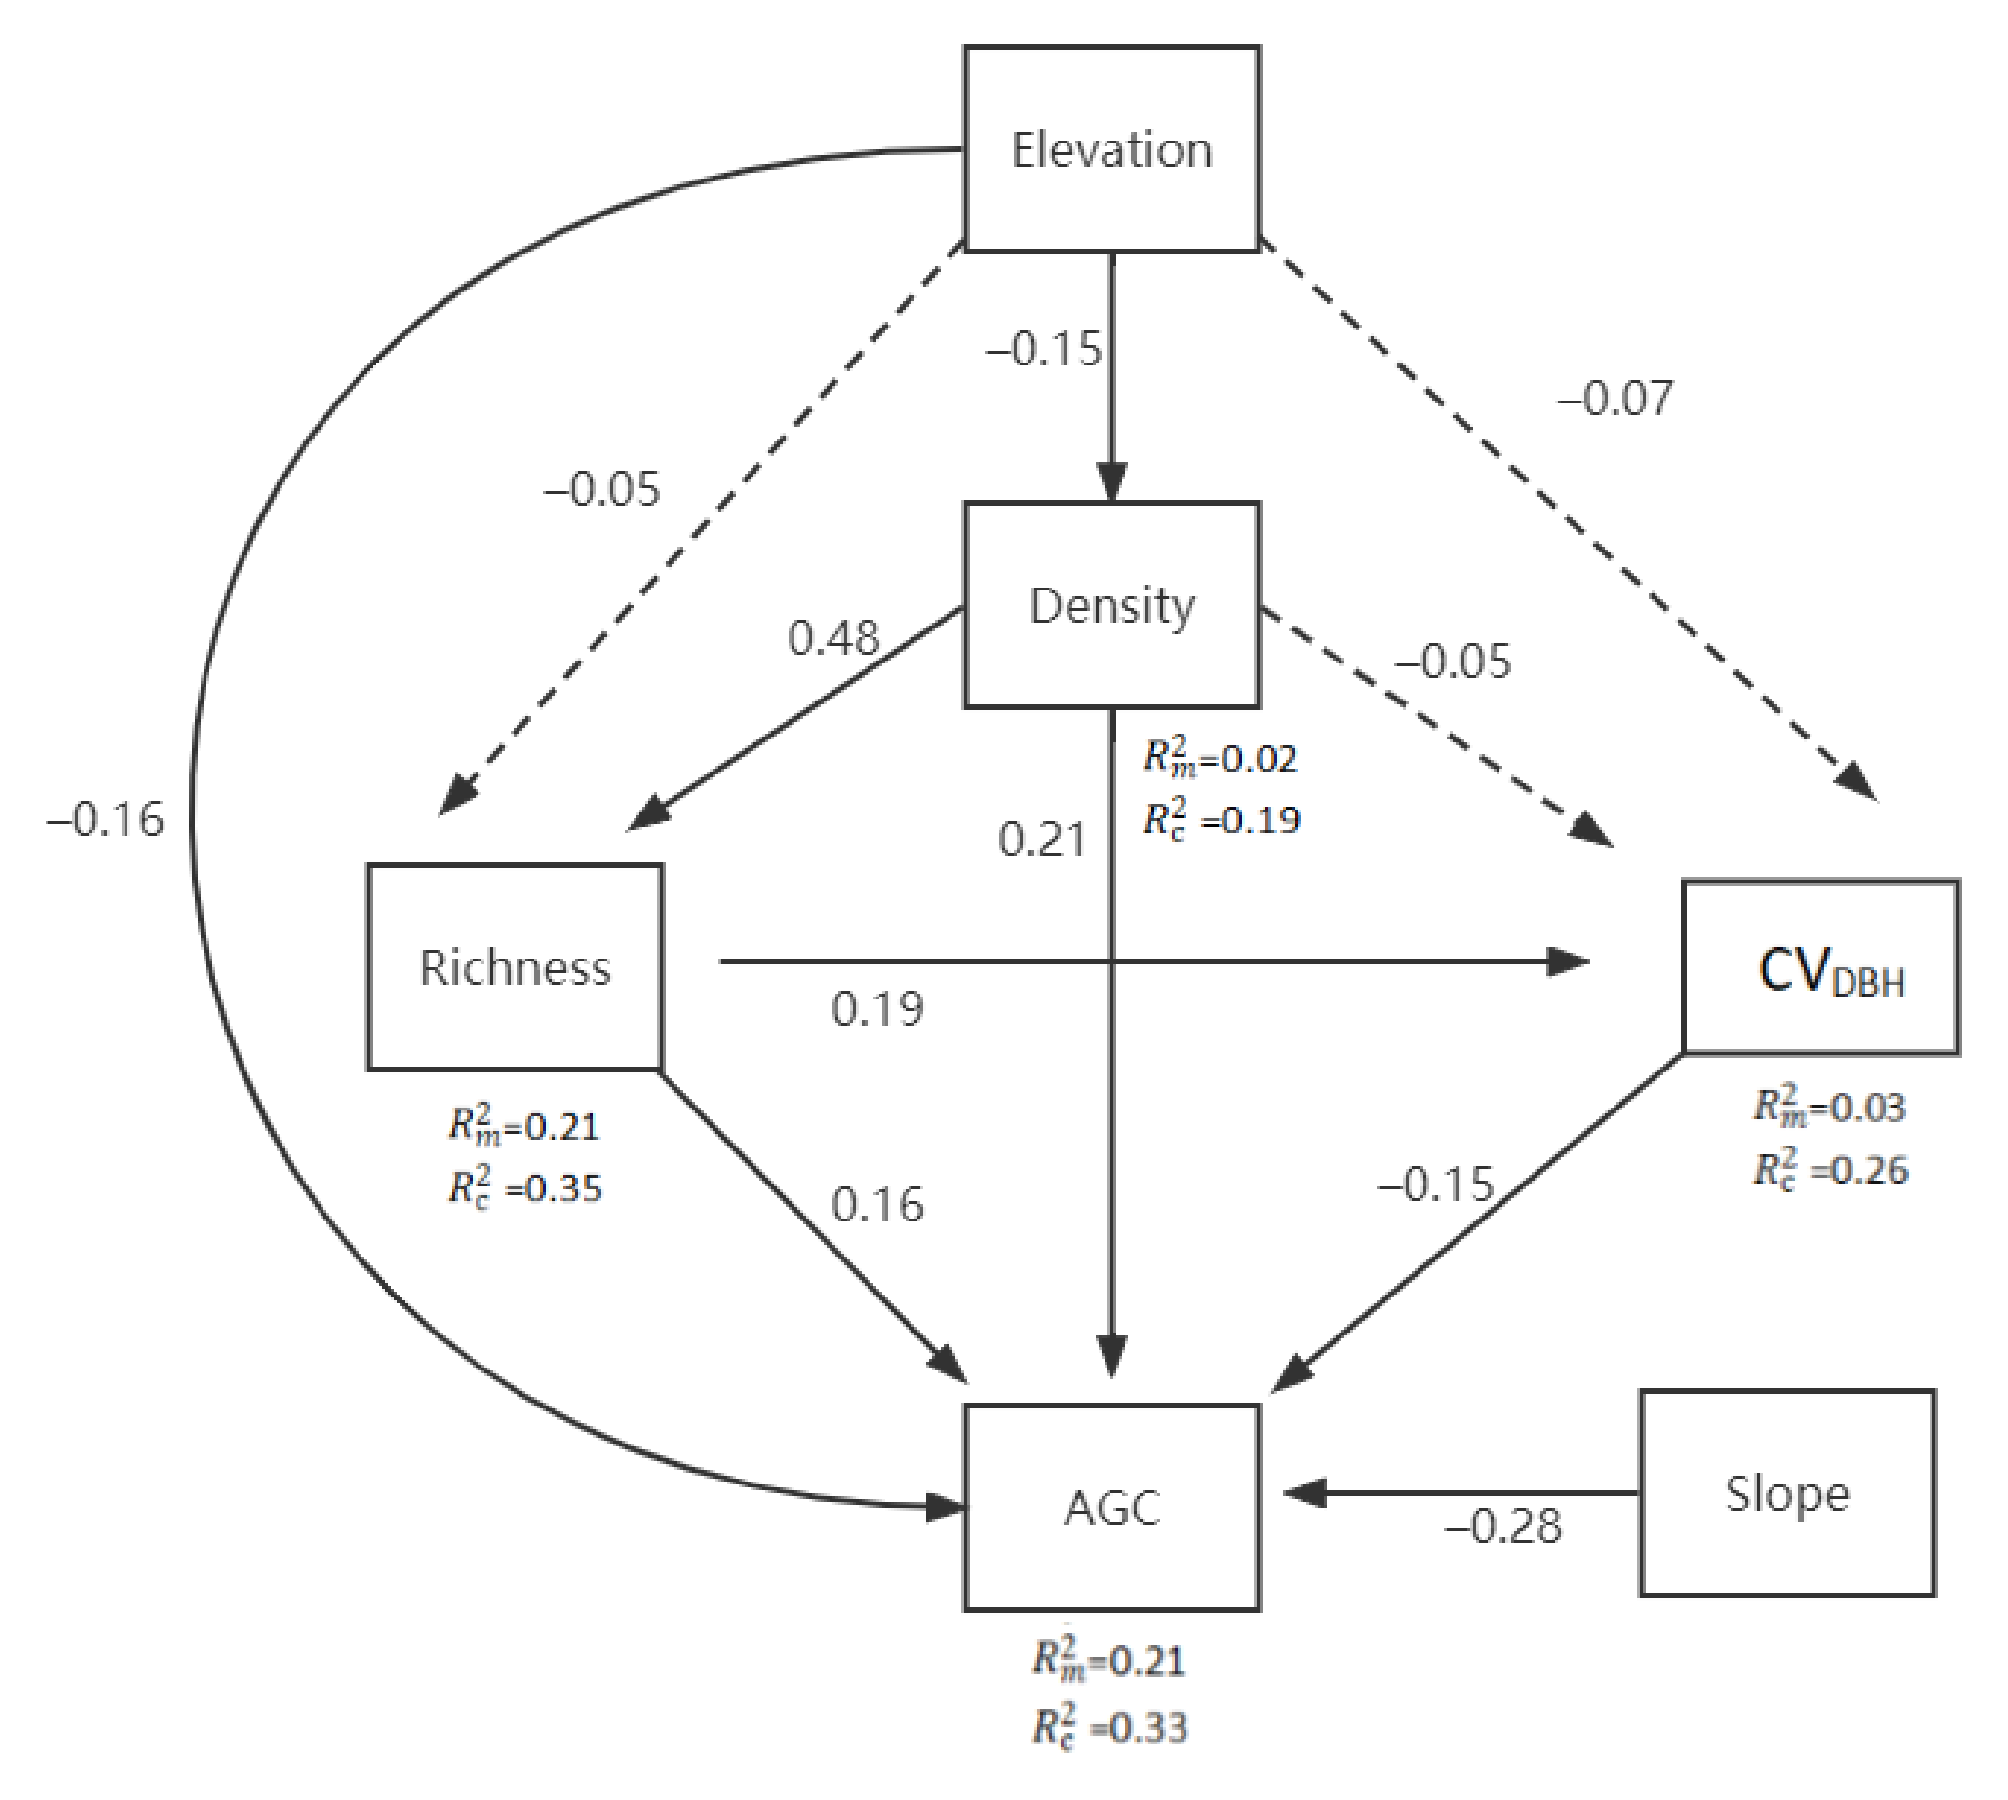
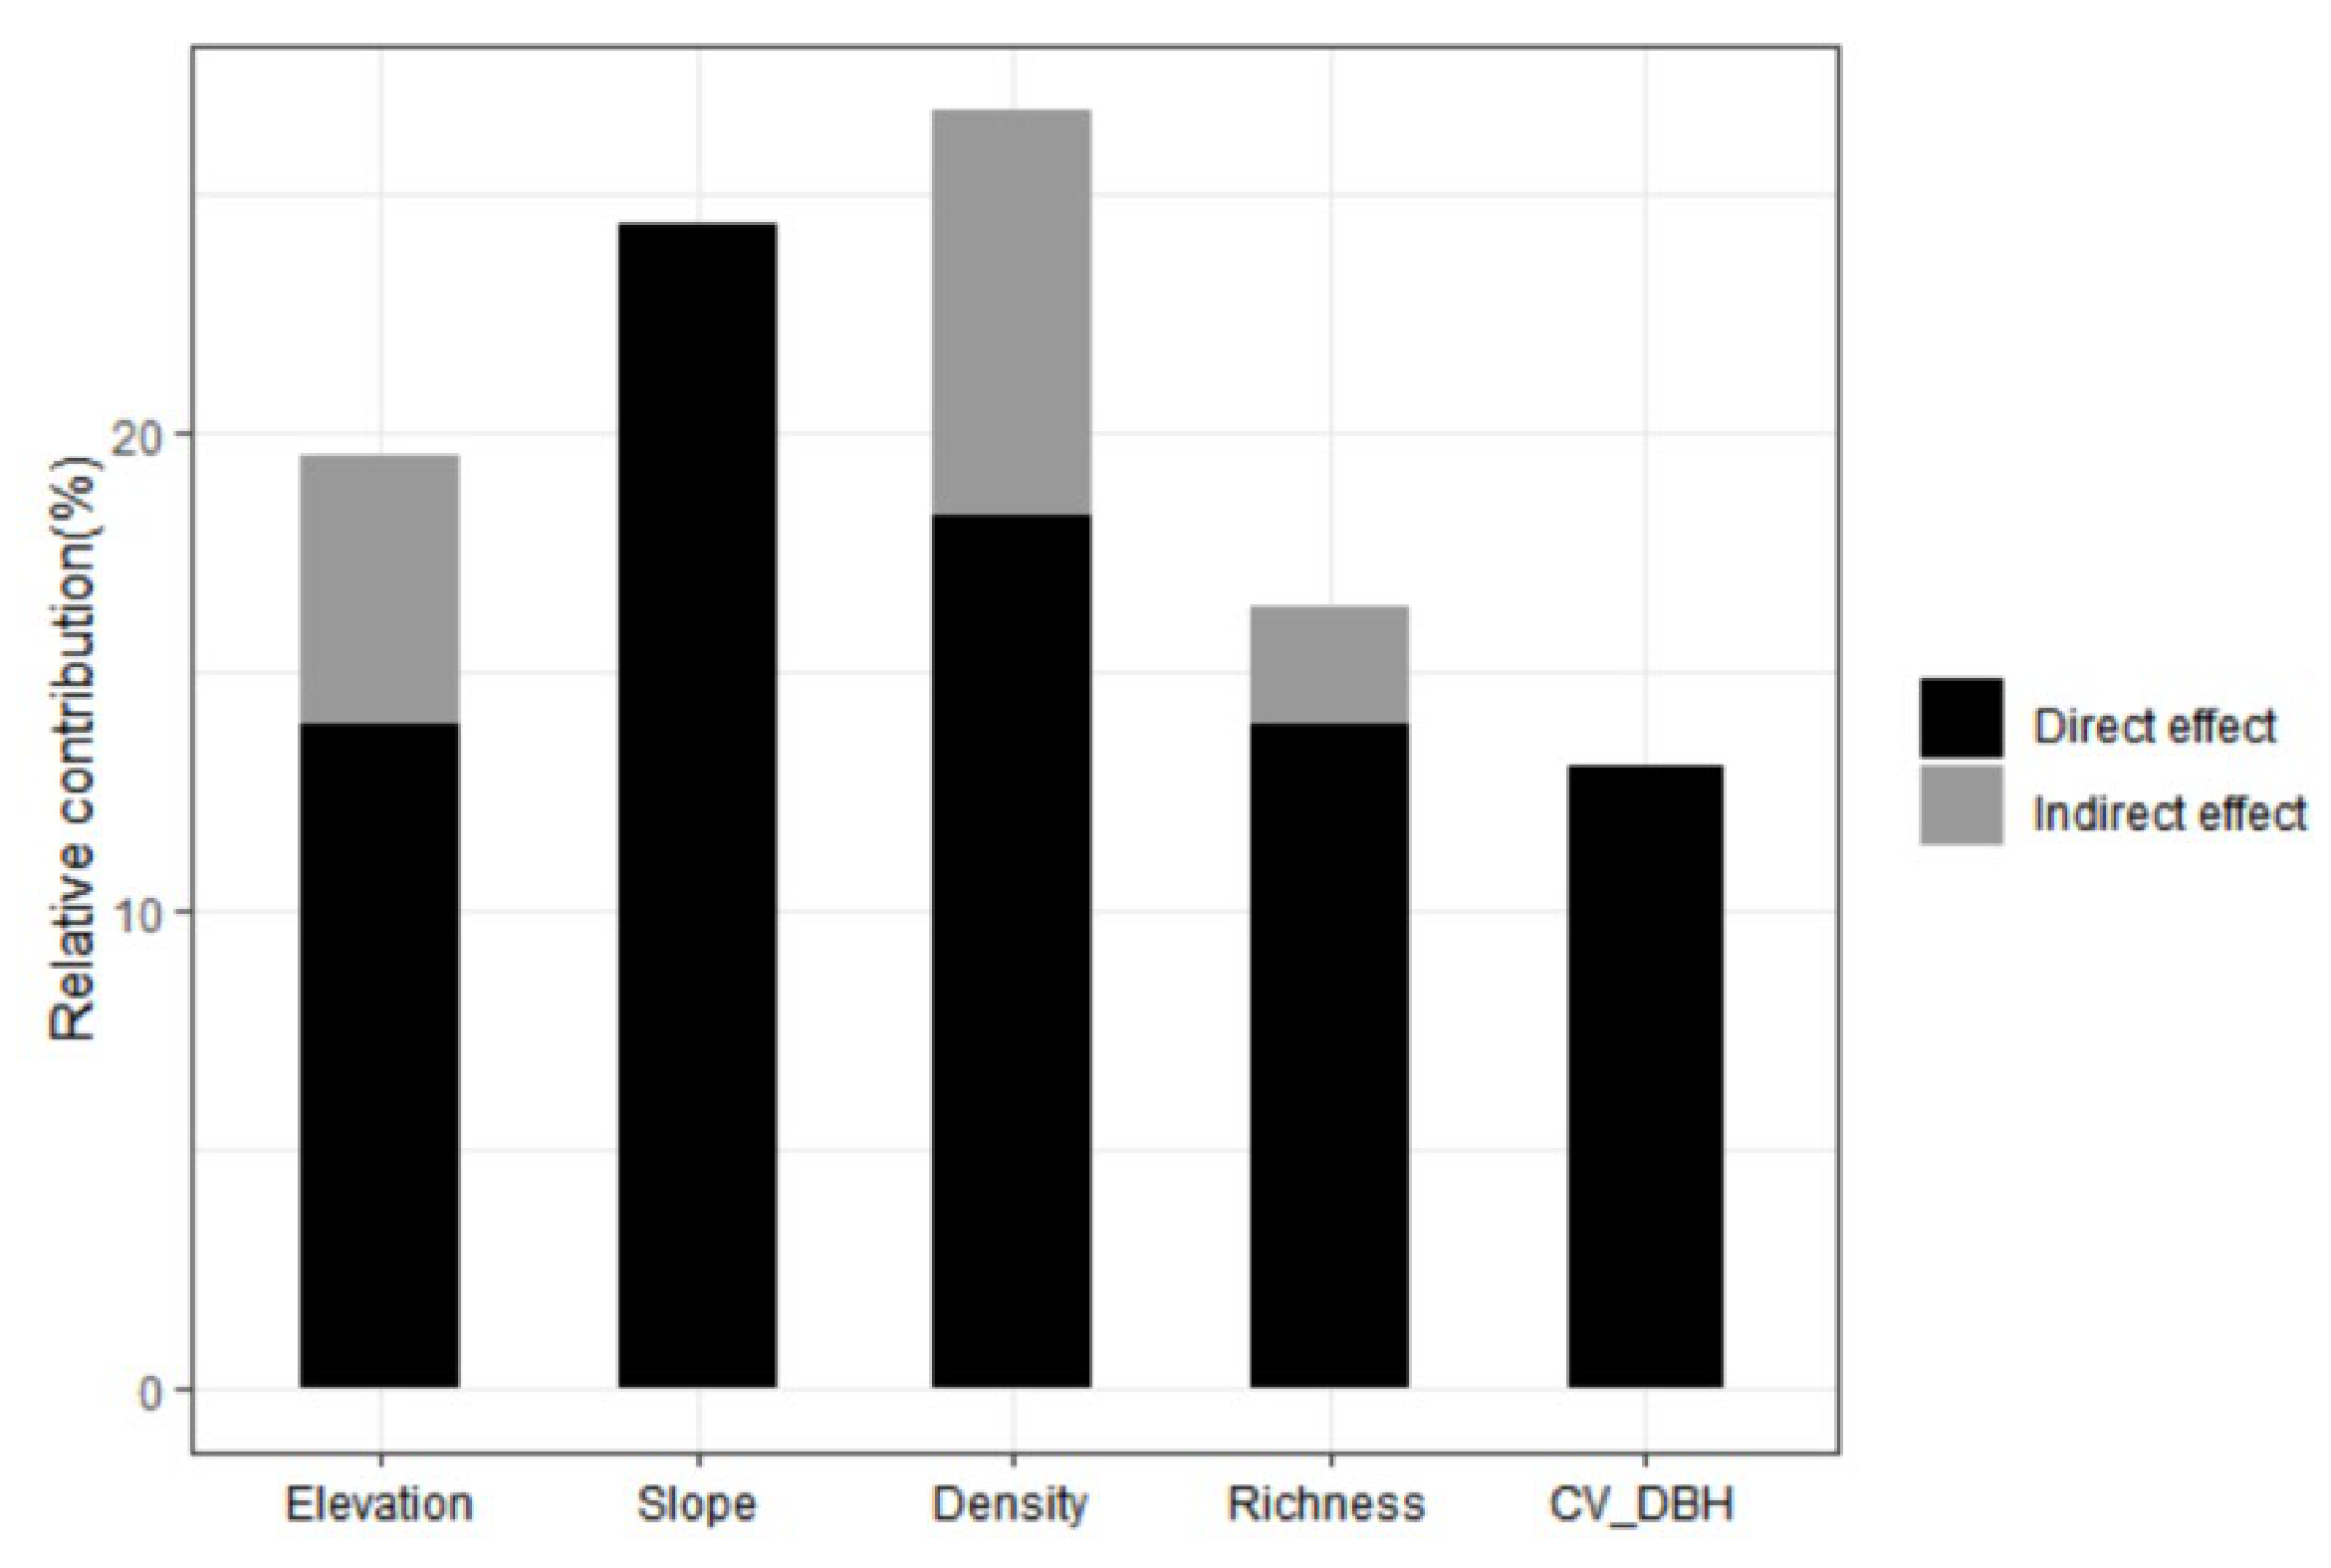
3.2. Effects of Predictors on AGC Storage
4. Discussion
5. Conclusions
Author Contributions
Funding
Data Availability Statement
Acknowledgments
Conflicts of Interest
Appendix A

| Species | Equation | References |
|---|---|---|
| Abies holophylla | agb = 1000 × 0.0737 × (dbh)2.51264 | Chen and Zhu 1989 |
| Abies nephrolepis | agb = 1000 × 0.0737 × (dbh)2.51264 | Chen and Zhu 1989 |
| Acer pictum subsp. mono | agb = 10(1.930+2.535×log10(dbh)) | Wang et al. 2006 |
| Betula platyphylla | agb = 10(2.159+2.367×log10(dbh)) | Wang et al. 2006 |
| Betula costata | agb = 10(2.214+2.400×log10(dbh)) | Wang et al. 2006 |
| Carpinus cordata | agb = 1000 × 0.09802 × (dbh)2.2993 | Chen and Zhu 1989 |
| Fraxinus chinensis subsp. rhynchophylla | agb = 10(2.213+2.417×log10(dbh)) | Wang et al. 2006 |
| Fraxinus mandshurica | agb = 10(2.216+2.408×log10(dbh)) | Wang et al. 2006 |
| Juglans mandshurica | agb = 10(2.235+2.287×log10(dbh)) | Wang et al. 2006 |
| Larix gmelinii | agb = 10(1.997+2.451×log10(dbh)) | Wang et al. 2006 |
| Maackia amurensis | agb = 1000 × 0.0737 × (dbh)2.51264 | Chen and Zhu 1989 |
| Phellodendron amurense | agb = 10(1.942+2.232×log10(dbh)) | Wang et al. 2006 |
| Picea jezoensis var. komarovii | agb = 1000 × 0.0744 × (dbh)2.5411 | Chen and Zhu 1989 |
| Picea koraiensis | agb = 1000 × 0.0744 × (dbh)2.5411 | Chen and Zhu 1989 |
| Pinus koraiensis | agb = 10 (2.236+2.144×log10(dbh)) | Wang et al. 2006 |
| Populus davidiana | agb = 10(1.826+2.558×log10(dbh)) | Wang et al. 2006 |
| Quercus mongolica | agb = 10(2.002+2.456×log10(dbh)) | Wang et al. 2006 |
| Taxus cuspidata | agb = 1000 × 0.0737×(dbh)2.51264 | Chen and Zhu 1989 |
| Tilia amurensis | agb = 10(1.606+2.668×log10(dbh)) | Wang et al. 2006 |
| Tilia mandshurica | agb = 10(1.606+2.668×log10(dbh)) | Wang et al.2006 |
| Ulmus davidiana | agb = 1000 × 0.09802 × (dbh)2.2993 | Chen and Zhu 1989 |
| Ulmus laciniata | agb = 1000 × 0.09802 × (dbh)2.2993 | Chen and Zhu 1989 |
| Ulmus macrocarpa | agb = 1000 × 0.09802 × (dbh)2.2993 | Chen and Zhu 1989 |
| Other species | agb = 10(1.826+2.558×log10(dbh)) | Chen and Zhu 1989 |
| Species | Carbon Content |
|---|---|
| Acer pictum subsp. mono | 0.4456 |
| Populus davidiana | 0.4877 |
| Tilia amurensis | 0.4944 |
| Ulmus davidiana | 0.3859 |
| Betula costata | 0.4976 |
| Betula platyphylla | 0.4508 |
| Quercus mongolica | 0.4840 |
| Fraxinus mandshurica | 0.4537 |
| Maackia amurensis | 0.4553 |
| Pinus koraiensis | 0.5339 |
| Larix gmelinii | 0.5079 |
| Other coniferous tree species | 0.5166 |
| Other broad-leaved tree species | 0.4609 |
| Species | Parameters | |||||
|---|---|---|---|---|---|---|
| a | b | c | h1 | h2 | h3 | |
| Larix olgensis | 8.47 × 10⁻⁵ | 1.97 | 0.75 | 34.59 | 650.53 | 18.0 |
| Pinus koraiensis | 7.62 × 10⁻⁵ | 1.90 | 0.86 | 21.84 | 309.16 | 14.0 |
| Abies nephrolepis | 5.79 × 10⁻⁵ | 1.89 | 0.99 | 46.40 | 2137.92 | 47.0 |
| Picea jezoensis var. komarovii | 5.79 × 10⁻⁵ | 1.89 | 0.99 | 46.40 | 2137.92 | 47.0 |
| Acer pictum subsp. mono | 4.88 × 10⁻⁵ | 1.84 | 1.05 | 24.82 | 402.09 | 16.3 |
| Fraxinus mandshurica | 5.33 × 10⁻⁵ | 1.88 | 1.00 | 29.44 | 468.93 | 15.7 |
| Phellodendron amurense | 5.33 × 10⁻⁵ | 1.88 | 1.00 | 29.44 | 468.93 | 15.7 |
| Betula platyphylla | 5.33 × 10⁻⁵ | 1.88 | 1.00 | 29.44 | 468.93 | 15.7 |
| Tilia amurensis | 5.33 × 10⁻⁵ | 1.88 | 1.00 | 29.44 | 468.93 | 15.7 |
| Betula costata | 5.33 × 10⁻⁵ | 1.88 | 1.00 | 29.44 | 468.93 | 15.7 |
| Populus ussuriensis | 5.33 × 10⁻⁵ | 1.88 | 1.00 | 29.44 | 468.93 | 15.7 |
| Ulmus pumila | 5.33 × 10⁻⁵ | 1.88 | 1.00 | 29.44 | 468.93 | 15.7 |
| Ulmus davidiana | 5.33 × 10⁻⁵ | 1.88 | 1.00 | 29.44 | 468.93 | 15.7 |
| Taxus cuspidata | 7.62 × 10⁻⁵ | 1.9 | 0.86 | 21.84 | 309.16 | 14 |
| Abies fabri | 7.62 × 10⁻⁵ | 1.9 | 0.86 | 21.84 | 309.16 | 14 |
| Quercus mongolica | 5.33 × 10⁻⁵ | 1.88 | 1 | 29.44 | 468.93 | 15.7 |
| Populus davidiana | 5.33 × 10⁻⁵ | 1.88 | 1 | 29.44 | 468.93 | 15.7 |
| Other coniferous tree species | 7.62 × 10⁻⁵ | 1.9 | 0.86 | 21.84 | 309.16 | 14 |
| Other broad-leaved tree species | 5.33 × 10⁻⁵ | 1.88 | 1 | 29.44 | 468.93 | 15.7 |
References
- Dixon, R.K.; Solomon, A.; Brown, S.; Houghton, R.; Trexier, M.; Wisniewski, J. Carbon pools and flux of global forest ecosystems. Science 1994, 263, 185–190. [Google Scholar] [CrossRef] [PubMed]
- Tetemke, B.A.; Birhane, E.; Rannestad, M.M.; Eid, T. Species diversity and stand structural diversity of woody plants predominantly determine aboveground carbon stock of a dry Afromontane forest in Northern Ethiopia. For. Ecol. Manag. 2021, 500, 119634. [Google Scholar] [CrossRef]
- Khan, M.N.I.; Shil, M.C.; Azad, M.S.; Sadath, M.N.; Feroz, S.; Mollick, A.S. Allometric relationships of stem volume and stand level carbon stocks at varying stand density in Swietenia macrophylla King plantations, Bangladesh. For. Ecol. Manag. 2018, 430, 639–648. [Google Scholar] [CrossRef]
- Fortuny, X.; Chauchard, S.; Carcaillet, C. Confounding legacies of land uses and land-form pattern on the regional vegetation structure and diversity of Mediterranean montane forests. For. Ecol. Manag. 2017, 384, 268–278. [Google Scholar] [CrossRef]
- Wright, D.H. Species-energy theory: An extension of species-area theory. Oikos 1983, 41, 496–506. [Google Scholar] [CrossRef] [Green Version]
- Brown, J.H. Why are there so many species in the tropics? J. Biogeogr. 2014, 41, 8–22. [Google Scholar] [CrossRef] [PubMed] [Green Version]
- Ali, A.; Yan, E.-R. Relationships between biodiversity and carbon stocks in forest ecosystems: A systematic literature review. Trop. Ecol. 2017, 58, 1–14. [Google Scholar]
- Chun, J.-H.; Ali, A.; Lee, C.-B. Topography and forest diversity facets regulate overstory and understory aboveground biomass in a temperate forest of South Korea. Sci. Total Environ. 2020, 744, 140783. [Google Scholar] [CrossRef]
- Poorter, L.; van der Sande, M.T.; Thompson, J.; Arets, E.J.; Alarcón, A.; Álvarez-Sánchez, J.; Ascarrunz, N.; Balvanera, P.; Barajas-Guzmán, G.; Boit, A. Diversity enhances carbon storage in tropical forests. Glob. Ecol. Biogeogr. 2015, 24, 1314–1328. [Google Scholar] [CrossRef]
- Mensah, S.; Veldtman, R.; Assogbadjo, A.E.; Glèlè Kakaï, R.; Seifert, T. Tree species diversity promotes aboveground carbon storage through functional diversity and functional dominance. Ecol. Evol. 2016, 6, 7546–7557. [Google Scholar] [CrossRef]
- Amara, E.; Heiskanen, J.; Aynekulu, E.; Pellikka, P.K. Relationship between carbon stocks and tree species diversity in a humid Guinean savanna landscape in northern Sierra Leone. South. For. J. For. Sci. 2019, 81, 235–245. [Google Scholar] [CrossRef] [Green Version]
- Sharma, C.M.; Baduni, N.P.; Gairola, S.; Ghildiyal, S.K.; Suyal, S. Tree diversity and carbon stocks of some major forest types of Garhwal Himalaya, India. For. Ecol. Manag. 2010, 260, 2170–2179. [Google Scholar] [CrossRef]
- Merlin, M.; Perot, T.; Perret, S.; Korboulewsky, N.; Vallet, P. Effects of stand composition and tree size on resistance and resilience to drought in sessile oak and Scots pine. For. Ecol. Manag. 2015, 339, 22–33. [Google Scholar] [CrossRef] [Green Version]
- Foster, J.R.; Finley, A.O.; D’Amato, A.W.; Bradford, J.B.; Banerjee, S. Predicting tree biomass growth in the temperate–boreal ecotone: Is tree size, age, competition, or climate response most important? Glob. Chang. Biol. 2016, 22, 2138–2151. [Google Scholar] [CrossRef]
- De Groote, S.R.; Vanhellemont, M.; Baeten, L.; Van den Bulcke, J.; Martel, A.; Bonte, D.; Lens, L.; Verheyen, K. Competition, tree age and size drive the productivity of mixed forests of pedunculate oak, beech and red oak. For. Ecol. Manag. 2018, 430, 609–617. [Google Scholar] [CrossRef]
- Zhang, Y.; Chen, H.Y. Individual size inequality links forest diversity and above-ground biomass. J. Ecol. 2015, 103, 1245–1252. [Google Scholar] [CrossRef]
- Yachi, S.; Loreau, M. Does complementary resource use enhance ecosystem functioning? A model of light competition in plant communities. Ecol. Lett. 2007, 10, 54–62. [Google Scholar] [CrossRef]
- Morin, X. Species richness promotes canopy packing: A promising step towards a better understanding of the mechanisms driving the diversity effects on forest functioning. Funct. Ecol. 2015, 29, 993–994. [Google Scholar] [CrossRef] [Green Version]
- Fotis, A.T.; Murphy, S.J.; Ricart, R.D.; Krishnadas, M.; Whitacre, J.; Wenzel, J.W.; Queenborough, S.A.; Comita, L.S. Above-ground biomass is driven by mass-ratio effects and stand structural attributes in a temperate deciduous forest. J. Ecol. 2018, 106, 561–570. [Google Scholar] [CrossRef]
- Sullivan, M.J.; Talbot, J.; Lewis, S.L.; Phillips, O.L.; Qie, L.; Begne, S.K.; Chave, J.; Cuni-Sanchez, A.; Hubau, W.; Lopez-Gonzalez, G. Diversity and carbon storage across the tropical forest biome. Sci. Rep. 2017, 7, 39102. [Google Scholar] [CrossRef] [Green Version]
- Li, Y.; Bao, W.; Bongers, F.; Chen, B.; Chen, G.; Guo, K.; Jiang, M.; Lai, J.; Lin, D.; Liu, C. Drivers of tree carbon storage in subtropical forests. Sci. Total Environ. 2019, 654, 684–693. [Google Scholar] [CrossRef]
- Scholten, T.; Goebes, P.; Kühn, P.; Seitz, S.; Assmann, T.; Bauhus, J.; Bruelheide, H.; Buscot, F.; Erfmeier, A.; Fischer, M. On the combined effect of soil fertility and topography on tree growth in subtropical forest ecosystems—A study from SE China. J. Plant Ecol. 2017, 10, 111–127. [Google Scholar] [CrossRef]
- Zekeng, J.C.; van der Sande, M.T.; Fobane, J.L.; Sebego, R.; Mphinyane, W.N.; Ebanga, P.A.; Mbolo, M. Environmental, structural and taxonomic diversity factors drive aboveground carbon stocks in a semi-deciduous tropical rainforest strata in Cameroon. bioRxiv 2021. [Google Scholar] [CrossRef]
- Boerner, R.J. Unraveling the Gordian Knot: Interactions among vegetation, topography, and soil properties in the central and southern Appalachians. J. Torrey Bot. Soc. 2006, 133, 321–361. [Google Scholar] [CrossRef]
- Liu, N.; Nan, H. Carbon stocks of three secondary coniferous forests along an altitudinal gradient on Loess Plateau in inland China. PLoS ONE 2018, 13, e0196927. [Google Scholar] [CrossRef] [Green Version]
- Khan, F.; Hayat, Z.; Ahmad, W.; Ramzan, M.; Shah, Z.; Sharif, M.; Mian, I.A.; Hanif, M. Effect of slope position on physico-chemical properties of eroded soil. Soil Environ. 2013, 32, 22–28. [Google Scholar]
- Liu, L.; Zeng, F.; Song, T.; Wang, K.; Du, H. Stand structure and abiotic factors modulate karst forest biomass in Southwest China. Forests 2020, 11, 443. [Google Scholar] [CrossRef] [Green Version]
- Liu, R.; Pan, Y.; Bao, H.; Liang, S.; Jiang, Y.; Tu, H.; Nong, J.; Huang, W. Variations in Soil Physico-Chemical Properties along Slope Position Gradient in Secondary Vegetation of the Hilly Region, Guilin, Southwest China. Sustainability 2020, 12, 1303. [Google Scholar] [CrossRef] [Green Version]
- Wubie, M.A.; Assen, M. Effects of land cover changes and slope gradient on soil quality in the Gumara watershed, Lake Tana basin of North–West Ethiopia. Model. Earth Syst. Environ. 2020, 6, 85–97. [Google Scholar] [CrossRef] [Green Version]
- Paquette, A.; Messier, C. The effect of biodiversity on tree productivity: From temperate to boreal forests. Glob. Ecol. Biogeogr. 2011, 20, 170–180. [Google Scholar] [CrossRef] [Green Version]
- Cuni-Sanchez, A.; Pfeifer, M.; Marchant, R.; Calders, K.; Sørensen, C.L.; Pompeu, P.V.; Lewis, S.L.; Burgess, N.D. New insights on above ground biomass and forest attributes in tropical montane forests. For. Ecol. Manag. 2017, 399, 235–246. [Google Scholar] [CrossRef] [Green Version]
- Kaushal, S.; Baishya, R. Stand structure and species diversity regulate biomass carbon stock under major Central Himalayan forest types of India. Ecol. Processes 2021, 10, 14. [Google Scholar] [CrossRef]
- Dimobe, K.; Kuyah, S.; Dabré, Z.; Ouédraogo, A.; Thiombiano, A. Diversity-carbon stock relationship across vegetation types in W National park in Burkina Faso. For. Ecol. Manag. 2019, 438, 243–254. [Google Scholar] [CrossRef]
- Ali, A.; Yan, E.-R.; Chen, H.Y.; Chang, S.X.; Zhao, Y.-T.; Yang, X.-D.; Xu, M.-S. Stand structural diversity rather than species diversity enhances aboveground carbon storage in secondary subtropical forests in Eastern China. Biogeosciences 2016, 13, 4627–4635. [Google Scholar] [CrossRef] [Green Version]
- Ning, Y.-C.; Zheng, X.-X. Forest Health Assessment in the Jingouling Forest Farm of Changbai Mountain Based on GIS and RS. Adv. J. Food Sci. Technol. 2014, 6, 408–412. [Google Scholar]
- Chen, C.; Zhu, J. Biomass Manual of Main Trees in Northeastern China; China Forestry Press: Beijing, China, 1989. [Google Scholar]
- Wang, C. Biomass allometric equations for 10 co-occurring tree species in Chinese temperate forests. For. Ecol. Manag. 2006, 222, 9–16. [Google Scholar] [CrossRef]
- Lu, L.; Yuan, L.; Fan, C.; Zheng, J.; Guo, Z. On carbon sequestration rates and differences of main tree species in Changbai Mountain forest area. J. Beihua Univ. 2018, 19, 164–169. [Google Scholar]
- Chu, C.J.; Weiner, J.; Maestre, F.T.; Xiao, S.; Wang, Y.S.; Li, Q.; Yuan, J.L.; Zhao, L.Q.; Ren, Z.W.; Wang, G. Positive interactions can increase size inequality in plant populations. J. Ecol. 2009, 97, 1401–1407. [Google Scholar] [CrossRef]
- Moreau, G.; Auty, D.; Pothier, D.; Shi, J.; Lu, J.; Achim, A.; Xiang, W. Long-term tree and stand growth dynamics after thinning of various intensities in a temperate mixed forest. For. Ecol. Manag. 2020, 473, 118311. [Google Scholar] [CrossRef]
- Fox, J.; Monette, G. Generalized collinearity diagnostics. J. Am. Stat. Assoc. 1992, 87, 178–183. [Google Scholar] [CrossRef]
- Fox, J. Applied Regression Analysis and Generalized Linear Models; Sage Publications: Thousand Oaks, CA, USA, 2015. [Google Scholar]
- Lefcheck, J.S. piecewiseSEM: Piecewise structural equation modelling in r for ecology, evolution, and systematics. Methods Ecol. Evol. 2016, 7, 573–579. [Google Scholar] [CrossRef]
- Galicia, L.; López-Blanco, J.; Zarco-Arista, A.; Filips, V.; Garcıa-Oliva, F. The relationship between solar radiation interception and soil water content in a tropical deciduous forest in Mexico. Catena 1999, 36, 153–164. [Google Scholar] [CrossRef]
- Vayreda, J.; Gracia, M.; Canadell, J.G.; Retana, J. Spatial patterns and predictors of forest carbon stocks in Western Mediterranean. Ecosystems 2012, 15, 1258–1270. [Google Scholar] [CrossRef] [Green Version]
- Ullah, F.; Gilani, H.; Sanaei, A.; Hussain, K.; Ali, A. Stand structure determines aboveground biomass across temperate forest types and species mixture along a local-scale elevational gradient. For. Ecol. Manag. 2021, 486, 118984. [Google Scholar] [CrossRef]
- Ruiz-Benito, P.; Gómez-Aparicio, L.; Paquette, A.; Messier, C.; Kattge, J.; Zavala, M.A. Diversity increases carbon storage and tree productivity in S panish forests. Glob. Ecol. Biogeogr. 2014, 23, 311–322. [Google Scholar] [CrossRef]
- Mensah, S.; Noulekoun, F.; Ago, E.E. Aboveground tree carbon stocks in West African semi-arid ecosystems: Dominance patterns, size class allocation and structural drivers. Glob. Ecol. Conserv. 2020, 24, e01331. [Google Scholar] [CrossRef]
- Mensah, S.; Salako, V.K.; Seifert, T. Structural complexity and large-sized trees explain shifting species richness and carbon relationship across vegetation types. Funct. Ecol. 2020, 34, 1731–1745. [Google Scholar] [CrossRef]
- Díaz, S.; Lavorel, S.; de Bello, F.; Quétier, F.; Grigulis, K.; Robson, T.M. Incorporating plant functional diversity effects in ecosystem service assessments. Proc. Natl. Acad. Sci. USA 2007, 104, 20684–20689. [Google Scholar] [CrossRef] [Green Version]
- Forrester, D.I.; Bauhus, J. A review of processes behind diversity—productivity relationships in forests. Curr. For. Rep. 2016, 2, 45–61. [Google Scholar] [CrossRef] [Green Version]
- Weiner, J. Neighbourhood interference amongst Pinus rigida individuals. J. Ecol. 1984, 72, 183–195. [Google Scholar] [CrossRef]
- Bourdier, T.; Cordonnier, T.; Kunstler, G.; Piedallu, C.; Lagarrigues, G.; Courbaud, B. Tree size inequality reduces forest productivity: An analysis combining inventory data for ten European species and a light competition model. PLoS ONE 2016, 11, e0151852. [Google Scholar] [CrossRef]
- Jucker, T.; Bouriaud, O.; Coomes, D.A. Crown plasticity enables trees to optimize canopy packing in mixed-species forests. Funct. Ecol. 2015, 29, 1078–1086. [Google Scholar] [CrossRef] [Green Version]
- Chu, C.; Lutz, J.A.; Král, K.; Vrška, T.; Yin, X.; Myers, J.A.; Abiem, I.; Alonso, A.; Bourg, N.; Burslem, D.F. Direct and indirect effects of climate on richness drive the latitudinal diversity gradient in forest trees. Ecol. Lett. 2019, 22, 245–255. [Google Scholar] [CrossRef] [Green Version]
- Schall, P.; Schulze, E.-D.; Fischer, M.; Ayasse, M.; Ammer, C. Relations between forest management, stand structure and productivity across different types of Central European forests. Basic Appl. Ecol. 2018, 32, 39–52. [Google Scholar] [CrossRef]
- Reich, P.B.; Bakken, P.; Carlson, D.; Frelich, L.E.; Friedman, S.K.; Grigal, D.F. Influence of logging, fire, and forest type on biodiversity and productivity in southern boreal forests. Ecology 2001, 82, 2731–2748. [Google Scholar] [CrossRef]
- Phillips, O.L.; Sullivan, M.J.; Baker, T.R.; Monteagudo Mendoza, A.; Vargas, P.N.; Vásquez, R. Species matter: Wood density influences tropical forest biomass at multiple scales. Surv. Geophys. 2019, 40, 913–935. [Google Scholar] [CrossRef] [Green Version]
- Bradford, J.B.; Fraver, S.; Milo, A.M.; D’Amato, A.W.; Palik, B.; Shinneman, D.J. Effects of multiple interacting disturbances and salvage logging on forest carbon stocks. For. Ecol. Manag. 2012, 267, 209–214. [Google Scholar] [CrossRef]
- Russell, M.B.; D’Amato, A.W.; Albers, M.A.; Woodall, C.W.; Puettmann, K.J.; Saunders, M.R.; VanderSchaaf, C.L. Performance of the Forest Vegetation Simulator in managed white spruce plantations influenced by eastern spruce budworm in northern Minnesota. For. Sci. 2015, 61, 723–730. [Google Scholar] [CrossRef]
- Khan, M.N.I.; Islam, M.R.; Rahman, A.; Azad, M.S.; Mollick, A.S.; Kamruzzaman, M.; Sadath, M.N.; Feroz, S.; Rakkibu, M.G.; Knohl, A. Allometric relationships of stand level carbon stocks to basal area, tree height and wood density of nine tree species in Bangladesh. Glob. Ecol. Conserv. 2020, 22, e01025. [Google Scholar] [CrossRef]

| Forest Type | Classification Standard | Number |
|---|---|---|
| Coniferous forest | Single coniferous tree species ≥ 65% of total volume | 11 |
| Coniferous mixed forest | Coniferous species ≥ 65% of total volume | 125 |
| Broad-leaved mixed forest | Broad-leaved species ≥ 65% of total volume | 24 |
| Coniferous and broad-leaved mixed forest | Broad-leaved or coniferous species account for 35–65% | 46 |
| Forest Types | Variable | Mean | SD | Maximum | Minimum |
|---|---|---|---|---|---|
| Coniferous forest (n = 11) | AGC (Mg/ha) | 78.65 | 22.75 | 103.22 | 28.39 |
| Elevation(m) | 681.15 | 34.75 | 722.49 | 635.47 | |
| Slope (°) | 9.08 | 3.85 | 15.23 | 4.66 | |
| Stand density (n/ha) | 618.18 | 186.44 | 800 | 200 | |
| Species richness | 5.36 | 1.69 | 9.00 | 4.00 | |
| CVDBH (%) | 37.87 | 6.50 | 45.14 | 25.47 | |
| Coniferous mixed forest (n = 125) | AGC(Mg/ha) | 77.95 | 24.88 | 158.21 | 14.63 |
| Elevation (m) | 665.74 | 39.67 | 757.10 | 603.17 | |
| Slope (°) | 9.56 | 3.50 | 21.00 | 2.03 | |
| Stand density (n/ha) | 671.64 | 184.32 | 1125.00 | 200.00 | |
| Species richness | 6.81 | 1.48 | 10.00 | 3.00 | |
| CVDBH (%) | 53.78 | 12.63 | 94.84 | 29.82 | |
| Broad-leaved mixed forest (n = 24) | AGC (Mg/ha) | 62.83 | 27.67 | 132.85 | 17.90 |
| Elevation (m) | 709.13 | 52.14 | 778.55 | 597.79 | |
| Slope (°) | 10.22 | 4.38 | 20.79 | 3.60 | |
| Stand density (n/ha) | 875.23 | 390.68 | 1650.00 | 200.00 | |
| Species richness | 7.63 | 2.08 | 12.00 | 3.00 | |
| CVDBH (%) | 57.69 | 9.85 | 74.59 | 33.84 | |
| Coniferous and broad-leaved mixed forest (n = 46) | AGC (Mg/ha) | 61.11 | 23.42 | 123.64 | 10.85 |
| Elevation (m) | 693.81 | 44.99 | 783.09 | 600.24 | |
| Slope (°) | 9.52 | 3.84 | 16.70 | 2.01 | |
| Stand density (n/ha) | 713.47 | 282.14 | 1975.0 | 200.0 | |
| Species richness | 7.43 | 1.57 | 11.00 | 5.00 | |
| CVDBH (%) | 52.44 | 11.71 | 86.37 | 30.76 |
Publisher’s Note: MDPI stays neutral with regard to jurisdictional claims in published maps and institutional affiliations. |
© 2022 by the authors. Licensee MDPI, Basel, Switzerland. This article is an open access article distributed under the terms and conditions of the Creative Commons Attribution (CC BY) license (https://creativecommons.org/licenses/by/4.0/).
Share and Cite
Jia, B.; Guo, W.; He, J.; Sun, M.; Chai, L.; Liu, J.; Wang, X. Topography, Diversity, and Forest Structure Attributes Drive Aboveground Carbon Storage in Different Forest Types in Northeast China. Forests 2022, 13, 455. https://doi.org/10.3390/f13030455
Jia B, Guo W, He J, Sun M, Chai L, Liu J, Wang X. Topography, Diversity, and Forest Structure Attributes Drive Aboveground Carbon Storage in Different Forest Types in Northeast China. Forests. 2022; 13(3):455. https://doi.org/10.3390/f13030455
Chicago/Turabian StyleJia, Bo, Weiwei Guo, Jingyuan He, Minggang Sun, Lei Chai, Jiarong Liu, and Xinjie Wang. 2022. "Topography, Diversity, and Forest Structure Attributes Drive Aboveground Carbon Storage in Different Forest Types in Northeast China" Forests 13, no. 3: 455. https://doi.org/10.3390/f13030455
APA StyleJia, B., Guo, W., He, J., Sun, M., Chai, L., Liu, J., & Wang, X. (2022). Topography, Diversity, and Forest Structure Attributes Drive Aboveground Carbon Storage in Different Forest Types in Northeast China. Forests, 13(3), 455. https://doi.org/10.3390/f13030455