Article

Competitive Hierarchy Processes Support Mixed Species Regeneration in Strip-Cuts in the British Columbia Interior

Department of Renewable Resources, University of Alberta, 751 General Services Building, Edmonton, AB T6G 2H1, Canada
*
Author to whom correspondence should be addressed.
Forests 2022, 13(3), 379; https://doi.org/10.3390/f13030379
Submission received: 21 January 2022 / Revised: 22 February 2022 / Accepted: 23 February 2022 / Published: 25 February 2022
(This article belongs to the Section Forest Ecology and Management)

Abstract

:
Competitive exclusion can lead to a loss of species diversity within small forest gaps. Thus, it poses a potential concern for mixed species regeneration following strip-cut harvesting in the species rich interior moist forests of British Columbia. In this study, we compare nine tree species widely used in reforestation for their growth rates along a light/gap-position gradient in 50 m wide east-west oriented strip-cuts. Data after 15 growing seasons reveal that a crossover of species’ growth patterns along the light gradient can be linked to their shade tolerance ranking, and competitive hierarchy processes can be observed between species. The growth of two shade-intolerant (lodgepole pine and ponderosa pine), and two moderately tolerant (Douglas fir and white pine) species did surpass the growth of other more tolerant species under high light conditions in this study. Thus, we conclude that maintaining shade-intolerant species within 50 m wide strip-cuts is feasible, but species need to be planted in locations that suit their light requirements.

1. Introduction

Forests of the interior cedar hemlock (ICH) bio-geoclimatic zone in British Columbia are known for their complex stand structure and high species diversity. These forests can support up to 14 commercial tree species in a single stand, including very tolerant species such as western hemlock (Tsuga heterophylla (Raf.) Sarg.), and very shade-intolerant conifers, such as lodgepole pine (Pinus contorta Dougl. ex Loud. var. latifolia Engelm. Ex S. Wats.), western larch (Larix occidentalis Nutt.), and broadleaf species, such as paper birch (Betula papyrifera Marsh) and trembling aspen (Populus tremuloides Michx.). The majority of these forests occur in valley bottoms to mid-elevation in accessible locations, and are therefore valued by nearby communities for aesthetics and recreation, in addition to serving as a souce of readily accessible lumber [1,2].
Over the past four decades, forest management practices have been shifting toward a management approach where multiple economic, ecological, and social objectives are considered simultaneously. Under this approach, non-timber forest management objectives such as biodiversity and wildlife habitat, watershed properties, visual quality for recreation, and climate change resilience are included in forest management planning [3]. Shelterwood, selection or patch-cut harvesting, has the potential to meet many of these objectives, improving visual quality over clear-cutting, and can often be economically profitable while still providing ecological services [3]. One concern with these alternatives to clear-cut harvesting is the maintenance of species diversity after harvesting. Specifically, canopy openings created by these harvesting methods are often not sufficient to support regeneration of a mixture of shade tolerant, moderately tolerant, and intolerant species. In uniform shelterwood systems, where 25 to 50% of basal area is uniformly removed throughout the stand, conditions may not be suitable for regeneration of intolerant and moderately tolerant tree species due to the shade cast by the retained canopy [1]. However, group selection, patch-cut or strip-cut methods could be a possible solution [3,4,5]. In these systems, a small clear-cut is created in the canopy which leads to the creation of a light gradient inside the opening, with the southern edge receiving a higher proportion of diffuse light than the center or northern portion of the gaps, which typically receive a greater portion of direct sunlight in northern forests [6,7].
Strip-cut gaps are usually small in size (usually <1 ha), but the variability in light conditions that exists within these gaps can cause species to grow at different rates at different gap-positions depending on their tolerance to shade. Shade-intolerant species typically grow faster than shade-tolerant species in high light environments. In contrast, shade-tolerant species grow faster than intolerant species in light-limited environments. This trade-off in growth rates across the light gradient can cause species to be excluded or to differentiate into stratified mixtures, thus allowing a diverse group of species to coexist in temperate and tropical forests [8,9,10]. However, some exceptions to this generalization have been reported, with some studies reporting shade-intolerant species growing consistently better at all light environments, including low light [11,12,13] or growing poorly in the high light environments due to root competition from adjacent edge trees [4,14]. Consequently, an examination of species competitive hierarchy processes across the range of their shade tolerance can contribute to understanding the potential for mixed species regeneration within strip-cut gaps.
Furthermore, light is not the only growth limiting factor inside a gap. Previous studies have reported that soil moisture, nutrient availability, or temperature affect light-growth relationships, particularly in high light areas such as at the center or northern edge of gaps [15,16]. Therefore, for a more comprehensive understanding of mixed species’ regeneration in small-sized gaps, studies have also examined species’ gap–position–growth relationship [4,14,17]. This relationship can reveal critical information about species’ niche overlap (i.e., the lack of competitive hierarchy) within openings; thus, competitive eradication of a few species by others can be predicted [10,18]. Finally, the gap–position–growth relationship might be used as a tool in selecting a range of suitable species for strip-cut regeneration, and in guiding decisions on planting species at appropriate positions within the gap.
In this study, we present results from an experiment designed to inform mixed species reforestation and optimal planting positions in 50 m wide east-to-west oriented strip-cuts of ICH forests of British Columbia. Our primary objective is to identify shade intolerant species with sufficient growth rates in small openings. Specifically, we quantify growth rates over a light gradient for nine candidate species for reforestation, as well as growth rates over a north–south transect, which might further indicate species appropriate planting locations (i.e., within gap-partitioning). Finally, based on volume data at the end of 15 growing seasons, we aim to infer whether mixed species reforestation is feasible based on competitive hierarchy along the light gradient, or alternatively a gap-position gradient from the gap edge.

2. Methods

2.1. Study Area and Species

The study site is located on a level area in a valley bottom, 50 km south of Nakusp, British Columbia (Lat. 49°57′ N, Long. 117°53′ W, 550 m elevation), representing common site conditions for the interior cedar-hemlock of British Columbia [19]. The forest on site is an even-aged mature mixed species stand consisting of 53% Douglas fir, 25% western redcedar, 15% western larch, and 5% lodgepole pine and paper birch, with other species (including trembling aspen, balsam poplar (Populus balsamifera L. subsp. trichocarpa T. & G. ex Hook.), and western white pine (Pinus monticola Dougl. ex D. Don.) comprising the remainder. The dominant species are about 35 m tall, and the stand density is approximately 650 stems/ha. Climate conditions for the ICH zone are temperate, characterized by warm and relatively moist summers (~14 °C and ~150 mm) and cool and moist winters (−5 °C, ~400 mm).
We test nine species with a range of shade tolerance commonly occurring in the ICH, namely Douglas fir (Pseudotsuga menziesii (Mirb.) Franc.), Engelmann spruce (Picea engelmannii Parry ex Engelmann), western redcedar (Thuja plicata Donn ex D. Don in Lamb), western hemlock, western white pine, ponderosa pine (Pinus ponderosa (Dougl. ex P. & C. Lawson), lodgepole pine, subalpine fir (Abies lasiocarpa (Hook) Nutt.), and paper birch. Niinemets and Valladares [20] provide the following tolerance classification of these species: lodgepole pine, ponderosa pine, and paper birch are classified as the most intolerant, whereas Douglas fir and white pine as are defined as moderately tolerant, and western hemlock, western redcedar, subalpine-fir and Engelmann spruce as highly shade tolerant species (Table 1).

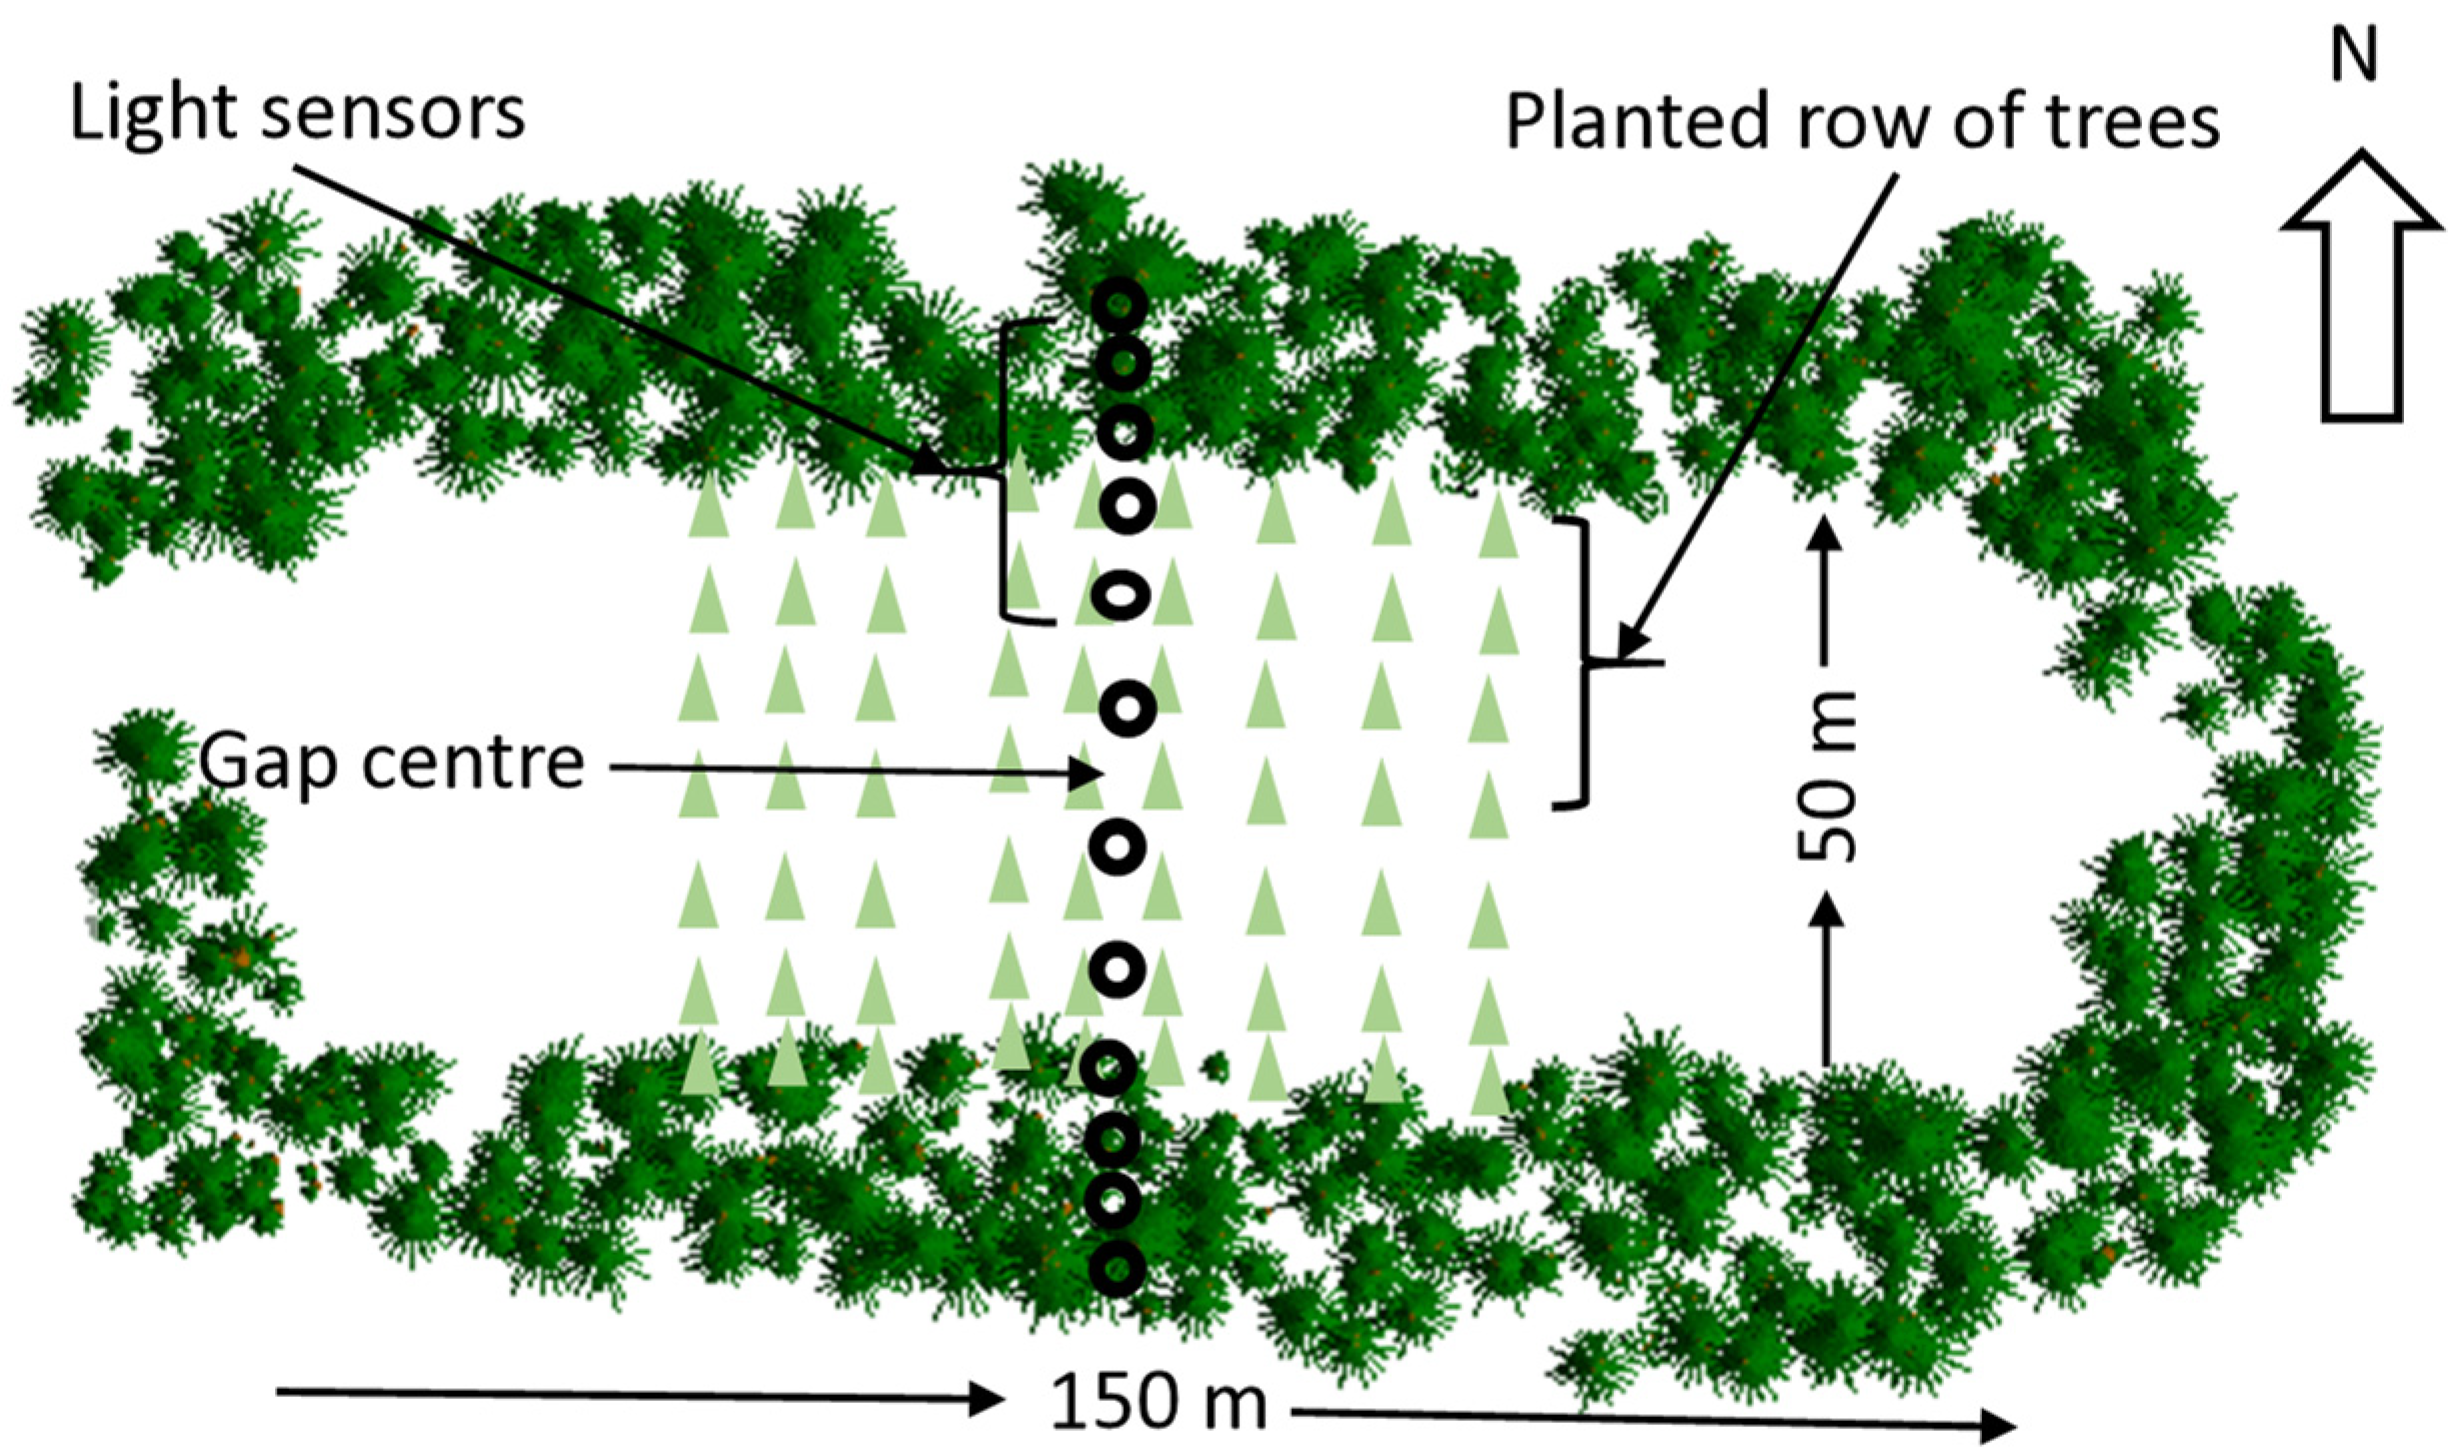
2.2. Experimental Design

Strip-cut harvesting in the mixed conifer stand took place during the winter of 1994 to 1995. The area was planted in the spring of 1995. Two small openings (<1 ha) were created with a size of 50 m × 150 m each, with the long axis oriented east to west (Figure 1, only one opening is shown). In total, 10 species were planted in rows with 3 replications that were positioned randomly, for a total of approximately 1000 individuals. In analyses, we used nine species and excluded western larch. Due to the poor survival of this species, there were insufficient number of larches available for measurement.
Trees were planted in single-species, north-south oriented rows, with each row 90 m long extending 20 m into the uncut stand south and north of the edge of each harvested block. Species rows were allocated randomly in an east-west direction, with three replications (three rows per species) in each block. Row-to-row spacing was 2.6 m and within each row seedlings were planted at a 3 m spacing. A 20-m wide unplanted buffer was maintained on both the east and west sides of each block. In total, approximately 1000 seedlings were evaluated in this study after approximately 20% mortality after 15 growing seasons.

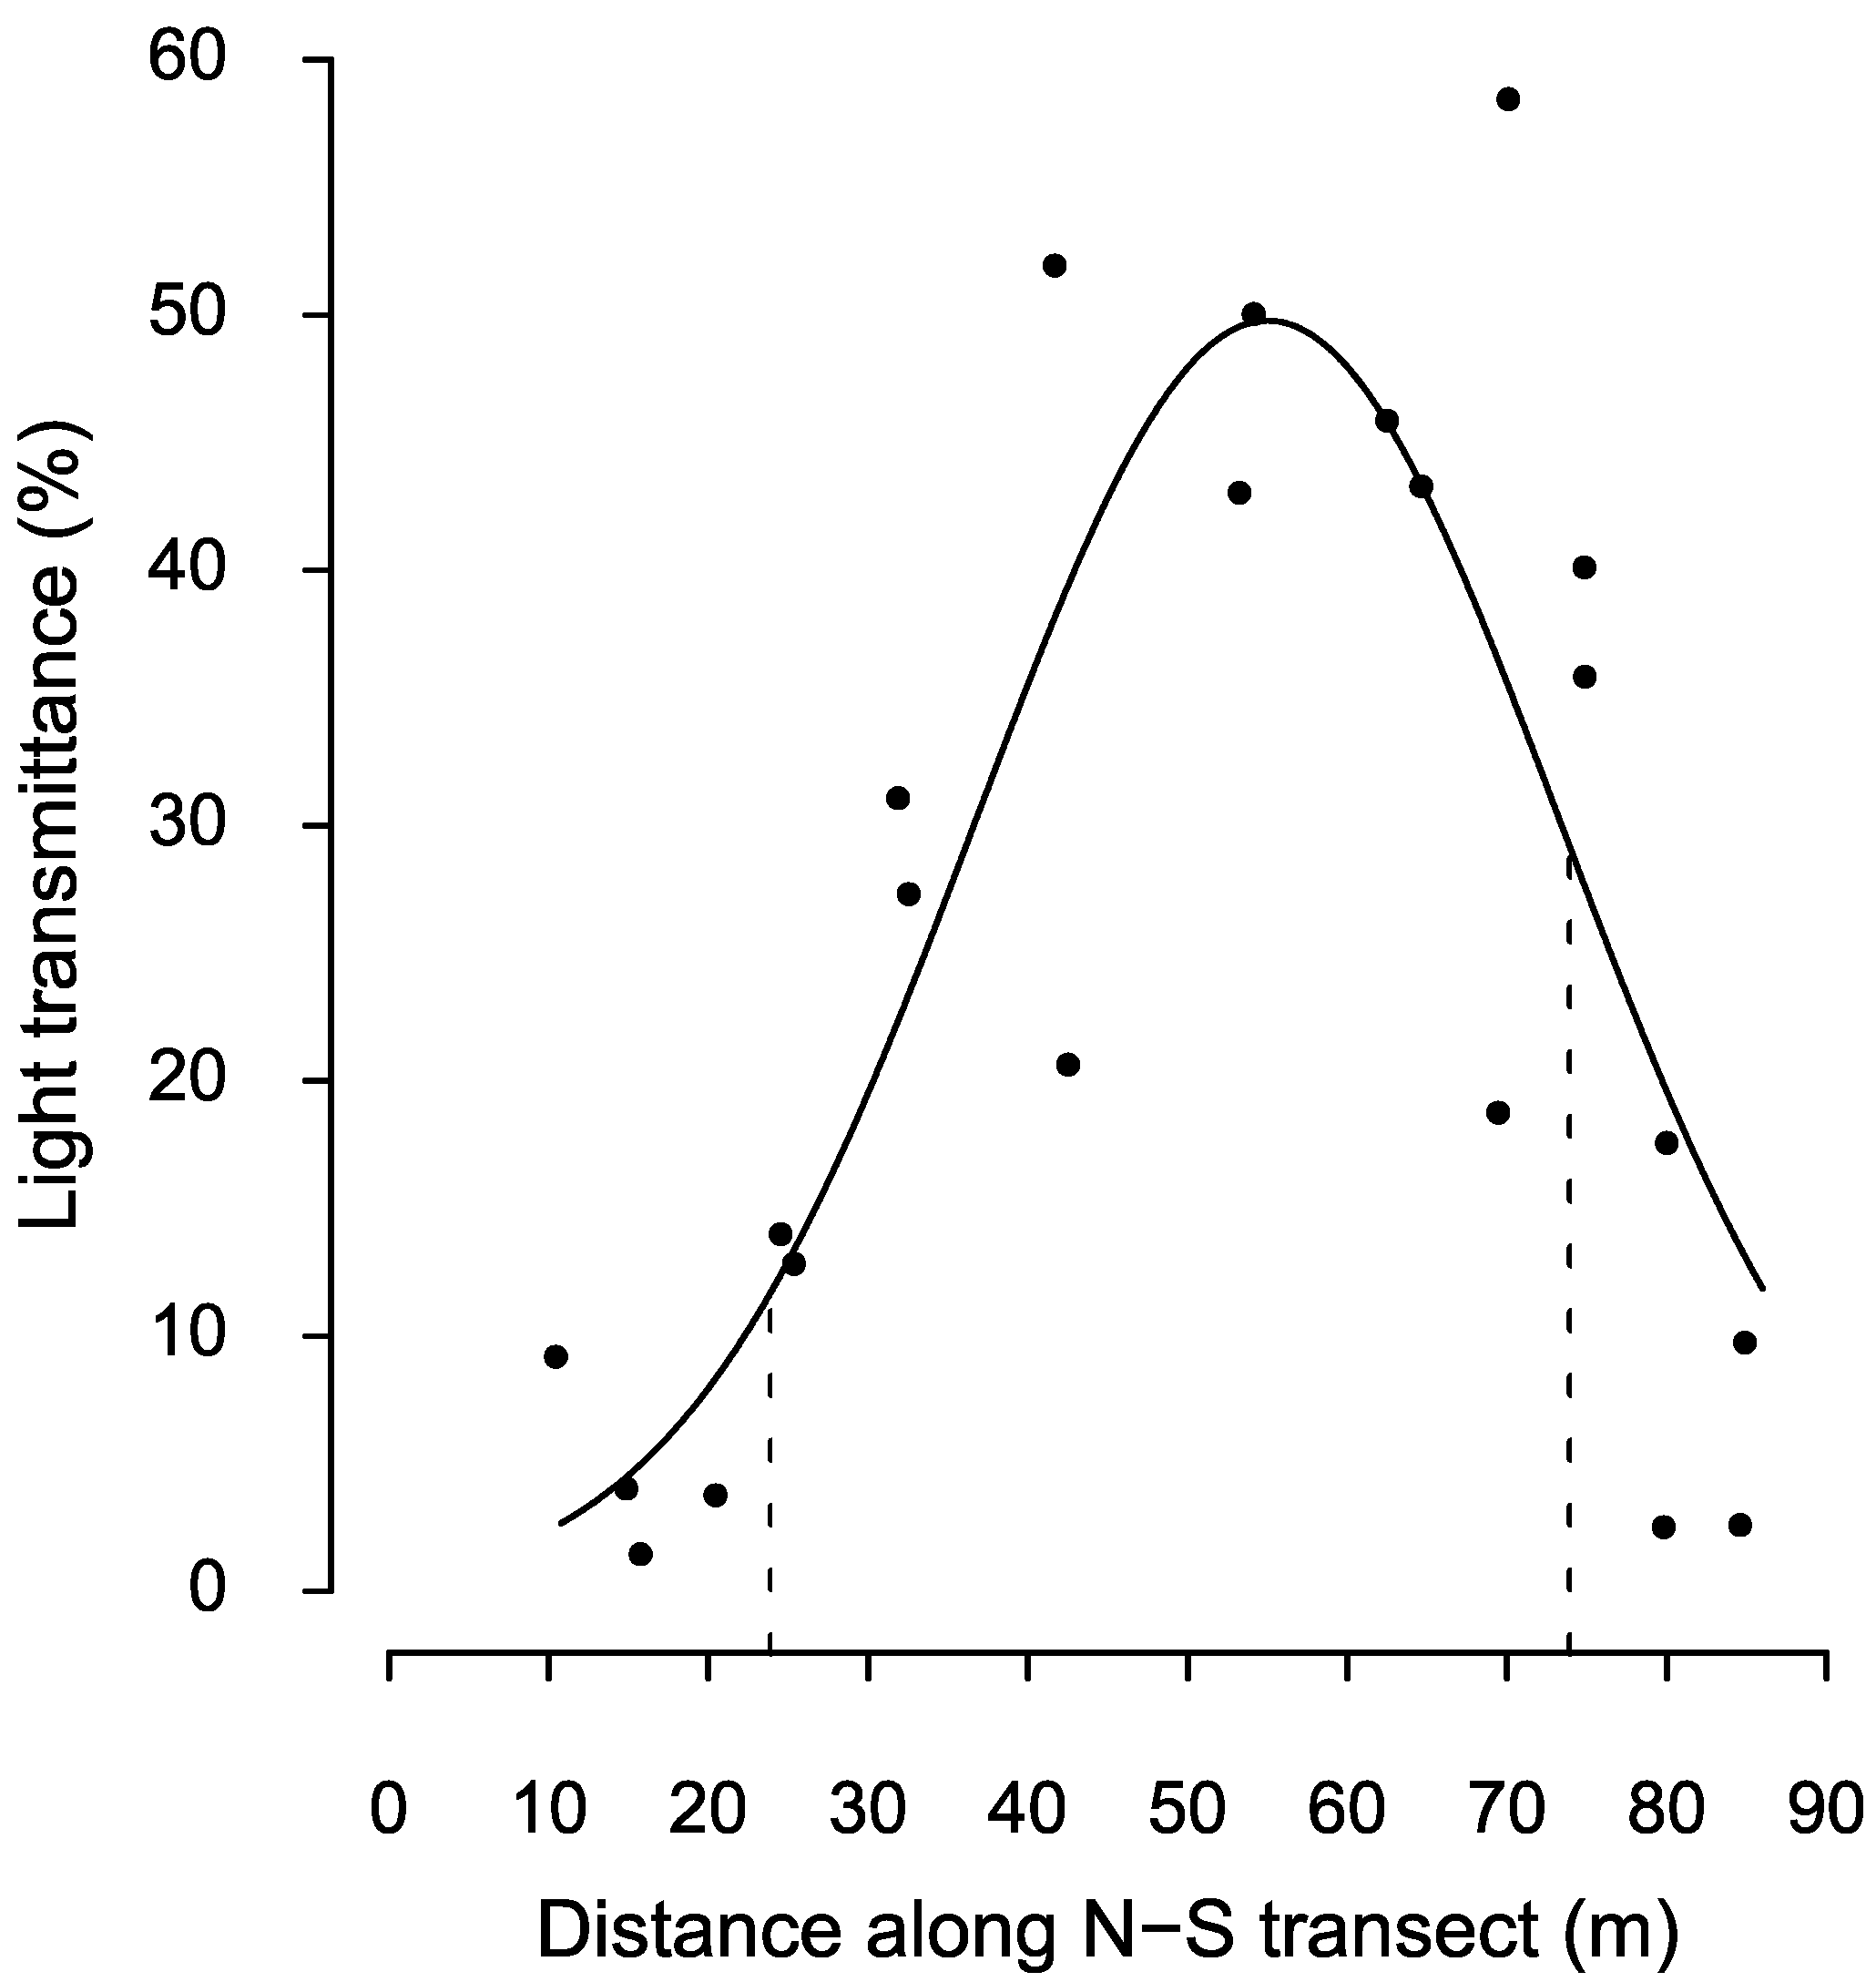
2.3. Light Measurements

To capture the north-south light gradient, 12 custom photodiode-based sensors were installed at 5, 15, 22.5, 27.5, 32.5, and 37.5 m north and south of the gap center along a north-south transect of each opening at the end of June 2007 (see Figure 1 for sensor locations). A detailed description of the sensors can be found in Fielder and Comeau [24]. Sensors were installed at a 1.5 m height above the ground and were connected to Campbell Scientific CR10X dataloggers for the continuous measurement of light. We continuously recorded photosynthetically active photon flux density (PPFD) below the canopy from 1 July to 30 September 2007, subsequently converted to % transmittance relative to above canopy PPFD, following protocols described in detail by Hossain and Comeau [7]. To estimate light at each seedling, a Gaussian peak function was fitted to describe the relationship between % PPFD and distances from the southern forest edges in meters (d) (Figure 2, Equation (1)).
%   PPFD = ae 0.5 ( d b c ) 2

2.4. Tree Measurements

All live trees were measured in September 2009 after 15 growing seasons in the field. We measured stem diameter at 5 cm above the ground (D5), diameter at 1.3 m breast height (dbh), and height. The survival rates of the planted seedlings were generally around 60–70%. This analysis focuses on growth rates of surviving trees, and dead seedlings were excluded from growth and volume calculations. In addition, a small number of trees (<1%) that were in poor condition were also excluded from the analysis (trees with severe lean, animal damage, diseased, or insect infested) to reduce the influence of extraneous factors. All live trees and light sensor locations were mapped, and the distance of each tree from the south end of the row was calculated. Stand edges were mapped to provide an exact demarcation of the openings’ boundaries measured from the stems of edge trees. This allowed each individual tree to be related to the surrounding north and south edges of the cut-blocks.
For quantitative analysis, we used growth represented by total stem volume since planting. To derive volume equations, a sample of 48 trees (2 trees randomly selected within approximately 5 m of each of the 12 light sensor locations) of each species were selected from the two cut-blocks. To ensure representation of the full-size range of trees, the random samples were augmented by a selection of the four largest trees of each species. Stem volume of these trees was then determined by measuring diameter at intervals going from the ground to the top of the tree, with the first measurement positioned at 5 cm. Subsequently, trees <2 m were measured in 25 cm intervals up the stem, and trees >2 m were measured in 50 cm intervals. To develop species-specific stem volume equations, we used a modified Honer’s equation [25] (Equation (2) in Pitt et al. [26]).

2.5. Data Analysis

The total volume (cm3) of each tree was regressed against light calculated from the Gaussian peak function to examine light-growth relationships for each of the 9 selected species. To determine species differences in the relationship between stem volume and light, we tested if slopes of the light–growth relationships were statistically different between species, using a mixed effect linear model implemented with the lmer() function of the lm4/lmerTest packages for the R programming environment [27]. Further, we used the VarCorr() function to extract variance components from the lmer() object. The model had the following form, with species differences represented by the interaction term Equation (2):
Log (volume) ~ intercept + log(light) + species + log(light) × species + (1|Row/Block)
To determine the best positioning of species in the clearcut, we further modeled growth as a function of gap-position (distance) from the southern edge of the cut-block, using mixed effect analysis with rows within blocks specified as random effects. Here the relationship is not a linear response as in Equation (2), therefore, we use an equivalent quadratic model as shown in Equation (3):
Log (volume) ~ intercept + species + gap-position + gap-position2 + species × gap-position+ species × gap-position2 + (1|Row/Block)
Log transformation was applied to total volume in Equation (3), and log–log transformations for both light and volume were applied in Equation (2) to meet the assumptions of normality and equality of variance and for linearization of the relationships. Mixed effect models were used to account for nesting of planted rows within each strip-cut and also to account for variation between the two strip-cuts. All analyses were completed using R statistical software [27].

3. Results

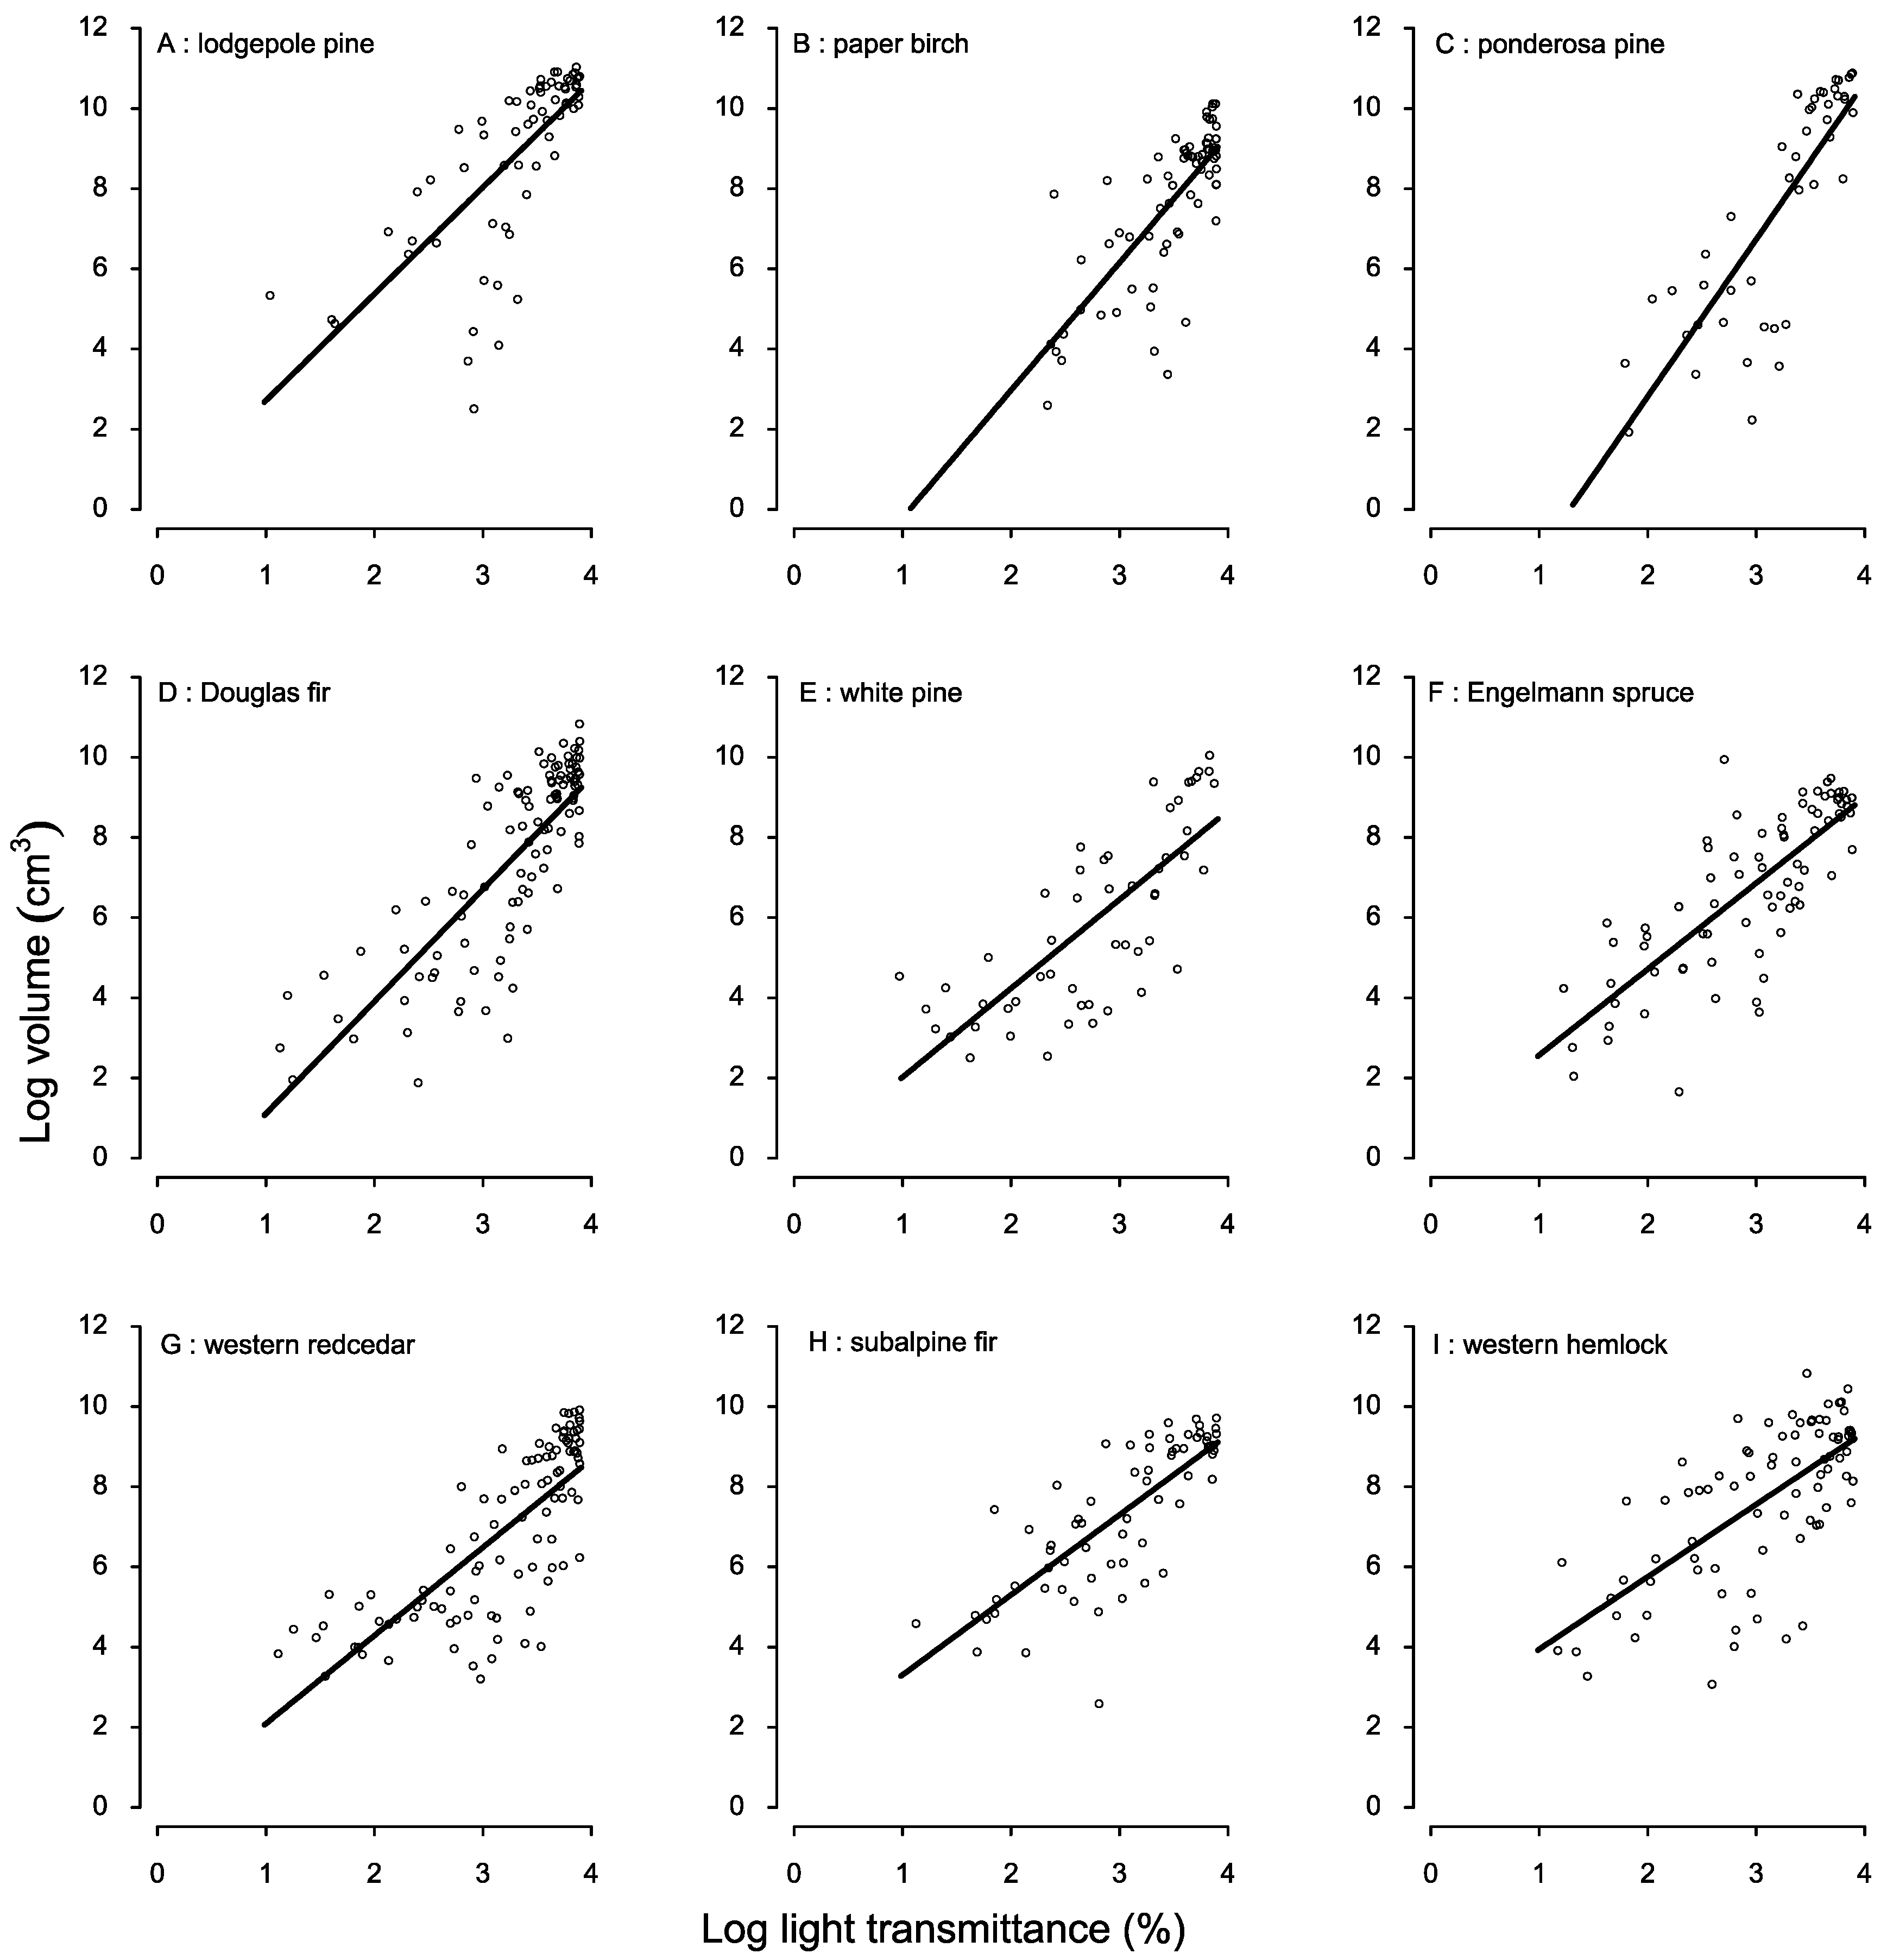
3.1. Species-Specific Light-Growth Response

The analysis reveals rank reversals among species in growth performance along the light gradient, with a significant light by species interaction term (Table 2). Experimental design factors (block and rows) were specified as random effects and explained less than 3% of the total variance in the experiment. In contrast, light, species, and their interactions accounted for 51%, 10%, and 4% of the total variance, respectively (data not shown). When plotted, a crossover pattern emerges between species’ light–growth relationships (Figure 3a). Figure 3a also reveals that more shade-tolerant species (namely, Engelmann spruce, western redcedar, subalpine fir and western hemlock) exhibit a shallower slope than less tolerant species (i.e., ponderosa pine, lodgepole pine, paper birch, and Douglas fir). In order for intolerant species to be viable in mixed species plantations, they need to surpass the more shade tolerant group under high light levels and our results clearly indicate this to be true for two pine species, lodgepole, and ponderosa pine. Demonstrating a higher competitive potential, these two species achieved the highest ranks at high light conditions (Figure 3a, maroon, and blue line). Another shade-intolerant species, paper birch, also showed a steeper slope than other more tolerant species but failed to surpass the growth of the tolerant competitors (Figure 3a, green line). In contrast, moderately shade-tolerant Douglas fir also crossed ranks, and marginally emerged on top of the shade-tolerant species at the highest light level (Figure 3a, lime line), consistent with observations of the ability of this species to grow in mixture with shade-tolerant species. However, the second moderately tolerant species, white pine, did not behave as expected, and parallels the growth of shade-tolerant species, showing a low competitive potential under high light conditions (Figure 3a, purple line). Back-transformation of the data into their original units also illustrates similar trends (Figure 3b).

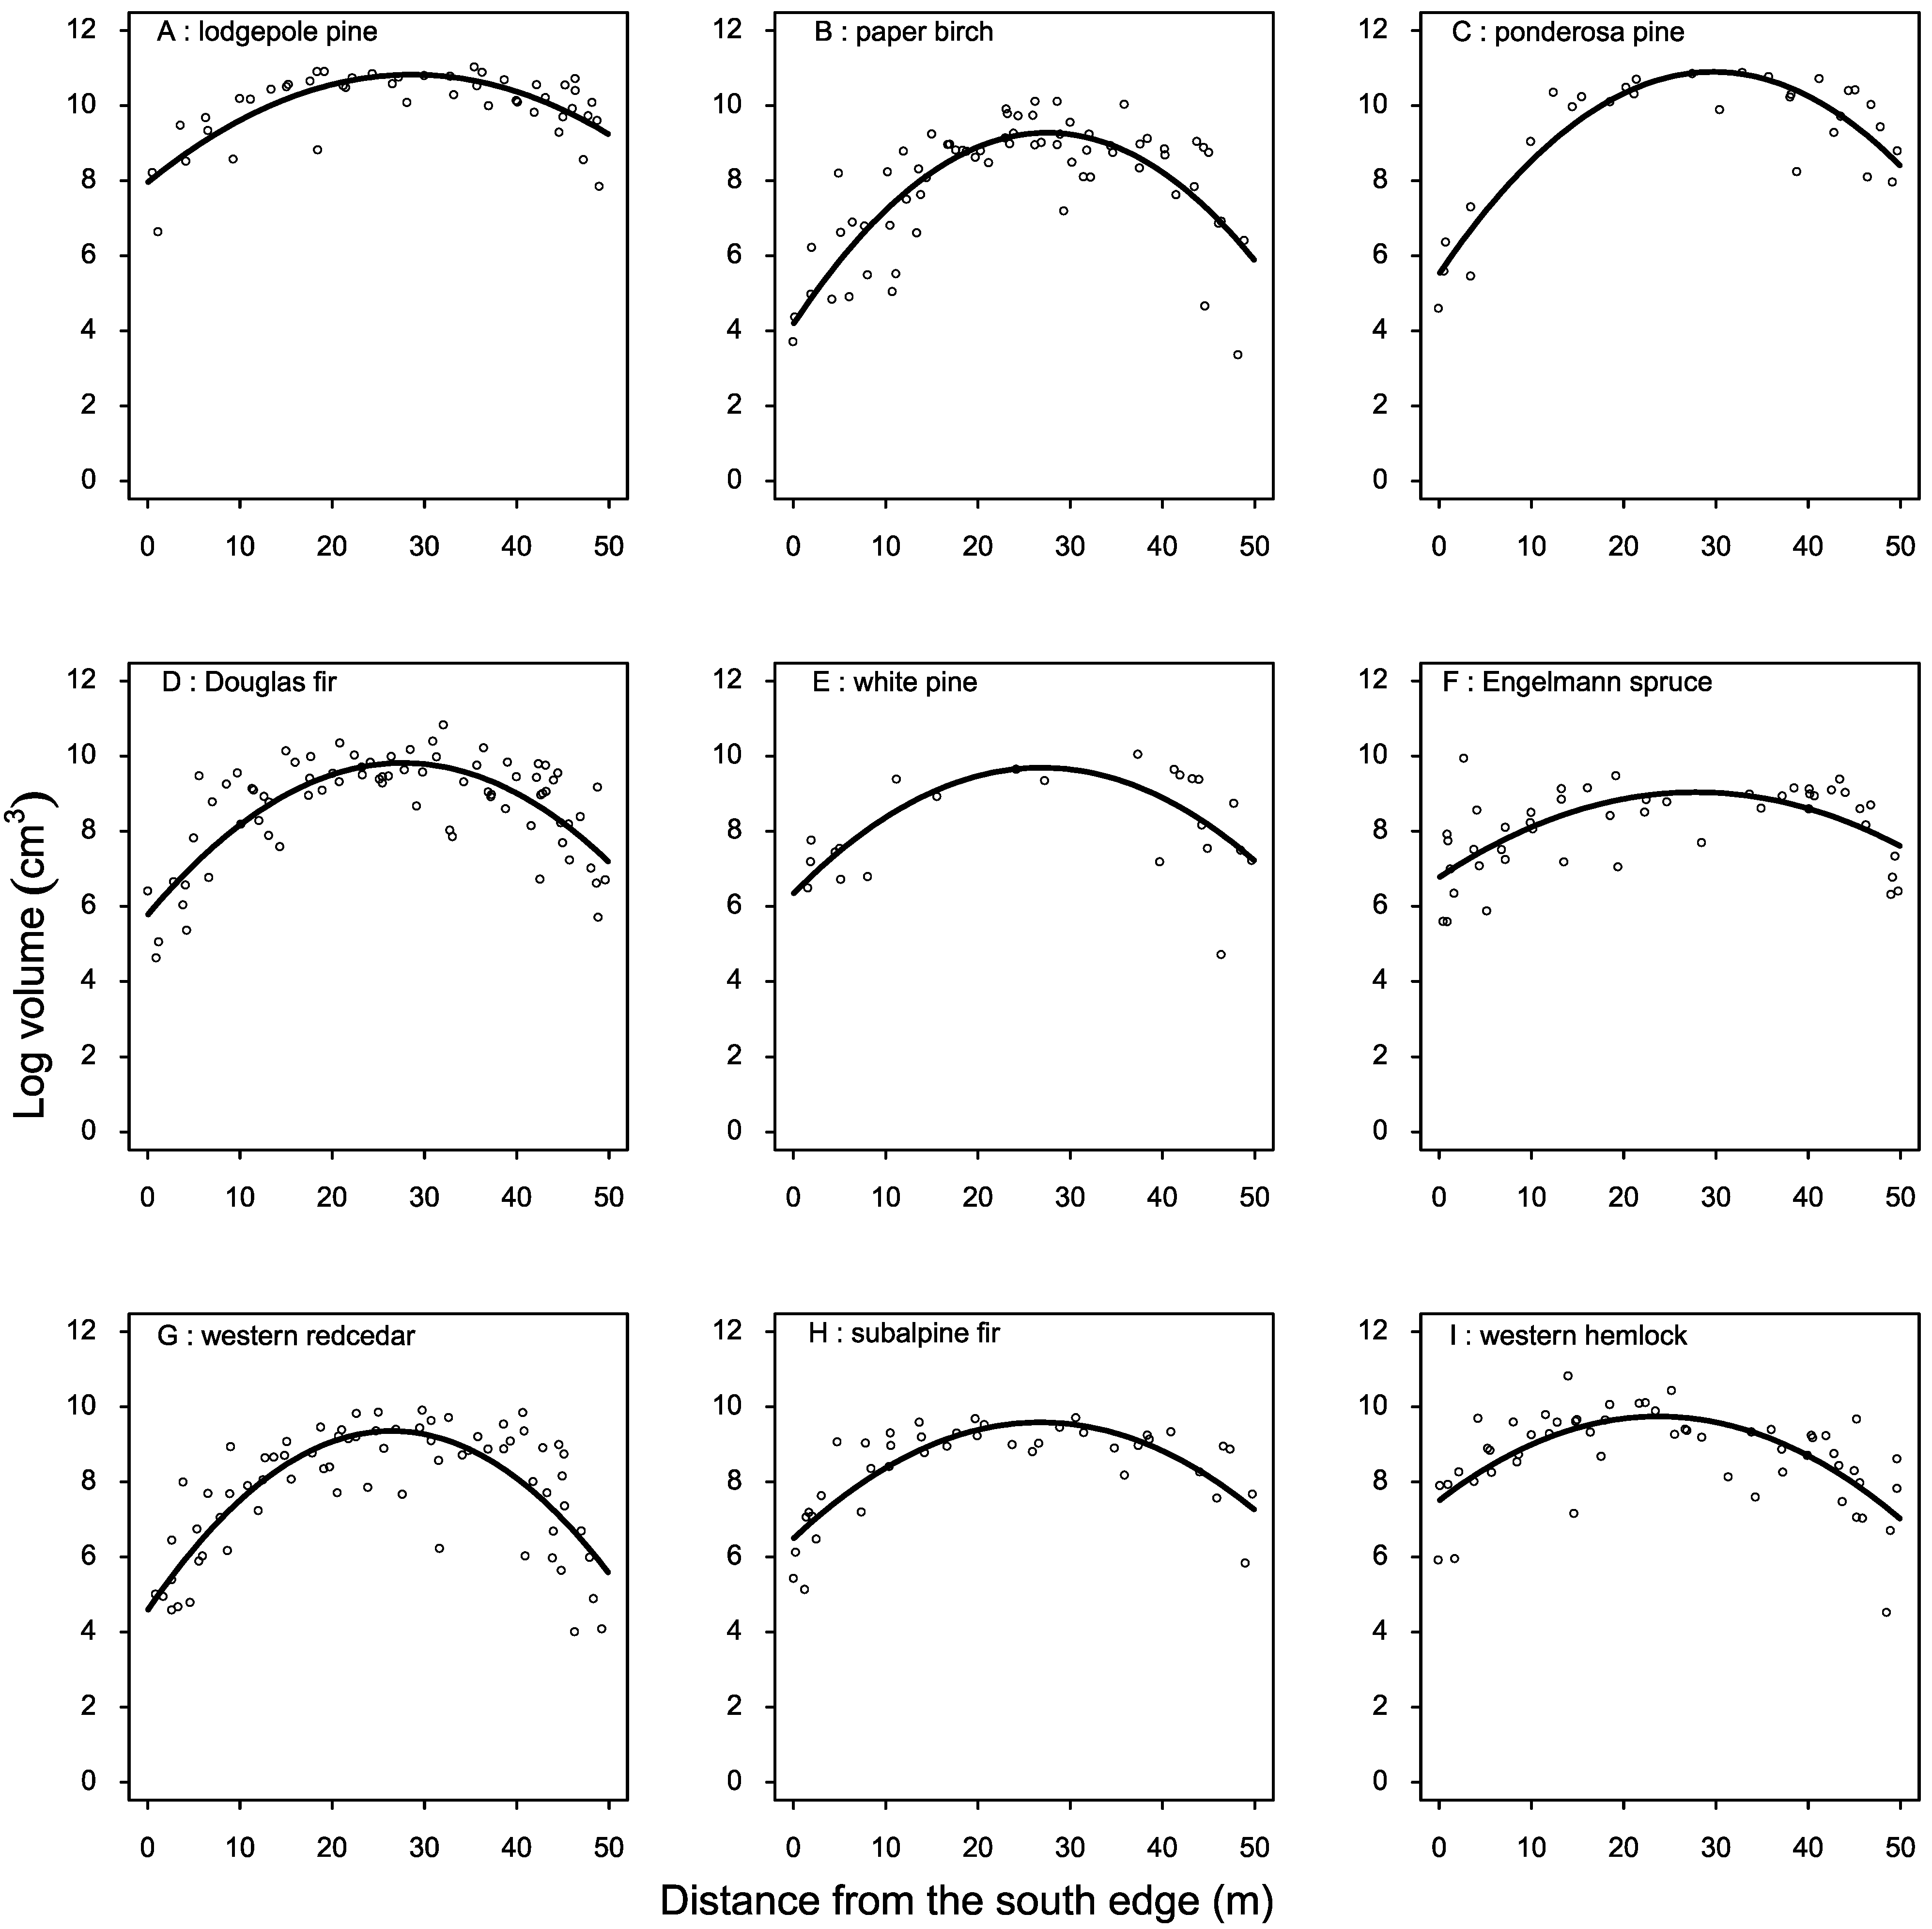
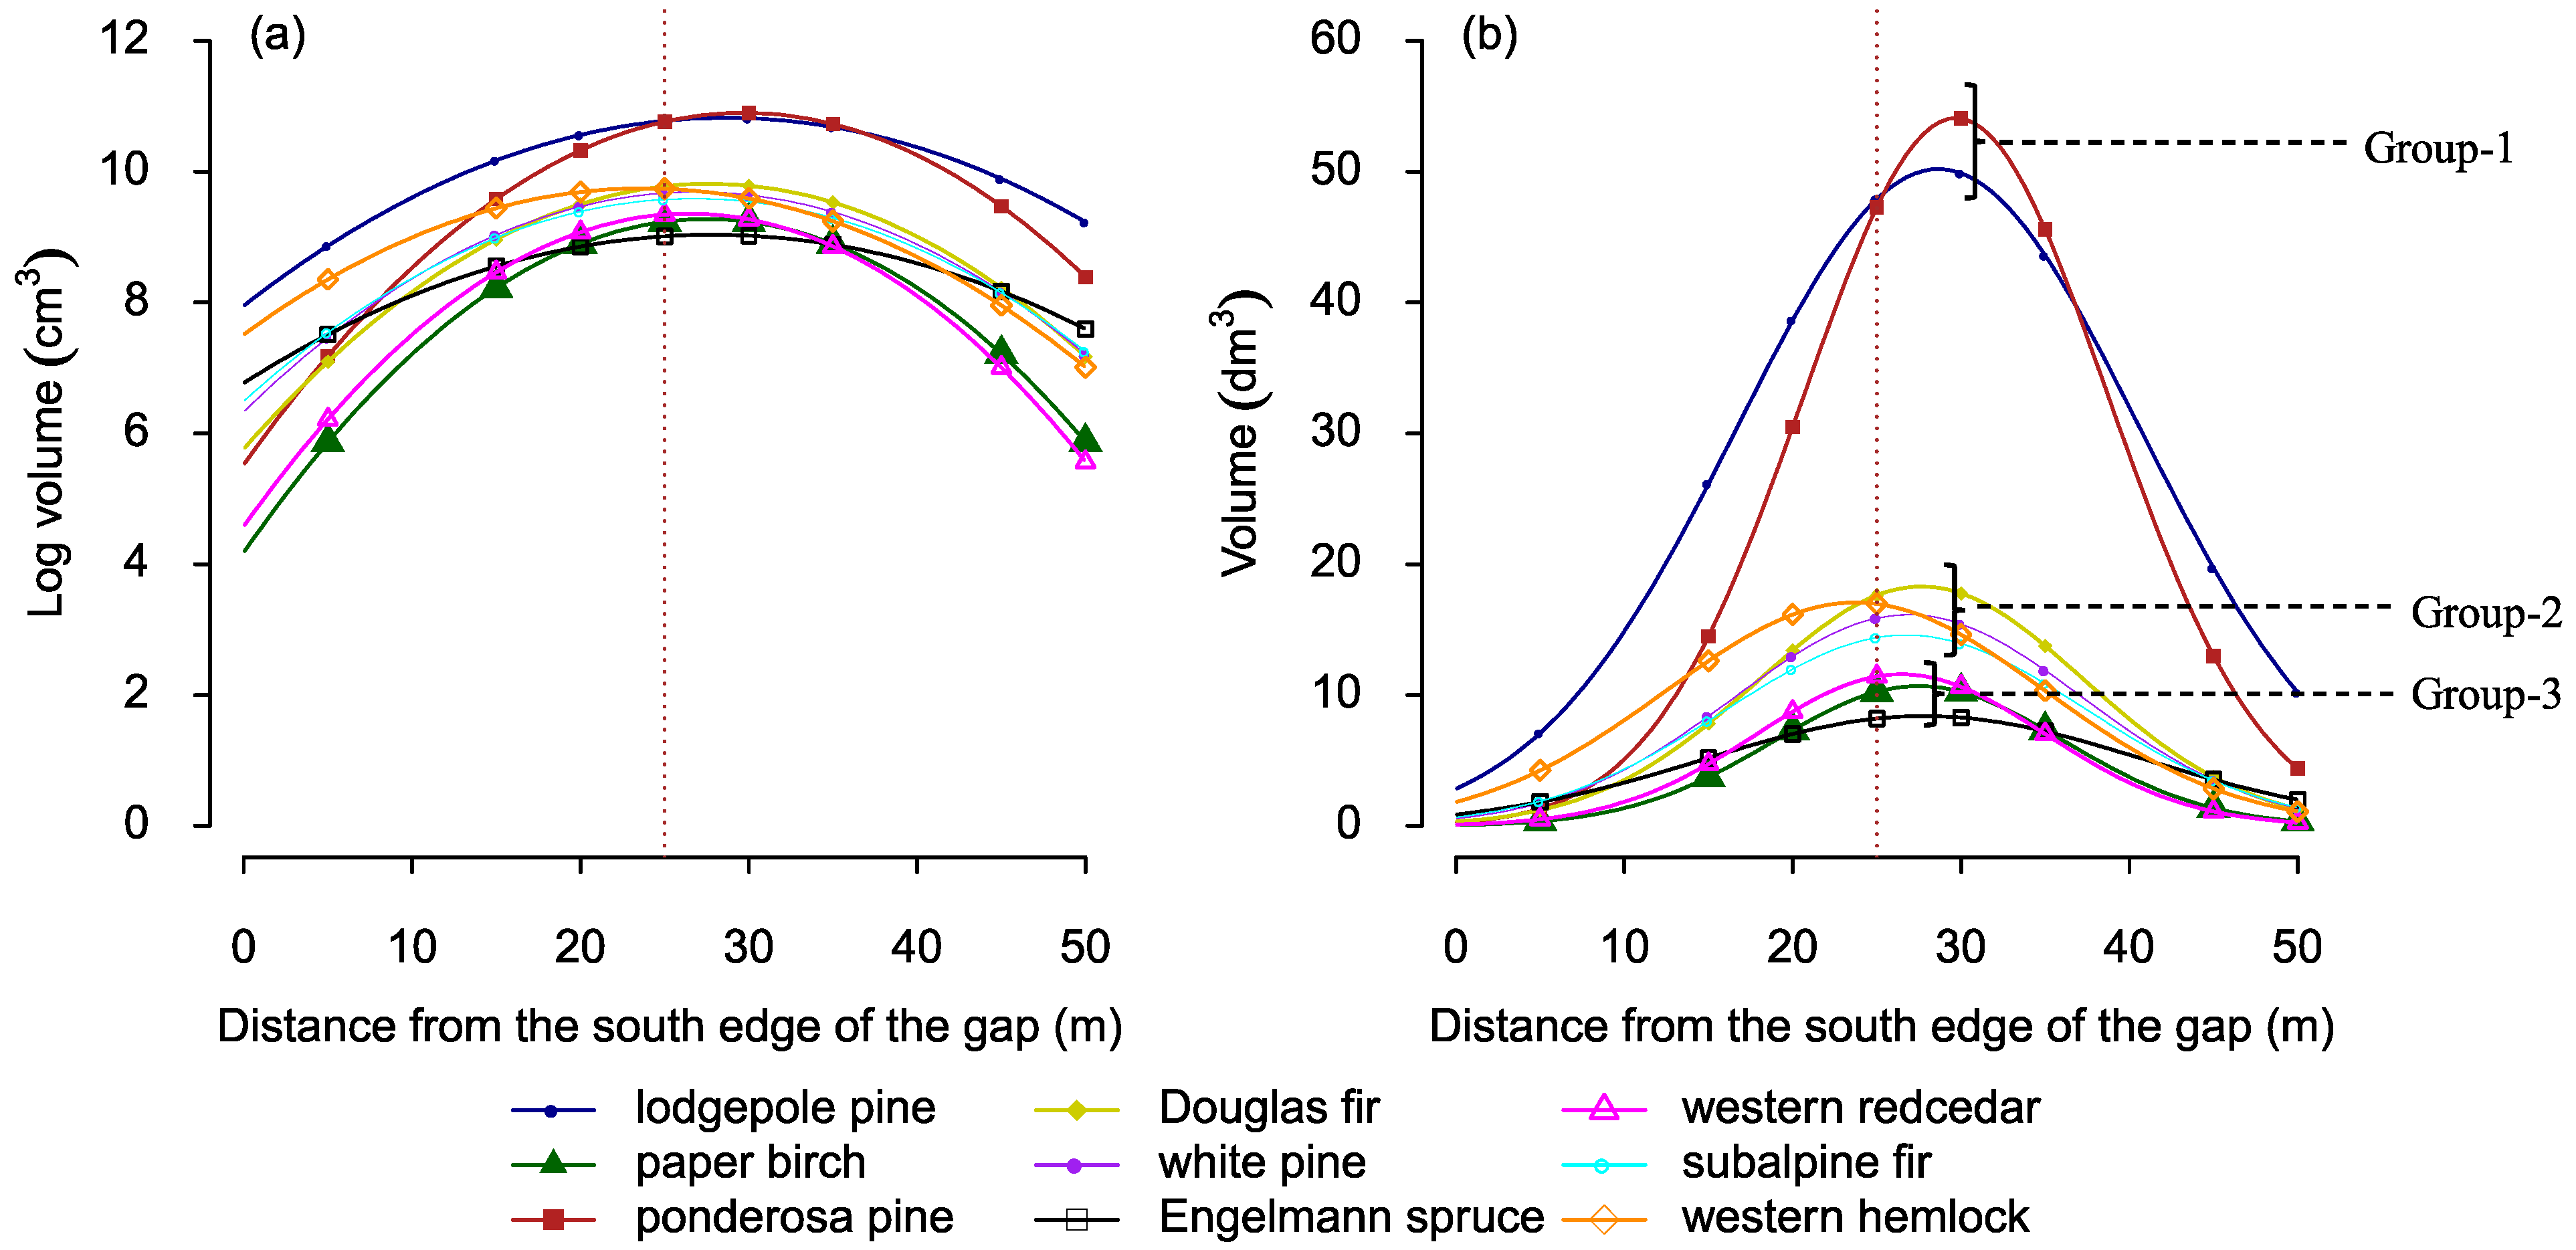
3.2. Growth Response in Relation to Gap-Positions

Analysis of growth as a function of the gap-position reveals a highly significant interaction term (Table 3), suggesting that the rate at which species reached their highest growth (peak) differed among them, along with the location within the gap where that peak occurred. The results provide some indication of within-gap partitioning by species. For example, as a first group (Figure 4b, Group-1), two highly shade-intolerant species, lodgepole and ponderosa pine, peaked somewhat north of the gap center, at around 30 m (Figure 4b), close to the location of the maximum light level (or ecological center of the gap, at 30 m). The second group, consisting of Douglas fir, white pine, subalpine fir, and western hemlock showed intermediate productivity and among them, the two moderately tolerant species (Douglas fir and white pine) peaked north of the center (around 30 m) whereas the highly shade-tolerant western hemlock peaked south of the center (around 24 m), a shaded location within the gap. And the third group consisted of a mixture of shade tolerantand intolerant species (Engelmann spruce, western redcedar and the shade-intolerant broadleaved species, paper birch), for which, the peak of the growth or optimum niche also occurred north of the gap center (around 29 m, Figure 4b).

3.3. Edge Influence

Generally, all species suffered growth reduction in proximity to the gap edges, but they differed in the magnitude of reduction. For shade-intolerant species, due to their poor adaptation to shade, a strong south edge influence was expected. However, only two highly shade-intolerant species, ponderosa pine and paper birch (volume reductions were 97% and 96%, respectively, Table 4), conformed to this expectation. However, lodgepole pine, a shade-intolerant species did not; this species suffered about 83% growth reduction, which is less than two moderately tolerant species, Douglas fir (92%) and white pine (87%) (Table 4). At the north edge, shade-intolerant species are expected to suffer less reduction in growth due to the abundance of light, and two shade-intolerant species, lodgepole and ponderosa pine met this expectation (only 61% and 76% growth reductions, respectively), but despite being highly shade intolerant, paper birch seemed to suffer substantial (87%) growth reduction near the north edge. These results indicate the importance of considering suitable planting locations for species based on their tolerance of shade and edge effects.
Shade-tolerant species are expected to be less impacted by a south-edge proximity. However, despite being shade tolerant, western redcedar seemed to be impacted by proximity to the south edge (94% volume loss). This species is also subject to a strong north edge influence (about 90% growth reduction). For the other species, both edges seem to exert a moderate to weak influence on their growth (Table 4).

4. Discussion

4.1. Mixed Species Regeneration Appears Feasible

Species rank reversals along the light gradient indicate that a competitive hierarchy would make mixed species plantations feasible in strip-cuts in this region. It is not surprising that, when a large number of species are growing in intimate mixtures within a narrow range of light (2.5–49%), they will overlap in their growth responses. Previous studies have reported similar results [9,28,29]. Light-growth relationships indicate niche sharing as all species in this study grew best at the highest light levels. Despite this, establishing intolerant species such as ponderosa pine and lodgepole pine in mixture with shade-tolerant species is possible due to their rapid growth which enables them to remain in the upper canopy for several decades. The likelihood of shade-intolerant species growing in intimate mixtures with shade-tolerant species increases with canopy disturbance and with faster growth of shade-intolerant species at high light, whereas the likelihood decreases when the growth rate of shade-tolerant species surpasses that of the intolerant species [30,31,32]. Furthermore, Gravel et al. [33] point out that when growing in mixtures, a faster-growing shade-intolerant species cannot be competitively excluded by a slower-growing shade-tolerant species until the height of the tolerant species surpasses that of the intolerant ones.
Though highly shade-intolerant paper birch showed accelerated growth with increasing light, its failure to crossover the growth of more shade-tolerant species might be limiting for its coexistence. The silvics of this species also suggest that paper birch usually does not do well in small clearcuts or in mixtures unless it dominates the shade-tolerant species [34]. Thus, planting this species in a suitable gap-position is of paramount importance if this species is to grow in mixtures with other species in such 50 m wide strip-cuts.

4.2. Species Exhibited Some Evidence of Within Gap-Partitioning

The relationship between growth and light clearly indicates a growth hierarchy for two highly shade-intolerant species (ponderosa and lodgepole pine) and also indicates the possibility of coexistence for moderately shade tolerance species, Douglas fir, at high light levels. However, the gap–position–growth relationship provides more information regarding two moderately tolerant species, Douglas fir and white pine. These two species (white pine marginally) achieve a higher competitive rank over other species that are more shade tolerant, namely, western hemlock and subalpine fir (see Figure 4b, lime, orange, purple and indigo lines within the second grouping of species). This enables these two species to coexist with other more shade-tolerant species within the strip-cuts. Moreover, species’ growth optima also differed within the gap, evidence of within gap-partitioning. Although competitive hierarchy is strong in the data (Figure 4), this weak exhibition of within gap-partitioning by species is meaningful for their successful establishment within small gaps, since it allows matching species to their suitable planting environments. For example, shade-intolerant paper birch revealed a high sensitivity toward the proximity of edges (it suffered severe growth reduction near both north and south edges), therefore, this species needs to be planted near the gap-center.
Moreover, this species lacked the expected competitive rank in the grouping with other shade-tolerant species (see Figure 4b, in the third groupings of species, pink, green, and black lines), thus, it is likely to face intense competition from other species. It is perplexing that the increased light level due to gap creation is not benefiting this species owing to its low-ranking in-shade tolerance. Instead, it seems that the benefit of increased light is somewhat negated by belowground competition from the surrounding edges, as predicted by other studies [4,14].
Like paper birch, western redcedar unexpectedly suffered growth reduction near the edges, despite being a highly shade-tolerant species. In fact, both species are shallow rooted species [34] suggesting that these two species were impacted by belowground competition from neighboring mature edge trees. Therefore, for the successful reforestation of these two species, we suggest these species not be planted near gap edges. Other shade-tolerant species such as western hemlock, subalpine fir, and Engelmann spruce showed a somewhat gradual response going from north to south within the gap, suggesting that these species will do well within gaps of this size, as indicated by other gap studies [4,14,35,36].
Finally, results from this study are consistent with observations that if opportunities are provided for shade-intolerant species to grow in some portions of the opening, it is likely that tolerant species will grow in mixture with the intolerants [3,4,5,33,37,38]. The range of light conditions (2.5–49%) that existed within the strip-cuts can support these two moderately shade-tolerant species, particularly, Douglas fir. Light levels exceeding 20% can ensure survival of Douglas fir, and light levels above 40% can support adequate growth of this species under partial harvesting systems [39,40]. In a group selection study, De Montigny and Smith [38] noted that the minimum gap-size requirement for adequate height growth of this species was between 0.24 to 0.33 ha with a gap-diameter to dominant tree height ratio of 1.5–2.2. Therefore, based on the existing research, we can be confident that Douglas fir is likely to establish in the mixtures within strip-cuts in the Interior Cedar Hemlock zone of British Columbia.

5. Conclusions

Results from this study indicate that small-scale strip-cut harvesting can create a strong north-south light gradient, along which species with a wide range of shade tolerance can grow at different rates and thus coexist within the opening. If regeneration of a mixed species stand is the primary forest management objective, predictive models that link gap-position, light, and growth performance of species can be used as tools in designing strip cutting. The gap–position–growth relationships provide guidance regarding which species should not be planted in the proximity of gap edges. Moreover, our results can guide mixed species reforestation strategy in somewhat larger gaps than ours of other temperate forests. We acknowledge that the two selected patch-cuts appear limiting in drawing broader inferences for the Interior Cedar Hemlock bio-geoclimatic zone. However, the most important factor in this experiment was the light gradient accounting for more than half of the variance in the experiment. Since any strip-cut with similar orientation would result in comparable light gradient, the results of this study should generally be useful to guide species selection and gap positioning. Nevertheless, this study demonstrated, despite evidence of niche sharing within small harvest gaps, shade tolerant and intolerant species can both successfully regenerate through competitive hierarchy processes in gaps of at least 50 m.

Author Contributions

K.L.H. and P.G.C. conceived and designed the study; K.L.H. conducted the investigation, formal analysis and wrote the first draft. A.H. contributed to methodology, analysis, review and editing. P.G.C. was responsible for funding acquisition, supervision, and contributed review and editing. All authors have read and agreed to the published version of the manuscript.

Funding

This research was funded by British Columbia Ministry of Forests, Lands, Natural Resource Operations and Rural Development, grant number Y103116.

Data Availability Statement

Data available on request to the senior author.

Acknowledgments

We are grateful to the British Columbia Ministry of Forests, Lands, Natural Resource Operations and Rural Development for funding this research under the Forest Investment Account BC Forest Sciences Program during 2007, 2008 and 2009. We would also like to thank Teresa Newsome and Michaela Waterhouse for their logistical support during the period of this study and to Kyle Lochhead and others for field assistance. We also gratefully acknowledge the work of Mark Ashton, Ian Cameron, Deb DeLong and others involved in initiating and maintaining the Burton Creek experiment. Finally, we also thank two anonymous reviewers for providing useful inputs into this work.

Conflicts of Interest

The authors declare no conflict of interest.

Appendix A

Figure A1. Growth responses of 9 species to the light gradient on a log-log scale. Each point represents individual trees corresponding to Figure 3.
Forests 13 00379 g0a1
Figure A2. Growth responses of 9 species to the distance from the south edge of the gap (gap-positions). Each point represents individual trees corresponding to Figure 4.
Forests 13 00379 g0a2

References

  1. Newsome, T.A.; Heineman, J.L.; Nemec, A.F.L.; Comeau, P.G.; Arsenault, A.; Waterhouse, M. Ten-year regeneration responses to varying levels of overstory retention in two productive southern British Columbia ecosystems. For. Ecol. Manag. 2010, 260, 132–145. [Google Scholar] [CrossRef]
  2. DeLong, D.L.; Simard, S.W.; Comeau, P.G.; Dykstra, P.R.; Mitchell, S.J. Survival and growth response of seedlings in root disease infected partial cuts in the Interior Cedar Hemlock zone of southeastern British Columbia. For. Ecol. Manag. 2005, 206, 365–379. [Google Scholar] [CrossRef]
  3. Kern, C.C.; Burton, J.I.; Raymond, P.; D’Amato, A.W.; Keeton, W.S.; Royo, A.A.; Walters, M.B.; Webster, C.R.; Willis, J.L. Challenges facing gap-based silviculture and possible solutions for mesic northern forests in North America. Forestry 2017, 90, 4–17. [Google Scholar] [CrossRef]
  4. York, R.A.; Battles, J.J.; Heald, R.C. Edge effects in mixed conifer group selection openings: Tree height response to resource gradients. For. Ecol. Manag. 2003, 179, 107–121. [Google Scholar] [CrossRef] [Green Version]
  5. Shabaga, J.A.; Jones, T.A.; Elliott, K.A. Group-selection silviculture conditionally enhances recruitment of yellow birch in a shade-tolerant hardwood forest. For. Ecol. Manag. 2019, 444, 244–255. [Google Scholar] [CrossRef]
  6. Bagnato, S.; Marziliano, P.A.; Sidari, M.; Mallamaci, C.; Marra, F.; Muscolo, A. Effects of Gap Size and Cardinal Directions on Natural Regeneration, Growth Dynamics of Trees outside the Gaps and Soil Properties in European Beech Forests of Southern Italy. Forests 2021, 12, 1563. [Google Scholar] [CrossRef]
  7. Hossain, K.L.; Comeau, P.G. Characterizing light across a strip shelterwood in a mixed conifer forest. For. Ecol. Manag. 2019, 445, 134–145. [Google Scholar] [CrossRef]
  8. Sack, L.; Grubb, P.J. Why do species of woody seedlings change rank in relative growth rate between low and high irradiance? Funct. Ecol. 2001, 15, 145–154. [Google Scholar] [CrossRef] [Green Version]
  9. Van Couwenberghe, R.; Gégout, J.C.; Lacombe, E.; Collet, C. Light and competition gradients fail to explain the coexistence of shade-tolerant Fagus sylvatica and shade-intermediate Quercus petraea seedlings. Ann. Bot. 2013, 112, 1421–1430. [Google Scholar] [CrossRef] [Green Version]
  10. Valladares, F.; Laanisto, L.; Niinemets, U.; Zavala, M.A. Shedding light on shade: Ecological perspectives of understorey plant life. Plant Ecol. Divers. 2016, 9, 237–251. [Google Scholar] [CrossRef] [Green Version]
  11. Coates, K.D.; Burton, P.J. Growth of planted tree seedlings in response to ambient light levels in northwestern interior cedar-hemlock forests of British Columbia. Can. J. For. Res. 1999, 29, 1374–1382. [Google Scholar] [CrossRef]
  12. Kitajima, K.; Bolker, B.M. Testing performance rank reversals among coexisting species: Crossover point irradiance analysis by Sack & Grubb (2001) and alternatives. Funct. Ecol. 2003, 17, 276–281. [Google Scholar] [CrossRef] [Green Version]
  13. Valladares, F.; Niinemets, Ü. Shade Tolerance, a Key Plant Feature of Complex Nature and Consequences. Annu. Rev. Ecol. Evol. Syst. 2008, 39, 237–257. [Google Scholar] [CrossRef] [Green Version]
  14. Zdors, L.; Donis, J. Evaluating the edge effect on the initial survival and growth of scots pine and Norway spruce after planting in different size gaps in shelterwood. Balt. For. 2017, 23, 534–543. [Google Scholar]
  15. Carter, R.E.; Klinka, K. Variation in shade tolerance of Douglas fir, western hemlock, and western red cedar in coastal British Columbia. For. Ecol. Manag. 1992, 55, 87–105. [Google Scholar] [CrossRef]
  16. Klinka, K.; Wang, Q.; Kayahara, G.J.; Carter, R.E.; Blackwell, B.A. Light-growth response relationships in Pacific silver fir (Abies amabilis) and subalpine fir (Abies lasiocarpa). Can. J. Bot. 1992, 70, 1919–1930. [Google Scholar] [CrossRef]
  17. Bradshaw, F.J. Quantifying edge effect and patch size for multiple-use silviculture—A discussion paper. For. Ecol. Manag. 1992, 48, 249–264. [Google Scholar] [CrossRef]
  18. Avalos, G. Shade tolerance within the context of the successional process in tropical rain forests. Rev. Biol. Trop. 2019, 67, 53–77. [Google Scholar] [CrossRef]
  19. MacKillop, J.D.; Ehman, J.A. A Field Guide to Site Classification and Identification for Southeast British Columbia: The South-Central Columbia Mountains; Province of British Columbia: Victoria, BC, Canada, 2016; 70p. [Google Scholar]
  20. Niinemets, Ü.; Valladares, F. Tolerance to shade, drought, and waterlogging of temperate northern hemisphere trees and shrubs. Ecol. Monogr. 2006, 76, 521–547. [Google Scholar] [CrossRef]
  21. Klinka, K.; Chourmouzis, C. Ecological and silvical characteristics of major tree species in British Columbia. In Forestry Handbook for British Columbia, 5th ed.; Watts, S.B., Tolland, L., Eds.; The Forestry Undergraduate Society Faculty of Forestry University of British Columbia: Vancouver, BC, Canada, 2005; ISBN 0-88865-447-2. [Google Scholar]
  22. Weetman, G.; Vyse, A. Natural regeneration. In Regenerating British Columbia’s Forests; Lavender, D., Parish, R., Johnson, C., Montgomery, G., Vyse, A., Willis, R., Winston, D., Eds.; University of British Columbia Press: Vancouver, BC, Canada, 1990; p. 127. [Google Scholar]
  23. Haeussler, S.; Coates, D.; Matter, J. Autecology of Common Plants in British Columbia: A Literature Review (No. 158); FRDA Research Program; Research Branch, Ministry of Forests and Lands: Victoria, BC, Canada, 1990; pp. 56–61.
  24. Fielder, P.; Comeau, P. Construction and Testing of an Inexpensive PAR Sensor; Working Paper; Research Branch, Ministry of Forest: Victoria, BC, Canada, 2000; 53p.
  25. Honer, T.G.; Ker, M.F.; Alemdag, I.S. Metric Timber Tables for the Commercial Tree Species of Central and Eastern Canada; Information Report No. M–X-140; Canadian Forestry Service-Maritimes: Fredericton, NB, Canada, 1983.
  26. Pitt, D.G.; Mihajlovich, M.; Proudfoot, L.M. Juvenile stand responses and potential outcomes of conifer release efforts on Alberta’s spruce-aspen mixedwood sites. For. Chron. 2004, 80, 583–597. [Google Scholar] [CrossRef]
  27. R Core Team. A Language and Environment for Statistical Computing; The R Project for Statistical Computing: Vienna, Austria; Available online: http//www.R-project.org/ (accessed on 18 February 2022).
  28. Pacala, S.W.; Canham, C.D.; Silander Jnr, J.A.; Kobe, R.K. Sapling growth as a function of resources in a north temperate forest. Can. J. For. Res. 1994, 24, 2172–2183. [Google Scholar] [CrossRef]
  29. Wright, E.F.; Coates, K.D.; Canham, C.D.; Bartemucci, P. Species variability in growth response to light across climatic regions in northwestern British Columbia. Can. J. For. Res. 1998, 28, 871–886. [Google Scholar] [CrossRef]
  30. Latham, R.E. Co-occurring tree species change rank in seedling performance with resources varied experimentally. Ecology 1992, 73, 2129–2144. [Google Scholar] [CrossRef]
  31. Claveau, Y.; Messier, C.; Comeau, P.G.; Coates, K.D. Growth and crown morphological responses of boreal conifer seedlings and saplings with contrasting shade tolerance to a gradient of light and height. Can. J. For. Res. 2002, 32, 458–468. [Google Scholar] [CrossRef] [Green Version]
  32. Lin, J.; Harcombe, P.A.; Fulton, M.R.; Hall, R.W. Sapling growth and survivorship as a function of light in a mesic forest of southeast Texas, USA. Oecologia 2002, 132, 428–435. [Google Scholar] [CrossRef]
  33. Gravel, D.; Canham, C.D.; Beaudet, M.; Messier, C. Shade tolerance, canopy gaps and mechanisms of coexistence of forest trees. Oikos 2010, 119, 475–484. [Google Scholar] [CrossRef] [Green Version]
  34. Burns, R.M.; Honkala, B.H. Silvics of North America. In Agriculture Handbook 654; U.S. Department of Agriculture, Forest Service: Washington, DC, USA, 1990. [Google Scholar]
  35. Busing, R.T.; Brokaw, N. Tree species diversity in temperate and tropical forest gaps: The role of lottery recruitment. FOLIA Geobot. 2002, 37, 33–43. [Google Scholar] [CrossRef]
  36. Coates, K.D. Tree recruitment in gaps of various size, clearcuts and undisturbed mixed forest of interior British Columbia, Canada. For. Ecol. Manag. 2002, 155, 387–398. [Google Scholar] [CrossRef]
  37. Holgén, P.; Hånell, B. Performance of planted and naturally regenerated seedlings in Picea abies-dominated shelterwood stands and clearcuts in Sweden. For. Ecol. Manag. 2000, 127, 129–138. [Google Scholar] [CrossRef]
  38. De Montigny, L.E.; Smith, N.J. The effects of gap size in a group selection silvicultural system on the growth response of young, planted Douglas-fir: A sector plot analysis. Forestry 2017, 90, 426–435. [Google Scholar] [CrossRef] [Green Version]
  39. Drever, C.R.; Lertzman, K.P. Light-growth responses of coastal Douglas-fir and western redcedar saplings under different regimes of soil moisture and nutrients. Can. J. For. Res. 2001, 31, 2124–2133. [Google Scholar] [CrossRef]
  40. Mailly, D.; Kimmins, J.P. Growth of Pseudotsuga menziesii and Tsuga heterophylla seedlings along a light gradient: Resource allocation and morphological acclimation. Can. J. Bot. 1997, 75, 1424–1435. [Google Scholar] [CrossRef]
Figure 1. An illustration of the general experimental layout for one strip-cut, showing a 50 m × 150 m clearing surrounded by uncut stands, planting rows and placement of light sensors.
Forests 13 00379 g001
Figure 2. Non-linear curve describing light transmittance as a function of distance from the furthest point under the south canopy. Here, N = 22, rmse (root mean square error) = 10.89, Pseudo R2 = 0.69. All parameters (a = 49.78, b = 55.02, c = 18.29) are highly significant (p < 0.001). Black dashed line indicates forest edges.
Forests 13 00379 g002
Figure 3. Growth responses of 9 species to the light gradient on a log-log scale (a), and back-transformed to original units for light and volume (b). Plots for individual species with their corresponding data points are shown in Figure A1.
Forests 13 00379 g003
Figure 4. Fitted growth-gap-positions regression curves for log transformed volume (a) and original units (b). All fits are statistically significant (p < 0.001). Panel b shows results after back transformation to original. Dashed brown line indicates the gap-center. Plots for individual species with their corresponding data points are shown in Figure A2.
Forests 13 00379 g004
Table 1. Comparative tolerance to main stress factors and key silvics of the 9 Interior Cedar Hemlock (ICH) tree species planted in strip-cut experiment.
Tolerance Ranking 1Silvical Characteristics 2
Tree SpeciesShade Drought Suitability for Shelterwood SystemsSuitability for Selection SystemPotential for Natural Regen. at Low LightPotential for Natural Regen. in the Open
lodgepole pine1.484.21MLLH
paper birch1.542.02LLLH
ponderosa pine1.644.32ML-HLH
Douglas fir2.782.62L-HL-HL-HH
white pine2.972.42ML-MHL
Engelmann spruce4.532.58MMLH
western redcedar4.732.23MHMH
subalpine fir4.832.02MHHL
western hemlock4.961.17MHHH
Notes: 1 Numeric quantification of stress tolerance on the scale of 0 (no tolerance) to 5 (high tolerance) after Niinemets and Valladares [20]. 2 Silvical characteristics are taken from Klinka and Chourmouzis [21]. Silvical characteristics of paper birch are from Weetman and Vyse [22] and Haeussler et al. [23]. The interpretative classes are, L = low, M = intermediate, and H = high.
Table 2. Analysis of Deviance table (Type III Wald chisquare tests) of the mixed-effect regression model (Equation (2)) describing the effect of light on growth responses of 9 species.
ParametersChi SquareDFp Value
Intercept2.9910.083
Log (Light)68.121<0.001
Species47.228<0.001
Log (Light) × species43.418<0.001
Table 3. Analysis of Deviance table (Type III Wald chisquare tests) of the mixed effect regression model (Equation (3)) describing species’ growth (log-volume) response to changing gap environments (gap-position).
ParametersChi SquareDFp Value
Intercept1.1810.278
Species60.538<0.001
Gap-position45.911<0.001
Gap-position241.841<0.001
Species × gap-position44.848<0.001
Species × gap-position240.398<0.001
Table 4. Species volume at different gap positions and percent growth reductions relative to the peak (in parenthesis). Edge positions are measured observations within 5 m distance from the gap edge. The bottom row reports light transmittance as percentage of the open.
Volume (dm3) and Growth Reductions (%)
Species South EdgePeakNorth Edge
lodgepole pine 8.3 (−83%)50.119.6 (−61%)
paper birch 0.5 (−96%)10.71.4 (−87%)
ponderosa pine1.8 (−97%)56.213.4 (−76%)
Douglas fir1.6 (−92%)19.53.7 (−81%)
white pine2.1 (−87%)16.23.5 (−78%)
Engelmann spruce 2.1 (−75%)8.33.6 (−57%)
western redcedar 0.7 (−94%)11.51.1 (−90%)
subalpine fir 2.2 (−85%)15.13.5 (−77%)
western hemlock 4.9 (−70%)16.52.8 (−83%)
Light level (%)185037
Publisher’s Note: MDPI stays neutral with regard to jurisdictional claims in published maps and institutional affiliations.

