
Ecological Restoration of a Loess Open-Cast Mining Area in China: Perspective from an Ecological Security Pattern

Abstract
:1. Introduction
2. Materials and Methodology
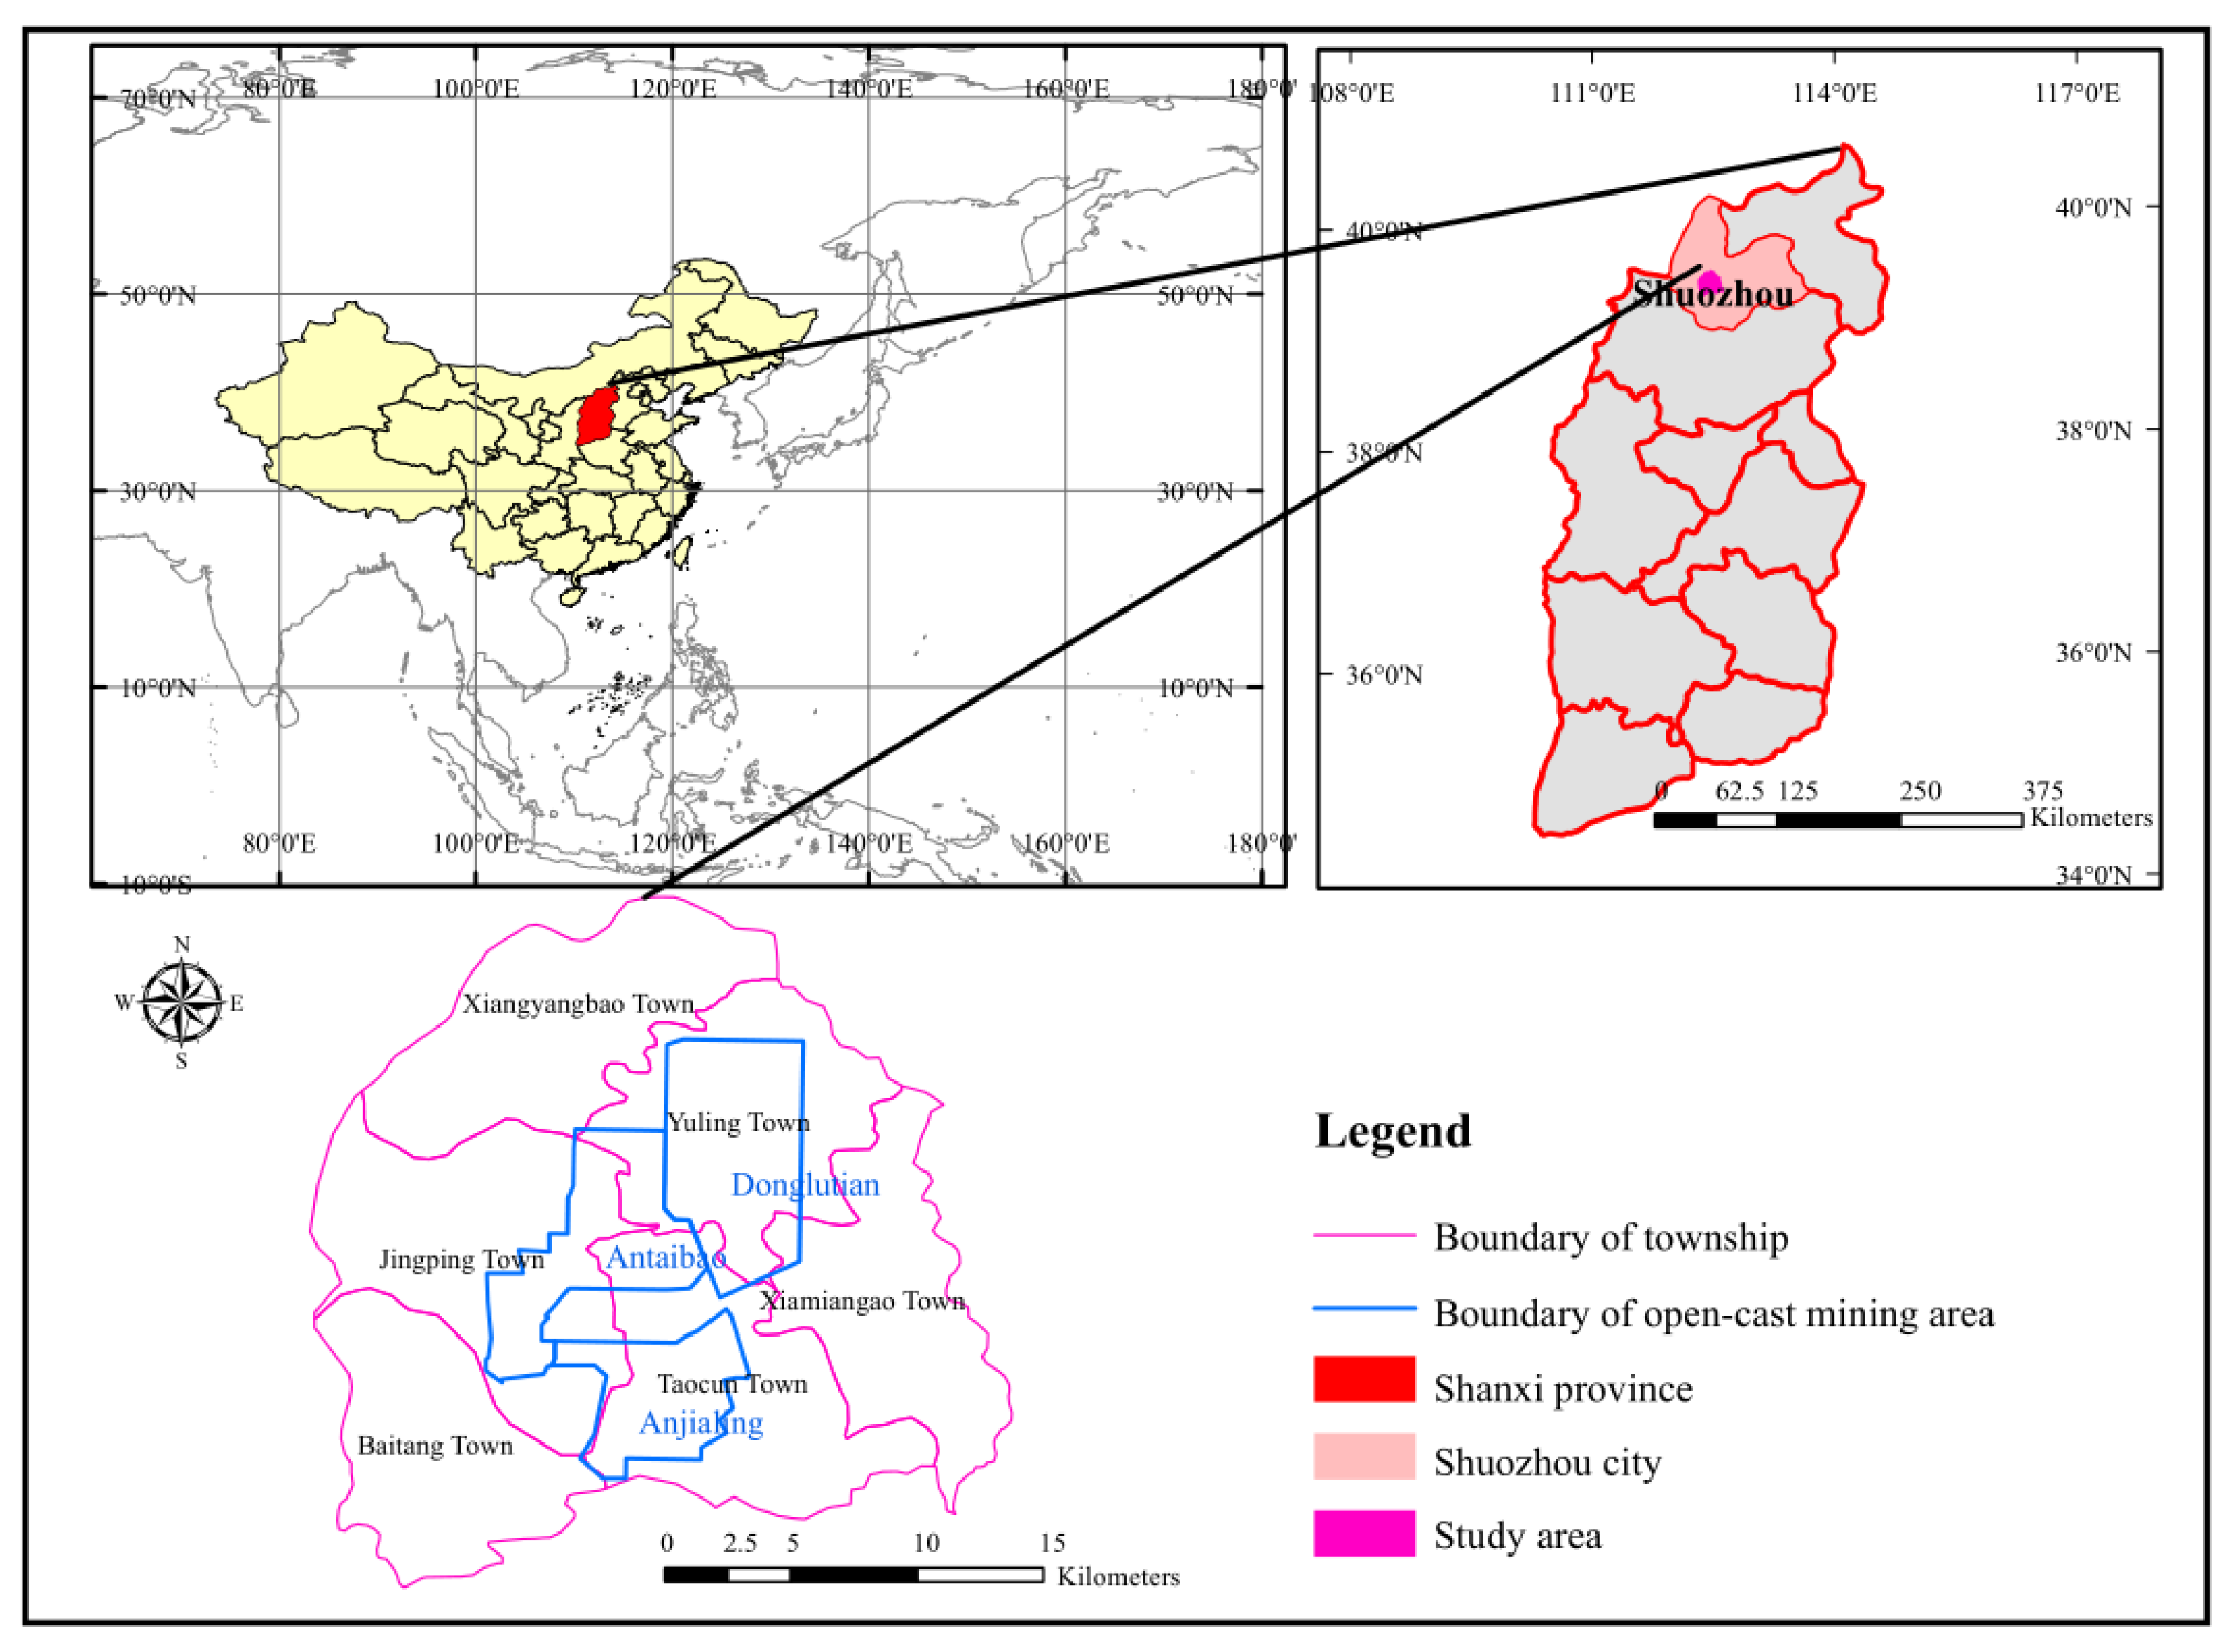
2.1. Study Area
2.2. Data Sources
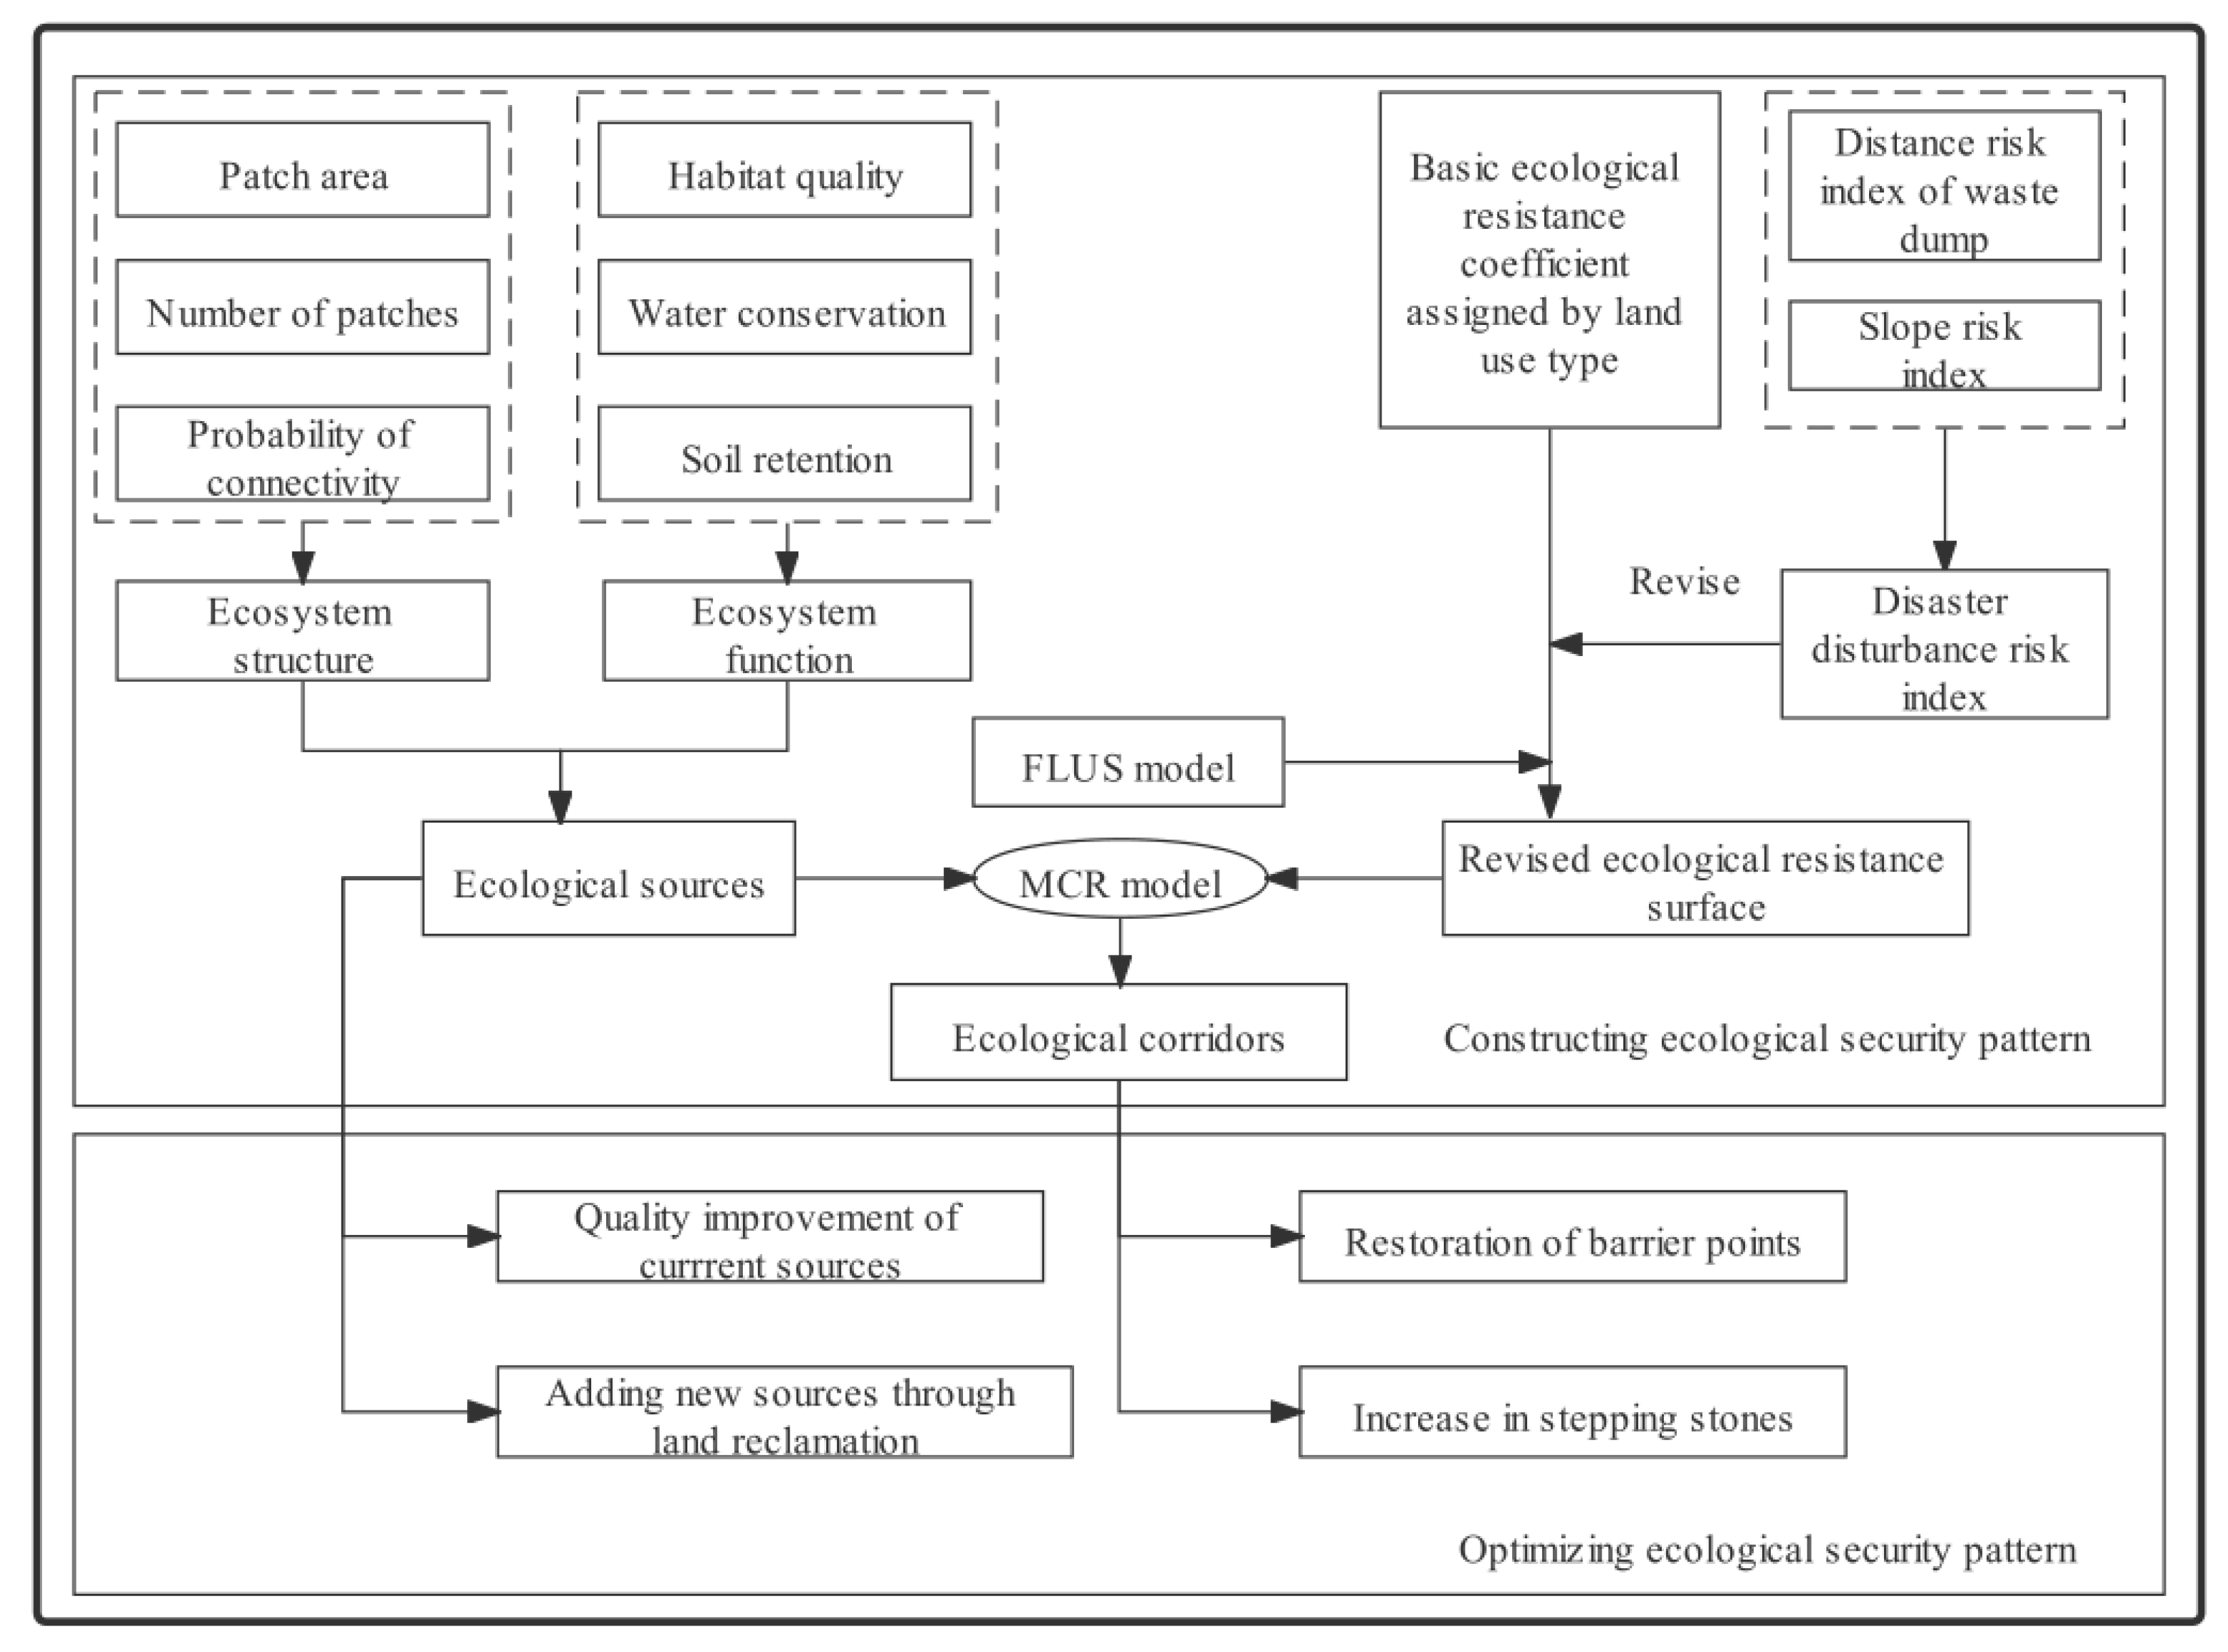
2.3. Methodology
2.3.1. Identifying Ecological Security Sources
- (1)
- Measuring ecosystem structure
- (2)
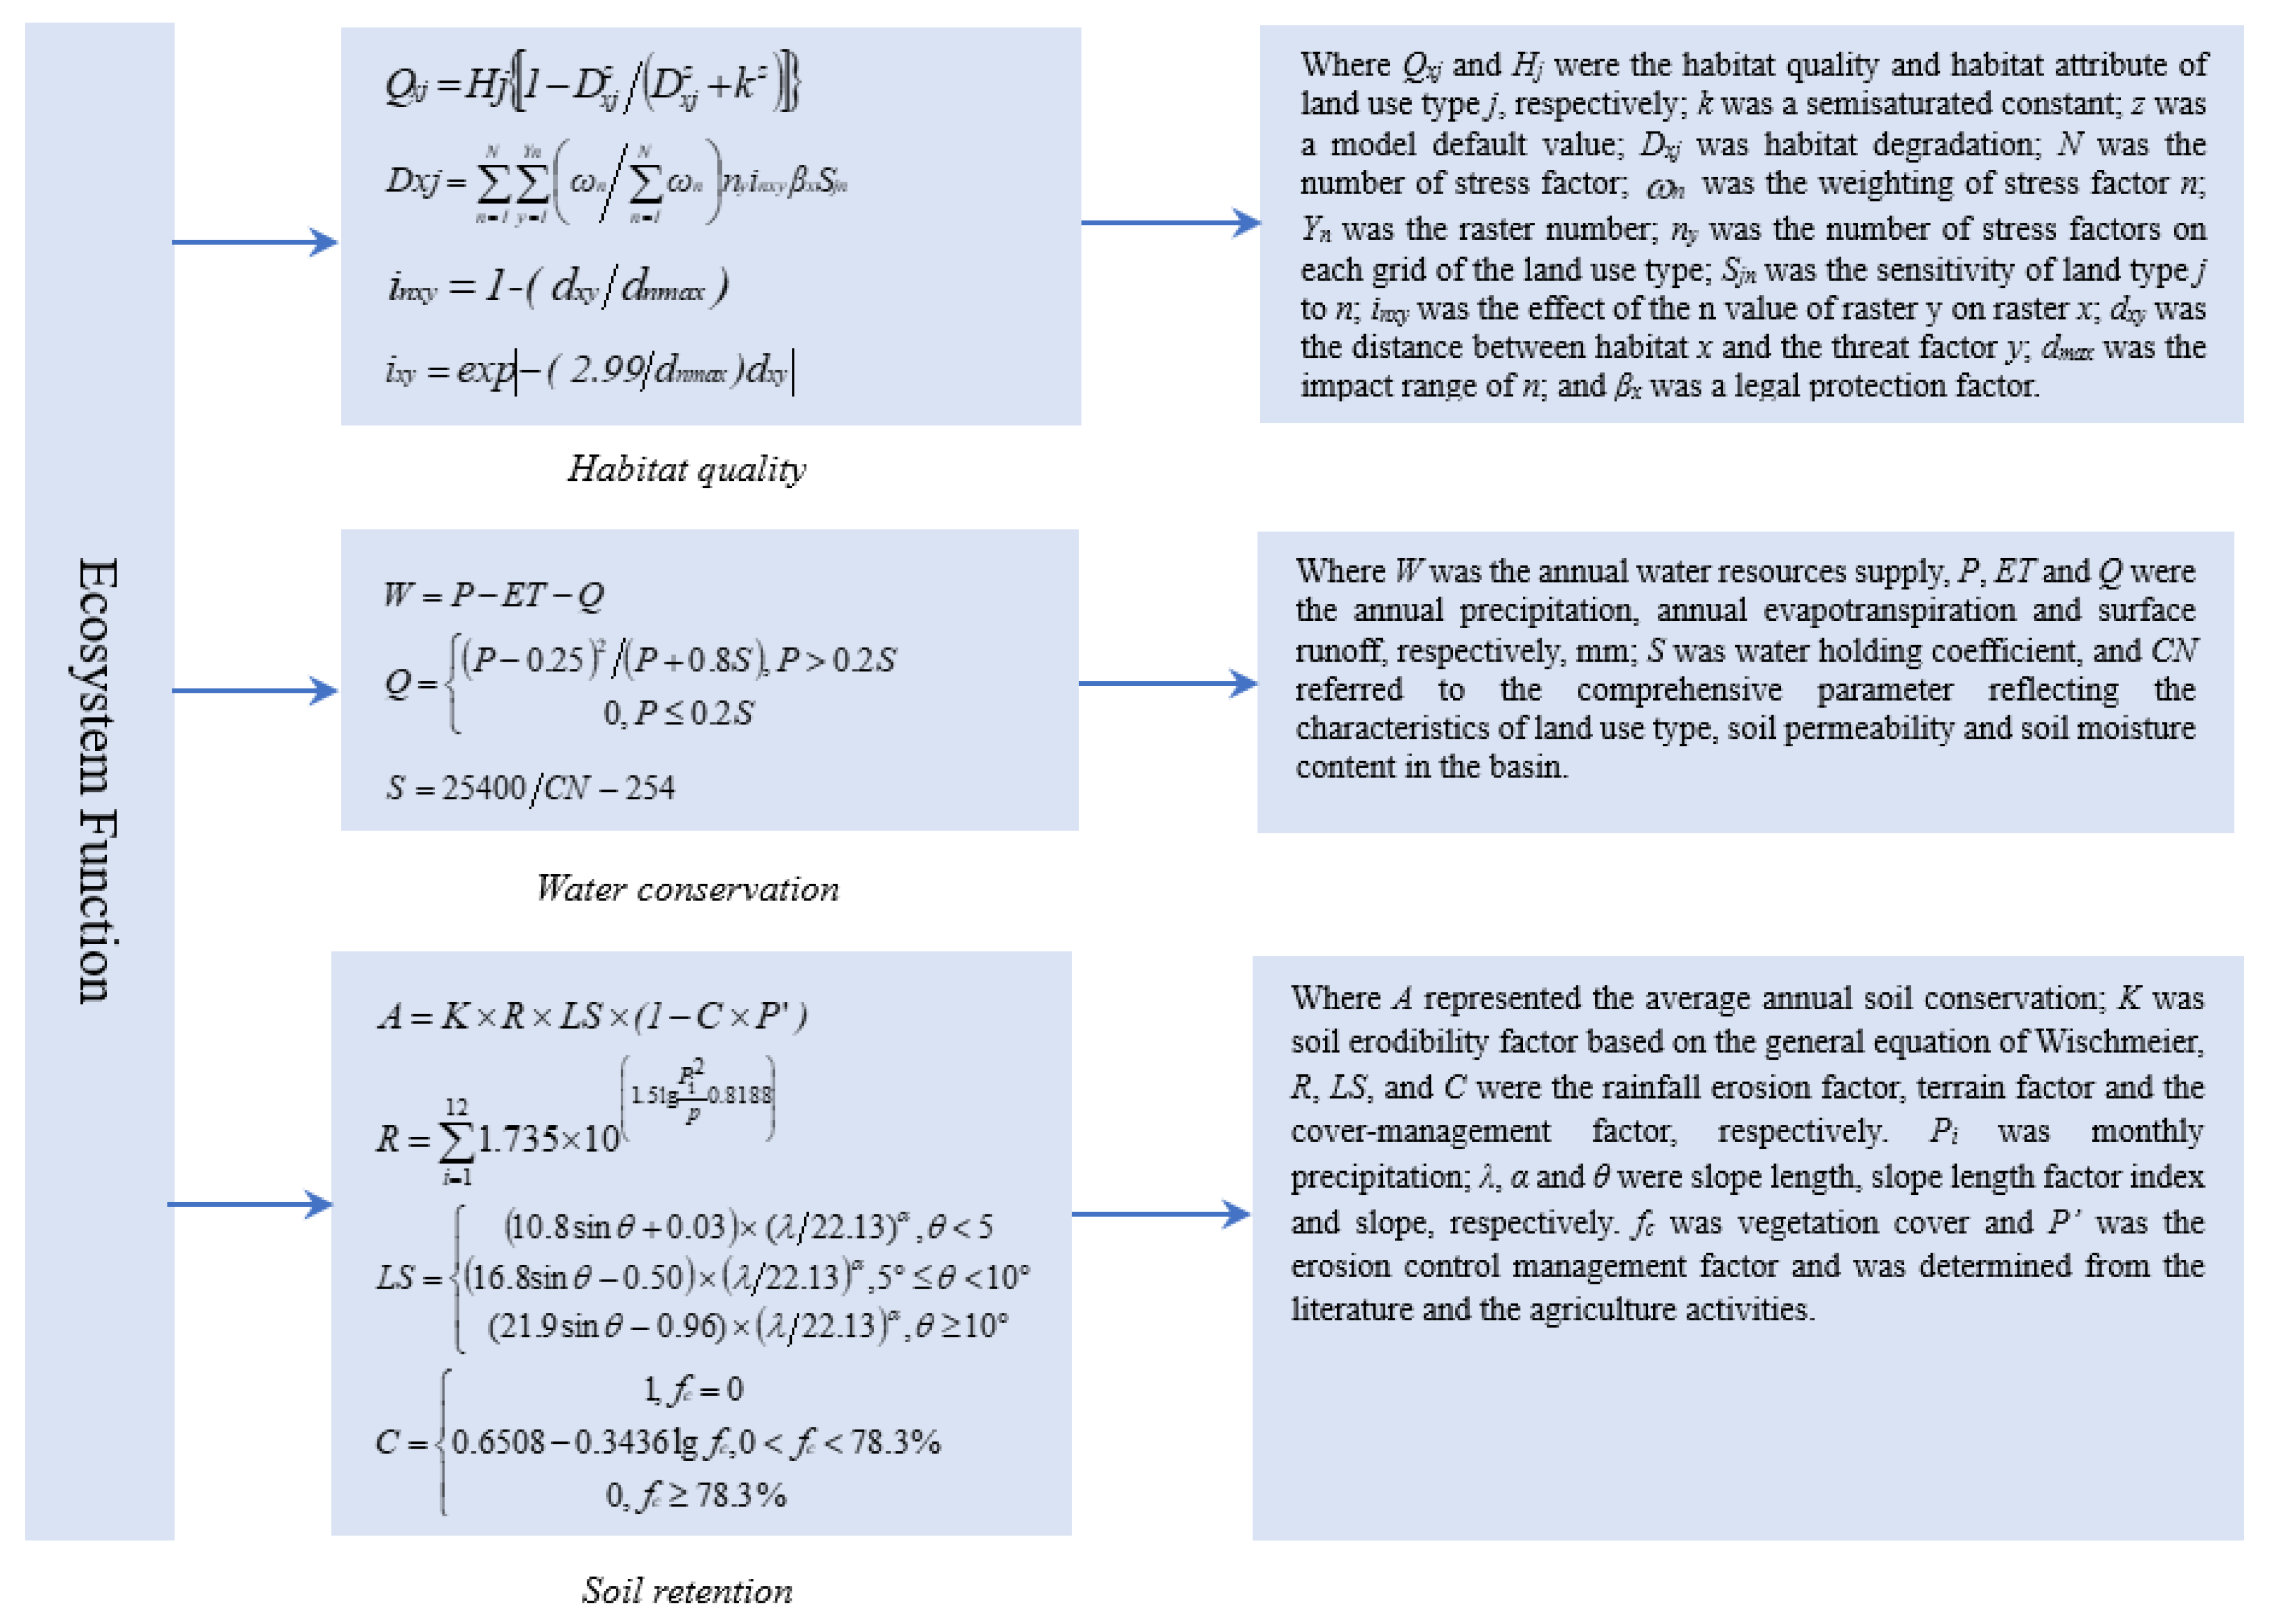
- Measuring ecosystem function
- (3)
- Selecting ecological sources comprehensively considering structure and function
2.3.2. Revising Ecological Resistance Surface Using Disaster Disturbance Risk Index
2.3.3. Extraction of Potential Ecological Corridors Using the MCR Model
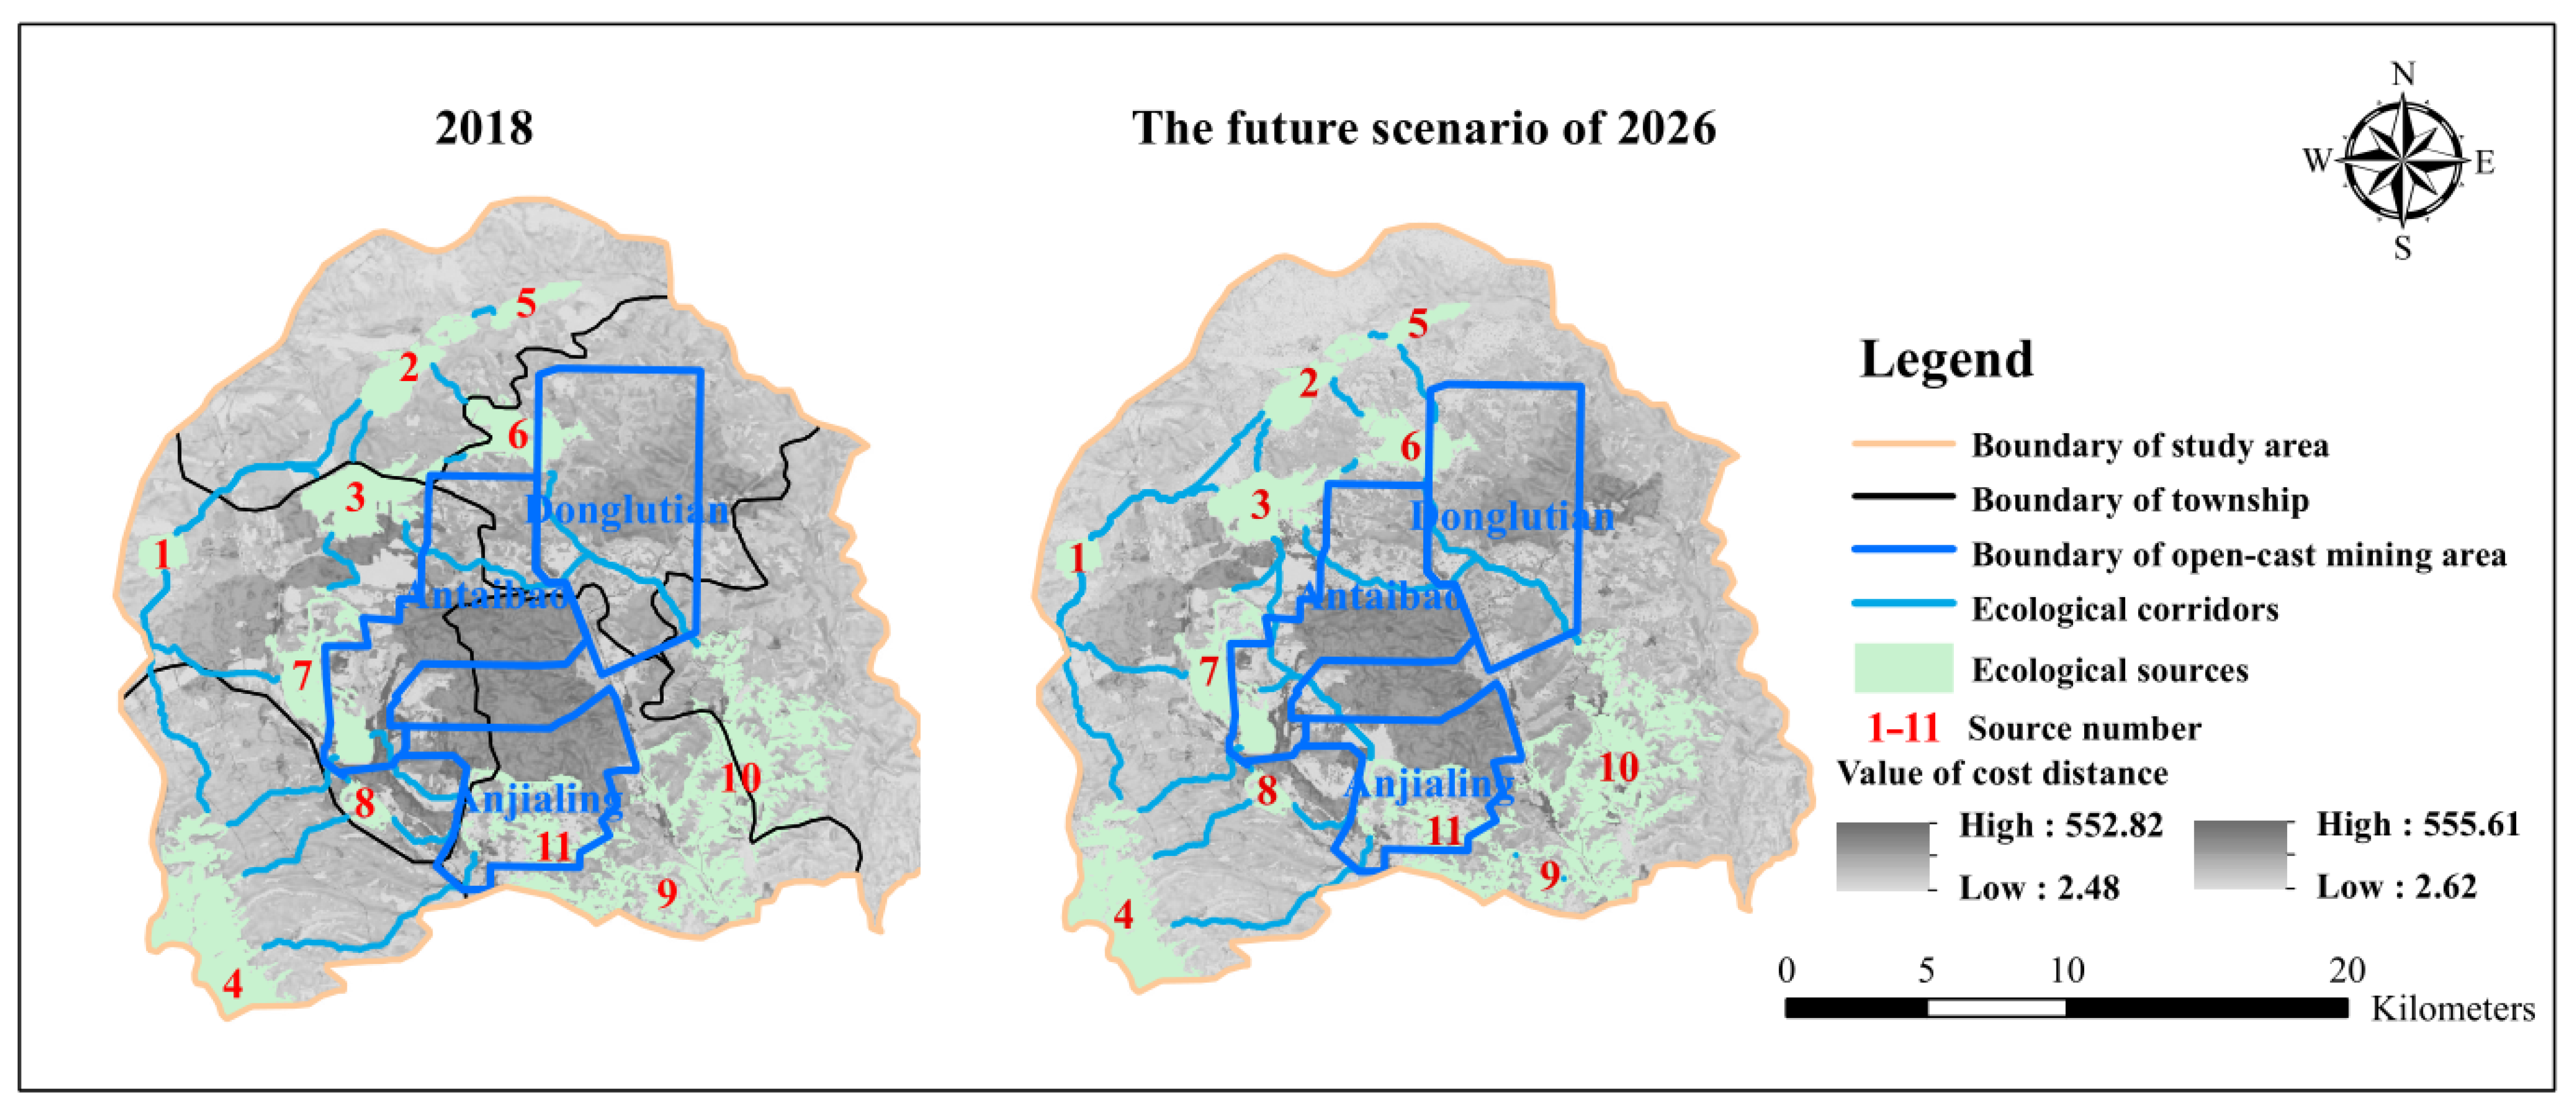
2.3.4. Ecological Risk Prediction Based on a Future Land-Use Simulation Model (FLUS)
3. Results
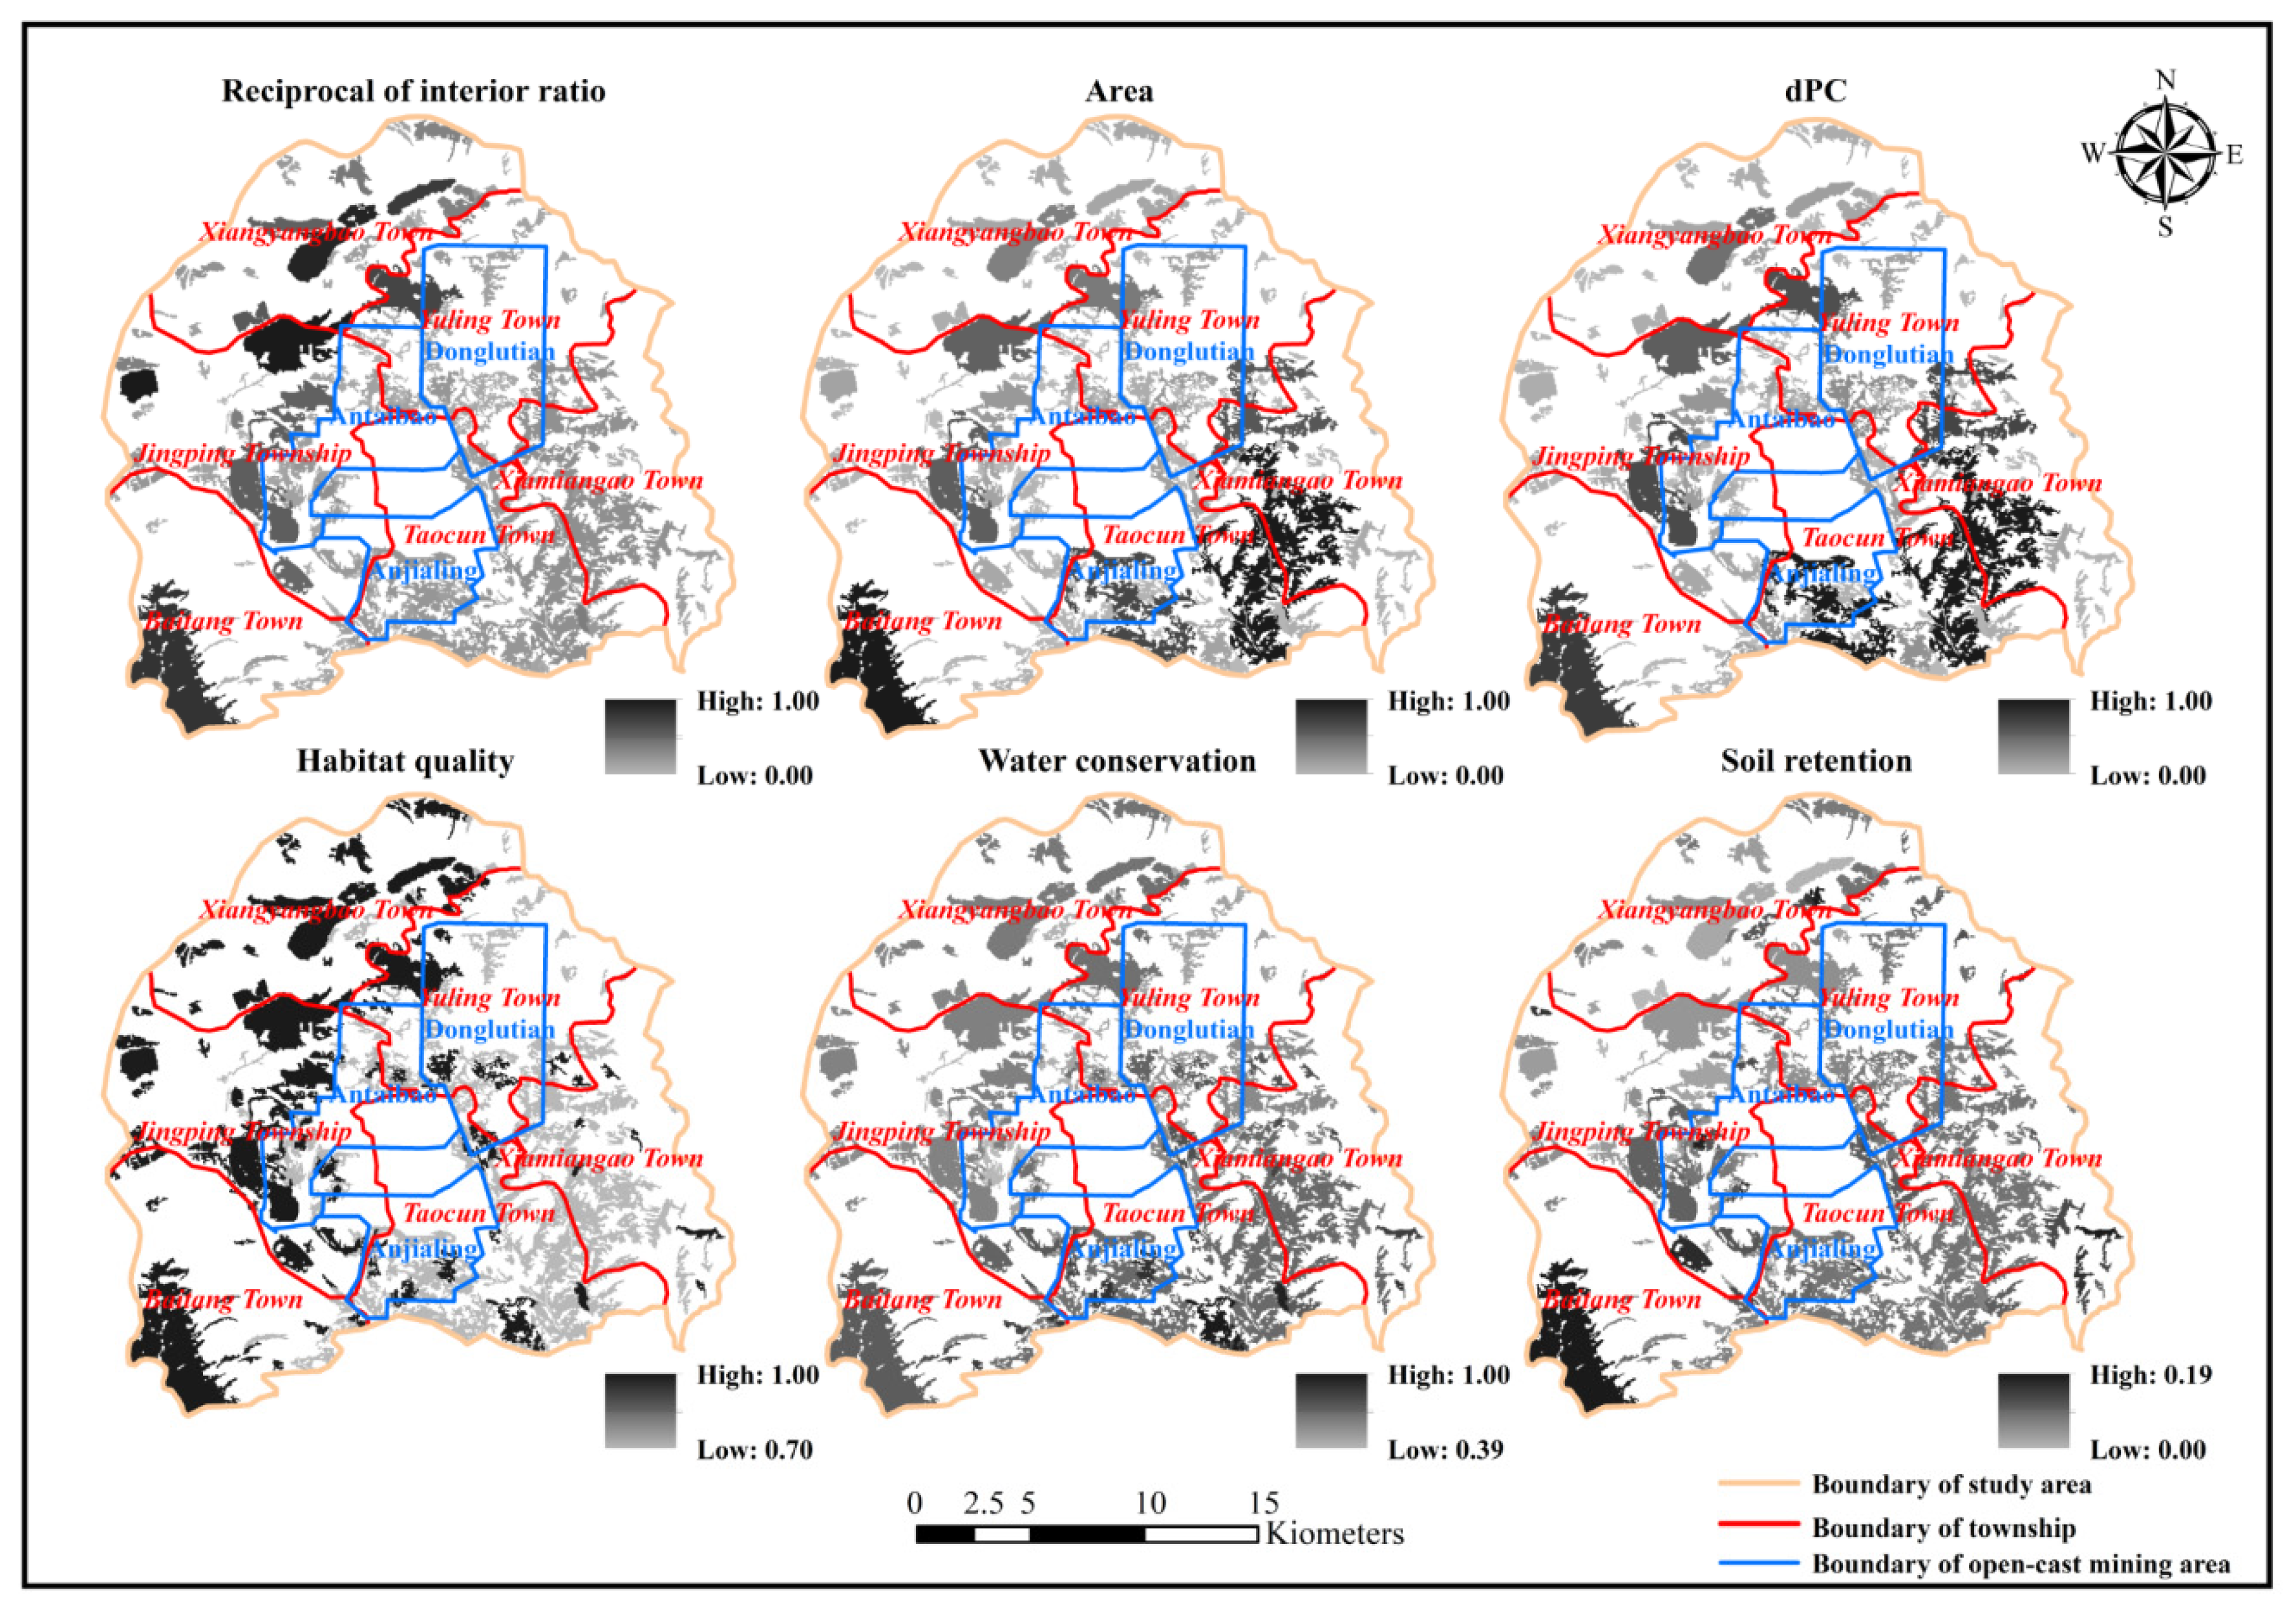
3.1. The Values of Potential Ecological Sources Based on Structure and Function
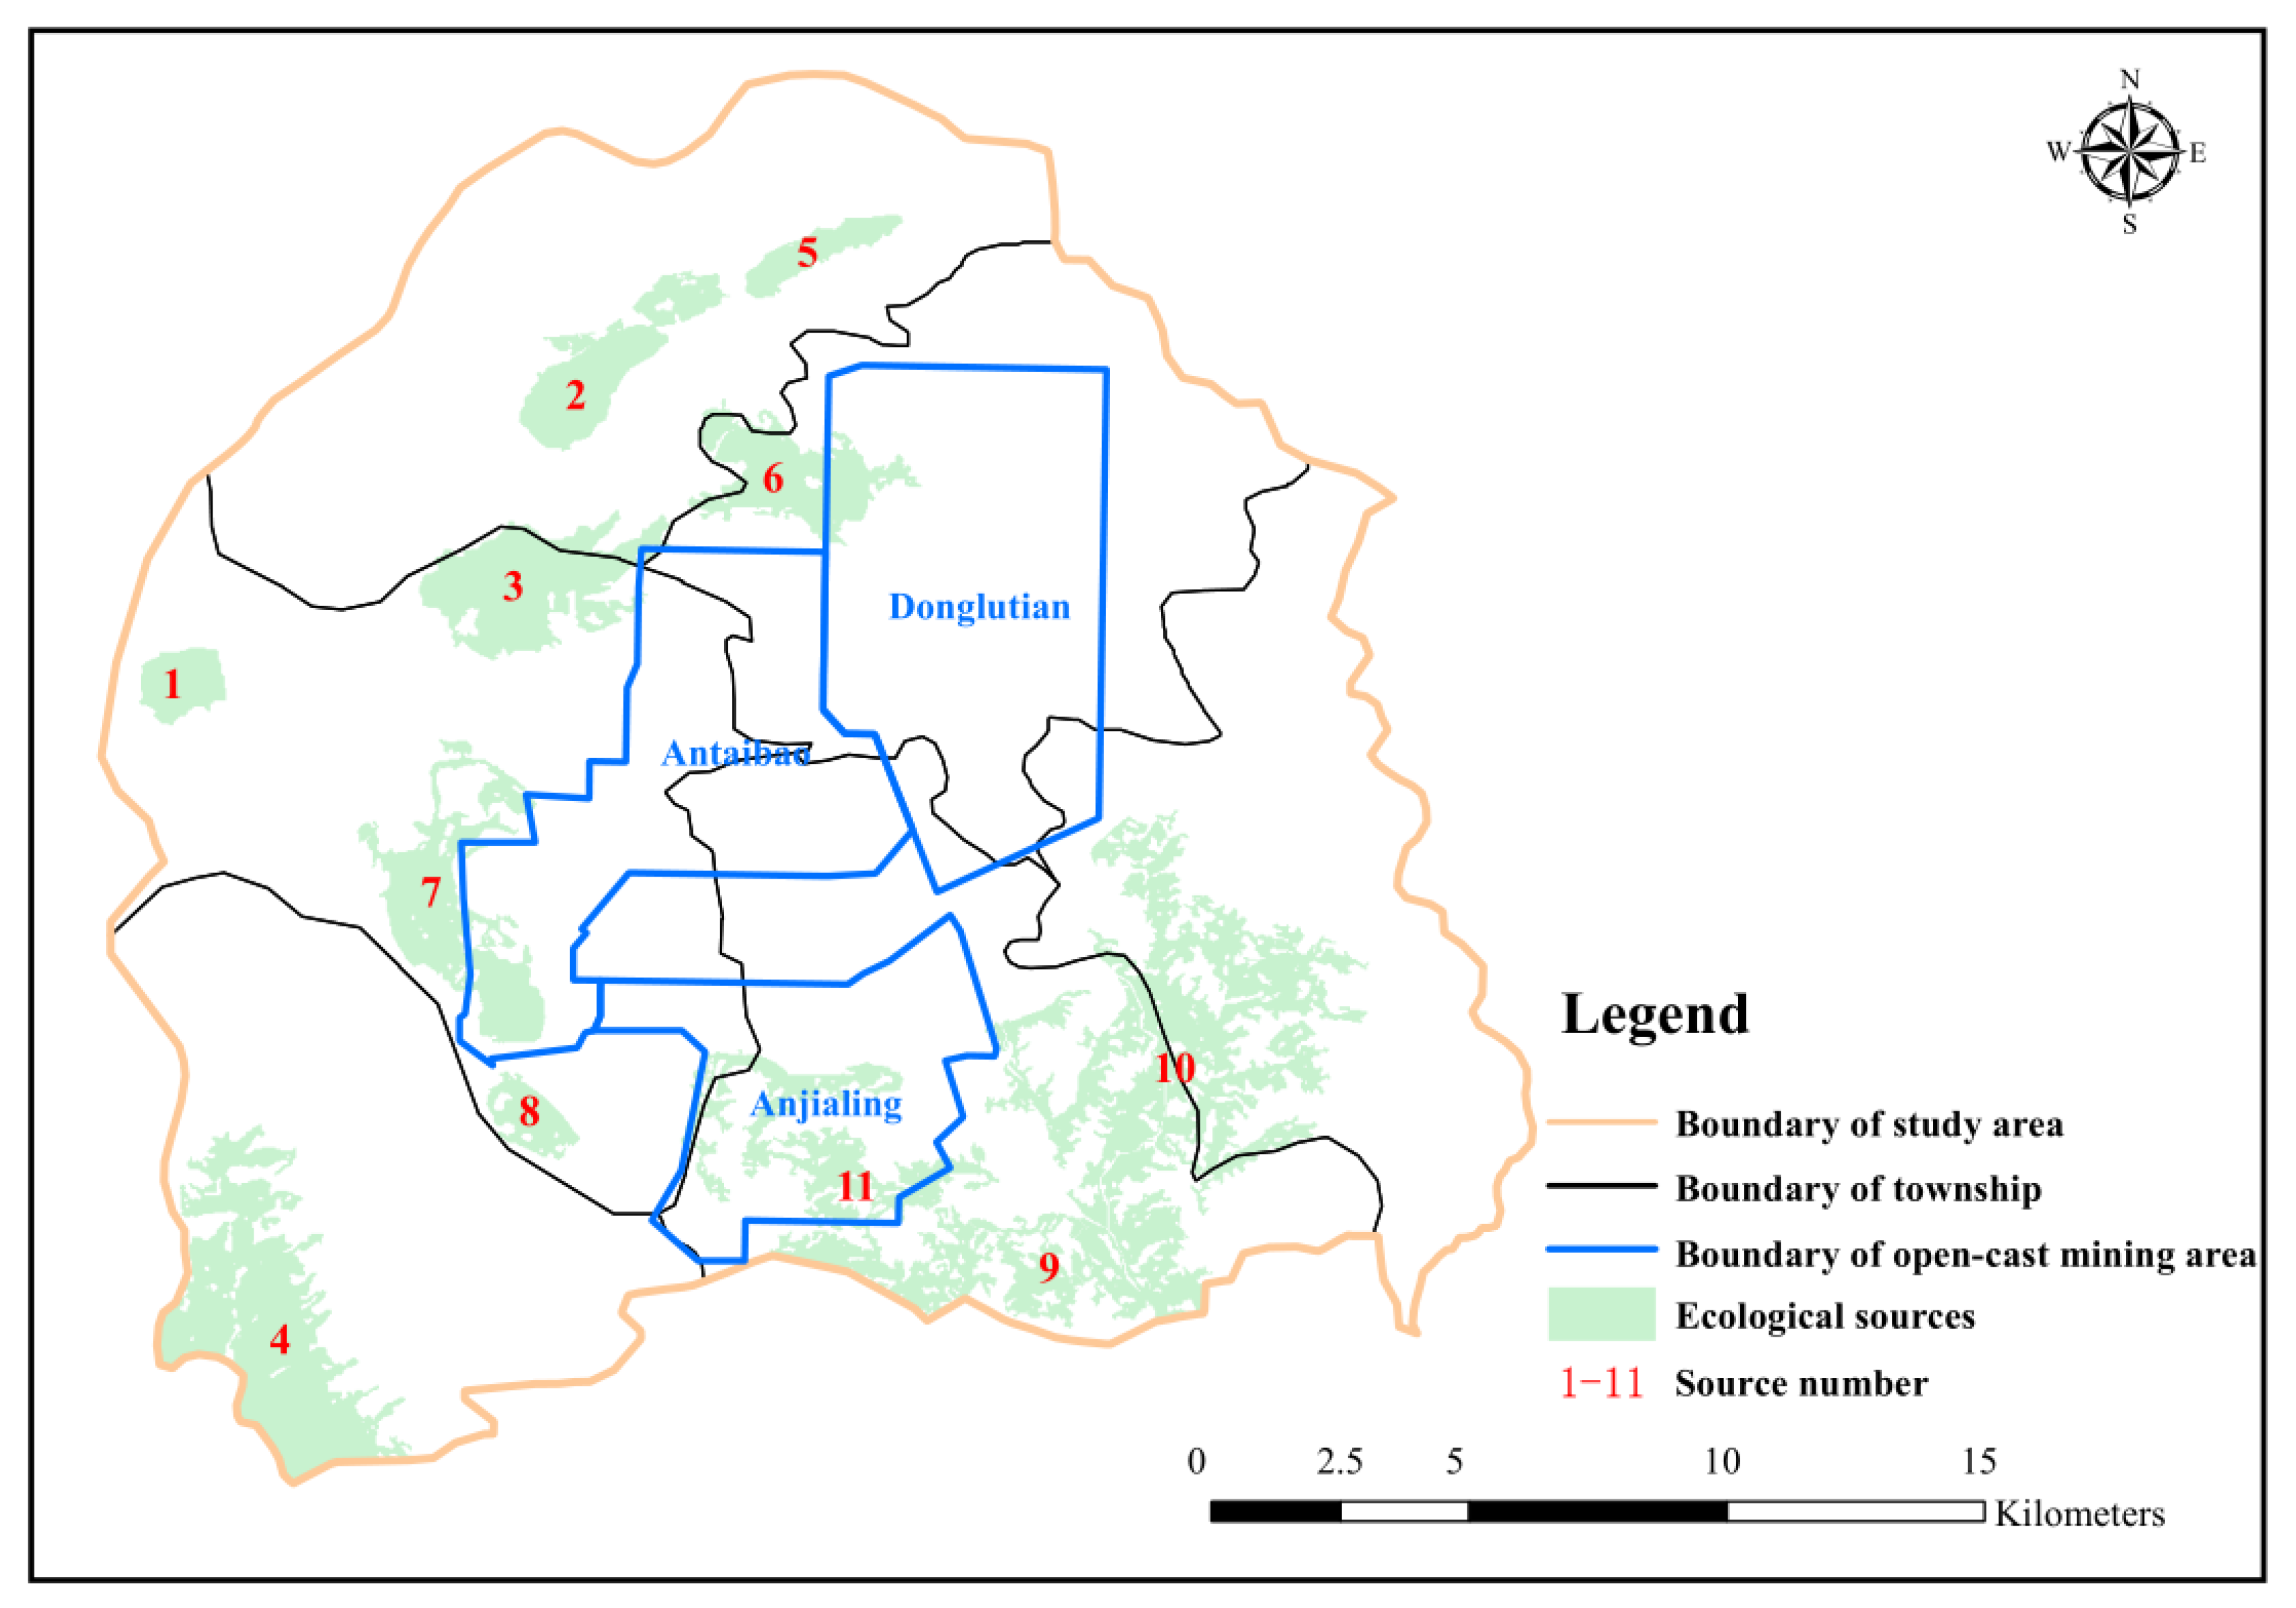
3.2. Ecological Sources
3.3. Ecological Resistance Surface
3.4. Ecological Corridors
3.5. Optimization of ESP
4. Discussion
5. Conclusions
Author Contributions
Funding
Data Availability Statement
Acknowledgments
Conflicts of Interest
References
- Asr, E.T.; Kakaie, R.; Ataei, M.; Mohammadi, M.R.T. A review of studies on sustainable development in mining life cycle. J. Clean. Prod. 2019, 229, 213–231. [Google Scholar] [CrossRef]
- Su, W.; Liu, D.; Chang, Q. Urban land use optimization in mining area from the perspective of maximizing ecosystem services. In Proceedings of the 3rd International Conference on Energy Engineering and Environmental Protection (EEEP), Sanya, China, 19–21 November 2019. [Google Scholar]
- Xia, K.; Chen, C.; Zheng, Y.; Zhang, H.; Liu, X.; Deng, Y.; Yang, K. Engineering geology and ground collapse mechanism in the Chengchao Iron-ore Mine in China. Eng. Geol. 2019, 249, 129–147. [Google Scholar] [CrossRef]
- Yu, K. Landscape ecological security pattern in biological conservation. Acta Ecol. Sin. 1999, 19, 10–17. [Google Scholar]
- Peng, J.; Yang, Y.; Liu, Y.; Hu, Y.N.; Du, Y.; Meersmans, J.; Qiu, S. Linking ecosystem services and circuit theory to identify ecological security patterns. Sci. Total Environ. 2018, 644, 781–790. [Google Scholar] [CrossRef] [Green Version]
- Su, Y.; Chen, X.; Liao, J.; Zhang, H.; Wang, C.; Ye, Y.; Wang, Y. Modeling the optimal ecological security pattern for guiding the urban constructed land expansions. Urban For. Urban Green. 2016, 19, 35–46. [Google Scholar] [CrossRef]
- Peng, J.; Pan, Y.; Liu, Y.; Zhao, H.; Wang, Y. Linking ecological degradation risk to identify ecological security patterns in a rapidly urbanizing landscape. Habitat Int. 2018, 71, 110–124. [Google Scholar] [CrossRef]
- Li, S.; Xiao, W.; Zhao, Y.; Lv, X. Incorporating ecological risk index in the multi-process MCRE model to optimize the ecological security pattern in a semi-arid area with intensive coal mining: A case study in northern China. J. Clean. Prod. 2020, 247, 119143. [Google Scholar] [CrossRef]
- Kong, F.; Yin, H.; Nakagoshi, N.; Zong, Y. Urban green space network development for biodiversity conservation: Identification based on graph theory and gravity modeling. Landsc. Urban Plan. 2010, 95, 16–27. [Google Scholar] [CrossRef]
- Beier, P.; Majka, D.R.; Spencer, W.D. Forks in the road: Choices in procedures for designing wildland linkages. Conserv. Biol. 2008, 22, 836–851. [Google Scholar] [CrossRef]
- Pickett, S.T.A.; Cadenasso, M.L.; Rosi-Marshall, E.J.; Belt, K.T.; Groffman, P.M.; Grove, J.M.; Irwin, E.G.; Kaushal, S.S.; LaDeau, S.L.; Nilon, C.H.; et al. Dynamic heterogeneity: A framework to promote ecological integration and hypothesis generation in urban systems. Urban Ecosyst. 2017, 20, 1–14. [Google Scholar] [CrossRef] [Green Version]
- Wang, C.; Yu, C.; Chen, T.; Feng, Z.; Hu, Y.; Wu, K. Can the establishment of ecological security patterns improve ecological protection? An example of Nanchang, China. Sci. Total Environ. 2020, 740, 140051. [Google Scholar] [CrossRef]
- Li, S.; Zhao, Y.; Xiao, W.; Yue, W.; Wu, T. Optimizing ecological security pattern in the coal resource-based city: A case study in Shuozhou City, China. Ecol. Indic. 2021, 130, 108026. [Google Scholar] [CrossRef]
- Zhang, L.; Peng, J.; Liu, Y.; Wu, J. Coupling ecosystem services supply and human ecological demand to identify landscape ecological security pattern: A case study in Beijing-Tianjin-Hebei region, China. Urban Ecosyst. 2017, 20, 701–714. [Google Scholar] [CrossRef]
- Fu, Y.; Shi, X.; He, J.; Yuan, Y.; Qu, L. Identification and optimization strategy of county ecological security pattern: A case study in the Loess Plateau, China. Ecol. Indic. 2020, 112, 106030. [Google Scholar] [CrossRef]
- Yang, K.; Cao, Y.; Feng, Z.; Geng, B.; Feng, Y.; Wang, S. Research Progress of Ecological Security Pattern Construction Based on Minimum Cumulative Resistance Model. J. Ecol. Rural Environ. 2021, 37, 555–565. [Google Scholar]
- Rabinowitz, A.; Zeller, K.A. A range-wide model of landscape connectivity and conservation for the jaguar, Panthera onca. Biol. Conserv. 2010, 143, 939–945. [Google Scholar] [CrossRef]
- Hepcan, C.C.; Ozkan, M.B. Establishing ecological networks for habitat conservation in the case of CeAYme-Urla Peninsula, Turkey. Environ. Monit. Assess. 2011, 174, 157–170. [Google Scholar] [CrossRef]
- Cao, Y.; Bai, Z.; Zhou, W.; Zhang, X. Characteristic analysis and pattern evolution on landscape types in typical compound area of mine agriculture urban in Shanxi Province, China. Environ. Earth Sci. 2016, 75, 585. [Google Scholar] [CrossRef]
- Wu, J.; Zhu, Q.; Qiao, N.; Wang, Z.; Sha, W.; Luo, K.; Wang, H.; Feng, Z. Ecological risk assessment of coal mine area based on “source-sink” landscape theory e A case study of Pingshuo mining area. J. Clean. Prod. 2021, 295, 126371. [Google Scholar] [CrossRef]
- Wang, H.; Li, H.; Xie, M.; Xu, M.; Li, S.; Bai, Z. Construction of ecological security pattern for systematic restoration of industrial and mining land in resource-based cities. J. Nat. Resour. 2020, 35, 162–173. [Google Scholar]
- Zhou, W.; Yang, K.; Bai, Z.; Cheng, H.; Liu, F. The development of topsoil properties under different reclaimed land uses in the Pingshuo opencast coalmine of Loess Plateau of China. Ecol. Eng. 2017, 100, 237–245. [Google Scholar] [CrossRef]
- Yang, B.; Bai, Z.; Cao, Y.; Xie, F.; Zhang, J.; Wang, Y. Dynamic Changes in Carbon Sequestration from Opencast Mining Activities and Land Reclamation in China’s Loess Plateau. Sustainability 2019, 11, 1473. [Google Scholar] [CrossRef] [Green Version]
- Zhao, C.; Wang, C.; Yan, Y.; Shan, P.; Li, J.; Chen, J. Ecological Security Patterns Assessment of Liao River Basin. Sustainability 2018, 10, 2401. [Google Scholar] [CrossRef] [Green Version]
- Peng, J.; Ma, J.; Du, Y.; Zhang, L.; Hu, X. Ecological suitability evaluation for mountainous area development based on conceptual model of landscape structure, function, and dynamics. Ecol. Indic. 2016, 61, 500–511. [Google Scholar] [CrossRef]
- Dun, Y.; Wang, J.; Bai, Z.; Chen, X.; Guo, Y. Changes in Pingshuo opencast mining area ecosystem service values based on grey prediction modeling. Resour. Sci. 2015, 37, 494–502. [Google Scholar]
- Yang, Z.; Li, W.; Pei, Y.; Qiao, W.; Wu, Y. Classification of the type of eco-geological environment of a coal mine district: A case study of an ecologically fragile region in Western China. J. Clean. Prod. 2018, 174, 1513–1526. [Google Scholar] [CrossRef]
- Raatikainen, K.J.; Olden, A.; Kayhko, N.; Monkkonen, M.; Halme, P. Contemporary spatial and environmental factors determine vascular plant species richness on highly fragmented meadows in Central Finland. Landsc. Ecol. 2018, 33, 2169–2187. [Google Scholar] [CrossRef] [Green Version]
- Saura, S.; Pascual-Hortal, L. A new habitat availability index to integrate connectivity in landscape conservation planning: Comparison with existing indices and application to a case study. Landsc. Urban Plan. 2007, 83, 91–103. [Google Scholar] [CrossRef]
- Hall, L.S.; Krausman, P.R.; Morrison, M.L. The habitat concept and a plea for standard terminology. Wildl. Soc. Bull. 1997, 25, 173–182. [Google Scholar]
- Maes, J.; Paracchini, M.L.; Zulian, G.; Dunbar, M.B.; Alkemade, R. Synergies and trade-offs between ecosystem service supply, biodiversity, and habitat conservation status in Europe. Biol. Conserv. 2012, 155, 1–12. [Google Scholar] [CrossRef]
- Moreira, M.; Fonseca, C.; Vergilio, M.; Calado, H.; Gil, A. Spatial assessment assessment of habitat conservation status in a Macaronesian island based on the InVEST model: A case study of Pico Island (Azores, Portugal). Land Use Policy 2018, 78, 637–649. [Google Scholar] [CrossRef]
- Zhu, C.; Zhang, X.; Zhou, M.; He, S.; Gan, M.; Yang, L.; Wang, K. Impacts of urbanization and landscape pattern on habitat quality using OLS and GWR models in Hangzhou, China. Ecol. Indic. 2020, 117, 106654. [Google Scholar] [CrossRef]
- Fu, B.; Chen, L. Landscape diversity types and their ecological significance. Acta Ecol. Sin. 1996, 5, 454–462. [Google Scholar]
- Peng, J.; Hu, X.; Qiu, S.; Hu, Y.N.; Meersmans, J.; Liu, Y. Multifunctional landscapes identification and associated development zoning in mountainous area. Sci. Total Environ. 2019, 660, 765–775. [Google Scholar] [CrossRef] [Green Version]
- Wang, J.; Guo, L.; Bai, Z.; Yang, R.; Zhang, M. Succession law of reclaimed soil and vegetation on opencast coal mine dump of loess area. Trans. Chin. Soc. Agric. Eng. 2013, 29, 223–232. [Google Scholar]
- Sun, Q.; Bai, Z.; Cao, Y.; Xie, M.; Hu, X.; Jiang, Y.; Lu, Y. Ecological risk assessment of land destruction in large open-pit mine. Trans. Chin. Soc. Agric. Eng. 2015, 31, 278–288. [Google Scholar]
- Liu, X.; Liang, X.; Li, X.; Xu, X.; Ou, J.; Chen, Y.; Li, S.; Wang, S.; Pei, F. A future land use simulation model (FLUS) for simulating multiple land use scenarios by coupling human and natural effects. Landsc. Urban Plan. 2017, 168, 94–116. [Google Scholar] [CrossRef]
- Dakos, V.; Soler-Toscano, F. Measuring complexity to infer changes in the dynamics of ecological systems under stress. Ecol. Complex. 2017, 32, 144–155. [Google Scholar] [CrossRef]
- Gong, J.-Z.; Liu, Y.-S.; Xia, B.-C.; Zhao, G.-W. Urban ecological security assessment and forecasting, based on a cellular automata model: A case study of Guangzhou, China. Ecol. Model. 2009, 220, 3612–3620. [Google Scholar] [CrossRef]
- Yang, G.; Cao, Y.; Zhuang, Y.; Zhang, Z.; Bai, Z. Study on ecosystem resilience of large-scale open pit mining area in north Shanxi. J. Agric. Resour. Environ. 2020, 37, 562–573. [Google Scholar]
- Hu, Z.; Wei, Z.; Qin, P. Concept ofand methods for soil reconstruction in mined land research. Soils 2005, 37, 8–12. [Google Scholar]
- Feng, Y.; Wang, J.; Bai, Z.; Reading, L. Effects of surface coal mining and land reclamation on soil properties: A review. Earth-Sci. Rev. 2019, 191, 12–25. [Google Scholar] [CrossRef]
- Coal Industry Committee of Technology. Key Technology and Engineering Practice of Green Ecological Environment Reconstruction in Pingshuo Open-Pit Mining Area; China Coal Industry Publishing House: Beijing, China, 2019; pp. 37–55. [Google Scholar]
- Hao, R.; Bai, Z.; Zhao, J.; Peng, S.; Soun, Y. Vegetation dynamics during plant rehabilition in degraded mined land of large opencast coal mine within loess area. Acta Ecol. Sin. 2003, 23, 1470–1476. [Google Scholar]


| Source Types | Ecosystem Structure | Ecosystem Function | ||||
|---|---|---|---|---|---|---|
| Area | Reciprocal of Interior Ratio | dPC | Habitat Quality | Water Conservation | Soil Retention | |
| Original forest sources (Sources 2, 3, 4, 5, 6 9) | 1.00 | 1.00 | 1.00 | 1.00 | 1.00 | 1.00 |
| Reclamation land sources (Source 7, 8) | 0.78 | 0.72 | 0.82 | 0.97 | 0.93 | 0.71 |
Publisher’s Note: MDPI stays neutral with regard to jurisdictional claims in published maps and institutional affiliations. |
© 2022 by the authors. Licensee MDPI, Basel, Switzerland. This article is an open access article distributed under the terms and conditions of the Creative Commons Attribution (CC BY) license (https://creativecommons.org/licenses/by/4.0/).
Share and Cite
Yang, K.; Wang, S.; Cao, Y.; Li, S.; Zhou, W.; Liu, S.; Bai, Z. Ecological Restoration of a Loess Open-Cast Mining Area in China: Perspective from an Ecological Security Pattern. Forests 2022, 13, 269. https://doi.org/10.3390/f13020269
Yang K, Wang S, Cao Y, Li S, Zhou W, Liu S, Bai Z. Ecological Restoration of a Loess Open-Cast Mining Area in China: Perspective from an Ecological Security Pattern. Forests. 2022; 13(2):269. https://doi.org/10.3390/f13020269
Chicago/Turabian StyleYang, Kai, Shufei Wang, Yingui Cao, Shengpeng Li, Wenxiang Zhou, Shihan Liu, and Zhongke Bai. 2022. "Ecological Restoration of a Loess Open-Cast Mining Area in China: Perspective from an Ecological Security Pattern" Forests 13, no. 2: 269. https://doi.org/10.3390/f13020269
APA StyleYang, K., Wang, S., Cao, Y., Li, S., Zhou, W., Liu, S., & Bai, Z. (2022). Ecological Restoration of a Loess Open-Cast Mining Area in China: Perspective from an Ecological Security Pattern. Forests, 13(2), 269. https://doi.org/10.3390/f13020269