Article

Spatiotemporal Dynamics and Factors Driving the Distributions of Pine Wilt Disease-Damaged Forests in China

School of Design & China Institute for Urban Governance, Shanghai Jiao Tong University, Shanghai 200240, China
*
Author to whom correspondence should be addressed.
Forests 2022, 13(2), 261; https://doi.org/10.3390/f13020261
Submission received: 24 December 2021 / Revised: 31 January 2022 / Accepted: 2 February 2022 / Published: 7 February 2022
(This article belongs to the Section Forest Health)

Abstract

:
Many forests have suffered serious economic losses and ecological consequences of pine wilt disease (PWD) outbreaks. Climate change and human activities could accelerate the distribution of PWD, causing the exponential expansion of damaged forest areas in China. However, few studies have analyzed the spatiotemporal dynamics and the factors driving the distribution of PWD-damaged forests using continuous records of long-term damage, focusing on short-term environmental factors that influence multiple PWD outbreaks. We used a maximum entropy (MaxEnt) model that incorporated annual meteorological and human activity factors, as well as temporal dependence (the PWD distribution in the previous year), to determine the contributions of environmental factors to the annual distribution of PWD-damaged forests in the period 1982–2020. Overall, the MaxEnt showed good performance in modeling the PWD-damaged forest distributions between 1982 and 2020. Our results indicate that (i) the temporal lag dependence term for the presence/absence of PWD was the best predictor of the distribution of PWD-damaged forests; and (ii) Bio14 (precipitation in the driest month) was the most important meteorological factor for affecting the PWD-damaged forests. These results are essential to understanding the factors governing the distribution of PWD-damaged forests, which is important for forest management and pest control worldwide.

1. Introduction

Forests are the largest component of the terrestrial carbon cycle, acting as a large carbon sink in terrestrial ecosystems and maintaining the Earth’s carbon balance [1]. Pine wilt disease (PWD), caused by the presence of pine wood nematode (PWN), is one of the most severe forest diseases worldwide [2,3]. PWN, also known as Bursaphelenchus xylophilus, is native to North America and has spread to several countries since the early 20th century (Japan in 1905, China in 1982, Taiwan in 1985, Korea in 1988, and Portugal in 1999) [4,5,6,7,8]. It was introduced to China in 1982, and the most serious PWD outbreak occurred in 2018–2020, with an increase of 1200% in the damaged forest area relative to that in 2017 [9]. PWD-damaged forests were discovered in 718 county-level administrative divisions in 17 provinces of China by the end of December 2020, with ~19.5 million dead trees and ~1.81 million hectares infected [9]. This widespread PWD outbreak in China caused major economic losses and ecological consequences for pine forests [5,10,11].
Climate change and human activities have contributed to the extent and severity of PWD outbreaks [2,12,13]. Temperature and precipitation are the primary climatic factors associated with these outbreaks [2,14,15]. Warm winter temperatures enhance the survival of overwintering populations of PWN, whereas cold temperatures retard its spread and delay its life cycle [16,17,18]. Previous studies have demonstrated that PWD has never occurred when the mean air temperature is <20 °C in the warmest month or <−10 °C in the coldest month [15,19]. Another important climatic driving of PWD is the water stress experienced by the host trees. A significant drought is likely to pose a greater risk to host tree species than PWN, so pine species affected by water deficit are highly susceptible to PWD outbreaks [20,21].
The rapid expansion of the geographic range of PWD into new areas of China in recent years indicates that its changing distributions are probably associated with short-term climatic variation [22]. The bioclimatic variables provided by the World Climate database (WorldClim) are the factors most commonly used to predict species distributions [23]. The WorldClim bioclimatic (BIO) variables are climatic factors averaged over several decades, which have been widely used for modeling species distribution. However, they are not adequate for explaining a sudden PWD outbreak (such as the serious PWD expansion in China in 2018–2020) because this coarse temporal resolution (typically 30 years) does not fully reflect the local conditions of an outbreak. Furthermore, climate is characterized not only as the average weather over an extended period but also as short-term extreme climate and weather events. The analysis of short-term climate changes, which are characterized by annual BIO variables using the monthly and quarterly observations for each year, on species outbreaks has become particularly important with increasingly serious climate and weather anomalies [24]. However, few studies have reported the direct or indirect effects of short-term climatic variations and extreme events on PWD outbreaks using BIO variables at a fine temporal resolution (within an interval of 1 year).
The temporal lag effects of the existing distribution of a species are also considered in species distribution modeling to estimate the presence of new infestations in an area [25]. The existing PWD distribution in the current year is strongly associated with the previous year’s distribution owing to significant temporal trends of population growth. This temporal dependence is related to the short dispersal distance of PWN within short time intervals, which can easily spread to close locations that tend to have similar environmental conditions with the infested areas.
Human activities increase the risk of the transportation of PWN-infested wooden packaging materials and may be responsible for the long-distance spread of PWD [19]. Such activities are usually characterized by trade and transportation networks at coarse temporal resolutions (usually >5 years), which could explain the long-term variations in species distributions [19]. A time-series nighttime light (NTL) dataset (1992–2020) generated from satellite imagery provides valuable support for monitoring human activities at relatively high temporal (≤1 year, on average) and spatial (≤1 km) resolutions, which is useful in understanding how human activities and economic activities affect species distributions [26,27].
Species distribution models (SDMs) are powerful tools, not only for modeling the potential species distributions but also for quantifying the relative importance of environmental factors in determining those distributions [28]. Maximum entropy (MaxEnt), a machine learning-based SDM, has been widely used to simulate potential distributions of forest pests [2,22]. These MaxEnt models are generally built by integrating PWD occurrences (presence-only or presence-absence records) with different spatial environmental factors [28,29]. Several studies have investigated the meteorological factors that control the current PWD distribution, such as the average monthly mean temperatures in the warmest 3 months and the aridity in three geographic regions (Europe, North America, and East Asia) in 2017 [2]; the mean annual temperature, as the most important of the 19 bioclimatic variables at the national, regional, and local spatial scales in Japan [30]; and water deficit, which increases the susceptibility of pines to PWN [14]. However, there is no agreement among their conclusions. It can be inferred that factors affecting PWD distributions vary across time and space. However, few studies have focused on the changes in factors affecting PWD distributions over a long time series, especially including multiple outbreak cycles.
In this study, we analyzed the distributions of PWD-damaged forests in China and addressed the following questions. (1) What are the spatial and temporal patterns in the distributions of PWD-damaged forests nearly 40 years after the first occurrence of PWD in 1982? (2) What are the primary factors driving the distribution of PWD-damaged forests, and how do they differ from those of historical PWD outbreaks? The results of this study should be helpful in explaining the multiple outbreaks of PWD in China, should allow the formulation of effective management strategies to control PWD-damaged forests, and should provide new insights into the field of PWD prediction.

2. Materials and Methods

2.1. Study Area and Data

The entire Chinese mainland (excluding Hong Kong, Macau, and Taiwan, for which no original PWD data are available) was included in the study. The locations of PWD-damaged forests in China were identified from maps in the published literature and announcements of China’s State Forestry and Grassland Administration. Figure 1 shows the locations of the PWD-damaged forests in 2020. The location data obtained at the district level were converted to points by using the centroids of districts, as several other authors have done [31,32], which could be used for the further analysis of the distribution of PWD-damaged forests. The location data for 1982–2002 were obtained directly from existing maps and are generally less accurate than actual announcements.

2.2. Environmental Factors

Several environmental factors (climatic variables, elevation, and human activity) were integrated into the model to explain the distribution of PWD-damaged forests between 1982 and 2020. Nineteen bioclimatic variables, measured on short temporal scales (annually, quarterly, or monthly), were used in this study. The definitions of these variables are given in Table 1. They were calculated from the daily 2 m air temperature and daily precipitation data for the historical period 1982–2020 and were obtained from the China Meteorological Data Service Center (http://data.cma.cn/, accessed on 15 October 2020). The spatial meteorological data were interpolated to a spatial resolution of 30 arc second (~1 km) by using the records of 699 weather stations with the Australian National University Spline (ANUSPLIN) method [33]. The 19 bioclimatic variables most commonly used over a long temporal range (usually from 1950 to 2000), with a spatial resolution of 30 arc second, obtained from the WorldClim database (http://www.worldclim.org, accessed on 15 October 2020), were also compared with the abovementioned short-term climatic variables to measure the distribution of PWD damaged-forests [23].
Digital elevation model (DEM) data at a resolution of 90 m were collected from the Shuttle Radar Topography Mission (SRTM) dataset supplied by the United States Geological Survey (USGS) (https://earthexplorer.usgs.gov/, accessed on 10 January 2021). To maintain consistency with the spatial resolution of the climatic variables in this study, the DEM data were resampled at a resolution of 1 km. A time-series nighttime light dataset (1992–2020) at a spatial resolution of 30 arc second, generated with the Defense Meteorological Satellite Program/Operational Linescan System (DMSP-OLS) and the Visible Infrared Imaging Radiometer Suite (VIIRS) on the Suomi National Polar-orbiting Partnership satellite, were used to represent human activities [26,27]. The temporal lag dependence term related to the biological properties of PWD dispersal was also considered in the dataset of environmental factors, characterized by a binary response variable to reflect the presence/absence of PWD-damaged forest in the cell for the previous year.
There were severe multicollinearities among the environmental variables (Table 1), which can result in overfitting in species distribution modeling [34]. We used Pearson’s correlation test to remove highly correlated environmental factors, for which r > 0.8, which is consistent with the previously published criterion for removing multicollinearity [35]. This procedure was conducted to minimize the effect of multicollinearity and model overfitting, as follows. First, Pearson’s correlation coefficients between all pairs of predictors were computed to obtain a correlation matrix of predictors. Second, the pair of predictors with the highest correlation was selected, and the variable in the pair that had the highest correlation with the other variables was removed. These two operations were repeated until the correlations between all the selected variables were <0.8. This procedure eventually produced the selected environmental variables for use in further analyses. The Pearson’s correlation test for the dataset was repeated for each year (1982–2020), which selected different variables among years as a result of short-term variations in the annual environmental variables. All the gridded environmental factors were converted to average values at the district level to maintain consistency with the scale of the PWD-damaged forest distribution.

2.3. Piecewise Polynomial Fitting

Piecewise polynomial fitting is a popular method used to observe the trend in time series and to identify the timing of change points by minimizing the residual sum of squares of all possible combinations of segments representing time intervals of several years [36,37]. Breakpoint years, which showed significant changes in the PWD-damaged forest distribution, were estimated, and separate periods with significant trend changes were identified.

2.4. Spatial Autocorrelation Analysis

Global spatial autocorrelation, which is generally measured using Moran’s index (Moran’s I), was used to assess the overall clustering of data and quantify the similarity of PWD occurrence in spatially adjacent units. A positive Moran’s I value (close to +1) indicates low–low or high–high clusters of the PWD occurrence and a negative Moran’s I value (near to −1) conforms to a dispersed occurrence pattern (i.e., high–low pattern). We calculated the Moran’s I to explore the spatial autocorrelation of the PWD-damaged forest distributions in China between 1982 and 2020.

2.5. MaxEnt Model

We conducted our analyses using the MaxEnt software v.3.3.1, which is a freeware package (http://www.cs.princeton.edu/~schapire/maxent/, accessed on 1 October 2020). The MaxEnt model is widely used in the field of species distribution modeling and provides the potential areas of a particular species. Here, we used a function of the model that compares the contributions of environmental factors, i.e., the factors determining the distribution of PWD-damaged forests, especially sudden increases in the number of PWD-damaged forest areas (defined as “outbreaks” in this study). The MaxEnt model uses the theory of maximum entropy to identify statistical relationships between species presence-only data and environmental variables, thus identifying in detail the contributions and permutation importance of environmental variables to the PWD distribution. The percent contributions and permutation importance of environmental variables included in the Maxent outputs were then used to assess the importance of the environmental variables [28,29]. The percent contribution represents how much an environmental variable contributes to the PWD distribution, which is based on the path selected for a particular run. Permutation importance is determined by changing the values of the environmental variables between presence and absence points and observing how that affects the performance of the model. The permutation importance depends on the final model, not the path used in an individual run, and is more appropriate for evaluating the importance of a particular variable. Therefore, the permutation importance was used to investigate the environmental factors influencing the distribution of PWD-damaged forests.
We ran the MaxEnt model using occurrence data from each year (i.e., one model for each year), focusing on the PWD outbreaks. The MaxEnt model was run with default parameter settings: the auto feature type that included hinge, linear, and quadratic features was used for the PWD modeling; a regularization parameter of 1.0 was used to avoid over-fitting; the maximum number of iterations was set at 500. For each MaxEnt model, 75% of randomly selected PWD occurrence data were used to build the model and the remaining 25% of the data were used to test the model’s performance [38]. The area under curve (AUC) value was used to evaluate the performance of the model in measuring the distribution of PWD-damaged forests, with an AUC value of 0.9–1 deemed excellent, 0.8 –0.9 good, 0.7–0.8 fair, and < 0.7 poor [38,39].

3. Results

3.1. Spatiotemporal Distribution of PWD-Damaged Forests

3.1.1. Temporal Distribution Characteristics

Figure 2 shows the cumulative forest areas damaged by PWD in China, indicating an almost exponential increase between 1982 and 2020. Since the first incidence of PWD in the Zhongshan Mausoleum of Nanjing, China, in 1982, the number of damaged forest areas has increased each year, with different increasing trends between 1982 and 2020. Piecewise polynomial fitting was used to divide the time series of cumulative forest areas damaged by PWD into six segments of different lengths. Figure 2 shows the almost linear increasing trend during the first five stages, before 2018, with significant increases in the growth rate. The cumulative PWD-damage areas increased relatively slowly (~770 ha/year) during stage 1 (1982–1987). This was followed by a continuous increase in the growth rate of cumulative damage areas between 1988 and 2007: with growth rates of ~2630 ha/year for stage 2 (1988–1994), ~5050 ha/year for stage 3 (1995–2000), and ~6710 ha/year for stage 4 (2001–2007). The rate of increase in the cumulative forest areas damaged by PWD then slowed to ~4960 ha/year during stage 5 (2008–2017). However, this slowing trend did not continue, and the cumulative damaged areas increased explosively from 234,120 ha to 526,490 ha (growth rate of ~97,457 ha/year) after entering stage 6 (2018–2020). The stacked bar charts in Figure 2 present the contributions of each environmental factor to the accumulated damage area in the outbreak years (1988, 1995, 2001, 2008, and 2018). The selected factors are determined by the permutation importance values in the MaxEnt models, and detailed results are given in Section 3.2.1.

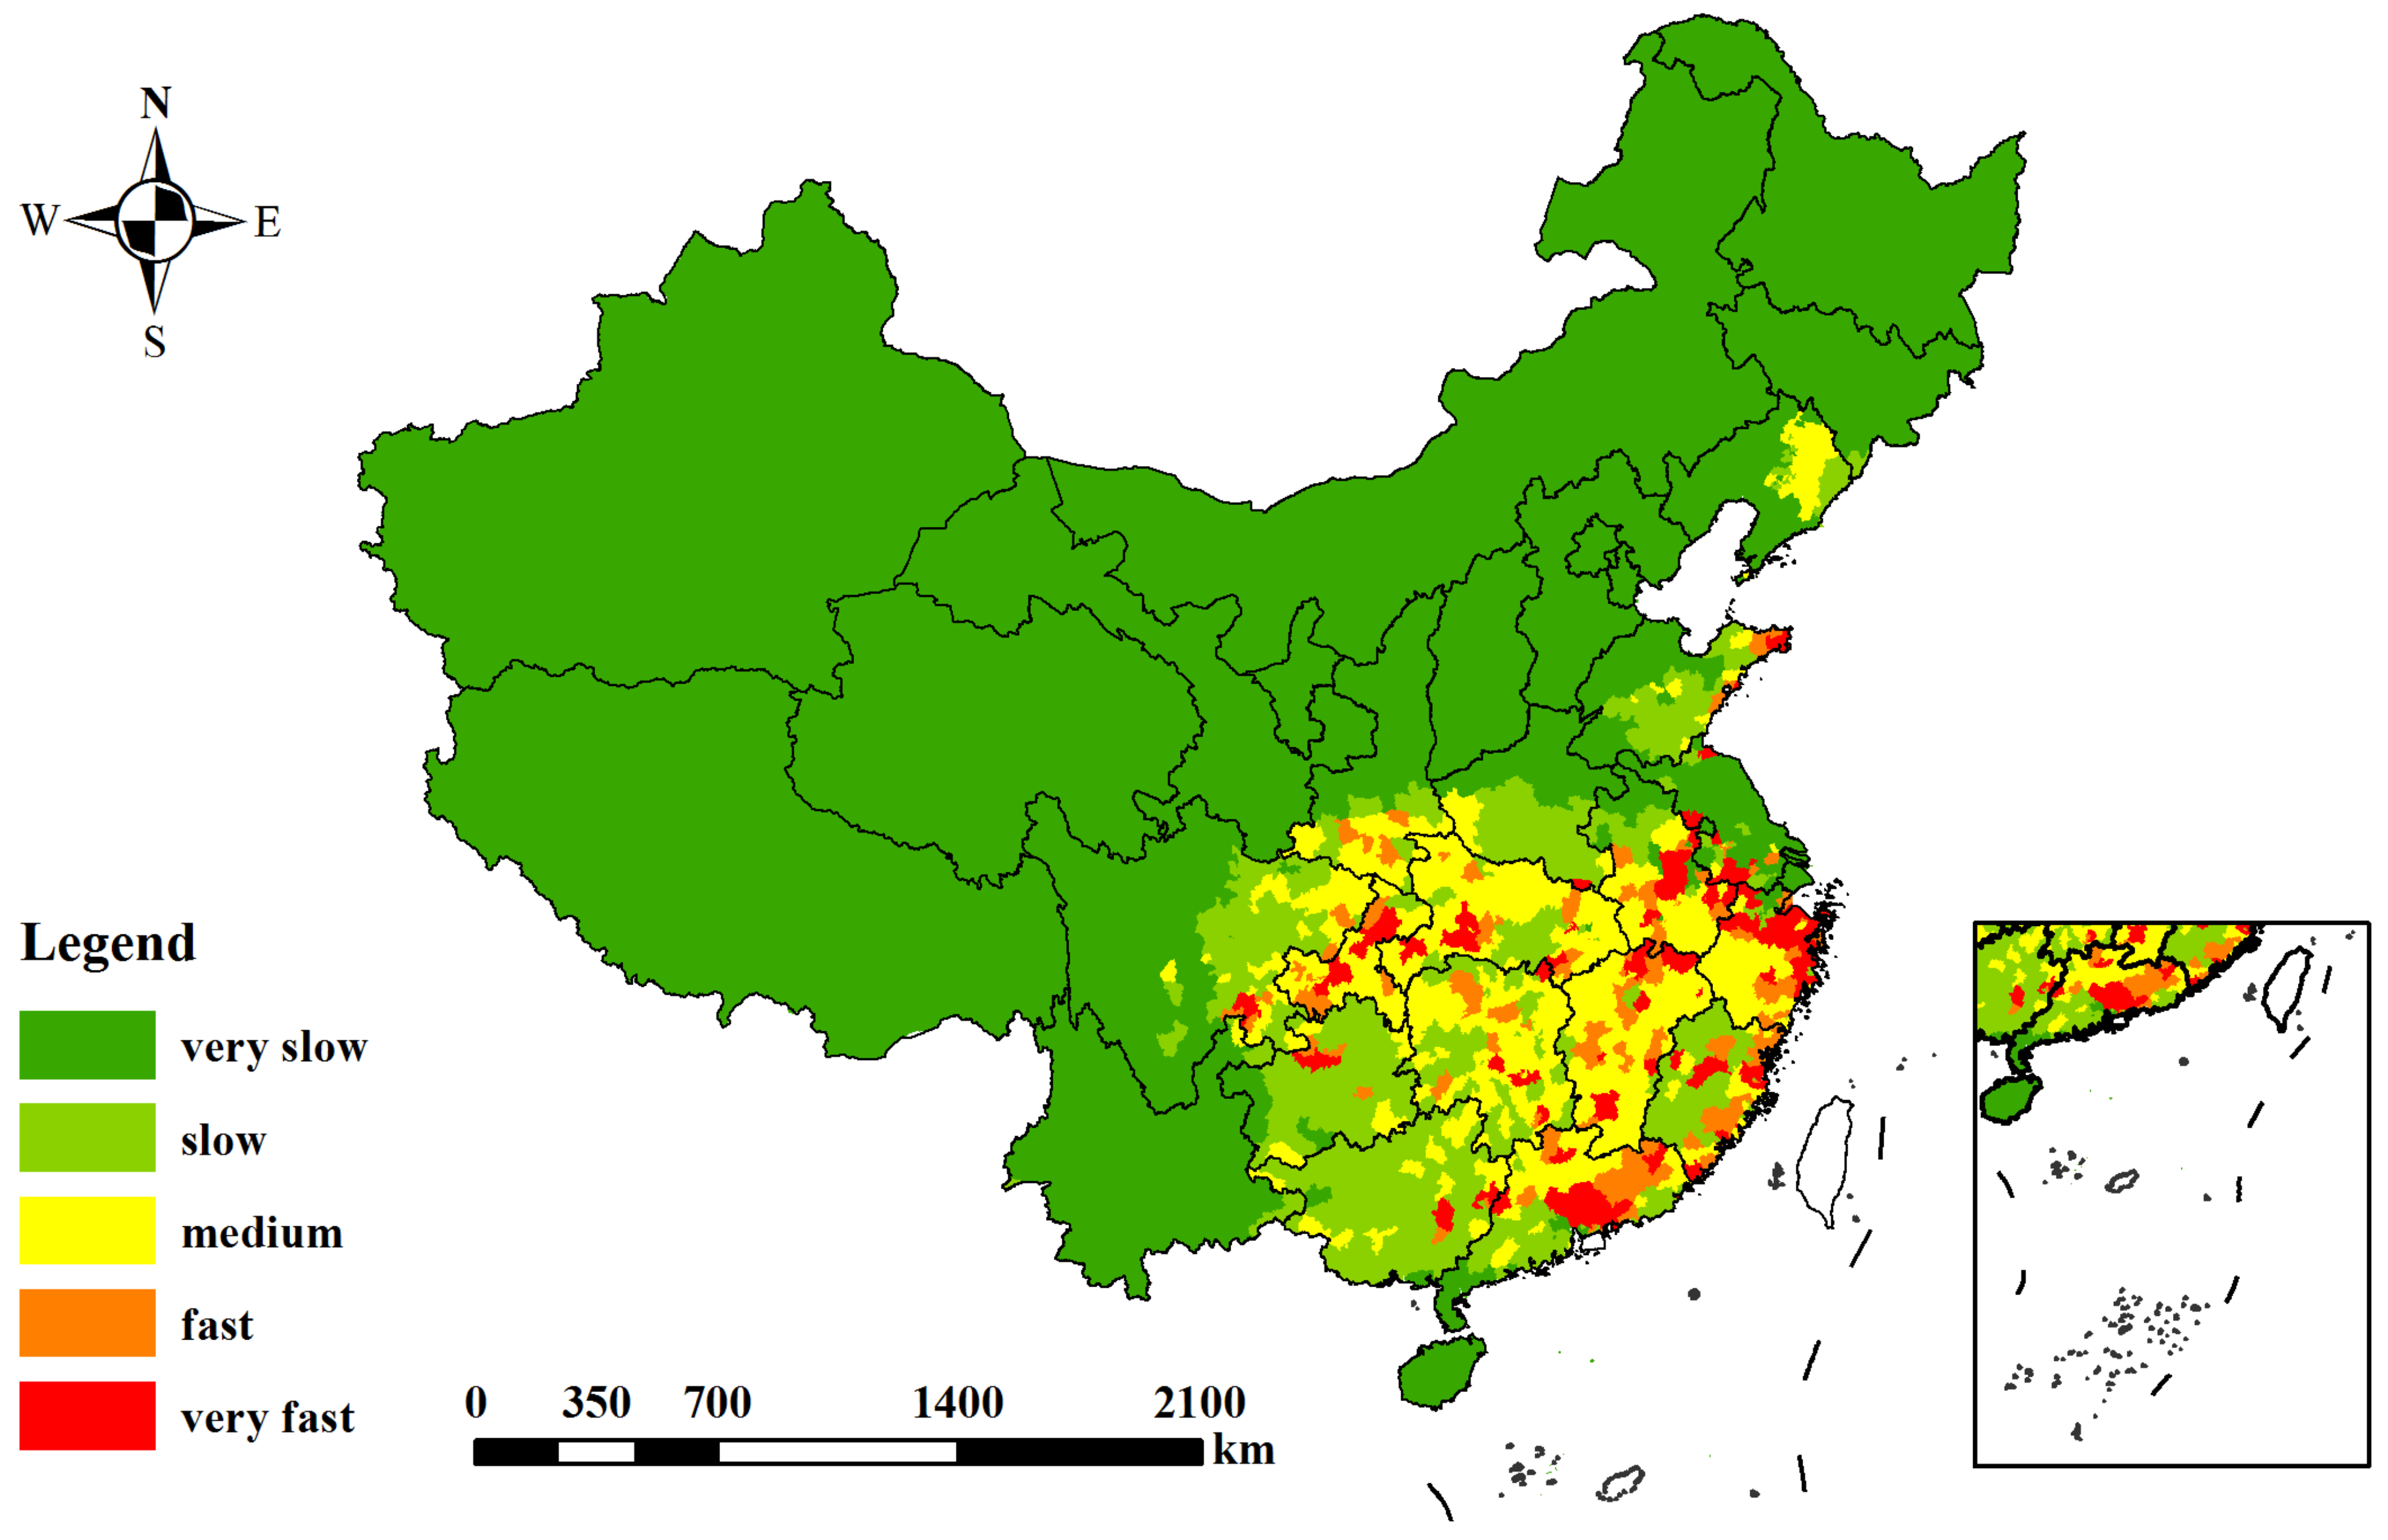
3.1.2. Spatial Distribution Characteristics

Nearly 40 years (1982–2020) of continuous datasets on PWD-damaged forests were used in this study, and these included multiple PWD outbreak cycles. The spatial spread of the PWD-damaged forest distribution recorded between 1982 and 2020 was analyzed in the six time intervals derived from the temporal patterns described above (Section 3.1.1). As shown in Figure 3, the initial spread of PWD in China was observed in Jiangsu and Anhui provinces in stage 1 (1982–1987), where transmission was concentrated in a small range around the site of its first discovery at the Sun Zhongshan Mausoleum in Nanjing. The area of PWD-damaged forests continued to expand around the site of its first discovery, with a typical diffusion distance to adjacent provinces, including Zhejiang, Fujian, and Shandong, in the second stage (1988–1994). It then spread rapidly to the surrounding areas in the following 6 years during the third stage (1995–2000), which may have been related to PWN population growth in these years. During the fourth stage (2001–2007), the spatial spread of PWD extended not only into surrounding areas, but also into remote regions, such as Chongqing, Guangxi, and Hubei provinces. The PWD-damaged forest areas still increased sporadically over the next 10 years during the fifth stage (2008–2017), but the rate of spread in the cumulative PWD-damage areas did not exceed that in the previous (fourth) stage because intensive control efforts were undertaken during this period. This scattered distribution was not maintained during the sixth stage (2018–2020), and the distribution of PWD expanded dramatically, especially during the outbreak of 2018 (marked in green in Figure 3f), which covered almost the whole of China’s southeastern region and expanded into the northern region.
A spatial autocorrelation analysis also showed that the Moran’s I increased significantly (p < 0.001) in this period, from 0.12 (1982) to 0.46 (2020), indicating that the spatial distribution of the PWD-damaged forest areas in China showed high spatial autocorrelation, and the areas of high–high clustering expanded significantly.

3.2. Factors Influencing the Distribution of PWD-Damaged Forests

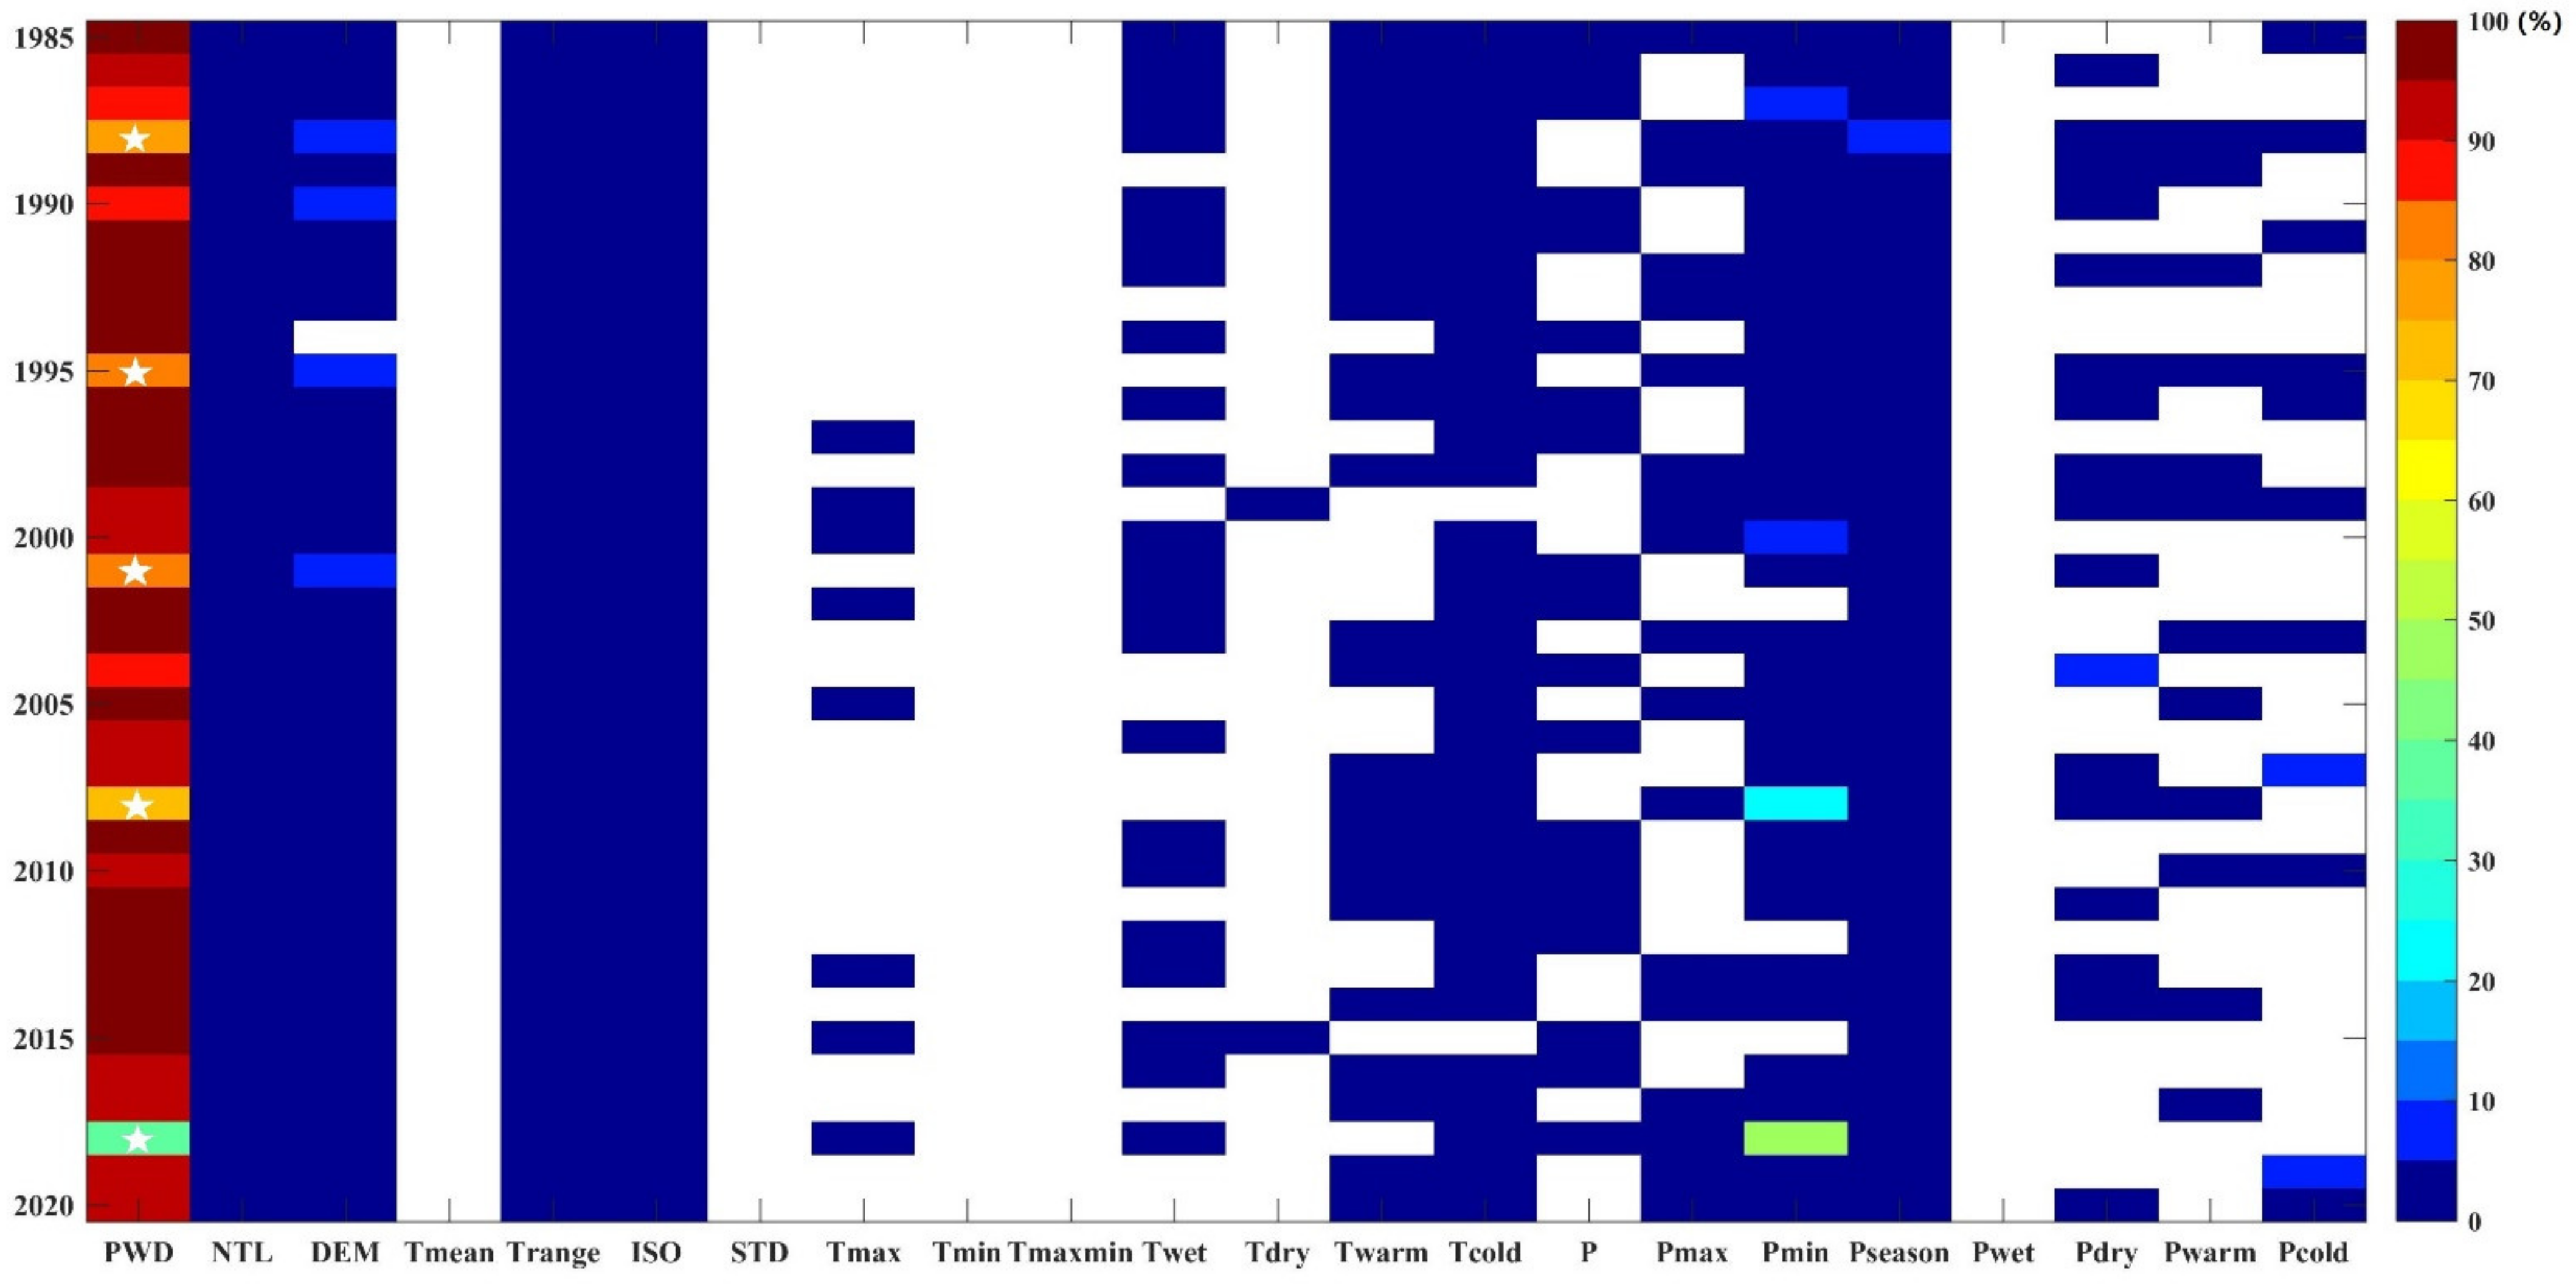
3.2.1. MaxEnt Model with Short-Term Environmental Factors

The MaxEnt model was used to assess the relative importance of short-term environmental factors in the distribution of PWD-damaged forests on a year-by-year basis (i.e., one model for each year). After the removal of highly correlated variables (Pearson’s r > 0.8), the candidate environmental factors were used as the input for the MaxEnt model. A null value (shown as a white space in Figure 4) indicates that the environmental factor was not included in the MaxEnt model of the current year because of its high multicollinearity with other environmental factors. In all models, the selected environmental factors were allowed to vary from year to year because the correlations among the short-term environmental factors varied annually. The number of effective PWD-damaged forests observed before 1985 was <5, so the MaxEnt models between 1985 and 2020 were constructed to explore the relative importance of environmental factors to the distribution of PWD-damaged forests. The selected environmental factors in the MaxEnt models generally fell into five categories: species abundance-related, human-activity-related, temperature-related, precipitation-related, and terrain-related environmental factors. For all models between 1985 and 2020, the AUC values were high for the training data (ranging from 0.87 to 0.99) and test data (ranging from 0.85 to 0.97), indicating that the performance of the MaxEnt models was good.
Figure 4 shows the permutation importance values for all selected environmental factors in each MaxEnt model between 1985 and 2020, which were used to assess the importance of each factor to the distribution of the PWD-damaged forests. The most important factor influencing PWD spread during the period 1985–2020 was temporal dependence (the PWD distribution in the previous year), which made large contributions (ranging from 37.8% to 99.9%) to the distribution of PWD-damaged forests in the next year. It is noteworthy that the contribution of the PWD distribution in the previous year was relatively small (<85%) in the years 1988, 1995, 2001, 2008, and 2018, when the geographic distribution of PWD-damaged forests changed significantly. This was observed in the spatiotemporal dynamics of the PWD-damaged forests (Figure 2 and Figure 3). However, the annual change in the distribution of PWD-damaged forests in these years cannot be fully explained by the PWD in the previous year, suggesting that other external factors affected the PWD outbreaks in 1988, 1995, 2001, 2008, and 2018. Based on the MaxEnt’s permutation importance values, DEM was the second most important factor influencing PWD spread, contributing 9.7%, 8.0%, and 8.1% of the changes in the distribution of PWD damaged forests in 1988, 1995, and 2001, respectively. Bio14 (Pmin), which measures the total precipitation during the driest month, was the most important meteorological factor affecting the distribution of the PWD-damaged forests in 2008 and 2018. The spatiotemporal dynamics of PWD-damaged forest recorded between 1982 and 2020 show significant spatial expansion of PWD-damaged forest areas in 2008 and 2018. The permutation importance values of the environmental factors in these years provide evidence that these expansions were associated with changes in precipitation in the driest month.

3.2.2. MaxEnt Model with Long-Term Environmental Factors

Our results were also compared with previous studies that used the long-term climatic variables (i.e., the WorldClim dataset, which measures the BIO variables with long-term averaged meteorological observations) as the important predictors in the MaxEnt models. We removed those variables with correlation coefficients >0.8 and selected DEM, NTL data, Bio7 (Tmaxmin, annual temperature range), Bio12 (P, annual precipitation), and Bio19 (Pcold, precipitation in the coldest quarter) as the environmental factors in the MaxEnt models (Figure 5).
The results of the MaxEnt models indicated that the long-term BIO variables provided relatively lower accuracy when modeling the PWD distribution than annual environmental factors, especially for those years with significant changes in the PWD distribution (AUC values of 0.83–0.88). The permutation importance values of the environmental factors for each model also varied, with Pcold the most important factor influencing the spread of PWD. However, the permutation importance values of the environmental factors changed very significantly between 1985 and 2020, so it is difficult to postulate a relatively uniform rule to explain the species distribution (Figure 5).

3.3. Risk Assessment of PWD-Damaged Forests

The MaxEnt models developed to predict the probability of PWD occurrence were also used to assess the potential risk of PWD damage to forests in China. The modeled probability of PWD risk is denoted Prisk in the following section. The risk of PWD-damaged forests was divided into five categories using the natural breakpoint method according to the Prisk values in 2020, with <0.027 indicating very low-risk, 0.028–0.065 low-risk areas, 0.065–0.32 medium-risk areas, 0.33–0.65 high-risk areas, and >0.65 very high-risk areas. The very high-risk areas were concentrated mainly in southeast China, with wide areas distributed in Zhejiang, Anhui, Guangdong, Hunan, Hubei, Jiangxi, and Chongqing (Figure 6). The high-risk area also expanded northward to Liaoning Province in northern China (Figure 6).
We also analyzed the temporal variations in the Prisk values based on our annual MaxEnt models. Prisk showed an increasing trend in all county districts, and a linear regression model was used to fit the annual changes in the Prisk values. The slope of the regression model represented the growth rate of Prisk. Prisk showed fast or very fast growth trends (slope > 0.12/10 years) in 255 county districts, and a medium growth trend (slope 0.06–0.12/10 years) in 412 county districts (Figure 7). Most of the areas with medium-high levels of Prisk growth were located in Zhejiang, Anhui, Guangdong, Guangxi, Fujian, Hunan, Hubei, Jiangxi, Liaoning, and Chongqing (Figure 7).

4. Discussion

We analyzed the distribution of PWD-damaged forests in China using district-level occurrence data from 1982 to 2020. This differed from the method of previous studies, which used species occurrence points (latitude and longitude) for the current year or at limited locations (monitoring stations) over long time series [19,30]. Although PWD occurrence point data at high temporal resolution are unavailable at the national or regional scale, publicly released district-level occurrence data allowed us to determine the species occurrence points using the centroids of districts, which has been the most commonly used solution in similar research [32,40]. Environmental variables at a spatial resolution of 1 km were used to investigate their relationships with the PWD distribution in this study and showed minor variations at the district level. Therefore, the geographic bias of the PWD occurrence data had little effect on the performance of the model [31,41].
MaxEnt is a widely used algorithm for simulating the potential distribution of species. In this study, the environmental factors that control the spatiotemporal dynamics of PWD were detected with this algorithm using the permutation importance of the predictors. Our results indicate that the MaxEnt model performed well in annual comparisons of the environmental factors that contributed to the distribution of PWD-damaged forests, especially during outbreaks of the disease. The temporal dependency term for the presence/absence of PWD in neighboring cells was included in our MaxEnt models, which was the best predictor of the PWD distribution, with the highest contribution (>85%) to the models in 1985–2020 (except for those years with significant changes in the PWD distribution). The good performance of this temporal term in our MaxEnt models is attributed to the temporal dependency of the distribution of PWD-damaged forests, which means that the presence of outbreaking populations is related to the number of PWNs over time. The temporal term of species distribution factors has also been used in many other species distribution predictions [25], but it has been less effective in PWD prediction because most PWD studies have been conducted in a specific year [2,42,43], in contrast to our long-term time series predictions over 1982–2020. Our spatial autocorrelation analysis also indicates that spatial dependency is actually essential for modeling PWD distribution, and future work will further examine the spatial effects of neighboring PWD on the outbreaks using spatial autoregressive models. However, recent studies have also noted that spatial autocorrelation does not realistically improve the model quality and typically leads to overfitting [44,45]. Therefore, the effects of spatial autocorrelation on our MaxEnt models must be further examined using independent evaluation data in future research.
Short-term environmental factors also contributed significantly to the PWD outbreaks in 2008 and 2018. Temperature-related environmental factors are known to be important indicators of PWD outbreaks, with low temperatures inhibiting the transmission of PWD and delaying the PWN life cycle [16,17,18]. However, our results did not show a good relationship between temperature and PWD outbreaks. Several temperature-related variables, including Bio7 (annual temperature range), Bio5 (maximum temperature in the warmest month), Bio8 (mean temperature in the wettest quarter), and Bio11 (mean temperature in the coldest quarter), were used to develop the MaxEnt models in this study, but did not make significant contributions to PWD outbreaks (Figure 3). Our results indicate that Bio14 (precipitation in the driest month) had a major impact on PWD outbreaks in China. It has been suggested that the risk of PWD increases with water loss, which is related to the indirect effects of precipitation on the susceptibility of the host plant to PWD outbreaks [20,21]. Water stress tends to increase the susceptibility and/or reduce the resistance of pines to PWN [20,21].
Several studies have pointed out that human activities can be used as an indicator of PWD distribution and may be useful in explaining the long-distance dispersal of PWD [19,46]. In the present study, the role of human activities was small, making only a small contribution in our all models. This may be because human activities not only have a positive effect on PWD spread through human-mediated dispersal [12,19] but also involve pest control and forest management strategies. Additionally, the nighttime light data may suffer from saturation problems in urban areas, which can cause an underestimation of human activities. Some correction methods, such as linear and cubic regression models, the human settlement index, and the vegetation adjusted urban index, are effective for reducing saturation effects [47], which can further improve the accuracy of nighttime light in our future work. Topographic factors were only meaningful factors in PWD outbreaks before 2002. This may be because they are not associated with annual climatic variations, although they are useful in characterizing variations in elevation, which have a direct effect on long-term average climatic variables [48]. The contribution of DEM to the PWD outbreaks declined between 2008 and 2018, suggesting that the effects of long-term climatic variations on the distribution of PWD are weakening.
The strength of this study is that it evaluated the influences of annual environmental factors on the distribution of PWD-damaged forests since the first occurrence of PWD in 1982. Our results indicate that the contributions of environmental factors to PWD outbreaks varied during different periods of this PWD spread. This may bring some uncertainty to predictions of the potential distribution of PWD under future climate scenarios because they only consider variations in climatic conditions [41].
There is also some uncertainty in the modeling of the species distribution, primarily because some biotic and abiotic factors (such as biotic interactions and competitors, their species dispersal modes and abilities, and pest management factors) were not as readily available for each year within our study period as were climatic variables, and were, therefore, not included in our MaxEnt models [49,50]. However, future work should focus on gathering such data over those years with significant changes in the distribution of PWD-damaged forests and analyzing the impact of these factors on the PWD distribution.

5. Conclusions

We analyzed the spatiotemporal dynamics and factors driving the distribution of the PWD-damaged forests in China since the first incidence in 1982. There was an almost exponential increase in the cumulative areas of PWD-damaged forests from 1982 to 2020, which corresponded to the six key stages in the spatial spread of recorded PWD. The MaxEnt species distribution model was used to assess the relative importance of various environmental factors to the PWD distribution, which revealed that the PWD distribution in the previous year was the most important factor affecting the PWD distribution, and that the significant changes in PWD distribution in 1988, 1995, 2001, 2008, and 2018 were related to the environmental factors DEM and Bio14 (Pmin, precipitation in the driest month). The findings of this study should contribute to a better understanding of the factors affecting the distribution of PWD and will be important in investigating areas of potential risk, thus guiding future forest management and pest control practices.

Author Contributions

Methodology, W.W. and W.P.; formal analysis, W.W.; investigation, W.W. and Y.C.; writing original draft, W.W.; writing—review and editing, X.L. and G.H.; visualization, W.W.; supervision, Y.C.; funding acquisition, Y.C. and W.P. All authors have read and agreed to the published version of the manuscript.

Funding

This work was supported by the Ministry of Education Key Project of Key Research in Philosophy and Social Science (Grant No. 19JZD023) and the Shanghai Sailing Program (Grant No. 21YF1419600).

Institutional Review Board Statement

Not applicable.

Informed Consent Statement

Not applicable.

Data Availability Statement

The locations of PWD-damaged forests in China were identified from the announcements of the National Science Data Infrastructure of Forestry, National Science and Technology Infrastructure of China (http://www/forestdata.cn, accessed on 10 October 2020), and the State Forestry and Grassland Administration.

Conflicts of Interest

The authors declare no conflict of interest.

References

  1. Feng, Y.; Ziegler, A.D.; Elsen, P.R.; Liu, Y.; He, X.; Spracklen, D.V.; Holden, J.; Jiang, X.; Zheng, C.; Zeng, Z. Upward expansion and acceleration of forest clearance in the mountains of Southeast Asia. Nat. Sustain. 2021, 4, 892–899. [Google Scholar] [CrossRef]
  2. Ikegami, M.; Jenkins, T.A.R. Estimate global risks of a forest disease under current and future climates using species distribution model and simple thermal model—Pine Wilt disease as a model case. For. Ecol. Manag. 2018, 409, 343–352. [Google Scholar] [CrossRef]
  3. Hirata, A.; Nakamura, K.; Nakao, K.; Kominami, Y.; Tanaka, N.; Ohashi, H.; Takano, K.T.; Takeuchi, W.; Matsui, T. Potential distribution of pine wilt disease under future climate change scenarios. PLoS ONE 2017, 12, e0182837. [Google Scholar] [CrossRef] [PubMed] [Green Version]
  4. Futai, K. Pine Wilt in Japan: From First Incidence to the Present. In Pine Wilt Disease; Zhao, B.G., Futai, K., Sutherland, J.R., Takeuchi, Y., Eds.; Springer: Japan, Tokyo, 2008; pp. 5–12. [Google Scholar]
  5. Zhao, B.G. Pine Wilt Disease in China. In Pine Wilt Disease; Zhao, B.G., Futai, K., Sutherland, J.R., Takeuchi, Y., Eds.; Springer: Japan, Tokyo, 2008; pp. 18–25. [Google Scholar]
  6. Tzean, S.; Jan, S. Pine wilt disease caused by pinewood nematode (Bursaphelenchus xylophilus) and its occurrence in Taiwan. Phytopathol. Entomol. NTU 1985, 12, 1–19. [Google Scholar]
  7. Han, H.; Chung, Y.J.; Shin, S.C. First Report of Pine Wilt Disease on Pinus koraiensis in Korea. Plant Dis. 2008, 92, 1251. [Google Scholar] [CrossRef]
  8. Mota, M.M.; Braasch, H.; Bravo, M.A.; Penas, A.C.; Burgermeister, W.; Metge, K.; Sousa, E. First report of Bursaphelenchus xylophilus in Portugal and in Europe. Nematology 1999, 1, 727–734. [Google Scholar] [CrossRef]
  9. State Forestry and Grassland Administration. Pine Wilt Disease. 2021. Available online: https://www.forestry.gov.cn/main/5462/20210521/114505021470794.html (accessed on 13 June 2021).
  10. Ye, J. Epidemic status of pine wilt disease in China and its prevention and control techniques and counter measures. Sci. Silvae Sin. 2019, 55, 1–10. [Google Scholar]
  11. Hao, Z.; Huang, J.; Zhou, Y.; Fang, G. Spatiotemporal pattern of pine wilt disease in the Yangtze river basin. Forests 2021, 12, 731. [Google Scholar] [CrossRef]
  12. Robinet, C.; Imbert, C.-E.; Rousselet, J.; Sauvard, D.; Garcia, J.; Goussard, F.; Roques, A. Human-mediated long-distance jumps of the pine processionary moth in Europe. Biol. Invasions 2012, 14, 1557–1569. [Google Scholar] [CrossRef] [Green Version]
  13. Gao, R.; Wang, Z.; Wang, H.; Hao, Y.; Shi, J. Relationship between pine wilt disease outbreaks and climatic variables in the three Gorges reservoir region. Forests 2019, 10, 816. [Google Scholar] [CrossRef] [Green Version]
  14. Ikeda, T. Responses of water-stressed Pinus thunbergii to inoculation with avirulent pine wood nematode (Bursaphelenchus xylophilus): Water relations and xylem histology J. For. Res. 1996, 1, 223–226. [Google Scholar] [CrossRef]
  15. Rutherford, T.A.; Webster, J.M. Distribution of pine wilt disease with respect to temperature in North America, Japan, and Europe. Can. J. For. Res. 1987, 17, 1050–1059. [Google Scholar] [CrossRef]
  16. Liu, Z.; Li, Y.; Pan, L.; Meng, F.; Zhang, X. Cold adaptive potential of pine wood nematodes overwintering in plant hosts. Biol. Open 2019, 8, bio041616. [Google Scholar] [CrossRef] [Green Version]
  17. Jikumaru, S.; Togashi, K. Temperature effects on the transmission of Bursaphelenchus xylophilus (Nemata: Aphelenchoididae) by Monochamus alternatus (Coleoptera: Cerambycidae). J. Nematol. 2000, 32, 110–116. [Google Scholar]
  18. Wang, B.; Ma, L.; Wang, F.; Wang, B.; Hao, X.; Xu, J.; Ma, Y. Low Temperature Extends the Lifespan of Bursaphelenchus xylophilus through the cGMP Pathway. Int. J. Mol. Sci. 2017, 18, 2320. [Google Scholar] [CrossRef] [Green Version]
  19. Robinet, C.; Roques, A.; Pan, H.; Fang, G.; Ye, J.; Zhang, Y.; Sun, J. Role of human-mediated dispersal in the spread of the Pinewood Nematode in China. PLoS ONE 2009, 4, e4646. [Google Scholar] [CrossRef] [PubMed] [Green Version]
  20. Suzuki, K.; Kiyohara, T. Influence of water stress on development of pine wilting disease caused by Bursaphelenchus lignicolus. Eur. J. Plant Pathol. 1978, 8, 97–107. [Google Scholar] [CrossRef]
  21. Rebetez, M.; Dobbertin, M. Climate change may already threaten Scots pine stands in the Swiss Alps. Theor. Appl. Climatol. 2004, 79, 1–9. [Google Scholar] [CrossRef] [Green Version]
  22. Jaime, L.; Batllori, E.; Margalef-Marrase, J.; Pérez Navarro, M.Á.; Lloret, F. Scots pine (Pinus sylvestris L.) mortality is explained by the climatic suitability of both host tree and bark beetle populations. For. Ecol. Manag. 2019, 448, 119–129. [Google Scholar] [CrossRef]
  23. Hijmans, R.J.; Cameron, S.E.; Parra, J.L.; Jones, P.G.; Jarvis, A. Very high resolution interpolated climate surfaces for global land areas. Int. J. Climatol. 2005, 25, 1965–1978. [Google Scholar] [CrossRef]
  24. Battisti, A.; Stastny, M.; Buffo, E.; Larsson, S. A rapid altitudinal range expansion in the pine processionary moth produced by the 2003 climatic anomaly. Glob. Change Biol. 2006, 12, 662–671. [Google Scholar] [CrossRef]
  25. Aukema, B.H.; Carroll, A.L.; Zheng, Y.; Zhu, J.; Raffa, K.F.; Dan Moore, R.; Stahl, K.; Taylor, S.W. Movement of outbreak populations of mountain pine beetle: Influences of spatiotemporal patterns and climate. Ecography 2008, 31, 348–358. [Google Scholar] [CrossRef]
  26. Li, X.; Zhou, Y.; Zhao, M.; Zhao, X. A harmonized global nighttime light dataset 1992–2018. Sci. Data 2020, 7, 168. [Google Scholar] [CrossRef] [PubMed]
  27. Marbuah, G.; Gren, I.-M.; McKie, B.G.; Buisson, L. Economic activity and distribution of an invasive species: Evidence from night-time lights satellite imagery data. Ecol. Econ. 2021, 185, 107037. [Google Scholar] [CrossRef]
  28. Phillips, S.J.; Dudik, M. Modeling of species distributions with Maxent: New extensions and a comprehensive evaluation. Ecography 2008, 31, 161–175. [Google Scholar] [CrossRef]
  29. Phillips, S.J.; Anderson, R.P.; Schapire, R.E. Maximum entropy modeling of species geographic distributions. Ecol. Model. 2006, 190, 231–259. [Google Scholar] [CrossRef] [Green Version]
  30. Matsuhashi, S.; Hirata, A.; Akiba, M.; Nakamura, K.; Oguro, M.; Takano, K.T.; Nakao, K.; Hijioka, Y.; Matsui, T. Developing a point process model for ecological risk assessment of pine wilt disease at multiple scales. For. Ecol. Manag. 2020, 463, 118010. [Google Scholar] [CrossRef]
  31. Kumar, S.; Graham, J.; West, A.M.; Evangelista, P.H. Using district-level occurrences in MaxEnt for predicting the invasion potential of an exotic insect pest in India. Comput. Electron. Agric. 2014, 103, 55–62. [Google Scholar] [CrossRef]
  32. Medley, K.A. Niche shifts during the global invasion of the Asian tiger mosquito, Aedes albopictus Skuse (Culicidae), revealed by reciprocal distribution models. Glob. Ecol. Biogeogr. 2010, 19, 122–133. [Google Scholar] [CrossRef]
  33. Hutchinson, M.F.; Xu, T. Anusplin version 4.2 User Guide. Centre for Resource and Environmental Studies, The Australian National University: Canberra, Australia, 2004; p. 54. [Google Scholar]
  34. Pramanik, M.; Paudel, U.; Mondal, B.; Chakraborti, S.; Deb, P. Predicting climate change impacts on the distribution of the threatened Garcinia indica in the Western Ghats, India. Clim. Risk Manag. 2018, 19, 94–105. [Google Scholar] [CrossRef]
  35. Mateo, R.G.; Vanderpoorten, A.; Muñoz, J.; Laenen, B.; Désamoré, A. Modeling species distributions from heterogeneous data for the biogeographic regionalization of the European bryophyte flora. PLoS ONE 2013, 8, e55648. [Google Scholar] [CrossRef] [Green Version]
  36. Cunis, T.; Burlion, L.; Condomines, J.-P. Piecewise polynomial modeling for control and analysis of aircraft dynamics beyond stall. J. Guid. Control Dyn. 2019, 42, 949–957. [Google Scholar] [CrossRef]
  37. Gao, J.; Ji, W.; Zhang, L.; Shao, S.; Wang, Y.; Shi, F. Fast piecewise polynomial fitting of time-series data for streaming computing. IEEE Access 2020, 8, 43764–43775. [Google Scholar] [CrossRef]
  38. Zhang, J.; Jiang, F.; Li, G.; Qin, W.; Li, S.; Gao, H.; Cai, Z.; Lin, G.; Zhang, T. Maxent modeling for predicting the spatial distribution of three raptors in the Sanjiangyuan National Park, China. Ecol. Evol. 2019, 9, 6643–6654. [Google Scholar] [CrossRef] [PubMed] [Green Version]
  39. Swets, J.A. Measuring the accuracy of diagnostic systems. Science 1988, 240, 1285–1293. [Google Scholar] [CrossRef] [Green Version]
  40. Benedict, M.Q.; Levine, R.S.; Hawley, W.A.; Lounibos, L.P. Spread of the tiger: Global risk of invasion by the mosquito Aedes albopictus. Vector Borne Zoonotic Dis. 2007, 7, 76–85. [Google Scholar] [CrossRef] [PubMed] [Green Version]
  41. Briscoe Runquist, R.D.; Lake, T.; Tiffin, P.; Moeller, D.A. Species distribution models throughout the invasion history of Palmer amaranth predict regions at risk of future invasion and reveal challenges with modeling rapidly shifting geographic ranges. Sci. Rep. 2019, 9, 2426. [Google Scholar] [CrossRef] [PubMed] [Green Version]
  42. Lee, D.-S.; Choi, W.I.; Nam, Y.; Park, Y.-S. Predicting potential occurrence of pine wilt disease based on environmental factors in South Korea using machine learning algorithms. Ecol. Inform. 2021, 64, 101378. [Google Scholar] [CrossRef]
  43. Tang, X.; Yuan, Y.; Li, X.; Zhang, J. Maximum entropy modeling to predict the impact of climate change on pine wilt disease in China. Front. Plant Sci. 2021, 12, 764. [Google Scholar] [CrossRef]
  44. Radosavljevic, A.; Anderson, R.P. Making better Maxent models of species distributions: Complexity, overfitting and evaluation. J. Biogeogr. 2014, 41, 629–643. [Google Scholar] [CrossRef]
  45. Boria, R.A.; Olson, L.E.; Goodman, S.M.; Anderson, R.P. Spatial filtering to reduce sampling bias can improve the performance of ecological niche models. Ecol. Model. 2014, 275, 73–77. [Google Scholar] [CrossRef]
  46. Obenauer, J.F.; Andrew Joyner, T.; Harris, J.B. The importance of human population characteristics in modeling Aedes aegypti distributions and assessing risk of mosquito-borne infectious diseases. Trop. Med. Health 2017, 45, 38. [Google Scholar] [CrossRef] [Green Version]
  47. Ma, L.; Wu, J.; Li, W.; Peng, J.; Liu, H. Evaluating Saturation Correction Methods for DMSP/OLS Nighttime Light Data: A Case Study from China’s Cities. Remote Sens. 2014, 6, 9853–9872. [Google Scholar] [CrossRef] [Green Version]
  48. Evangelista, P.H.; Kumar, S.; Stohlgren, T.J.; Young, N.E. Assessing forest vulnerability and the potential distribution of pine beetles under current and future climate scenarios in the Interior West of the US. For. Ecol. Manag. 2011, 262, 307–316. [Google Scholar] [CrossRef]
  49. Zhao, L.; Mota, M.; Vieira, P.; Butcher, R.A.; Sun, J. Interspecific communication between pinewood nematode, its insect vector, and associated microbes. Trends Parasitol. 2014, 30, 299–308. [Google Scholar] [CrossRef] [PubMed] [Green Version]
  50. Moore, J.E.; Franklin, S.B. Understanding the relative roles of disturbance and species interactions in shaping Mississippi River island plant communities. Community Ecol. 2011, 12, 108–116. [Google Scholar] [CrossRef]
Figure 1. Locations of PWD-damaged forests in 2020 at the district level, as used for MaxEnt modeling.
Forests 13 00261 g001
Figure 2. Temporal changes in the cumulative forest areas damaged by PWD in China from 1982 to 2020. The time series of cumulative damaged areas was divided into six intervals with piecewise polynomial fitting. The contributions of the three most important factors, namely, PWD (the PWD distribution in the previous year), Pmin (Bio14: the total precipitation during the driest month), and DEM, in outbreak years (1988, 1995, 2001, 2008, and 2018), to the accumulated damage area are presented in the stacked bar charts.
Forests 13 00261 g002
Figure 3. Spatial spread of PWD-damaged forests in China in the six stages between 1982 and 2020 (the first year in each figure denotes the current distribution of PWD-damaged forests in this year (green area), and the areas in the following years indicate the increased PWD-damaged forest areas) (a) 1982–1987; (b) 1988–1994; (c) 1995–2000; (d) 2001–2007; (e) 2008–2017; (f) 2018–2020.
Forests 13 00261 g003
Figure 4. Permutation importance values of annual environmental factors in the MaxEnt models between 1985 and 2020 (white stars denote the years with significant changes in the PWD distribution). Null values (white spaces in the figure) indicate that the environmental variables were not selected using the Pearson’s correlation coefficients test for that year.
Forests 13 00261 g004
Figure 5. Permutation importance values for long-term environmental factors in the MaxEnt models between 1985 and 2020.
Forests 13 00261 g005
Figure 6. Risk assessment of PWD-damaged forests in 2020.
Forests 13 00261 g006
Figure 7. Changes in PWD risk measured by the slope of the Prisk regression model in 1985–2020.
Forests 13 00261 g007
Table 1. Environmental factors used to predict potential PWD-damaged forest distribution in this study.
TypeDefinition
19 Bioclimatic variablesBio1 (Tmean) = annual mean temperature; Bio2 (Trange) = mean diurnal range (mean of monthly) (maximum temperature − minimum temperature)); Bio3 (ISO) = isothermality (Bio2/Bio7) × 100; Bio4 (STD) = temperature seasonality (standard deviation × 100); Bio5 (Tmax) = maximum temperature in warmest month; Bio6 (Tmin) = minimum temperature in coldest month; Bio7 (Tmaxmin) = annual temperature range (Bio5−Bio6); Bio8 (Twet) = mean temperature in wettest quarter; Bio9 (Tdry) = mean temperature in driest quarter; Bio10 (Twarm) = mean temperature in warmest quarter; Bio11 (Tcold) = mean temperature in coldest quarter; Bio12 (P) = annual precipitation; Bio13 (Pmax) = precipitation in wettest month; Bio14 (Pmin) = precipitation in driest month; Bio15 (Pseason) = precipitation seasonality (coefficient of variation); Bio16 (Pwet) = precipitation in wettest quarter; Bio17 (Pdry) = precipitation in driest quarter; Bio18 (Pwarm) = precipitation in warmest quarter; and Bio19 (Pcold) = precipitation in coldest quarter
DEMDigital elevation model
Human activityNighttime light
Temporal dependence Presence/absence of PWD-damaged forest in the cell for the previous year
Publisher’s Note: MDPI stays neutral with regard to jurisdictional claims in published maps and institutional affiliations.

