
Kinship Analysis and Pedigree Reconstruction of a Natural Regenerated Cork Oak (Quercus suber) Population

 , , , , ,
Abstract
:1. Introduction
2. Materials and Methods
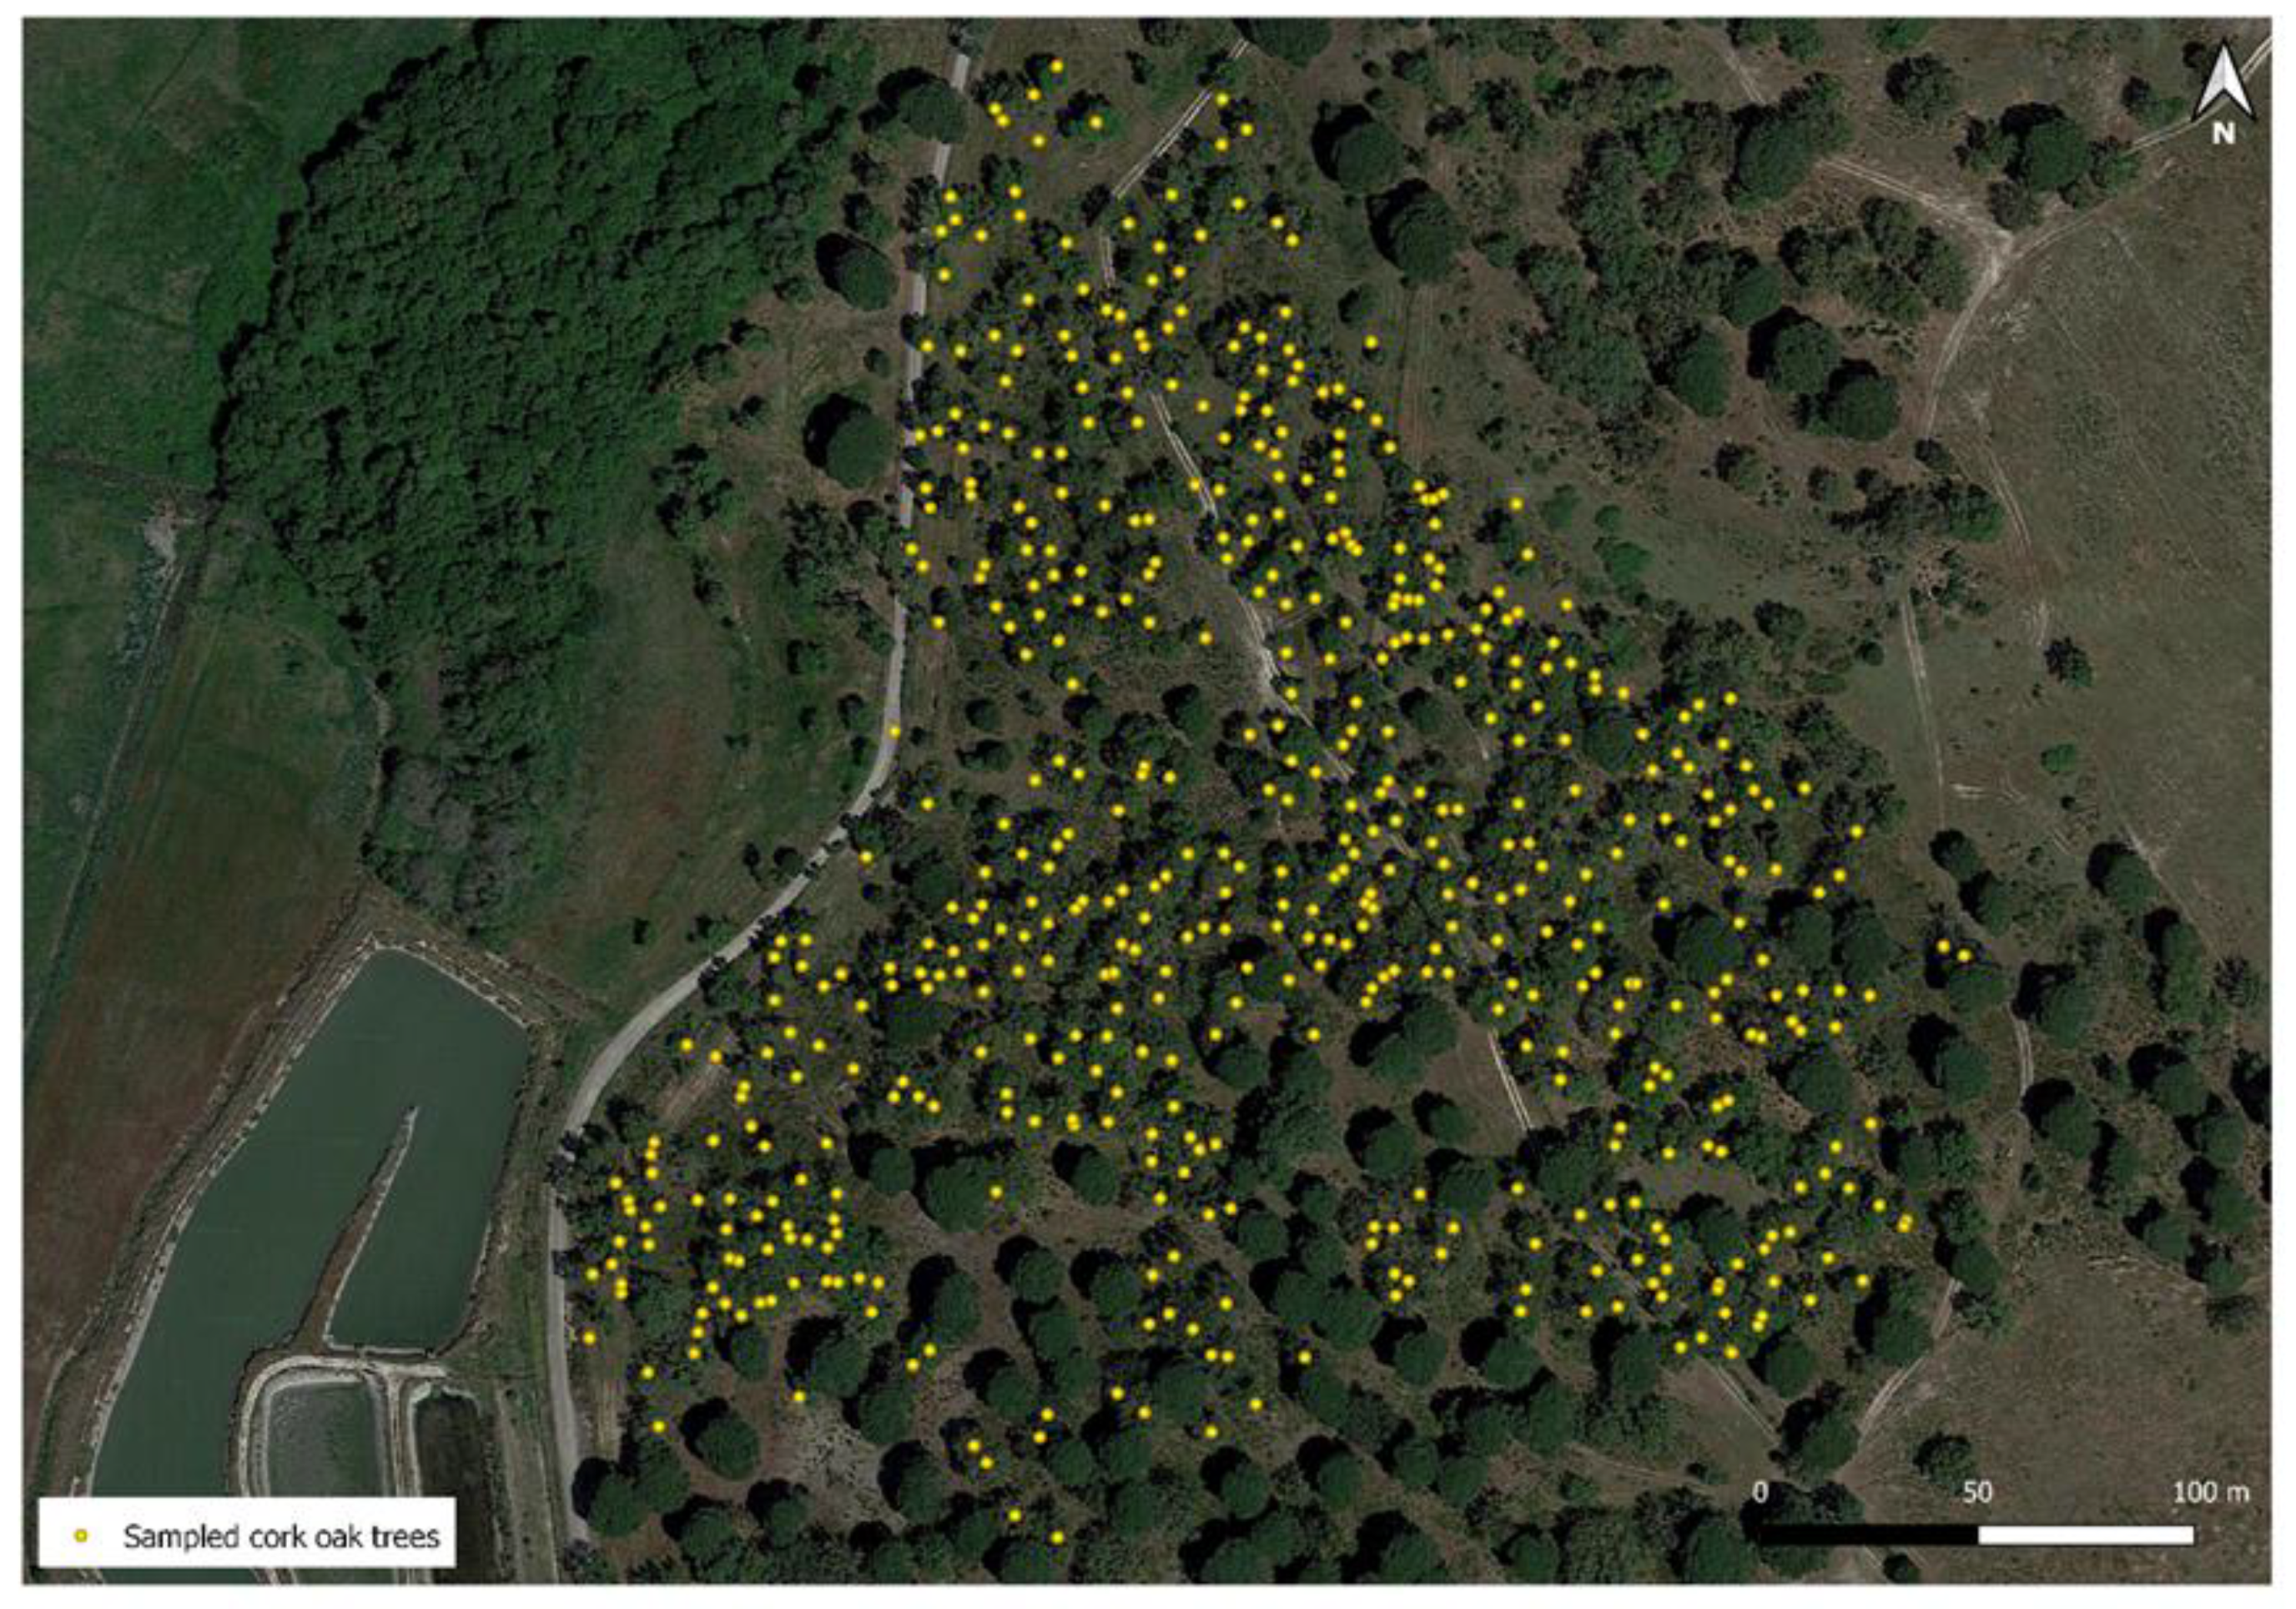
2.1. Cork Oak Population Analyzed
2.2. DNA Extraction
2.3. SNP Genotyping and Calling
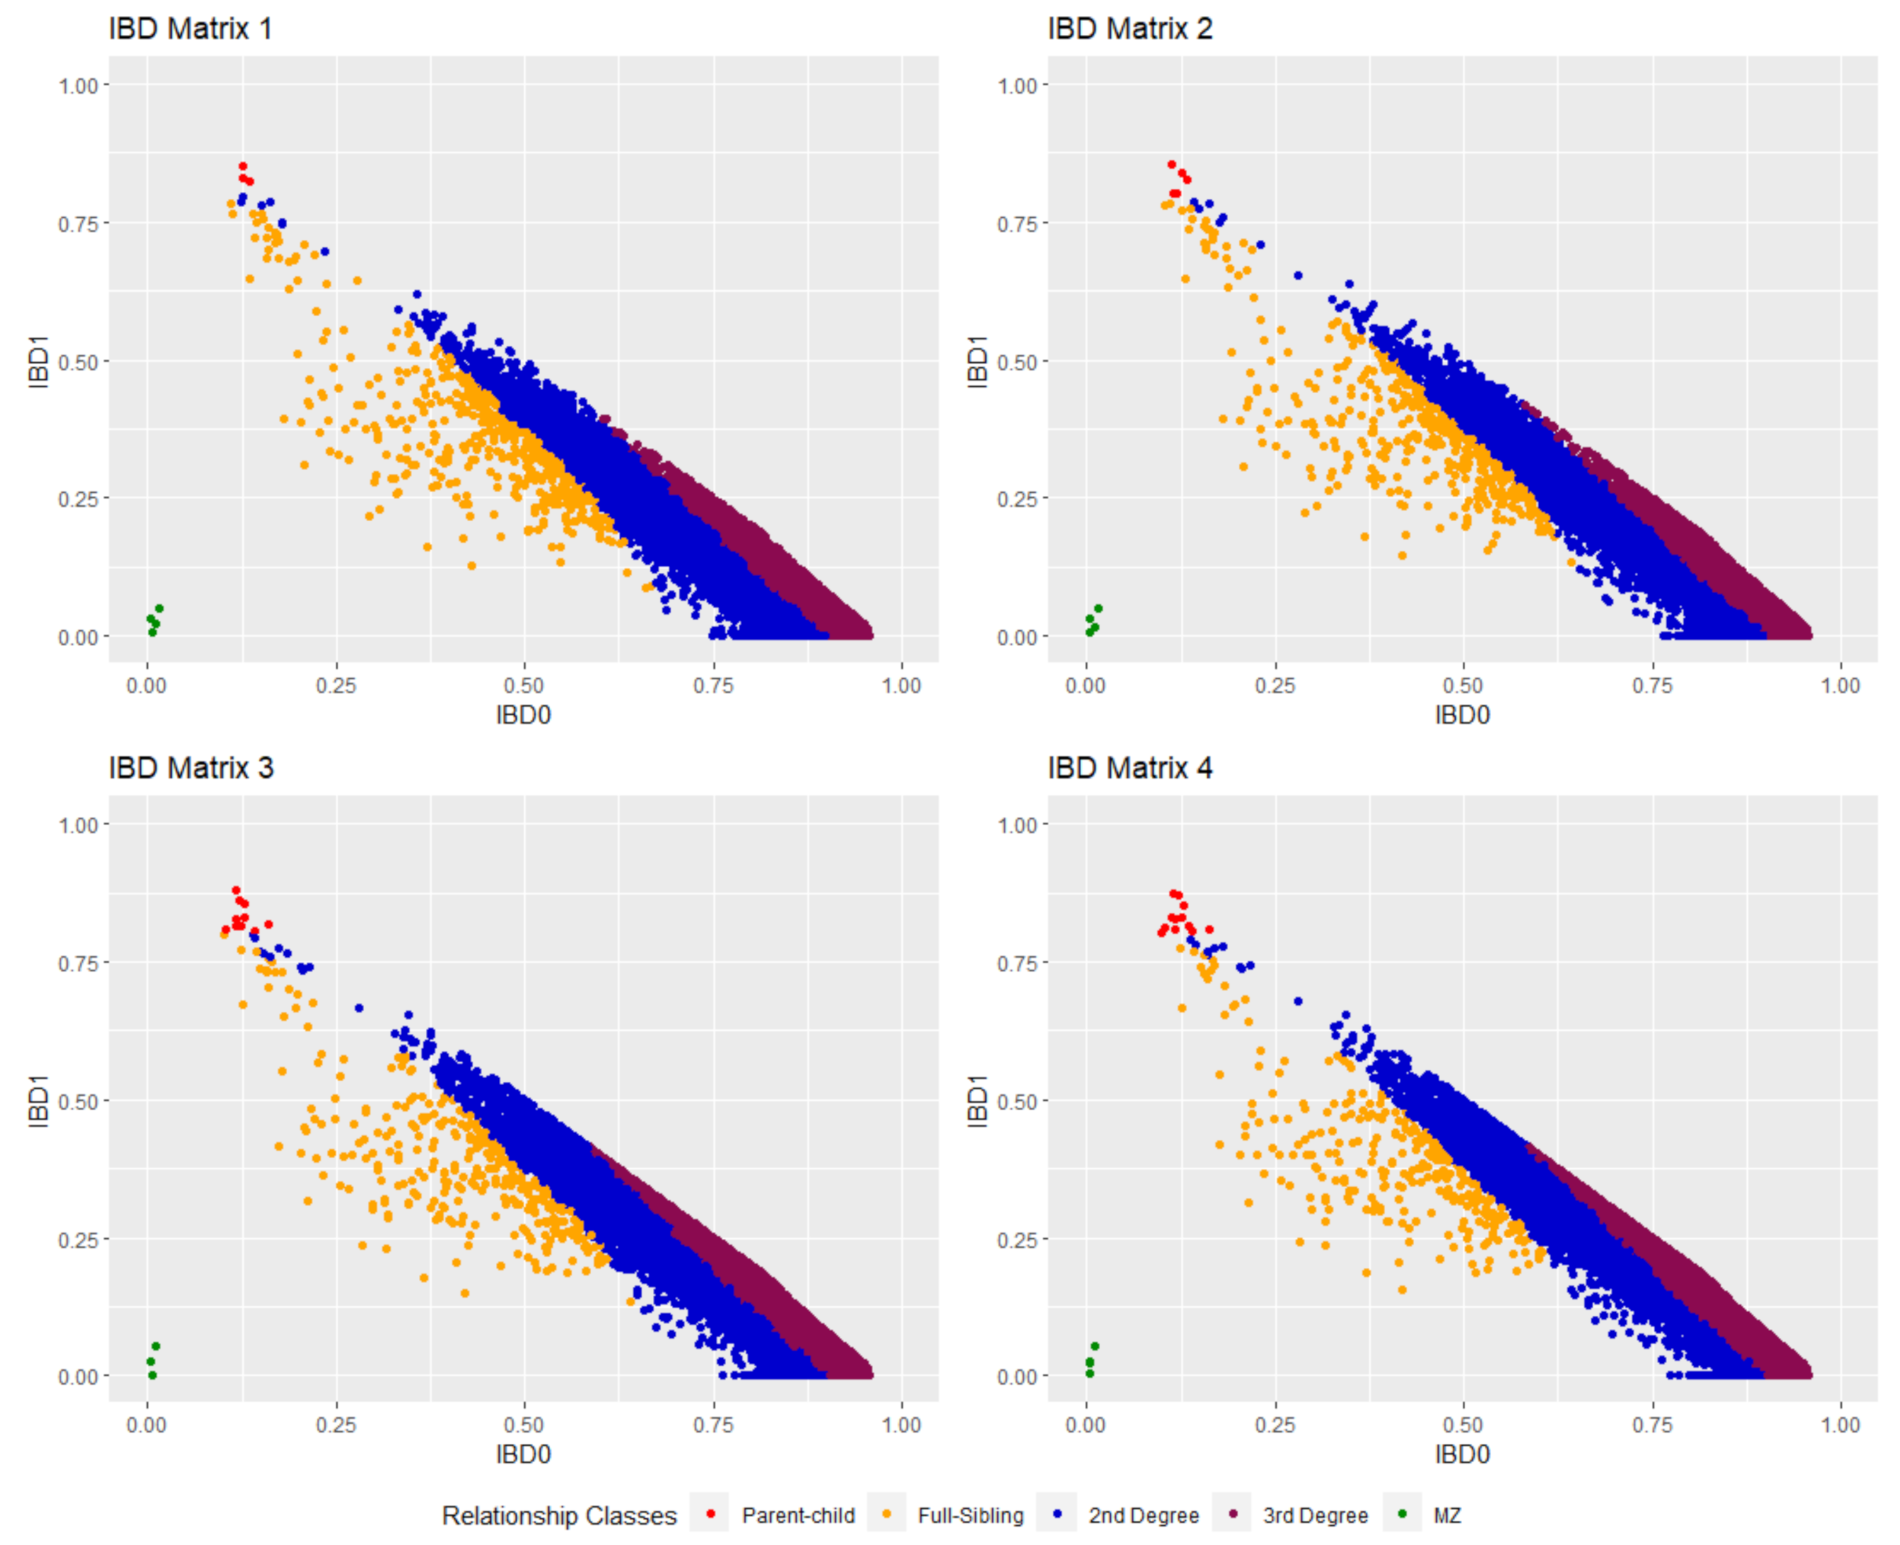
2.4. IBD Estimation
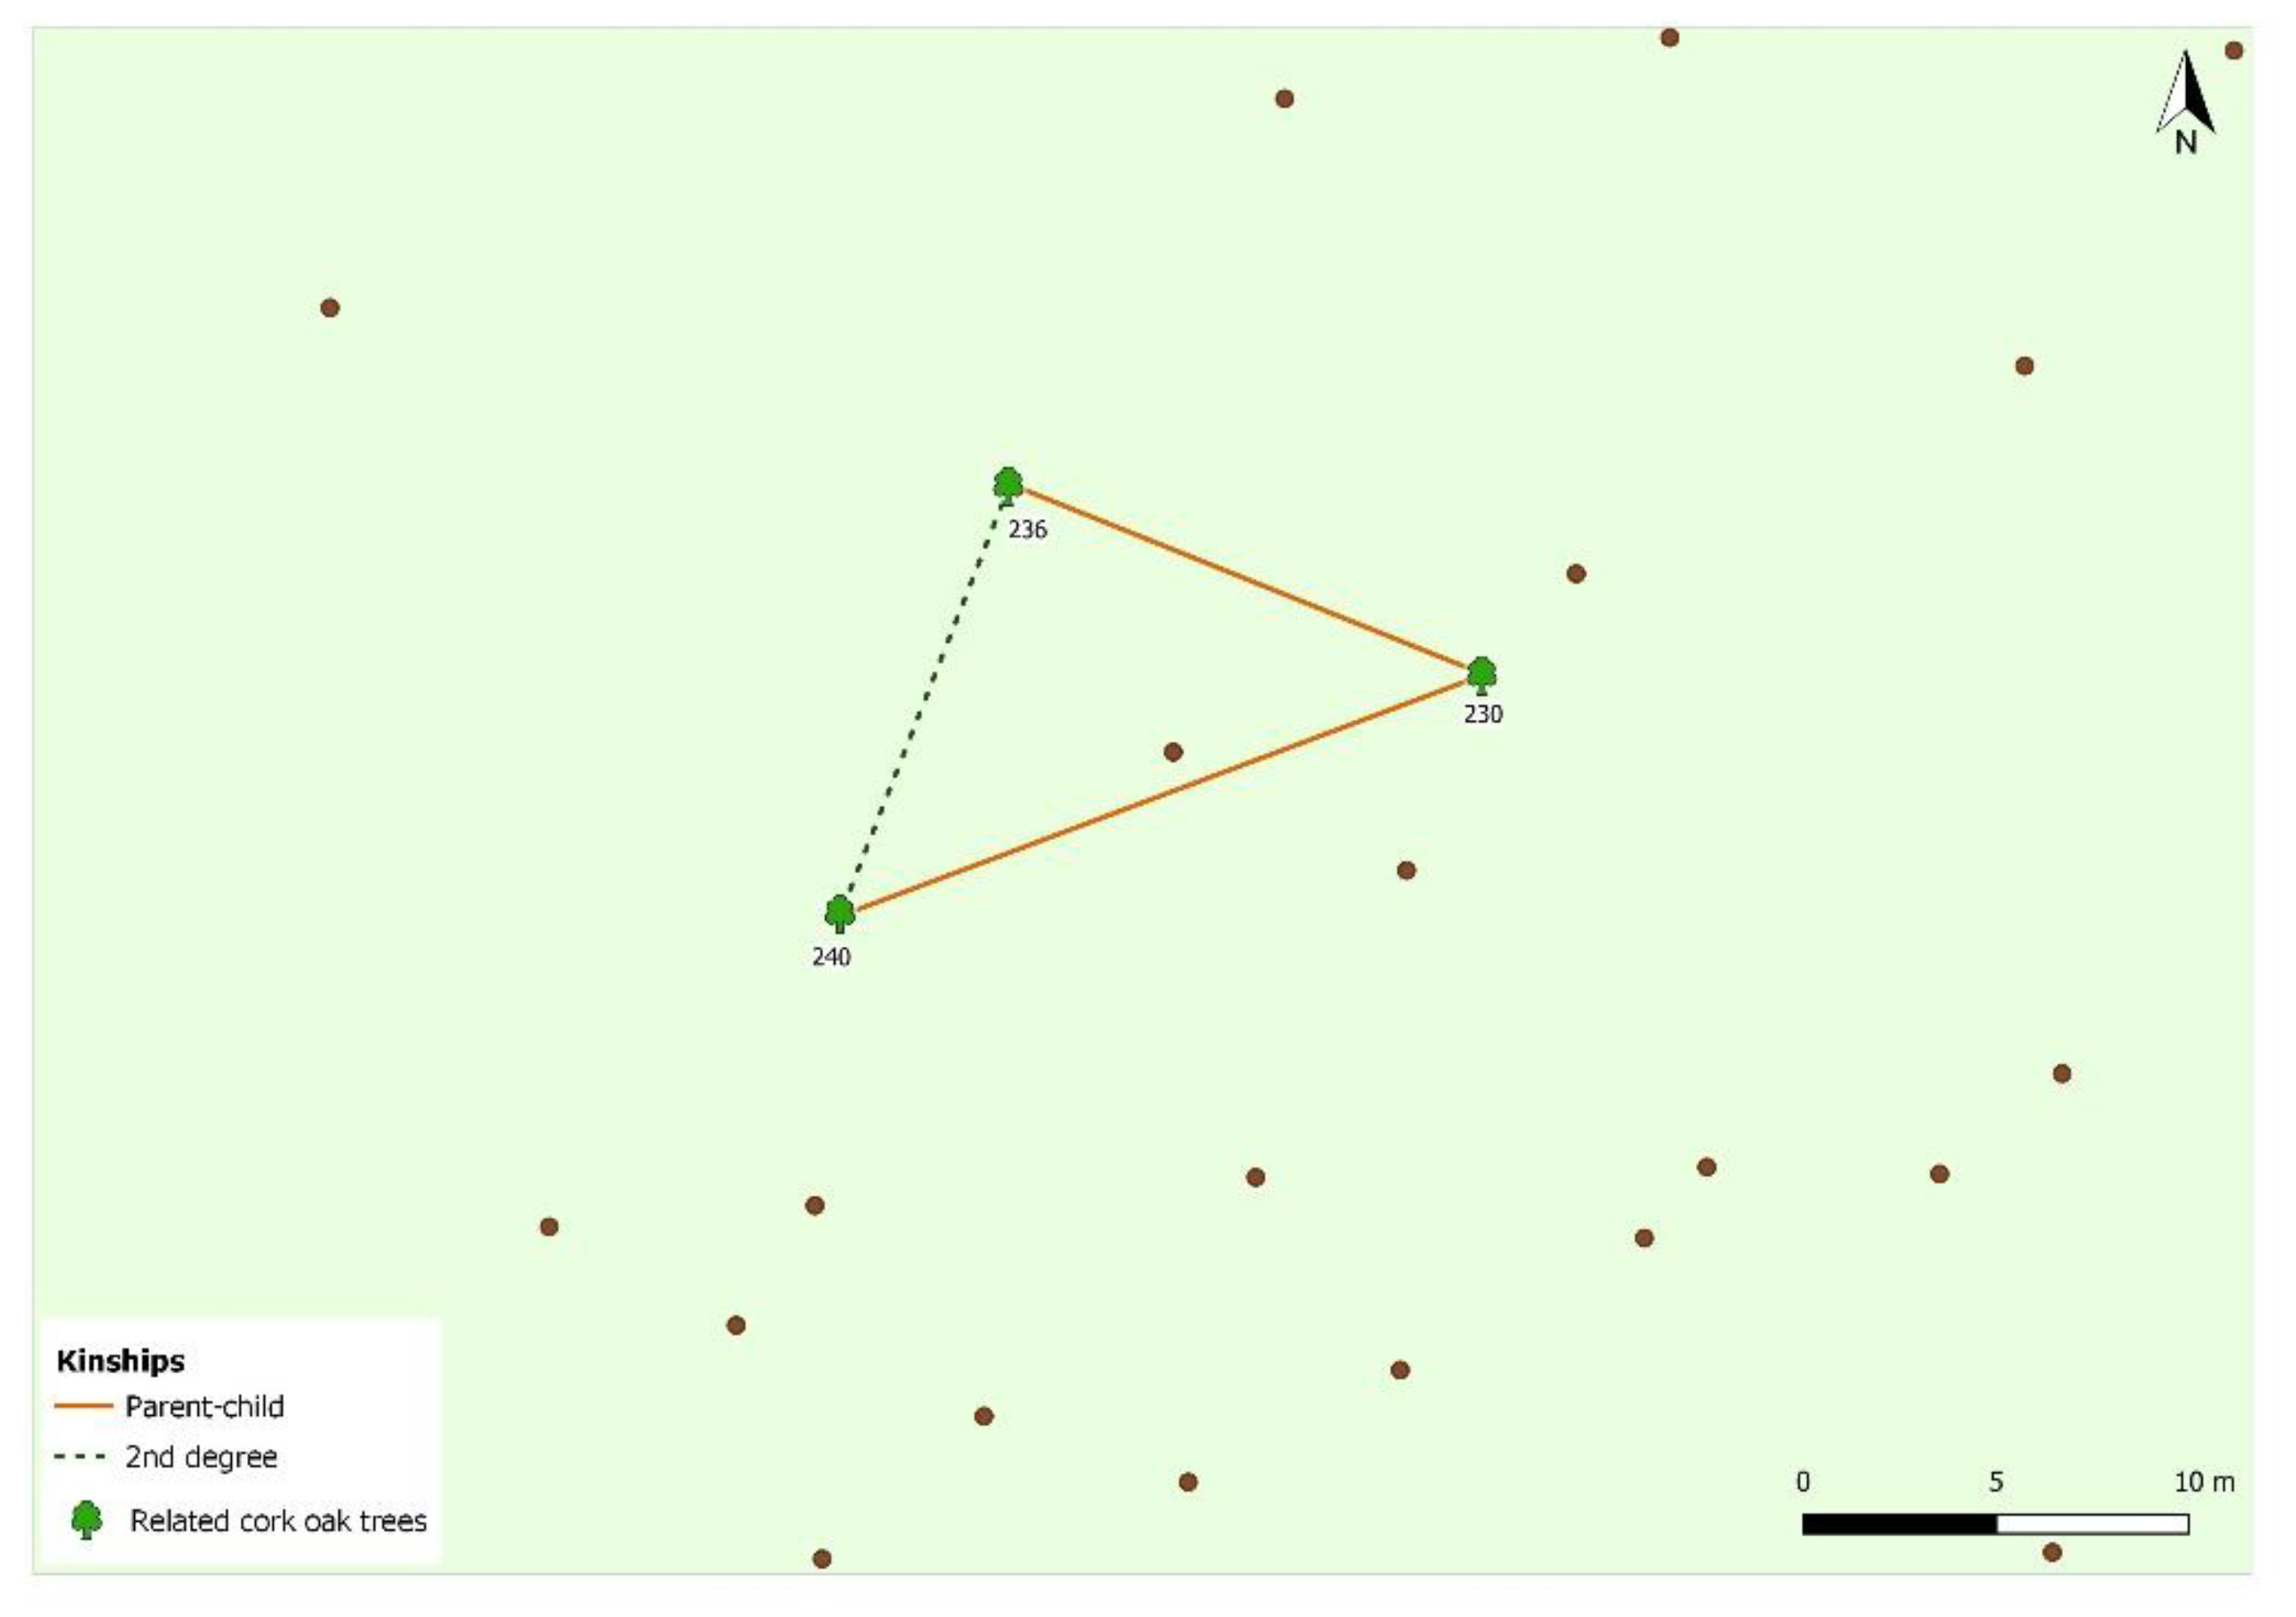
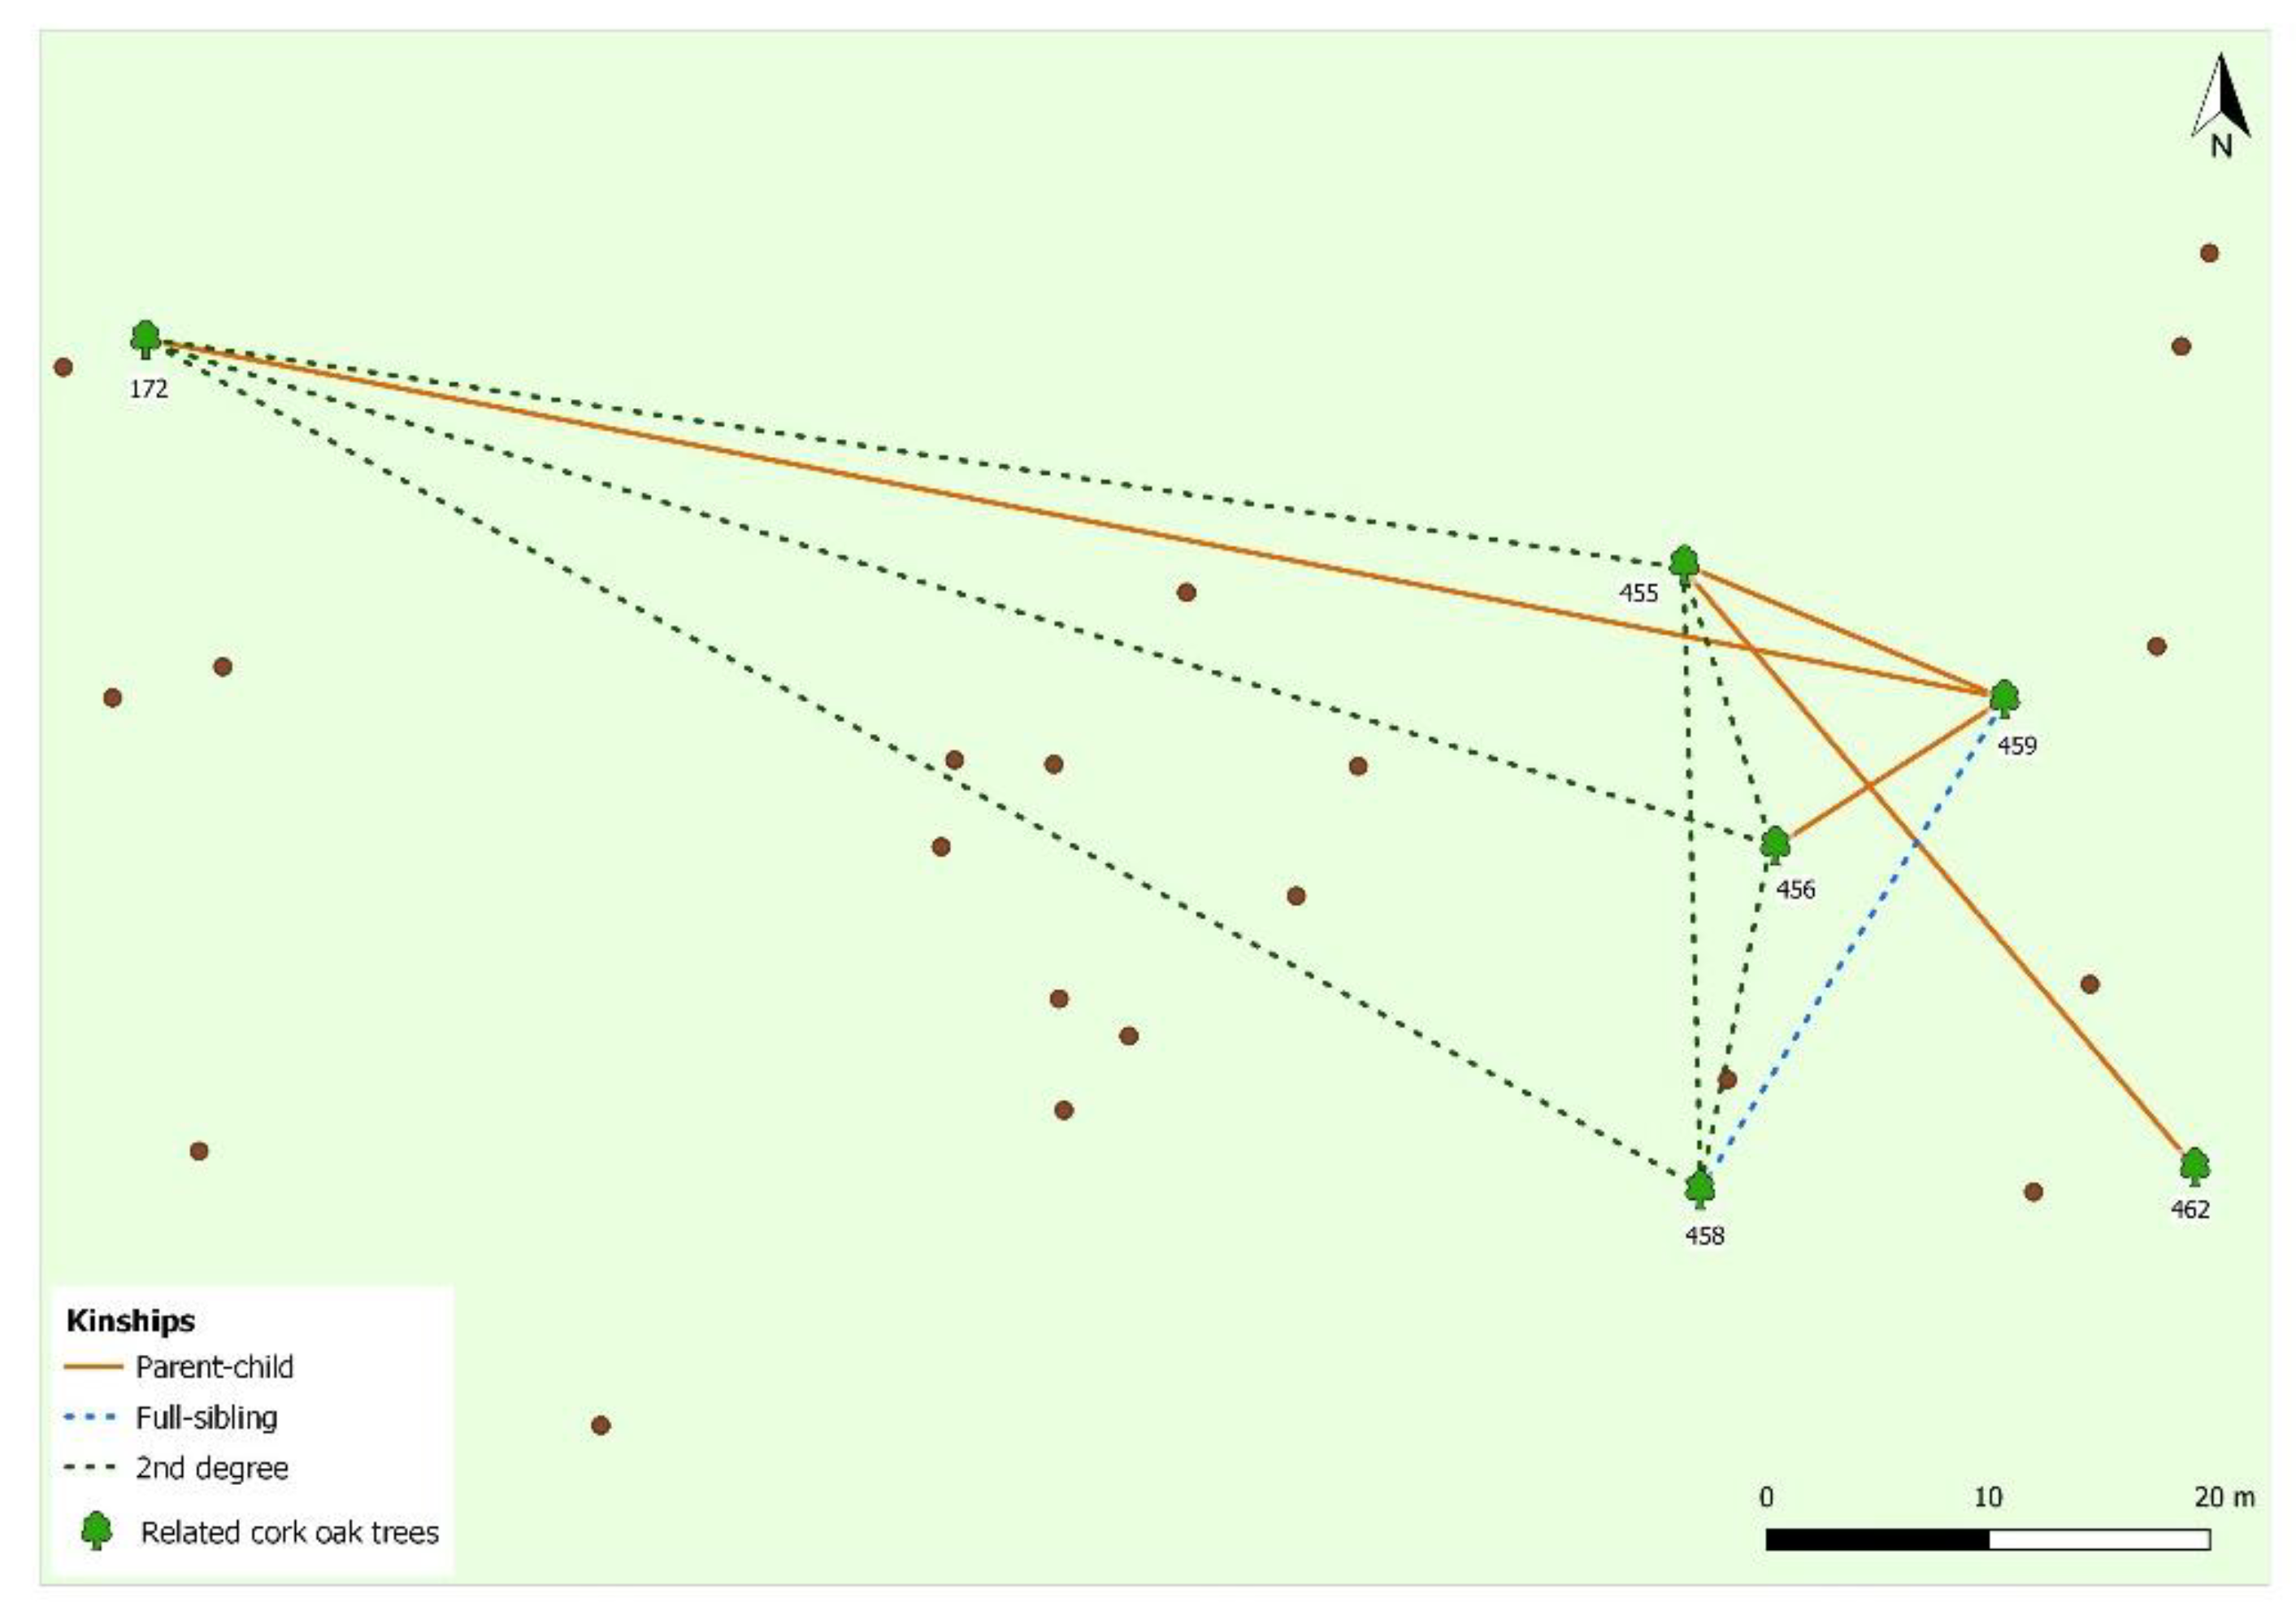
2.5. Pedigree Reconstruction
3. Results and Discussion
- DP ≥ 8, SNPQ ≥ 30, GTQ ≥ 10, bi-allelic only, no indels, MAF—1%;
- DP ≥ 8, SNPQ ≥ 30, GTQ ≥ 10, bi-allelic only, no indels, MAF—5%;
- DP ≥ 8, SNPQ ≥ 30, GTQ ≥ 10, bi-allelic only, no indels, maxMD—50%, minGTF—2%, MAF—1%;
- DP ≥ 8, SNPQ ≥ 30, GTQ ≥ 10, bi-allelic only, no indels, maxMD—50%, minGTF—2%, MAF—5%;
4. Conclusions
Author Contributions
Funding
Data Availability Statement
Acknowledgments
Conflicts of Interest
References
- APCOR’s Cork Yearbook 19/20; Portuguese Cork Association: Santa Maria de Lamas, Portugal, 2020; p. 128. Available online: https://www.apcor.pt/wp-content/uploads/2019/12/boletim_estatistico_apcor_2019.pdf (accessed on 20 January 2022).
- Pereira, H. Cork: Biology, Production and Uses; Elsevier: Amsterdam, The Netherlands, 2011. [Google Scholar]
- Caritat, A.; Gutiérrez, E.; Molinas, M. Influence of weather on cork ring width. Tree Physiol. 2000, 20, 893–900. [Google Scholar] [CrossRef] [PubMed] [Green Version]
- Bugalho, M.; Plieninger, T.; Aronson, J.; Ellatifi, M.; Crespo, D.G. Open woodlands: A diversity of uses (and overuses). In Cork Oak Woodlands on the Edge: Conservation, Adaptive Management and Restoration, 1st ed.; Aronson, J., Pereira, J.S., Pausas, Eds.; Island Press: New York, NY, USA, 1999; pp. 33–47. [Google Scholar]
- Costa, A.; Pereira, H.; Madeira, M. Analysis of spatial patterns of oak decline in cork oak woodlands in Mediterranean conditions. Ann. For. Sci. 2010, 67, 204. [Google Scholar] [CrossRef]
- Camilo-Alves, C.; Clara, M.; Ribeiro, N. Decline of Mediterranean oak trees and its association with Phytophthora cinnamomi: A review. Eur. J. For. Res. 2013, 132, 411–432. [Google Scholar] [CrossRef]
- Natividade, J.V. Cortiças: Contribuição para o estudio do melhoramento da qualidade. J. Oliveira Jr. 1934, 1, 1–143. [Google Scholar]
- Pereira, H. Chemical composition and variability of cork from Quercus suber L. Wood Sci. Technol. 1988, 22, 211–218. [Google Scholar] [CrossRef]
- Conde, E.; Cadahía, E.; García-Vallejo, M.C.; Fernández de Simón, B. Polyphenolic composition of Quercus suber cork from different Spanish provenances. J. Agric. Food Chem. 1998, 46, 3166–3171. [Google Scholar] [CrossRef]
- Varela, M.C. The EUFORGEN Quercus suber Network and the research projects for the evaluation of genetic variability of cork oak. In Proceedings of the Mediterranean Oaks Network, Report of the First Meeting, Antalya, Turkey, 12–14 October 2000; International Plant Genetic Resources Institute: Rome, Italy, 2000; Volume 472, p. 6. [Google Scholar]
- Sampaio, T.; Gonçalves, E.; Faria, C.; Almeida, M.H. Genetic variation among and within Quercus suber L. populations in survival, growth, vigor and plant architecture traits. For. Ecol. Manag. 2021, 483, 118715. [Google Scholar] [CrossRef]
- Coltman, D.W. Testing marker-based estimates of heritability in the wild. Mol. Ecol. 2005, 14, 2593–2599. [Google Scholar] [CrossRef]
- Kumar, S.; Richardson, T.E. Inferring relatedness and heritability using molecular markers in radiate pine. Mol. Breed. 2005, 15, 55–64. [Google Scholar] [CrossRef]
- Lynch, M.; Ritland, K. Estimation of pairwise relatedness with molecular markers. Genetics 1999, 152, 1753–1766. [Google Scholar] [CrossRef]
- Ritland, K. A marker-based method for inferences about quantitative inheritance in natural populations. Evolution 1996, 50, 1062–1073. [Google Scholar] [CrossRef] [Green Version]
- Ritland, K. Marker-inferred relatedness as a tool for detecting heritability in nature. Mol. Ecol. 2000, 9, 1195–1204. [Google Scholar] [CrossRef] [Green Version]
- Thomas, S.C. The estimation of genetic relationships using molecular markers and their efficiency in estimating heritability in natural populations. Philos. Trans. R. Soc. Lond. B. Biol. Sci. 2005, 360, 1457–1467. [Google Scholar] [CrossRef] [Green Version]
- Álvarez, R.; Alonso, P.; Cortizo, M.; Celestino, C.; Hernández, I.; Toribio, M.; Ordás, R.J. Genetic transformation of selected mature cork oak (Quercus suber L.) trees. Plant Cell Rep. 2004, 23, 218–223. [Google Scholar] [CrossRef]
- Doerksen, T.K.; Herbinger, C.M. Impact of reconstructed pedigrees on progeny-test breeding values in red spruce. Tree Genet. Genomes 2010, 6, 591–600. [Google Scholar] [CrossRef]
- Vidal, M.; Plomion, C.; Harvengt, L.; Raffin, A.; Boury, C.; Bouffier, L. Paternity recovery in two maritime pine polycross mating designs and consequences for breeding. Tree Genet. Genomes 2015, 11, 105. [Google Scholar] [CrossRef]
- Ramos, A.M.; Usié, A.; Barbosa, P.; Barros, P.M.; Capote, T.; Chaves, I.; Simões, F.; Abreu, I.; Carrasquinho, I.; Faro, C.; et al. The draft genome sequence of cork oak. Sci. Data 2018, 5, 1–12. [Google Scholar] [CrossRef]
- IUSS Working Group WRB. World Reference Base for Soil Resources, 2nd ed.; World Soil Resources Reports 103; FAO: Rome, Italy, 2006; p. 103. [Google Scholar]
- Langmead, B.; Salzberg, S. Fast gapped-read alignment with Bowtie 2. Nat. Methods 2012, 9, 357–359. [Google Scholar] [CrossRef] [Green Version]
- Li, H.; Handsaker, B.; Wysoker, A.; Fennell, T.; Ruan, J.; Homer, N.; Marth, G.; Abecasis, G.; Durbin, R. The sequence alignment/map format and SAMtools. Bioinformatics 2009, 25, 2078–2079. [Google Scholar] [CrossRef] [Green Version]
- Garrison, E.; Marth, G. Haplotype-based variant detection from short-read sequencing. arXiv 2012, arXiv:1207.3907. (q-bio.GN). [Google Scholar]
- Danecek, P.; Auton, A.; Abecasis, G.; Albers, C.A.; Banks, E.; DePristo, M.A.; Handsaker, R.E.; Lunter, G.; Marth, G.T.; Sherry, S.T.; et al. 1000 Genomes Project Analysis Group. The variant call format and VCFtools. Bioinformatics 2011, 27, 2156–2158. [Google Scholar] [CrossRef]
- Purcell, S.; Neale, B.; Todd-Brown, K.; Thomas, L.; Ferreira, M.A.; Bender, D.; Maller, J.; Sklar, P.; de Bakker, P.I.; Daly, M.J.; et al. PLINK: A toolset for whole-genome association and population-based linkage analysis. Am. J. Hum. Genet. 2007, 81, 559–575. [Google Scholar] [CrossRef] [Green Version]
- Blouin, M.S. DNA-based methods for pedigree reconstruction and kinship analysis in natural populations. Trends Ecol. Evol. 2003, 18, 503–511. [Google Scholar] [CrossRef]
- Staples, J.; Qiao, D.; Cho, M.H.; Silverman, E.K.; Nickerson, D.A.; Below, J.E.; University of Washington Center for Mendelian Genomics. PRIMUS: Rapid reconstruction of pedigrees from genome-wide estimates of identity by descent. Am. J. Hum. Genet. 2014, 95, 553–564. [Google Scholar] [CrossRef] [Green Version]
- Garrison, W.J.; Augspurger, C.K. Double- and single-seeded acorns of bur oak (Quercus macrocarpa): Frequency and some ecological consequences. Bull. Torrey Bot. Club 1983, 110, 154–160. [Google Scholar] [CrossRef]
- McEuen, A.B.; Steele, M.A. Atypical acorns appear to allow seed escape after apical notching by squirrels. Am. Midl. Nat. 2005, 154, 450–458. [Google Scholar] [CrossRef]
- Costa, A.; Pereira, H. Montados e sobreirais: Uma espécie, duas perspectivas. In Os Montados. Muito para além das Árvores. Árvores e Florestas de Portugal, 1st ed.; Sande Silva, J., Ed.; Público, Comunicação Social SA & Fundação Luso-Americana para o Desenvolvimento: Lisboa, Portugal, 2007; pp. 17–37. [Google Scholar]
- Zhang, M.; Dong, Z.; Yi, X.; Bartlow, A.W. Acorns containing deeper plumule survive better: How white oaks counter embryo excision by rodents. Ecol. Evol. 2014, 4, 59–66. [Google Scholar] [CrossRef]
- Steele, M.A.; Turner, G.; Smallwood, P.D.; Wolff, J.O.; Radillo, J. Cache management by small mammals: Experimental evidence for the significance of acorn-embryo excision. J. Mammal. 2001, 82, 35–42. [Google Scholar] [CrossRef] [Green Version]
- Xiang, J.; Li, X.; Yi, X. One acorn produces two seedlings in Chinese cork oak Quercus variabilis. Plant Signal. Behav. 2019, 14, e1654817. [Google Scholar] [CrossRef] [PubMed]
- Acácio, V.; Holmgren, M.; Moreira, F.; Mohren, G.M.J. Oak persistence in Mediterranean landscapes: The combined role of management, topography, and wildfires. Ecol. Soc. 2010, 15. [Google Scholar] [CrossRef]
- Zavala, M.A.; Zamora, R.; Pulido, F.; Blanco, J.A.; Imbert, J.B.; Marañón, T.; Castillo, F.J.; Valladares, F. Nuevas perspectivas en la conservación, restauración y gestión sostenible del bosque mediterráneo. In Ecología del Bosque Mediterráneo en un Mundo Cambiante, 1st ed.; Valladares, F., Egraf, S.A., Eds.; Ministerio de Medio Ambiente: Madrid, Spain, 2004; pp. 509–529. [Google Scholar]
- Lstibůrek, M.; El-Kassaby, Y.A.; Skrøppa, T.; Hodge, G.R.; Sønstebø, J.H.; Steffenrem, A. Dynamic gene-resource landscape management of Norway spruce: Combining utilization and conservation. Front. Plant Sci. 2017, 8, 1810. [Google Scholar] [CrossRef] [PubMed] [Green Version]


| Nr of SNPs | Related Dyads (PI_HAT ≥ 0.1) | Unrelated Dyads (PI_HAT < 0.1) | |
|---|---|---|---|
| IBD matrix 1 | 6016 | 12,334 | 108,945 |
| IBD matrix 2 | 4752 | 11,882 | 109,397 |
| IBD matrix 3 | 5093 | 9587 | 111,695 |
| IBD matrix 4 | 4362 | 9208 | 112,071 |
| IBD Matrix 1 | IBD Matrix 2 | IBD Matrix 3 | IBD Matrix 4 | |
|---|---|---|---|---|
| 1st Degree | 502 | 436 | 330 | 306 |
| Parent–child | 3 | 5 | 10 | 12 |
| Full sibling | 499 | 431 | 320 | 294 |
| 2nd Degree | 10,362 | 9502 | 6400 | 5866 |
| 3rd Degree | 10,887 | 13,078 | 13,195 | 13,534 |
| Distant | 609 | 839 | 2275 | 2404 |
| MZ | 4 | 4 | 4 | 4 |
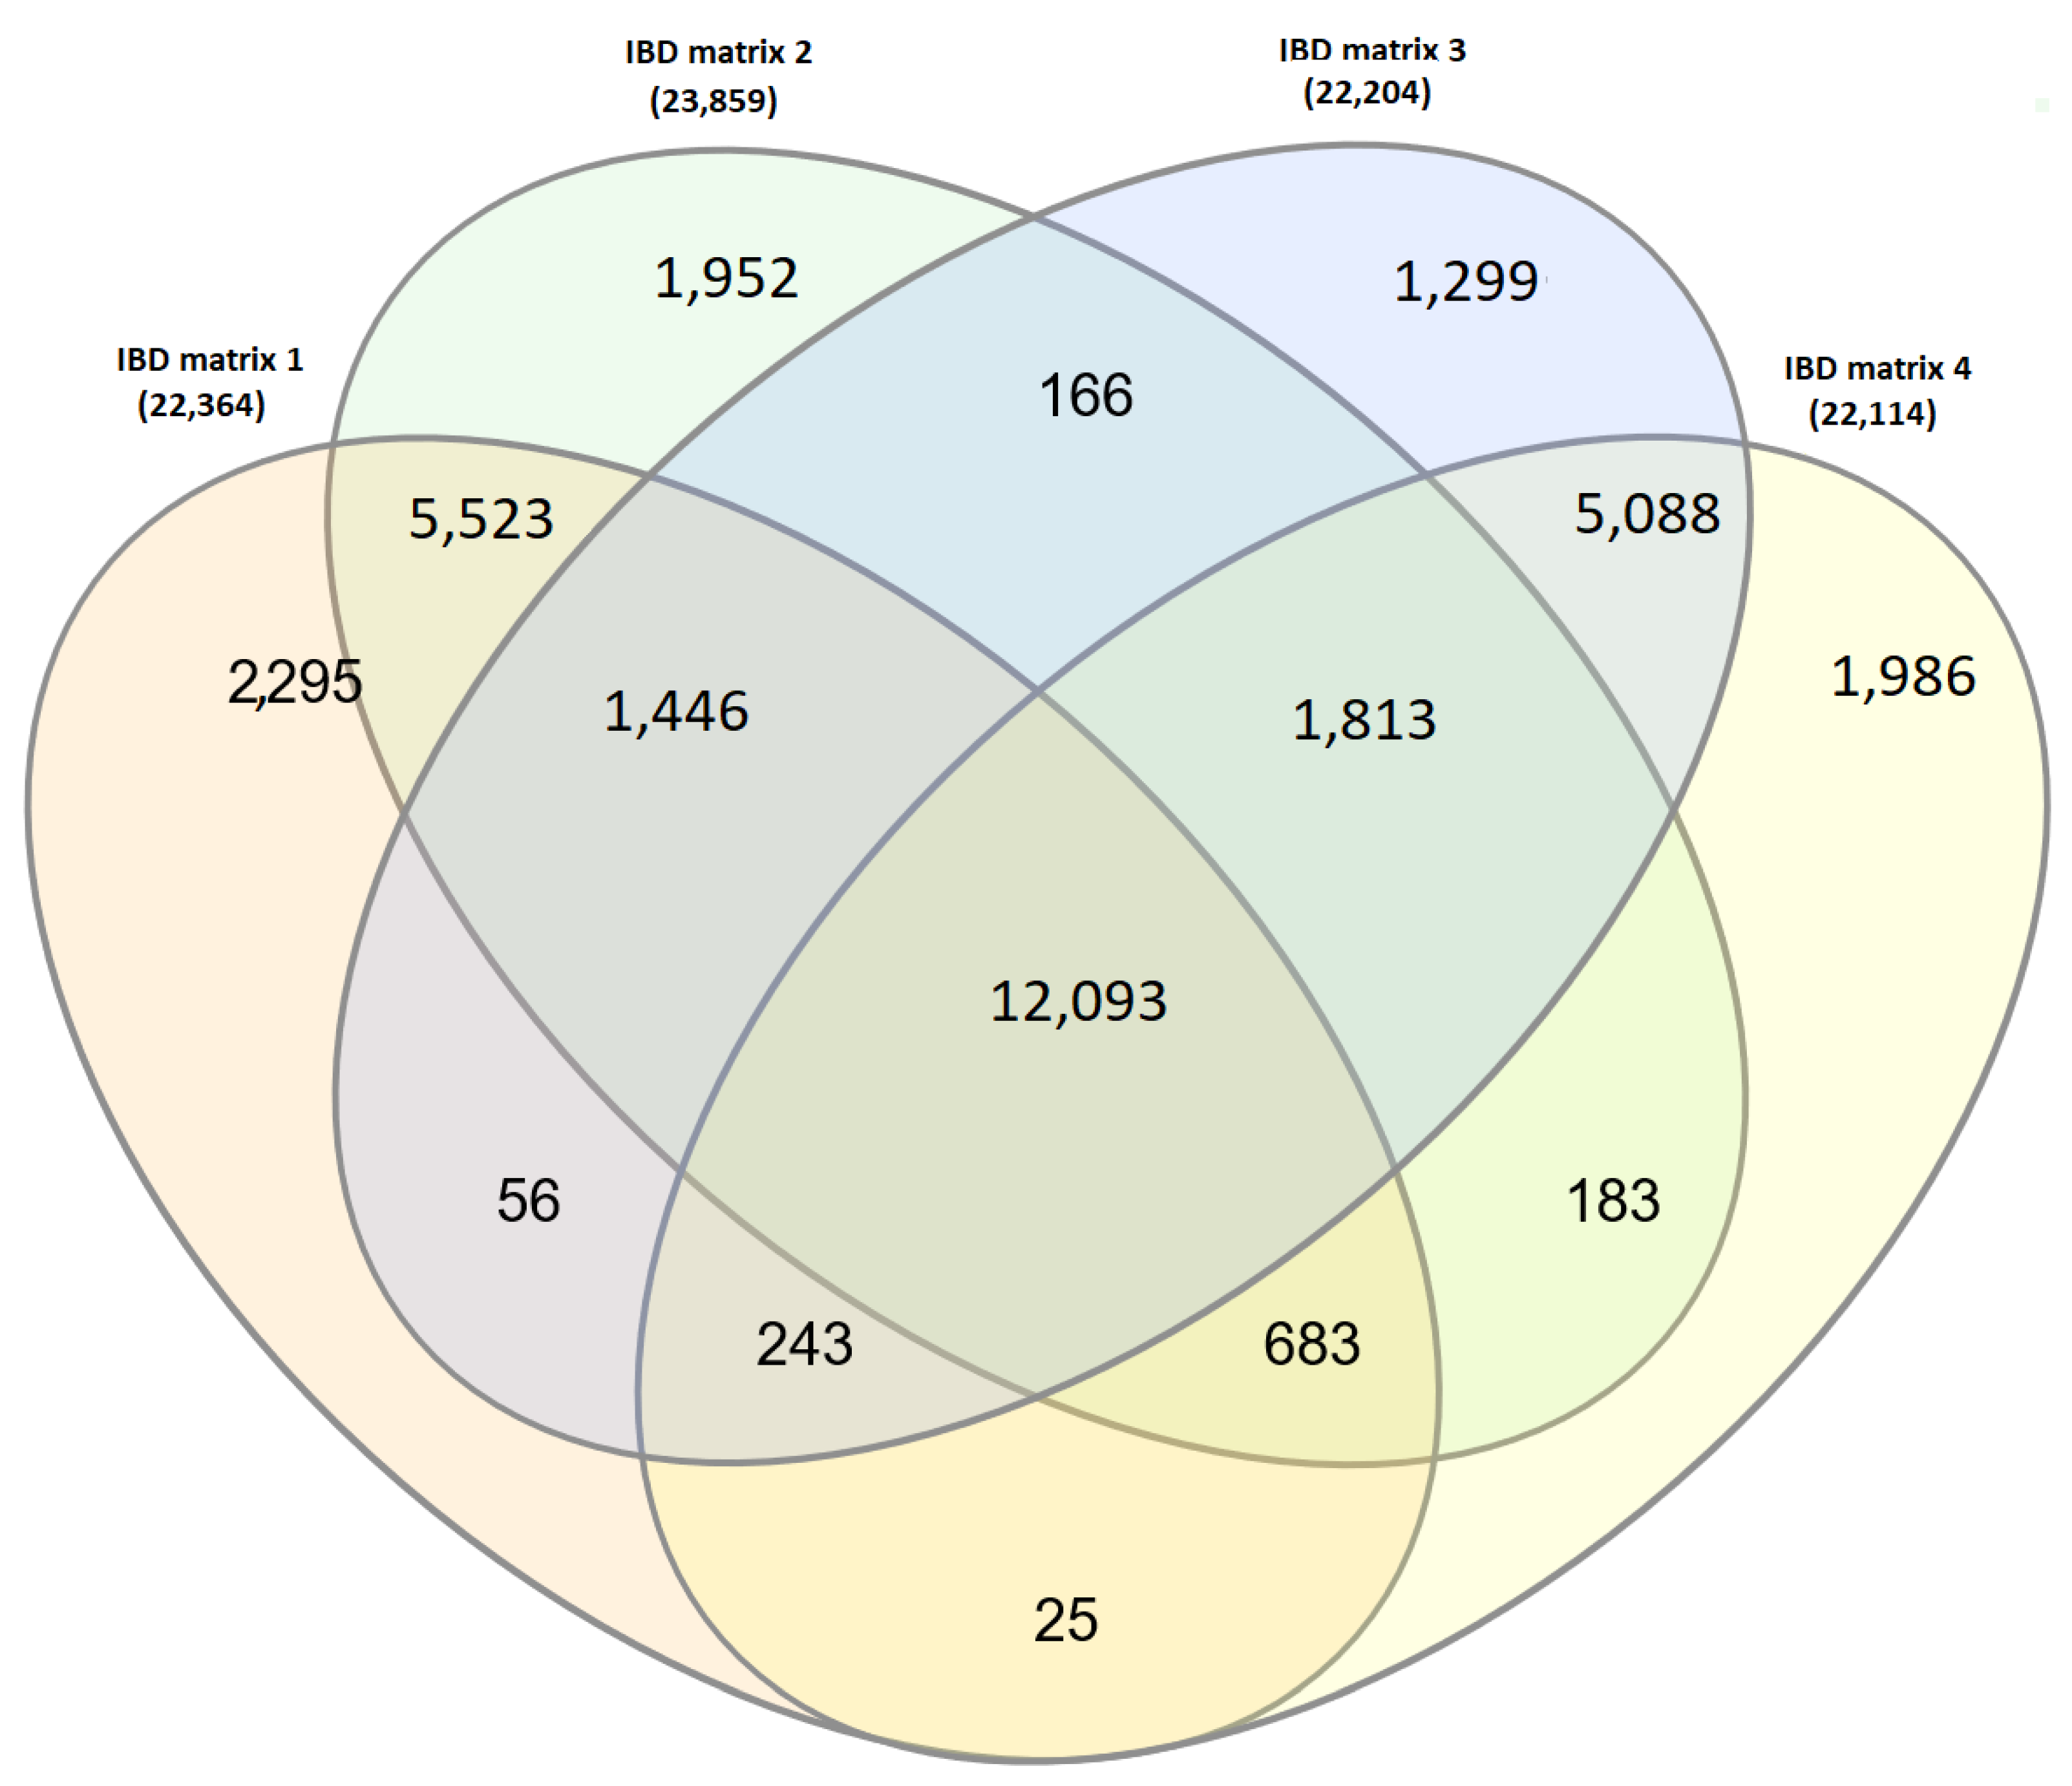
| Total Related | 22,364 | 23,859 | 22,204 | 22,114 |
| Unrelated | 98,914 | 97,419 | 99,074 | 99,164 |
Publisher’s Note: MDPI stays neutral with regard to jurisdictional claims in published maps and institutional affiliations. |
© 2022 by the authors. Licensee MDPI, Basel, Switzerland. This article is an open access article distributed under the terms and conditions of the Creative Commons Attribution (CC BY) license (https://creativecommons.org/licenses/by/4.0/).
Share and Cite
Mendes, B.; Sampaio, T.; Antunes, M.A.; Magalhães, H.; Costa e Silva, F.; Borges, C.; Simões, F.; Usié, A.; Almeida, M.H.; Ramos, A.M. Kinship Analysis and Pedigree Reconstruction of a Natural Regenerated Cork Oak (Quercus suber) Population. Forests 2022, 13, 226. https://doi.org/10.3390/f13020226
Mendes B, Sampaio T, Antunes MA, Magalhães H, Costa e Silva F, Borges C, Simões F, Usié A, Almeida MH, Ramos AM. Kinship Analysis and Pedigree Reconstruction of a Natural Regenerated Cork Oak (Quercus suber) Population. Forests. 2022; 13(2):226. https://doi.org/10.3390/f13020226
Chicago/Turabian StyleMendes, Bruna, Teresa Sampaio, Marta A. Antunes, Hugo Magalhães, Filipe Costa e Silva, Carla Borges, Fernanda Simões, Ana Usié, Maria Helena Almeida, and António Marcos Ramos. 2022. "Kinship Analysis and Pedigree Reconstruction of a Natural Regenerated Cork Oak (Quercus suber) Population" Forests 13, no. 2: 226. https://doi.org/10.3390/f13020226
APA StyleMendes, B., Sampaio, T., Antunes, M. A., Magalhães, H., Costa e Silva, F., Borges, C., Simões, F., Usié, A., Almeida, M. H., & Ramos, A. M. (2022). Kinship Analysis and Pedigree Reconstruction of a Natural Regenerated Cork Oak (Quercus suber) Population. Forests, 13(2), 226. https://doi.org/10.3390/f13020226