Article

Genetic Differentiation and Demographic History of Three Cerris Oak Species in China Based on Nuclear Microsatellite Makers

1
Key Laboratory of Resource Biology and Biotechnology in Western China (Ministry of Education), College of Life Sciences, Northwest University, Xi’an 710069, China
2
College of Life Sciences, Sun Yat-sen University, Guangzhou 510000, China
3
School of Pharmacy, Xi’an Jiaotong University, Xi’an 710069, China
4
School of Biological Sciences, Guizhou Education University, Guiyang 550000, China
*
Author to whom correspondence should be addressed.
Contributed equally to this work.
Forests 2021, 12(9), 1164; https://doi.org/10.3390/f12091164
Submission received: 16 July 2021 / Revised: 22 August 2021 / Accepted: 25 August 2021 / Published: 27 August 2021

Abstract

:
Knowledge of interspecific divergence and population expansions/contractions of dominant forest trees in response to geological events and climatic oscillations is of major importance to understand their evolution and demography. However, the interspecific patterns of genetic differentiation and spatiotemporal population dynamics of three deciduous Cerris oak species (Q. acutissima, Q. variabilis and Q. chenii) that are widely distributed in China remain poorly understood. In this study, we genotyped 16 nuclear loci in 759 individuals sampled from 44 natural populations of these three sibling species to evaluate the plausible demographical scenarios of the closely related species. We also tested the hypothesis that macro- and microevolutionary processes of the three species had been triggered and molded by Miocene–Pliocene geological events and Quaternary climatic change. The Bayesian cluster analysis showed that Q. acutissima and Q. chenii were clustered in the same group, whereas Q. variabilis formed a different genetic cluster. An approximate Bayesian computation (ABC) analyses suggested that Q. variabilis and Q. acutissima diverged from their most common ancestor around 19.84 Ma, and subsequently Q. chenii diverged from Q. acutissima at about 9.6 Ma, which was significantly associated with the episodes of the Qinghai–Tibetan Plateau (QTP). In addition, ecological niche modeling and population history analysis showed that these three Cerris oak species repeatedly underwent considerable ‘expansion–contraction’ during the interglacial and glacial periods of the Pleistocene, although they have varying degrees of tolerance for the climatic change. Overall, these findings indicated geological and climatic changes during the Miocene–Pliocene and Pleistocene as causes of species divergence and range shifts of dominant tree species in the subtropical and warm temperature areas in China.

1. Introduction

Historical and ecological factors such as geological and/or climatic processes have a profound impact on biodiversity and sustainability at every level of the biota, from genes to spatial distribution [1,2,3,4]. The interactions among these processes would create multiple ecological niches, favoring high rates of intra- and interspecific diversification [5,6]. In parallel, climate buffering associated with complex topography seems to have contributed to a particularly low extinction rate of species/lineages adapted to contrasting environmental conditions since the Tertiary era [7,8]. Mountains uplift and climatic oscillations have exerted a significant influence on current geographic distribution of biodiversity, especially for the interspecific divergence and population demography of plants [9,10]. However, a knowledge of interspecific divergence and range dynamics for sedentary and long-lived tree species in response to the past geological and climate change is informative not only to know how forests were affected by historically environmental factors, but also to elucidate the components of such forests might respond to future environmental change [11].
Quercus L. (oak) is the most widespread and species-rich tree genus in the Northern Hemisphere [12]. This genus characterized by a strong potential for ecological adaptation, and species in the genus are usually have a high potential for introgression and reticulate evolution (e.g., [8,13,14]). Genus Quercus has recently been formalized as two subgenera and eight sections based on the restriction-site associated DNA sequencing (RAD-sequencing) data [15]. The predominantly subgenus Quercus, namely the New World oaks, includes the sections such as Quercus, Lobatae, Protobalanus, Virentes and Ponticae. The subgenus Cerris, namely the Old World oaks, includes Cerris, Ilex and Cyclobalanopsis sections. Among these sections, the Eurasian sect. Cerris comprises about 15 species, most of which are confined to western Eurasia [16], and three deciduous species (Q. acutissima, Q. chenii and Q. variabilis) that are widely distributed in Eastern Asia [17,18,19,20]. In recent years, detailed phylogeographic inferences of the three Cerris oaks in Eastern Asia had been generally examined with plastid DNA and nuclear markers; the results suggested climatic factors and environmental heterogeneity might play key roles in driving the intraspecific genetic divergence [21,22,23,24,25]. However, limited information was obtained to resolve interspecific divergence and demographic history of the three closely related Cerris oak species (Q. acutissima, Q. chenii and Q. variabilis) that widely distributed in China.
According to the State Forestry Administration of China, oaks comprise 13% of the natural forests in China. Q. acutissima Carruthers is a dominant species occupying a wide range of environmental conditions in subtropical and warm temperature zones in China [25]. This species is often found in deciduous broad-leaved forests on hillsides, which is regarded as the most common oak in deciduous secondary forests in the lowlands and a component of deciduous evergreen forests at low latitudes [26]. The hardwood of Q. acutissima could be used as the excellent building material, and the fresh leaves are a favorite food for Chinese oak silkworms. Another noteworthy usage of Q. acutissima is edible fungi cultivation [27]. Due to the high ecological and economic values, Q. acutissima has been listed as a precious timber species in China and also listed as the least concern according to the IUCN Red List of Threatened Species v3.1. (https://www.iucnredlist.org/species/194048/2295121) (accessed on 24 May 2021). Q. variabilis Blume is also the dominant species for the forests spread in the northern region of the subtropical areas of China, it usually has the sympatric distribution with Q. acutissima [28]. However, the geography of Q. chenii Nakai (Q. acutissima ssp. chenii Camus) is mainly restricted to central and eastern China [28]. This species can form pure forests and is distributed in the deciduous broad-leaves forests in hilly landscape [29]. Due to the widespread distribution and dominant position in warm temperate deciduous forests in China, these three Cerris oaks could provide a useful model to evaluate the impact of the geographical change and climatic oscillations on the interspecific divergence and demographic history of sibling tree species at a larger geographic scale. Understanding these abiotic factors in driving interspecific differentiation and species dynamics is a major task in ecological and evolutionary research [8,30,31].
In this study, we collected 759 individuals of the three Cerris oaks (Q. acutissima, Q. chenii and Q. variabilis) covering their main distribution ranges across China. Sixteen expressed sequence tag-single sequence repeat (EST-SSR) loci were surveyed for population genetic analyses, and ecological niche modelling on these three Cerris oaks were also conducted. We aim to obtain detailed scenarios of phylogeography and historical demography of the three important oak species in China. In particular, (1) we analyzed patterns of interspecific genetic differentiation among the three East Asia Cerris oaks and employed an approximate Bayesian computation (ABC) framework to compare different plausible scenarios of species divergence, which allowed us to infer the evolutionary and demographic history of the three relatives in section Cerris. (2) To test the hypothesis that interspecific divergence occurred progressively in the related oak species in response to the mountain uplifting, such as QTP uplifts. Meanwhile, we want to infer whether pairwise species genetic differentiation is associated with niche overlap. (3) To test the hypothesis that these related species underwent historical ‘expansion-contraction’ following the recent uplifts and/or the Pleistocene glacial/interglacial periods in this region.

2. Materials and Methods

2.1. Population Sampling

Leaf materials were collected from 44 wild populations (N = 759) of the three Cerris oaks, which distributed in subtropical China, including 19 populations (N = 336) of Q. variabilis, 20 populations (N = 338) of Q. acutissima, and 5 populations (N = 85) of Q. chenii (Table S1, Figure 1). For each population, mature foliage was sampled from 6–20 individuals spaced at least >100 m apart and dried rapidly with silica gel and stored at −10 °C until DNA isolation. Voucher specimens of each population were temporarily stored in the Evolutionary Botany Lab of Northwest University.

2.2. DNA Extraction and Microsatellite Genotyping

Total genomic DNA for each individual was extracted from the dried leaf tissue using the Plant Genomic DNA Extraction Kit (Tiangen, Beijing, China). A total of 16 nSSR loci were designed using Batch Primer 3 [32] based on Q. variabilis microsatellite sequences deposited in GenBank [33]. All 16 nSSR loci have high polymorphism and stably amplified among the three species (Table S2). Polymerase chain reactions (PCR) were carried out in a SimpliAmpTM Thermal Cycler (Applied Biosystems, Carlsbad, CA, USA) with a volume of 20 μL containing 10 μL 2 × Taq PCR Master Mix, 1 μL of primer template (10–30 ng), and 0.3 μL of each primer, 8.4 μL double-distilled H2O. The thermo-cycling conditions were set as follows: 5 min at 94 °C, followed by 30 cycles of 30 s at 94 °C, 40 s annealing at 55 °C, 40 s extension at 72 °C, with a final extension cycle of 5 min at 72 °C. PCR products were examined on an ABI 3730 XL analyzer (Applied Biosystems, Foster City, CA, USA), and the data were scored and compiled using GeneMarker® v2.2 (SoftGenetics, State College, PA, USA).

2.3. Genetic Diversity, Genetic Structure and Gene Flow Analysis

We calculated the genetic diversity indexes, including observed heterozygosity (HO), expected heterozygosity (HE), and polymorphism information content (PIC) for each locus using software CERVUS v3.0.7 and FSTAT v2.9.3 [34,35]. For each population, the genetic diversity parameters were estimated using GENEALEX v6.5 [36] and FSTAT v2.9.3, including number of different alleles (Na), number of effective alleles (Ne), inbreeding coefficient (FIS), HO, and HE. We also using FSTAT v2.9.3 to tested Hardy–Weinberg equilibrium (HWE) for all locus in each population.
Genetic structure of populations for the three oak species were surveyed using Bayesian clustering approach implemented in STRUCTURE v2.2.4 [37]. The analyses were run using the admixture model. A total of 10 independent runs were performed for the K value from one to eight with 200,000 burn-in steps followed by 500,000 Markov Chain Monte Carlo (MCMC) steps. The STRUCTURE output was analyzed by Structure Harvester (http://taylor0.biology.ucla.edu/structureHarvester/ accessed on 13 August 2020) and the most likely numbers of clusters (K) was estimated according to Pritchard et al. (2000) and Evanno et al. (2005) [37,38]. Graphics were displayed in the DISTRUCT program [39].
We also performed AMOVA analysis by pooling all the three oaks as the same species samples, and three specific analyses considering separately species that were identified with the analysis in ARLEQUIN v3.11 [40]. Pairwise FST was used to assess population differentiation within and among species and populations [41].
Pairwise genetic distance among populations based on the 16 nSSR data set was calculated using the Nei’s (1972) genetic distance (Ds) [42]. Additionally, then we converted the distance matrices into UPGMA (unweighted pair-group method using arithmetic average) dendrograms (after 1000 bootstrap replicates) employing the program Populations v1.2.32 [43] and Tree View v.1.6 [44]. The principal coordinates analysis (PCoA) was also conducted in GENALEX v6.5 [36].
In order to infer historical gene flow (Nm) patterns, we used a maximum likelihood procedure and a Brownian motion microsatellite model in MIGRATE-N v3.6 [45] to estimate the effective population sizes (θ) and mutation scaled immigration (M) among the groups with 10 short chains following 5000 steps and three long chains of 50,000 iterations, sampling every 100 steps under a constant mutation model and discarding the first 10,000 records as a burn-in. In addition, to assess patterns of recent migration, we also estimated inter-species migration rates using a Bayesian approach in BAYESASS v3.0 [46].

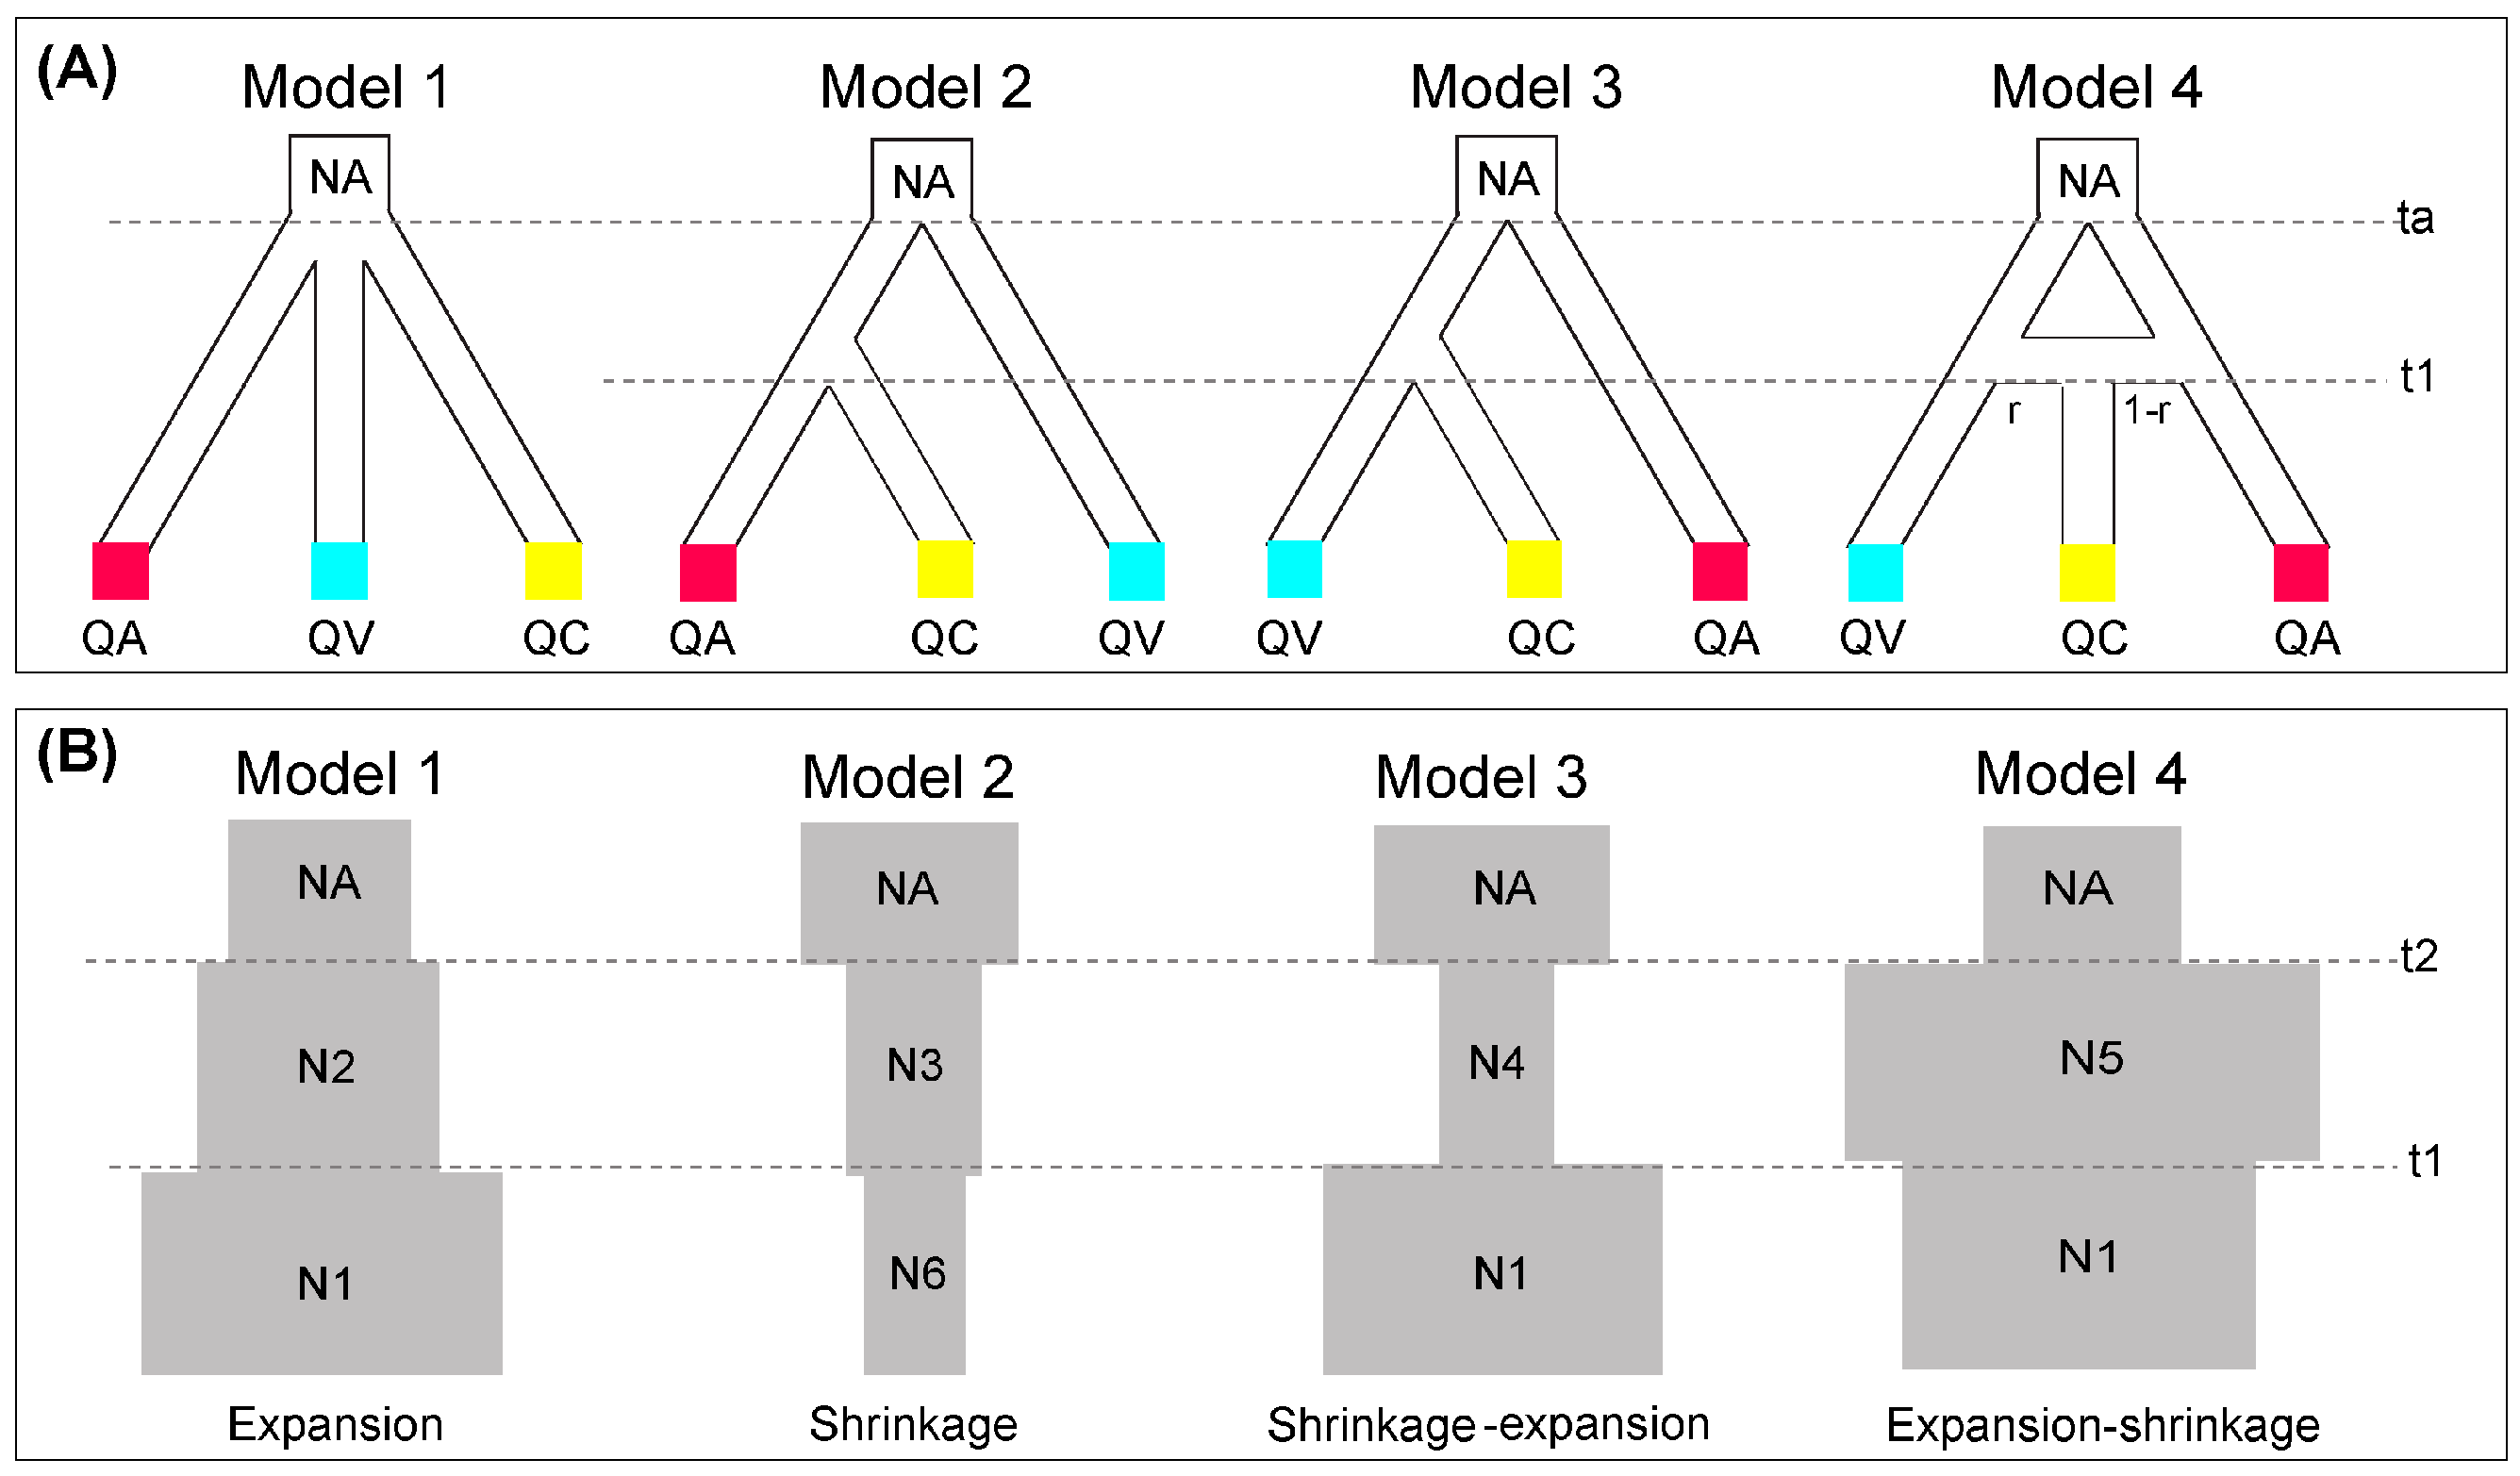
2.4. Species Divergence and Demographic History

To estimate plausible of divergence and populations dynamics of the three closely oak species, Approximate Bayesian Computation (ABC) analysis was performed in software DIYABC v2.0.4 [47]. Four possible historical divergence scenarios for these three oak species were built by the DIYABC (Figure 2A). The model 1 consisted of a simultaneous divergence of these three oak species (QA: Q. acutissima, QV: Q. variabilis and QC: Q. chenii). The differences between model 2 and model 3 was that QC derived from QA or QV, respectively. The model 4 was considered to be admixture model that QC was hypothesized to be the admixture of QA and QV. We ran ABC analysis with 1,000,000 simulations for each model. To identify the most likely divergence scenario, the posterior probability of model was assessed using a logistic regression on the 1% of the stimulated data sets closest to the observed data and estimated the relative posterior probability (PP) with 95% confidence intervals (95% CI) for each model. We also assess confidence in power model by estimating type I and type II error rates with 500 pseudo-observed data sets (PODs) under each scenario. The performance of parameter estimation was determined by calculating the median of the relative median of absolute errors (RAME) using 500 PODs. We also applied a principal component analysis (PCA) for checking model and visualize the fit between simulated and observed data sets. In addition, DIYABC was used to simulate and examine the effective population sizes of each species. We separately tested the four scenarios of demographic changes for the three oak species: continuous expansion, continuous shrinkage, shrinkage-expansion, and expansion-shrinkage (Figure 2B). The prior distributions of demographic parameters were listed in Tables S3 and S4.
To test the recent dynamics of effective population size (bottle-necks), we tested the genetic bottleneck among all populations in software BOTTLENECK v1.2.02 [48]. We used the Wilcoxon signed-rank necks under the infinite allele model (IAM) and the stepwise mutation model (SMM) [49].

2.5. Niche Comparison Analyses on Geographic Space (G-Space) Environment Space (E-Space)

In order to capture ecological differences of three oak species, we conducted comparative analysis in both geographic (G) and environment (E) space for the three oaks, these two types of niche analyses would complement each other in the niche comparison analyses [50]. Historical shifts in geographic distribution across different times, including the Last Interglacial (LIG, ~130 Ka), Last Glacial Maximum (LGM, ~22 Ka) and present, which were performed in the MAXENT v3.4.1 [51]. In these analyses, we selected 14 bioclimatic factors according to the previous studies (Table S5) [21,22,24]. Climatic variables at 2.5 arc-min resolution were obtained from the WorldClim database (http://www.worldclim.org/) (accessed on 1 July 2019). In order to estimate the suitable area gains and losses (or unchanged areas) for past scenario with present, the overlapped areas were predicted using Intersect tool of ArcGIS v. 10.2 (ESRI, Redlands, CA, USA).
In addition, to measure ecological differences between each pair of species, we used the ENMTOOLS v1.3 [52] to calculate two alternative statistics: I and D [52,53], which range from 0 (no overlap) to 1 (complete overlap). To test the null hypothesis that these three oak species have identical environmental space, we used the niche identity test initially introduced by Warren et al. (2008) [52]. In this test, we compared the overlap of a species pair’s actual niches to the distribution of niche overlaps obtained from pairs of pseudoniches (n = 100 pseudoreplicates) (see [52]).
To assess the degree of the niche overlap, we first assessed ENMs in spatial environment using the principal components analysis (PCA; hereafter standard PCA) to examine the climatic variability of the realized niches in the genetically studied populations across the total climatic space. A simple agglomerative hierarchical clustering method (UPGMA) was conducted based on the means of the principal component (PC). After that, following the approach developed by Broennimann et al. [54], and the R script from Herrando-Moraira et al. [55], the PCA was used to translate occurrences and climate data into environment axes (PCA-env), and densities of points in multidimensional E space were used to test the niche overlap among these three oak species, and calculated the D statistics.

3. Results

3.1. Genetic Diversity

The genetic diversity indexes for each locus were summarized in Tables S6 and S7. The values of Ho were much lower than HE (Table S1), and these three oak species have different degrees of deviation from HWE in most populations (Table S8), which were associated with excess of homozygous caused by inbreeding or mating among relatives (Table S1). In addition, these populations SPU, SPg, SPI and SPWS of Q. variabilis, E, J. HF, CY, P, YS, YK and PS of Q. acutissima (Table S1) had higher genetic diversity, and most of them were located in Yunnan–Guizhou Plateau (e.g., SPU/E), Qinling mountains (e.g., SPg/J, SPWS) and Nanling mountains (e.g., YS, PS).

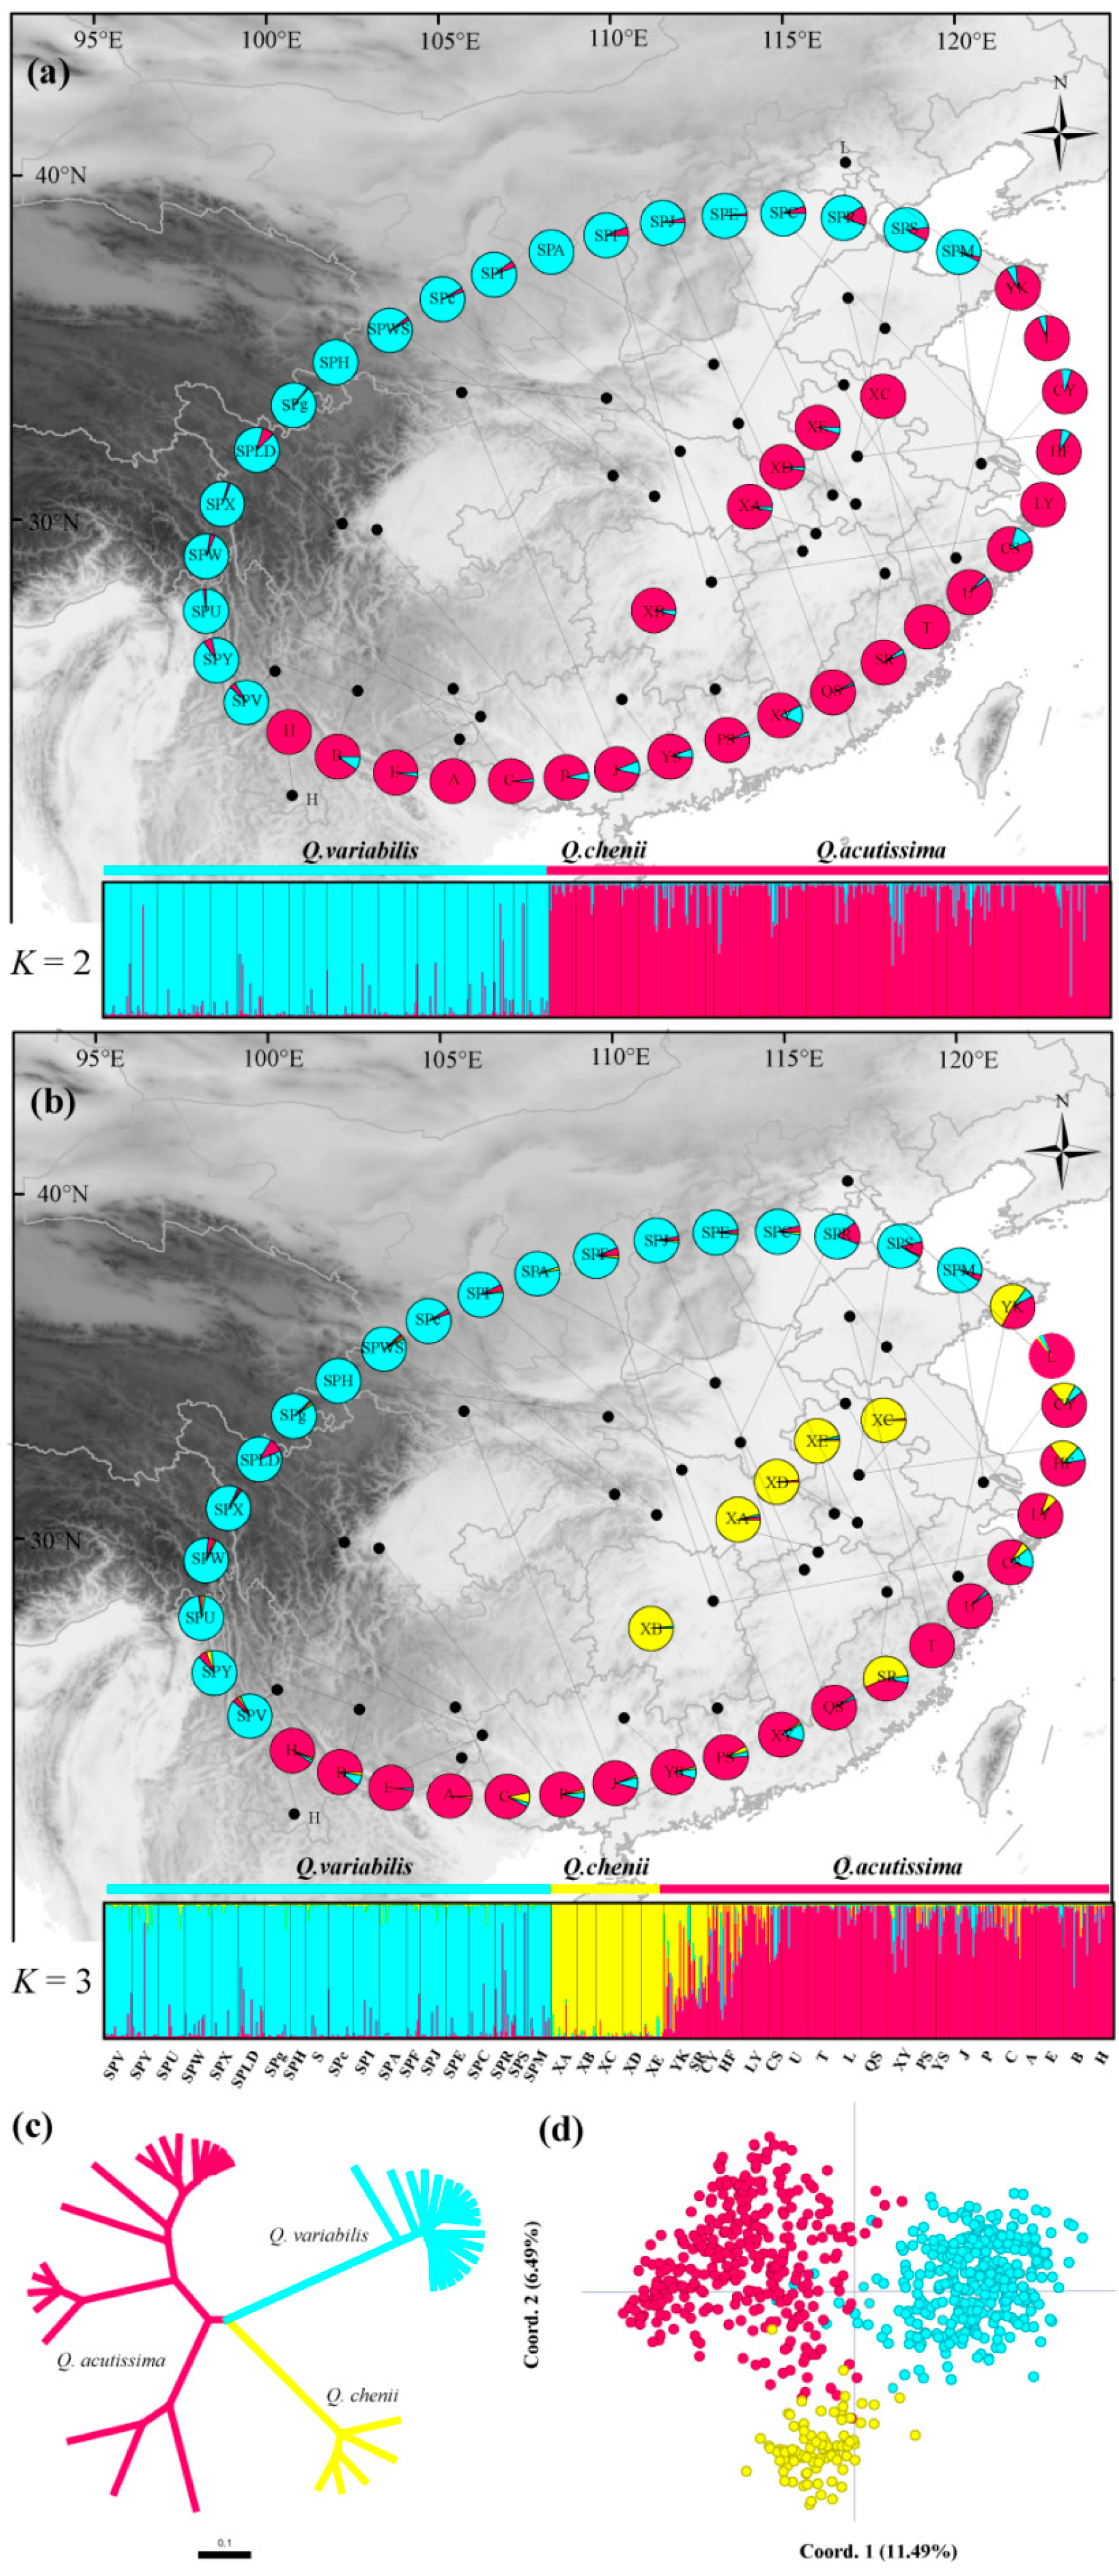
3.2. Genetic Differentiation and Structure Analysis

The AMOVA analysis detected significant genetic differentiation among the three species groups (FCT = 0.195, p < 0.001), but only 19.52% of the genetic variation was partitioned. At the species level, genetic variation mainly occurred within populations (91.03%, 78.63% and 94.55%, FST = 0.090, 0.214 and 0.055, respectively) with all FST values having highly significant estimations (p < 0.001) (Table 1).
According to the STRUCTURE analysis, the results of the ΔK method suggested that the genetic structure of the three Cerris oak species can be explained by two genetic clusters (Figure S1). The populations of Q. acutissima and Q. chenii formed one group, whereas the other cluster comprised all populations from Q. variabilis, and both groups seemed to be mixed with a little gene flow (Figure 1a). When K = 3, the former group was further subdivided, as Q. acutissima and Q. chenii (Figure 1b). Meanwhile, we detected a shared signal of genetic components between Q. acutissima and Q. chenii populations (Figure 1b). Subsequent hierarchical analyses within Q. acutissima and Q. variabilis (except for Q. chenii, due to the limited populations) showed a further genetic subdivision (Figure S2).
The UPGMA dendrograms based on Nei’s (1972) genetic distance (Ds) suggested that the three closely related oak species were completely separated (Figure 1c). A similar result was obtained in the PCoA analysis (Figure 1d), where three obviously differentiated groups (Q. variabilis, Q. acutissima and Q. chenii) were found with few individuals mixed among the three species.

3.3. Genetic Migration among Species

The BAYESASS analysis detected recent but very low levels of genetic migration from Q. acutissima to Q. chenii (m = 0.024) and from Q. chenii to Q. acutissima (m = 0.004), Q. acutissima to Q. variabilis (m = 0.001) and from variabilis to Q. acutissima (m = 0.002) (Table S9). In addition, the Migrate-n analysis identified historical asymmetric gene flow (Nm) among the three oak species, with greater Nm between Q. acutissima and Q. variabilis (Table 2).

3.4. Demographic History

In the approximate Bayesian computation (ABC) analysis, the posterior probability for model 2 (with 95% CI) was 0.4747 (0.4128–0.5366), much higher than the posterior estimations for the model 1 (0.1645; 95% CI: 0.1057–0.2232), model 3 (0.0664; 95% CI: 0.0074–0.1254) and model 4 (0.2944; 95% CI: 0.2225–0.3664) (Figure 2A and Figure S3, Table S10). The confidence of the scenario selection based on 500 pseudo-observed data sets indicated that type I and type II errors were low for the best supported model 2 (Table S10). The RMAE values for most of parameters were also low (<0.20), which indicated that the posterior parameter obtained in the ABC simulation was reliable (Table 3, Figure S5). The best demographic model (model 2) indicated that Q. variabilis and Q. acutissima populations initially split from their most common ancestor and then Q. chenii split from Q. acutissima. The estimated median times of divergence between Q. variabilis and Q. acutissima (ta), and Q. chenii generated from Q. acutissima (t1) were 2.48 × 10⁵ (95% CI = 2.03–2.97 × 10⁵) and 1.2 × 10⁵ (95% CI = 6.34 × 10⁴ to 1.91 × 10⁵) generations ago, respectively (Table 3). We used a generation time of 80 years according to previous study on Quercus species [56], and the divergence times for ta and t1 were corresponded to 19.84 Ma (95% CI = 16.24–23.76 Ma) and 9.6 Ma (95% CI = 5.07–15.2 Ma), respectively. In addition, the median values of the effective population sizes of Q. variabilis, Q. acutissima and Q. chenii were 5.52 × 10⁵, 4.45 × 10⁵ and 8.78 × 10⁵, respectively. Whereas NA (ancestral population) was 7.14 × 10⁴, which suggested these three oak species had experienced expansion after interspecific differentiation (Table 3).
For the population demography model simulations, Q. variabilis fitted the contraction-expansion model, with posterior probability 0.5177 (95% CI = 0.5108–0.5246), Q. acutissima and Q. chenii fitted the continuous expansion and expansion-contraction model, with posterior probability 0.6182 (95% CI = 0.5982–0.6382) and 0.3321 (95% CI = 0.3257–0.3386), respectively (Figure 2B, Figures S6 and S7, Table S4). Q. variabilis contracted during 1.19 × 10⁴ generations ago or at about 952 ka and then expanded 2.32 × 10³ generations at about 185.6 ka. Q. chenii expanded during 4.02 × 10³ generations at 321 ka, and contracted 1.25 × 10³ generations at 120 ka. Q. acutissima experienced continuous expansion from 8.21 × 10³ at 656.8 ka, and further expanded around 0.42 Ma (Figure 2B, Figures S6 and S7, Table S4).
Under the TPM model and the SMM model in the BOTTLENECK, the Wilcoxon’s signed rank test revealed population SPF, belonged to the Q. variabilis and CY, YS belonged to the Q. acutissima had undergone possible bottleneck effect (Table S11).

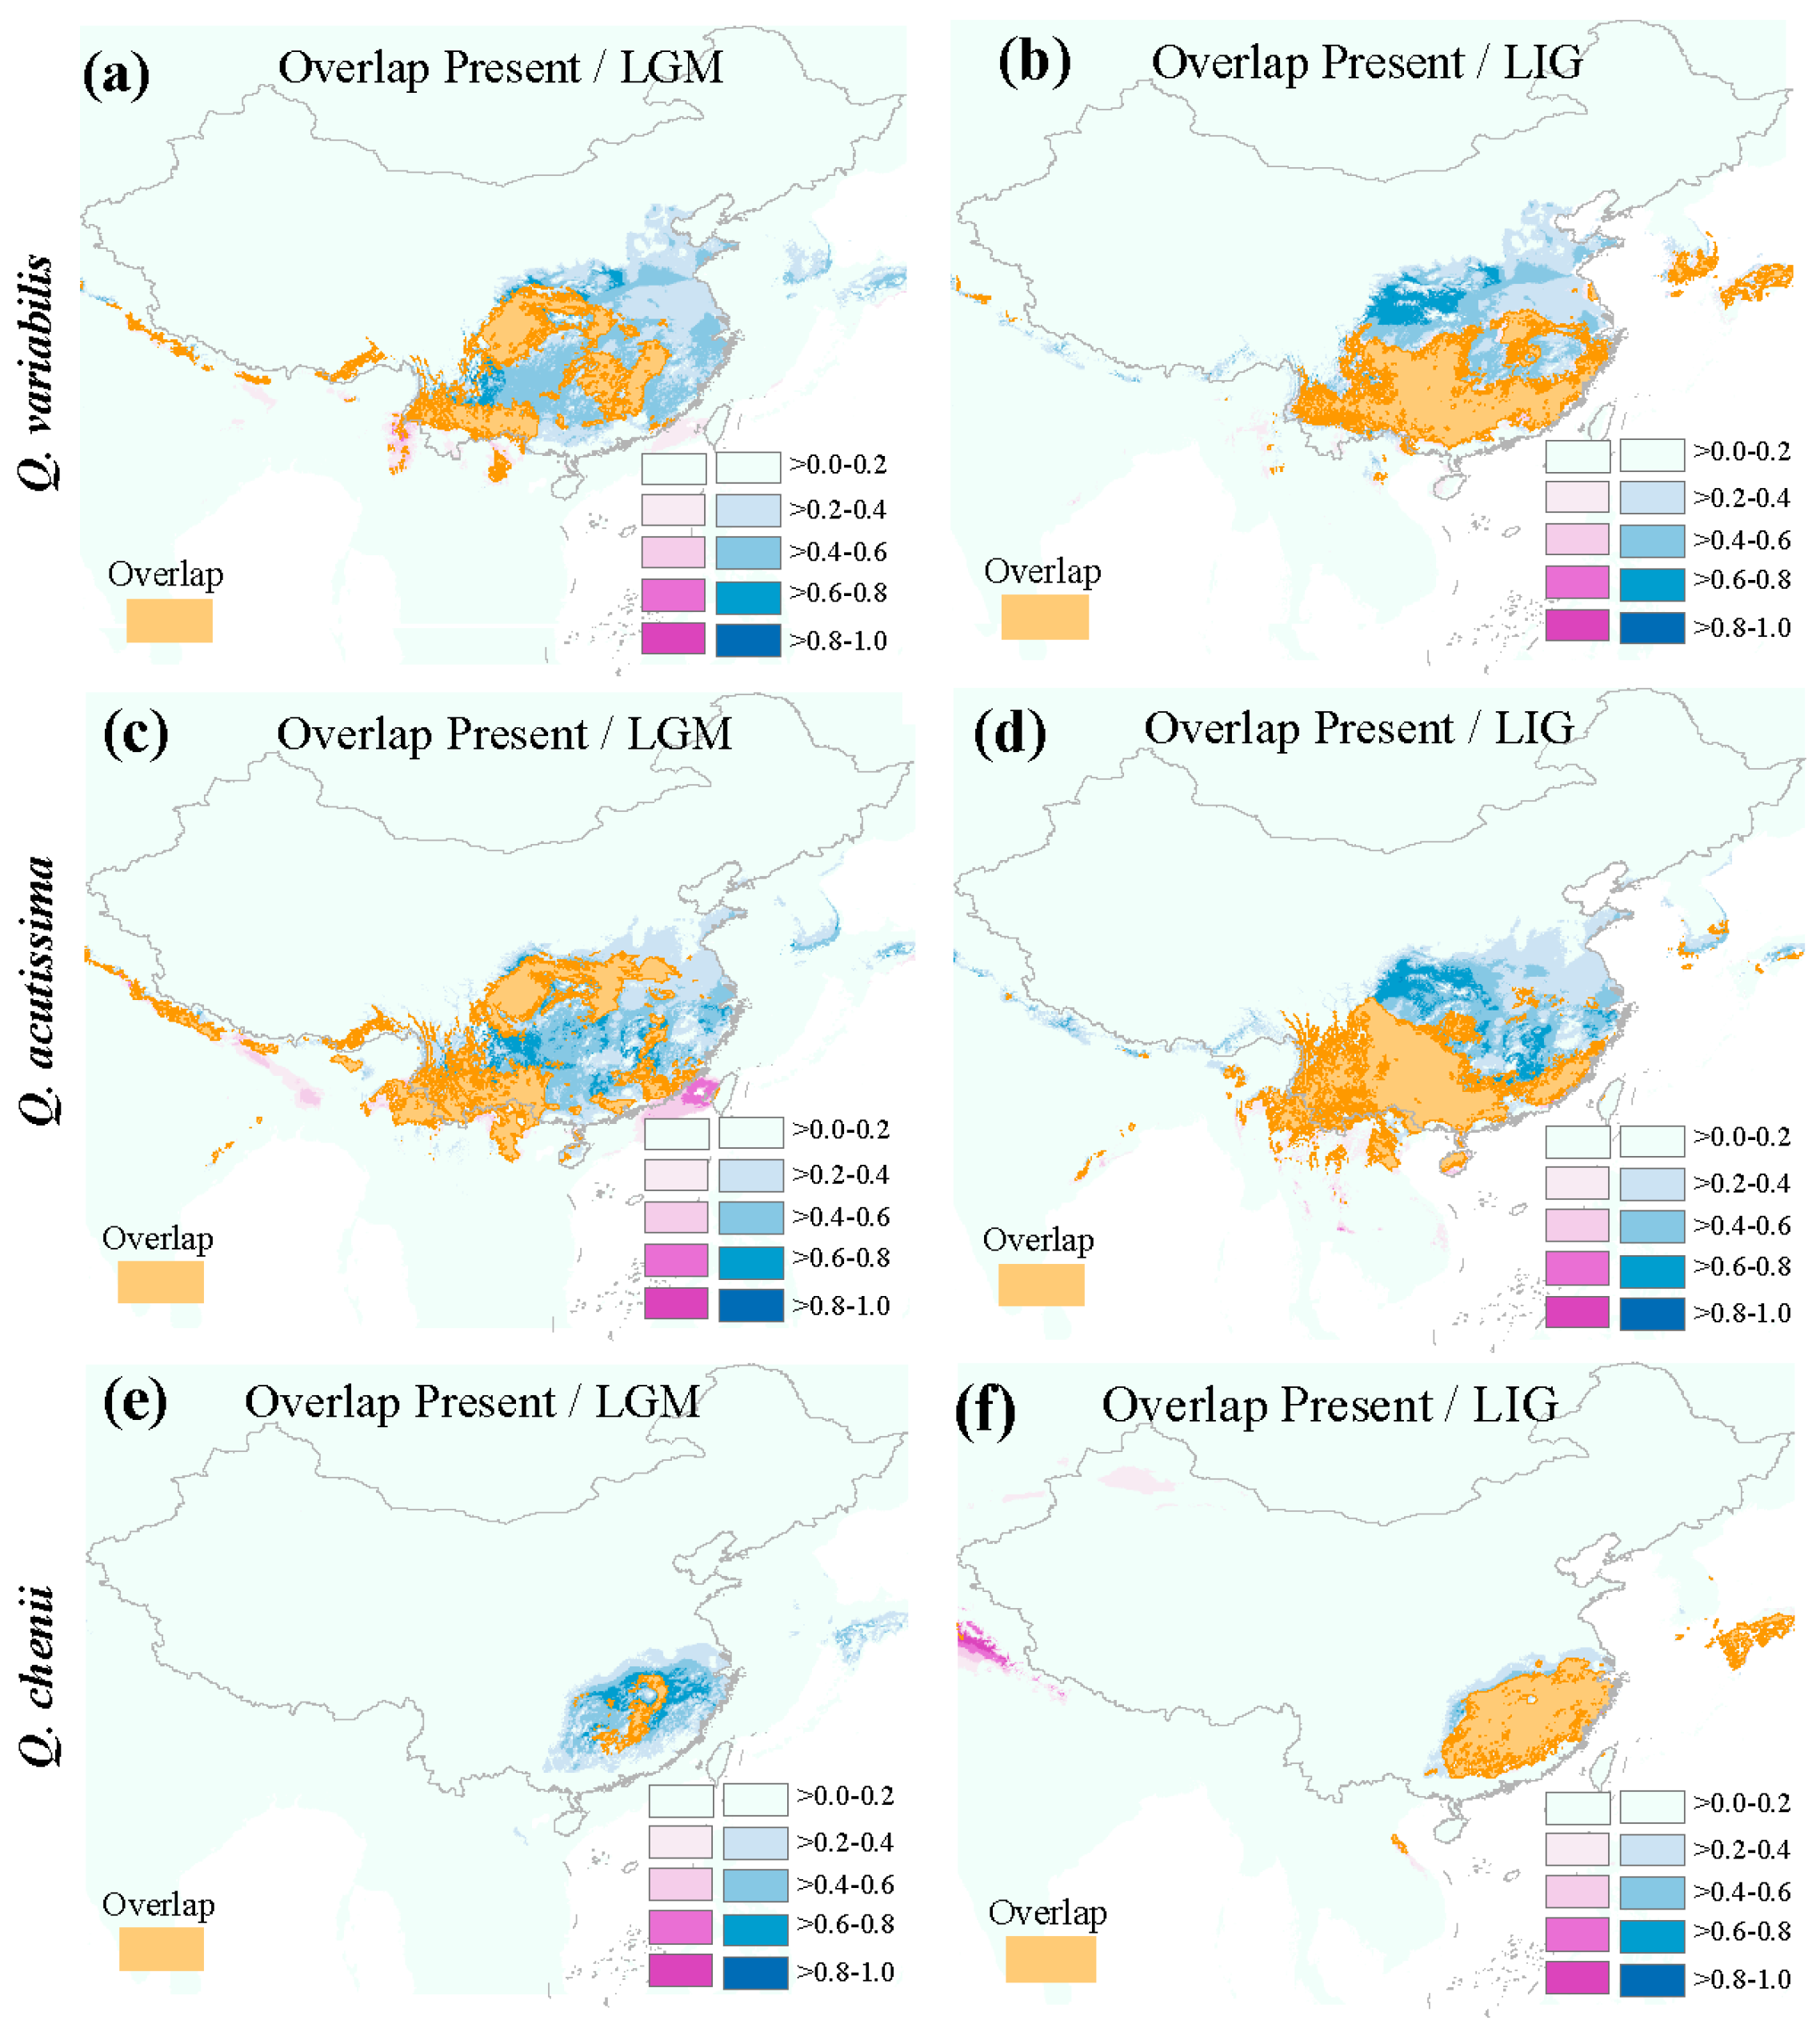
3.5. Ecological Niche Modeling

All ENM simulations had high AUC values (>0.85) and predicted well for current species distributions for the three oak species (Figure S8a–i). The projected distributions into past environments suggested that the distribution ranges of the three related species contracted during the LGM periods, whereas with considerable expansion at present, and these three oak species’ distributions were more restricted during the LGM than at LIG (Figure S8a–i and Figure 3a–f). It is also remarkable the isolated distribution of Q. chenii during the LIG and LGM, showed very little range overlap with Q. variabilis and Q. acutissima (Figure 3). In addition, all ENMs indicated that the predicated distributions of Q. variabilis and Q. acutissima were considerably overlapped during three periods (Figure S8 and Figure 3).
The identity test in ENMTOOLs showed high observed overlap values for I and D in paired analyses of Q. variabilis vs. Q. acutissima (D = 0.803; I = 0.953) (Figure S8j). However, the empirically observed values for I and D were much lower than those expected from pseudoreplicated data set in Q. acutissima vs. Q. chenii and Q. variabilis vs. Q. chenii (D = 0.389, I = 0.678; D = 0.406, I = 0.698), respectively (Figure S8k,l).
According to a standard PCA analysis, the first three principal components accounted for 67.87% of the total climatic variation (PC1 = 40.50%, PC2 = 27.37%) (Figure S9A). The first principal component (PC1) was mainly explained by BIO 17 (Precipitation of the driest quarter), and the second (PC2) was explained by BIO 4 (Temperature seasonality) (Figure S9A). According to the PCA-env analysis, the first two axes explained 75.23% of total variation in the climatic conditions across the population distributions of the three oak species (PC1 = 49.46% and PC2 = 25.77%), where the first component (PC1) was mainly explained by BIO 1 (Annual precipitation) and the second was explained by BIO 10 (Mean temperature of the warmest quarter) (Figures S9B,C and S10). Multiple niche plots for the 20% occurrence density showed that Q. variabilis and Q. acutissima shared their climate niche to a great extent (Figure S8B). The occurrence density of 100% plotted points in the PCA-env space showed similar results with 20% of the occurrence density (Figure S9B,C). Besides, ecological niche revealed differentiation between Q. chenii and Q. variabilis/Q. acutissima (Figure S9B,C). The overlap D values between Q. variabilis and Q. acutissima was relatively high (D = 0.687); however, the generally low overlap D values were found between Q. variabilis/Q. acutissima and Q. chenii (D = 0.025; D = 0.038).

4. Discussion

4.1. Species Divergence

Accumulating evidence has shown that the tectonic-climatic interactions since the Miocene have significantly contributed to the evolutionary process of plant species in East Asia [24,57,58]. By using population-genetic data obtained from nuclear loci, our Bayesian clustering analysis results indicated that Q. chenii and Q. acutissima were closely related (K = 2), Q. acutissima and Q. chenii were clustered in the same group, whereas the Q. variabilis formed its own genetic cluster; when K = 3, Q. acutissima and Q. chenii were split into different clusters, with some individuals of these two species behave as mosaics (Figure 1a,b). The PCoA and UPGMA results also indicated that there were three genetic groups, which highly consistent with the Bayesian clustering analysis (Figure 1c,d). Furthermore, the scenario of ancient divergence was strongly supported by the model 2 in the approximate Bayesian computation analysis (Table S10, Figure S3). Assuming an average generation time of 80 years for Quercus species, Q. variabilis and Q. acutissima was inferred to have diverged from a most common ancestor around 19.84 Ma (95% CI: 16.24–23.76), whereas Q. chenii diverged from Q. acutissima at about 9.6 Ma (95% CI: 5.07–15.20 Ma) (Figure 2A, Table 3). A recent molecular dating based on chloroplast-nuclear data matrix showed that these three Cerris oaks had initially diverged around 24.56 Ma [59], to some extent, it was earlier than our molecular dating (~19.84 Ma) using the nuclear microsatellite data, whereas the 95% HPD were relatively identical (18.47–30.44 Ma for chloroplast-nuclear data matrix and 16.24–23.76 Ma for present study). In addition, the divergence of Q. chenii (9.6 Ma, 95% CI: 5.07–15.20 Ma) is comparable with previous estimates for chloroplast DNA haplotypes (11.63–6.21Ma) [24]. Although we must be cautious when regarding the results of molecular dating, these divergence times consistent with the first fruit specimen of Quercus belonging to the Cerris group found in the middle Miocene deposits in Shanwang, China [28]. Our analyses indicated that the divergence of the East Asia Cerris oaks took place in the Miocene (including divergence time among Q. variabilis and Q. acutissima at 19.84 Ma, divergence of Q. chenii around 9.6 Ma), which coincided with a period of intense uplift of the Hengduan Mountain massif. It has been recognized that the QTP uplifting began around 40 Ma, and more extensive uplifts further occurred at 20–22 Ma, followed by several additional uplifts during the Miocene [60,61,62,63,64]. Such geological changes may have produced many small fragmented habitats with different microclimates, thereby impacting the direction of natural selection [65]. Indeed, the rise of the QTP has dramatically modified the global and East Asian climate by triggering and intensifying the Asian monsoon. These new climatic conditions and heterogeneity environment would promote the species differentiation. An association between Miocene uplift of QTP and interspecific/intraspecific divergence time has previously been noted for other studies of tree, shrub and herb, such as Myricaria (~20 Ma) [66], Cyclocarya paliurus (~16.69 Ma) [57] and Notopterygium (~10.90 Ma) [67]. In addition, the niche overlap analysis showed a remarkable niche differentiation among Q. chenii and Q. variabilis/Q. acutissima by the identity test (D = 0.406, I = 0.698; D = 0.389, I = 0.678) and E-space analyses (D = 0.025, D = 0.038) (Figures S8k,l and S9). Ecological niche partitioning would have reinforced the divergence of the lineages following initial spatial isolation and might bring differentiated adaptability to their respective environmental conditions [68]. Furthermore, geographical isolation and environmental heterogeneity also have the impact on the genetic differentiation of other Quercus species, such as three alpine sclerophyllous oaks (Q. aquifolioides, Q. spinosa and Q. rehderiana) [69] and Californian scrub white oak species (Q. berberidifolia and Q. durata) [8]. In fact, our G-space analysis indicated that the potential distributions of Q. chenii were significantly differ from the other two oak species during the LIG and LGM (Figure S8d–f and Figure 3). However, the E-space and G-space analyses (Figures S8 and S9) could not meticulously tease apart geographic isolation signals of potential distribution and particular niche possession for the two related species Q. variabilis and Q. acutissima (e.g., Figure S8a,b,d,e,j), which probably reflects multiple factors that jointly promote genetic differentiation among the three closely related taxa during the early stage of species formation. Therefore, we still need to use genetic makers derived high throughout sequencing and available bioclimatic models to address in more detailed environmental selection and divergent adaptation of these related Cerris oak species in the future.
BAYESASS and Migrate-N analysis provided unambiguous evidences of the interspecific bidirectional asymmetric gene flow among the three oak species (Table 2 and Table S9). The historical gene flow from Q. acutissima and Q. variabilis to Q. chenii was lower than that from Q. chenii to Q. acutissima and Q. variabilis (Table 2). In contrast, the contemporary gene flow from Q. acutissima to Q. chenii was higher than that in the opposite direction (Table S9). This pattern might be explained by the fact that Q. acutissima and Q. variabilis were the earliest differentiated species, and Q. chenii was the most recently diverged species. In addition, oak species were paraded as typical examples of the intricate concept of biological species due to their high potential for interspecies introgression. Simultaneously, oak species usually brought difficulties to the phylogenetic tree inference (e.g., [16,70]). In our studies, the Bayesian clustering analysis also have shown considerable rates of hybridization among the three related species (Figure 1a,b). The appearance of introgression was commonly detected in regions of sympatry/parapatry among related species, as is well exemplified in the codistributed populations of Q. berberidifolia and Q. Cornelius-mulleri in southern California, and Q. berberidifolia and Q. durata in central-northern California [8,71]. Albeit some populations showed genetic hybridization (e.g., SPW, SPY, SPU, SPS, CS and CY), all the putative species basically maintain their taxonomic and keep lineages separated to a high degree (Figure 1a,b). Asynchronous flowering phenology or selection against hybrids with lower survivability or tending to parent environment might be contribution of maintaining the distinctness of three studied species in the presence of gene flow [8,72,73]. Furthermore, the climate seasonality (e.g., temperature and precipitation seasonality) as the most important ecological factors that might affect the phenology (including flowering time and growing season) [74,75]. In fact, these environmental variables detected in the E-space analysis, e.g., BIO 4 (temperature seasonality) BIO 10 (mean temperature of the warmest quarter) and BIO 17 (precipitation of the driest quarter), were considered as potential abiotic factors in triggering the genetic differentiation among the three oak species (Figure S9). In addition, our analyses also indicated a delicate intraspecific genetic structure of Q. acutissima and Q. variabilis across their main distribution areas (Figure S2), similar to previous studies that suggested genetic subdivision in these two species and other oak species [21,23,25,76]. Therefore, these results suggested that widespread gene flow in the wind-pollinated oak trees is a remarkable homogenizing factor within species, while selection against hybrids or assortative mating might plausibly prevent the three closely related species from converging into mosaic/hybrid regions [8,72].

4.2. Demographic History

It is generally assumed that plant species have experienced important distributional shifts driven by glacial-interglacial cycles during the Pleistocene [77,78]. The current ABC simulations of population-genetic data indicated that Q. variabilis has experienced an earlier population contraction (~0.95 Ma), followed by a recent population expansion (~0.19 Ma) (Figure 2B, Table S4). Such demographic events could be linked to the glacial/interglacial recorded in the QTP, and the most severe glaciation on the QTP reached its maximum between 0.8 and 0.6 Ma when the ice sheet is thought to have covered an area five to seven larger areas than it does today [79]. In fact, the uplift of the QTP might have caused habitat disruption, and the unfavorable environment might lead to extinction of some populations while producing population contraction for others [67]. In terms of the recent population expansion models, previous studies found that the antepenultimate interglacial period and the last interglacial period took place between 0.5 and 0.3 Ma, and between 0.14 and 0.12 Ma, respectively [80]. Besides, the ABC analysis suggested that Q. chenii experienced a population expansion around 0.32 to 0.12 Ma (Table S4). Indeed, the results of our ENM analysis indicated that Q. chenii and Q. variabilis expanded their ranges in the relatively warm interglacial period (~0.14–0.12 Ma) and distribution shrank in the cold LGM (~22 Ka) (Figure 3d,f,g,i). In addition, the expansion of Q. acutissima began at 0.66 Ma and the further expansion in the range of this species occurred around 0.42 Ma (Table S4). This period comprises several interglacial intervals in the middle Pleistocene, which is an extra-long interglacial period may have persisted throughout the Marine isotope stages (MISs) 15–13 (0.62–0.48 Ma) [81]. It was reported that southern Loess Plateau was likely under a subtropical semi-humid climate in MIS 13, with an annual mean temperature at least 4–6 °C higher and annual rainfall 200–300 mm higher than at present [23,82]. Moreover, the temperature and precipitation are especially important for plant species like other Quercus species that dwells in the northern region of the subtropical China [24,76]. Recently, Zhang et al. (2018) reported that an intraspecific admixture event of Q. acutissima is the causes for expansion from refugia into the mountainous area of central China occurred about 0.69 Ma, implying that the warm and humid climate triggered the genetic admixture along with the duration of recolonization [23]. Moreover, the ENM results suggested that this species was also predicated to have undergone a range contraction during the last glacial periods (Figure 3a,c,e). Overall, our findings highlight that the importance of climatic oscillations at the Pleistocene, had a remarkable effect on the distribution of the three Cerris oaks and supported the ‘contraction–expansion’ scenario usually reported in other deciduous oak species (e.g., [75,83]) in China.
In addition, our present study suggested that Q. acutissima and Q. variabilis were likely to expand from multiple glacial refugia after LGM (~22 Ka), in Qinling mountains and Yungui Plateau (Figure 3a,c), while Q. chenii survived in the mountainous areas in East China (Figure 3e). In fact, mountains have often served as refugia for many species distributed in the temperate and tropical regions of the world, because the diverse topography of mountains may offer a wide array of climatic and edaphic conditions, even in the harshest periods (e.g., glacial periods of the Pleistocene) [84]. Nuclear microsatellite data in our study revealed several populations (SPU/E, SPg/J, SPWS) located in these regions possessed high genetic diversity (Table S1). Besides, Palaeovegetation reconstructions of the LGM period supported a hypothesis that trees might have similar refugia in the cold periods [21,22]. Hence, our inference strengthened this view and confirmed that tree species might have persisted in multiple refugium located at subtropical and warm temperature zones in China. Strikingly, such tree species have been isolated for a long time among multiple habitats within the mountains area; these aspects might further promote the genetic differentiation among lineages. Meanwhile, our results also indicated that a probable scenario of interspecific introgression due to the shared refugium and/or secondary contact when expanded from the refugium in the warm periods (Figure 3a,c,e).

5. Conclusions

The results of our study on clearly indicated that evolution and demography of three East Asia Cerris oak species (Q. acutissima, Q. variabilis and Q. chenii) was strongly influenced by the topography change and climate oscillation during the Miocene–Pliocene and Pleistocene. Furthermore, like other deciduous oak species in Eastern Asia (e.g., Q. fabri and Q. liaotungensis [75,83]), these three Cerris oak species in the Eastern Asia share a similar performance of ‘expansion–contraction’ in response to past climatic oscillations.

Supplementary Materials

The following are available online at https://www.mdpi.com/article/10.3390/f12091164/s1, Supporting Tables: Table S1. Genetic diversity of 44 populations of three Cerris oaks (Q. variabilis, Q. acutissima and Q. chenii) estimated based on 16 microsatellite loci; Table S2. Primer sequences and characterization of the 16 microsatellite loci used in this study; Table S3. Prior distributions for model parameters used in divergence model comparisons; Table S4. Posterior probability under logistic and descriptions of four scenarios, and prior setting for all parameters used in approximate Bayesian computation (ABC) for demographic analysis of three species (Figure 3b); Table S5. The 14 bioclimatic variables that were used in Ecological niche modeling; Table S6. Diversity indices of 16 EST-SSR loci for 759 individuals; Table S7. Diversity indices of 16 EST-SSR loci for three related species; Table S8 Hardy–Weinberg equilibrium (HWE) test in this study; Table S9. Estimation of rates of contemporary gene flow per generation among three species (QV, QA and QC) using the programs BAYESASS v3.0; Table S10. Posterior probability of each scenario and 95% confidence intervals (CI) based on the logistic regression approach for approximate Bayesian computation analyses (ABC) for all three related species (Q. acutissima, Q. variabilis and Q. chenii). Type I and type II errors for the best supported scenario (in bold) are indicated; Table S11. Indices of bottleneck test of the three related species. Supporting figures; Figure S1. Bayesian inference analysis of 16 EST-SSR data determining the most likely number of clusters (K) for three Cerris oaks (Q. variabili, Q. acutissima and Q. chenii). The distribution of the likelihood L(K) values (a) and DeltaK values (b) are presented for K = 1–8 (10 replicates); Figure S2. Bayesian inference analysis of nuclear data for Q. variabili and Q. acutissima separately, STRUCTURE plots are presented for K = 2.; Figure S3. Comparison of posterior probabilities for four simulated scenarios of species differentiation obtained by logistic regression from 1% of the closest data set in DIYABC; Figure S4 Principal component analysis results obtained along the first three axes for the pre-evaluate models and prior distributions of three oak species divergence in DIYABC; Figure S5. Model checking in DIYABC for the best-supported (species divergence: model 2); Figure S6. Principal component analysis results obtained along the first three axes for the pre-evaluate models and prior distributions of three oak species demographic models in DIYABC. (a–c) representing the species of Q. variabilis, Q. acutissima, and Q. chenii, respectively; Figure S7. Model checking in DIYABC for the best-supported demographic models; Figure S8. Predicted distributions of Q. variabilis (a,d,j), Q. chenii (b,e,h) and Q. acutissima (c,f,i) based on ecological niche modelling using Maxent. Predicted distributions are shown for the present time (a–c), LGM (d–f), and LIG distribution (g–i). The results of identity tests (j–l). Bar indicate the null distributions of D and I. Both are generated from 100 randomizations. x-axis indicates values of I and D and y-axis indicates number of randomizations. Red and green solid line indicates values in actual Maxent runs; Figure S9. (A) Standard principal component analysis (PCA) performed with climatic values for three Cerris oaks populations. (B) Climatic space constructed over all background areas and actual niches of all populations in this study, where the solid line represents an occurrence density of 20%, and (C) an occurrence density of 100% is denoted by the thin line and 100% of available climatic background by the thick line; Figure S10. Contribution of each environmental variable to spatial distribution of the PCA-env.

Author Contributions

Conceptualization, X.-D.C., J.Y. and G.-F.Z. Resource and Data Curation, X.-D.C., X.Z., H.Z. and Y.-M.Z. Formal Analysis and Validation, J.Y., X.Z., T.Z. and G.-F.Z. Writing, X.-D.C., X.Z. and G.-F.Z. All authors have read and agreed to the published version of the manuscript.

Funding

This study was financially supported by the National Natural Science Foundation of China (31770229, 31901077, 31900273), the Project funded by China Postdoctoral Science Foundation (2018M641011), the Shaanxi Postdoctoral Science Foundation and the Natural Science Basic Research Program of Shaanxi (No. 2019JQ-718).

Data Availability Statement

The original data can be found here: https://datadryad.org/stash/share/t5xAUh9K8LFnV2ZzTc-U6P1Grj--uKRPBA3bGbJaUV8, (accessed on 26 August 2021).

Conflicts of Interest

The authors have no conflicting interests.

References

  1. Hewitt, G. The genetic legacy of the quaternary ice ages. Nature 2000, 405, 907–913. [Google Scholar] [CrossRef]
  2. Slatkin, M.; Excoffier, L. Serial Founder effects during range expansion: A Spatial Analog of Genetic Drift. Genetics 2012, 191, 171–181. [Google Scholar] [CrossRef] [Green Version]
  3. Lafontaine, G.D.; Napier, J.D.; Petit, R.J.; Feng, S.H. Invoking adaptation to decipher the genetic legacy of past climate change. Ecology 2018, 99, 1530–1546. [Google Scholar] [CrossRef] [PubMed]
  4. IPCC. Climate Change 2013: The Physical Science Basis. Contribution of Working Group I to the Fifth Assessment Report of the Intergovernmental Panel on Climate Change; Cambridge University Press: Cambridge, UK, 2013. [Google Scholar]
  5. Calsbeek, R.; Thompson, J.N.; Richardson, J.E. Patterns of molecular evolution and diversification in a biodiversity hotspot: The California Floristic Province. Mol. Ecol. 2003, 11, 1021–1029. [Google Scholar] [CrossRef] [PubMed] [Green Version]
  6. Davis, E.B.; Koo, M.S.; Conroy, C.; Patton, J.L.; Moritz, C. The California Hotspots Project: Identifying regions of rapid diversification of mammals. Mol. Ecol. 2008, 17, 120–138. [Google Scholar] [CrossRef]
  7. Lancaster, L.T.; Kay, K.M. Origin and diversification of the California flora: Re-examining classic hypotheses with molecular phylogenies. Evolution 2013, 67, 1041–1054. [Google Scholar] [CrossRef]
  8. Ortego, J.; Noguerales, V.; Gugger, P.F.; Sork, V.L. Evolutionary and demographic history of the Californian scrub white oak species complex: An integrative approach. Mol. Ecol. 2015, 24, 6188–6208. [Google Scholar] [CrossRef] [Green Version]
  9. Hampe, A.; Jump, A.S. Climate relicts: Past, present, future. Annu. Rev. Ecol. Evol. S 2011, 42, 313–333. [Google Scholar] [CrossRef] [Green Version]
  10. Hoffmann, A.A.; Sgrò, C.M. Climate change and evolutionary adaptation. Nature 2011, 470, 479–485. [Google Scholar] [CrossRef] [PubMed]
  11. Marcott, S.A.; Shakun, J.D.; Clark, P.U.; Mix, A.C. A reconstruction of regional and global temperature for the past 11,300 years. Science 2013, 339, 1198–1201. [Google Scholar] [CrossRef] [PubMed] [Green Version]
  12. Kremer, A.; Hipp, A.L. Oaks: An evolutionary success story. New Phytol. 2020, 226, 987–1011. [Google Scholar] [CrossRef]
  13. Petit, R.J.; Bodénès, C.; Ducousso, A.; Roussel, G.; Kremer, A. Hybridization as a mechanism of invasion in oaks. New Phytol. 2004, 161, 151–164. [Google Scholar] [CrossRef] [Green Version]
  14. McVay, J.D.; Hipp, A.L.; Manos, P.S. A genetic legacy of introgression confounds phylogeny and biogeography in oaks. Proc. Biol. Sci. 2017, 284, 20170300. [Google Scholar] [CrossRef] [Green Version]
  15. Hipp, A.L.; Manos, P.S.; Hahn, M.; Avishai, M.; Bodénès, C.; Cavender-Bares, J.; Crowl, A.A.; Deng, M.; Denk, T.; Fitz-Gibbon, S.; et al. Genomic landscape of the global oak phylogeny. New Phytol. 2020, 226, 1198–1212. [Google Scholar] [CrossRef]
  16. Simeone, M.C.; Cardoni, S.; Piredda, R.; Imperatori, F.; Avishai, M.; Grimm, G.W.; Denk, T. Comparative systematics and phylogeography of Quercus Section Cerris in western Eurasia: Inferences from plastid and nuclear DNA variation. PeerJ 2018, 6, e5793. [Google Scholar] [CrossRef] [Green Version]
  17. Denk, T.; Grimm, G.W. Significance of pollen characteristics for infrageneric classification and phylogeny in Quercus (Fagaceae). Int. J. Plant Sci. 2009, 170, 926–940. [Google Scholar] [CrossRef]
  18. Denk, T.; Grimm, G.W. The oaks of western Eurasia: Traditional classifications and evidence from two nuclear markers. Taxon 2010, 59, 351–366. [Google Scholar] [CrossRef]
  19. Hubert, F.; Grimm, G.W.; Jousselin, E.; Berry, V.; Franc, A.; Kremer, A. Multiple nuclear genes stabilize the phylogenetic backbone of the genus Quercus. Syst. Biodivers. 2014, 12, 405–423. [Google Scholar] [CrossRef]
  20. Yang, Y.; Hu, Y.; Ren, T.; Sun, J.; Zhao, G. Remarkably conserved plastid genomes of Quercus group Cerris in China: Comparative and phylogenetic analyses. Nord. J. Bot. 2018, 36, e01921. [Google Scholar] [CrossRef]
  21. Chen, D.; Zhang, X.; Kang, H.; Sun, X.; Yin, S.; Du, H.; Liu, C. Phylogeography of Quercus variabilis based on chloroplast DNA sequence in East Asia: Multiple glacial refugia and mainland-migrated island populations. PLoS ONE 2012, 7, e47268. [Google Scholar] [CrossRef] [PubMed] [Green Version]
  22. Zhang, X.; Li, Y.; Liu, C.; Xia, T.; Zhang, Q.; Fang, Y. Phylogeography of the temperate tree species Quercus acutissima in China: Inferences from chloroplast DNA variations. Biochem. Syst. Ecol. 2015, 63, 190–197. [Google Scholar] [CrossRef]
  23. Zhang, X.W.; Li, Y.; Zhang, Q.; Fang, Y.M. Ancient east-west divergence, recent admixture, and multiple marginal refugia shape genetic structure of a widespread oak species (Quercus acutissima) in China. Tree Genet. Genomes 2018, 14, 88. [Google Scholar] [CrossRef]
  24. Li, Y.; Zhang, X.; Fang, Y. Landscape features and climatic forces shape the genetic structure and evolutionary history of an oak species (Quercus chenii) in East China. Front. Plant Sci. 2019, 10, 1060. [Google Scholar] [CrossRef]
  25. Gao, J.; Liu, Z.L.; Zhao, W.; Tomlinson, K.W.; Xia, S.W.; Zeng, Q.Y.; Wang, X.R.; Chen, J. Combined genotype and phenotype analyses reveal patterns of genomic adaptation to local environments in the subtropical oak Quercus acutissima. J. Syst. Evol. 2021, 59, 541–556. [Google Scholar] [CrossRef]
  26. Menitsky, Y.L. Oaks of Asia, Translated from Russian Science Publishers; Science Publishers, Inc.: Enfield, NH, USA; Plymouth, UK, 2005. [Google Scholar]
  27. Zhang, R.S.; Yang, J.; Hu, H.L.; Xia, R.X.; Li, Y.P.; Su, J.F.; Li, Q.; Liu, Y.Q.; Qin, L. A high level of chloroplast genome sequence variability in the Sawtooth Oak Quercus acutissima. Int. J. Biol. Macromol. 2020, 152, 340–348. [Google Scholar] [CrossRef]
  28. Song, S.Y.; Krajewska, K.; Wang, Y.F. The first occurrence of the Quercus section Cerris Spach fruits in the Miocene of China. Acta Palaeobot. 2000, 40, 153–163. [Google Scholar]
  29. Chun, W.; Huang, C. (Eds.) Flora Reipublicae Popularis Sinice; Science Press: Beijing, China, 1998; Volume 22. [Google Scholar]
  30. Papadopulos, A.S.; Baker, W.J.; Crayn, D.; Butlin, R.K.; Kynast, R.G.; Hutton, I.; Savolainen, V. Speciation with gene flow on Lord Howe Island. Proc. Natl. Acad. Sci. USA 2011, 108, 13188–13193. [Google Scholar] [CrossRef] [PubMed] [Green Version]
  31. Butlin, R.; Debelle, A.; Kerth, C.; Snook, R.R.; Beukeboom, L.W.; Castillo Cajas, R.; Diao, W.; Maan, M.E.; Paolucci, S.; Weissing, F.J.; et al. What do we need to know about speciation? Trends Ecol. Evol. 2012, 27, 27–39. [Google Scholar]
  32. You, F.M.; Huo, N.; Gu, Y.Q.; Luo, M.C.; Ma, Y.; Hane, D.; Lazo, G.R.; Dvorak, J.; Anderson, O.D. BatchPrimer3: A high throughput web application for PCR and sequencing primer design. BMC Bioinform. 2008, 9, 253. [Google Scholar] [CrossRef] [Green Version]
  33. Wang, X.; Li, J.; Li, Y. Isolation and characterization of microsatellite markers for an endemic tree in East Asia, Quercus variabilis (Fagaceae). Appl. Plant Sci. 2015, 3, 1500032. [Google Scholar] [CrossRef]
  34. Marshall, T.C.; Slate, J.; Kruuk, L.E.B.; Pemberton, J.M. Statistical confidence for likelihood-based paternity inference in natural populations. Mol. Ecol. 1998, 7, 639–655. [Google Scholar] [CrossRef] [Green Version]
  35. Goudet, J. FSTAT, a Program to Estimate and Test Gene Diversities and Fixation Indices (Version 2.9.3). Available online: http://www.unil.ch/izea/softwares/fstat.html (accessed on 24 July 2017).
  36. Peakall, R.; Smouse, P.E. GenAlEx 6.5: Genetic analysis in Excel. Population genetic software for teaching and research-an update. Bioinformatics 2012, 28, 2537–2539. [Google Scholar] [CrossRef] [Green Version]
  37. Pritchard, J.K.; Stephens, M.; Donnelly, P. Inference of population structure using multilocus genotype data. Genetics 2000, 155, 945–959. [Google Scholar] [CrossRef]
  38. Evanno, G.; Regnaut, S.; Goudet, J. Detecting the number of clusters of individuals using the software STRUCTURE: A simulation study. Mol. Ecol. 2005, 14, 2611–2620. [Google Scholar] [CrossRef] [PubMed] [Green Version]
  39. Rosenberg, N.A. DISTRUCT: A program for the graphical display of population structure. Mol. Ecol. Resour. 2004, 4, 137–138. [Google Scholar] [CrossRef]
  40. Excoffier, L.; Laval, G.; Schneider, S. Arlequin (version 3.0): An integrated software package for population genetics data analysis. Evol. Bioinform. 2005, 1, 47–50. [Google Scholar] [CrossRef] [Green Version]
  41. Excoffier, L.; Smouse, P.E.; Quattro, J.M. Analysis of molecular variance inferred from metric distances among DNA haplotypes: Application to human mitochondrial DNA restriction data. Genetics 1992, 131, 479–491. [Google Scholar] [CrossRef]
  42. Nei, M. Genetic distance between populations. Am. Nat. 1972, 106, 283–292. [Google Scholar] [CrossRef]
  43. Langella, O. Populations v.1.2.32: Population Genetic Software. Available online: http://www.bioinformatics.org/project/?group_id=84 (accessed on 3 July 2020).
  44. Page, R.D.M. Tree View: An application to display phylogenetic trees on personal computers. Bioinformatics 1996, 12, 357–358. [Google Scholar] [CrossRef] [Green Version]
  45. Beerli, P. Comparison of bayesian and maximum-likelihood inference of population genetic parameters. Bioinformatics 2006, 22, 341–345. [Google Scholar] [CrossRef] [PubMed] [Green Version]
  46. Wilson, G.A.; Rannala, B. Bayesian inference of recent migration rates using multilocus genotypes. Genetics 2003, 163, 1177–1191. [Google Scholar] [CrossRef] [PubMed]
  47. Cornuet, J.M.; Pudlo, P.; Veyssier, J.; Dehne-Garcia, A.; Gautier, M.; Raphaël, L.; Jean-Michel, M.; Arnaud, E. DIYABC v2.0: A software to make approximate Bayesian computation inferences about population history using single nucleotide polymorphism, DNA sequence and microsatellite data. Bioinformatics 2014, 30, 1187–1189. [Google Scholar] [CrossRef] [PubMed] [Green Version]
  48. Piry, S.; Luikart, G.; Cornuet, J.M. BOTTLENECK: A computer program for detecting recent reductions in effective population size using allele frequency data. J. Hered. 1999, 90, 502–503. [Google Scholar] [CrossRef]
  49. Luikart, G.; Cornuet, J.M. Empirical evaluation of a test for identifying recently bottlenecked populations from allele frequency data. Conserv. Biol. 1998, 12, 228–237. [Google Scholar] [CrossRef]
  50. Petitpierre, B.; Kueffer, C.; Broennimann, O.; Randin, C.; Daehler, C.; Guisan, A. Climatic niche shifts are rare among terrestrial plant invaders. Science 2012, 335, 1344–1348. [Google Scholar] [CrossRef] [Green Version]
  51. Phillips, S.J.; Anderson, R.P.; Schapire, R.E. Maximum entropy modeling of species geographic distributions. Ecol. Model. 2006, 190, 231–259. [Google Scholar] [CrossRef] [Green Version]
  52. Warren, D.L.; Glor, R.E.; Turelli, M. Environmental niche equivalency versus conservatism: Quantitative approaches to niche evolution. Evolution 2008, 62, 2868–2883. [Google Scholar] [CrossRef]
  53. Schoener, T.W. The Anolis lizards of bimini: Resource partitioning in a complex fauna. Ecology 1968, 49, 704–726. [Google Scholar] [CrossRef]
  54. Broennimann, O.; Fitzpatrick, M.C.; Pearman, P.B.; Petitpierre, B.; Pellissier, L.; Yoccoz, N.G.; Thuiller, W.; Fortin, M.; Randin, C.; Zimmermann, N.E.; et al. Measuring ecological niche overlap from occurrence and spatial environmental data. Glob. Ecol. Biogeogr. 2012, 21, 481–497. [Google Scholar] [CrossRef] [Green Version]
  55. Herrando-Moraira, S.; Nualart, N.; Herrando-Moraira, A.; Chung, M.Y.; Chung, M.G.; López-Pujol, J. Climatic niche characteristics of native and invasive Lilium Lancifolium. Sci. Rep. 2019, 9, 14334. [Google Scholar] [CrossRef] [Green Version]
  56. Yang, J.; Di, X.; Meng, X.; Feng, L.; Liu, Z.; Zhao, G. Phylogeography and evolution of two closely related oak species (Quercus) from north and northeast China. Tree Genet. Genomes 2016, 12, 89. [Google Scholar] [CrossRef]
  57. Kou, Y.; Cheng, S.; Tian, S.; Li, B.; Fan, D.; Chen, Y.; Soltis, D.E.; Soltis, P.S.; Zhang, Z. The antiquity of Cyclocarya paliurus (Juglandaceae) provides new insights into the evolution of relict plants in subtropical China since the late Early Miocene. J. Biogeogr. 2016, 43, 351–360. [Google Scholar] [CrossRef]
  58. Deng, M.; Jiang, X.L.; Hipp, A.L.; Manos, P.S.; Hahn, M. Phylogeny and biogeography of East Asian evergreen oaks (Quercus section Cyclobalanopsis; Fagaceae): Insights into the Cenozoic history of evergreen broad-leaved forests in subtropical Asia. Mol. Phylogenet. Evol. 2018, 119, 170–181. [Google Scholar] [CrossRef]
  59. Yang, J.; Guo, Y.F.; Chen, X.D.; Zhang, X.; Ju, M.M.; Bai, G.Q.; Liu, Z.L.; Zhao, G.F. Framework phylogeny, evolution and complex diversification of Chinese oaks. Plants 2020, 9, 1024. [Google Scholar] [CrossRef]
  60. Harrison, T.M.; Copeland, P.; Kidd, W.S.F.; Yin, A.N. Raising Tibet. Science 1992, 255, 1663–1670. [Google Scholar] [CrossRef] [Green Version]
  61. Chung, S.L.; Lo, C.H.; Lee, T.Y.; Zhang, Y.; Xie, Y.; Li, X.; Wang, K.L.; Wang, P.L. Diachronous uplift of the Tibetan plateau starting 40? Myr ago. Nature 1998, 394, 769–773. [Google Scholar] [CrossRef]
  62. Shi, Y.F.; Li, J.J.; Li, B.Y. Uplift and Environmental Changes of Qinghai-Tibetan Plateau in the Late Cenozoic; Guangdong Science and Technology Press: Guangzhou, China, 1998. [Google Scholar]
  63. Guo, Z.; Ruddiman, W.; Hao, Q.Z.; Wu, H.B.; Qiao, Y.S.; Zhu, R.X.; Peng, S.Z.; Wei, J.J.; Yuan, B.Y.; Liu, T.S. Onset of Asian desertification by 22 Myr ago inferred from loess deposits in China. Nature 2002, 416, 159–163. [Google Scholar] [CrossRef] [PubMed]
  64. Spicer, R.; Harris, N.; Widdowson, M.; Herman, A.; Guo, S.; Valdes, P.; Wolfe, J.; Kelley, S. Constant elevation of southern Tibet over the past 15 million years. Nature 2003, 421, 622–624. [Google Scholar] [CrossRef] [PubMed]
  65. Sobel, J.M.; Chen, G.F.; Watt, L.R.; Schemske, D.W. The biology of speciation. Evolution 2010, 64, 295–315. [Google Scholar] [CrossRef] [PubMed]
  66. Zhang, M.L.; Meng, H.H.; Zhang, H.X.; Vyacheslav, B.V.; Sanderson, S.C. Himalayan origin and evolution of Myricaria (Tamaricaeae) in the Neogene. PLoS ONE 2014, 9, e97582. [Google Scholar]
  67. Liu, M.L.; He, Y.L.; López-Pujol, J.; Jia, Y.; Li, Z.H. Complex population evolutionary history of four cold-tolerant Notopterygium herb species in the Qinghai-Tibetan Plateau and adjacent areas. Heredity 2019, 123, 242–263. [Google Scholar] [CrossRef]
  68. Liu, J.; Möller, M.; Provan, J.; Gao, L.M.; Poudel, R.C.; Li, D.Z. Geological and ecological factors drive cryptic speciation of yews in a biodiversity hotspot. New Phytol. 2013, 199, 1093–1108. [Google Scholar] [CrossRef]
  69. Feng, L.; Zheng, Q.J.; Qian, Z.Q.; Yang, J.; Zhang, Y.P.; Li, Z.H.; Zhao, G.F. Genetic structure and evolutionary history of three Alpine Sclerophyllous oaks in East Himalaya-Hengduan Mountains and adjacent regions. Front. Plant Sci. 2016, 7, 1688. [Google Scholar] [CrossRef] [Green Version]
  70. Hipp, A.L.; Eaton, D.A.; Cavender-Bares, J.; Fitzek, E.; Nipper, R.; Manos, P.S. A framework phylogeny of the American oak clade based on sequenced RAD data. PLoS ONE 2014, 9, e93975. [Google Scholar] [CrossRef] [Green Version]
  71. Riordan, E.C.; Gugger, P.F.; Ortego, J.; Smith, C.; Gaddis, K.; Thompson, P.; Sork, V.L. Association of genetic and phenotypic variability with geography and climate in three southern California oaks. Am. J. Bot. 2016, 103, 73–85. [Google Scholar] [CrossRef] [Green Version]
  72. Muir, G.; Fleming, C.C.; Schltterer, C. Species status of hybridizing oaks. Nature 2000, 405, 1016. [Google Scholar] [CrossRef]
  73. Ortego, J.; Gugger, P.F.; Riordan, E.C.; Sork, V.L. Influence of climatic niche suitability and geographical overlap on hybridization patterns among southern Californian oaks. J. Biogeogr. 2014, 41, 1895–1908. [Google Scholar] [CrossRef]
  74. Quintero, I.; González-Caro, S.; Zalamea, P.C.; Cadena, C.D. Asynchrony of seasons: Genetic differentiation associated with geographic variation in climatic seasonality and reproductive phenology. Am. Nat. 2014, 184, 352–363. [Google Scholar] [CrossRef]
  75. Yang, J.; Vázquez, L.; Feng, L.; Liu, Z.; Zhao, G. Climatic and soil factors shape the demographical history and genetic diversity of a deciduous oak (Quercus liaotungensis) in Northern China. Front. Plant Sci. 2018, 9, 1534. [Google Scholar] [CrossRef]
  76. Chen, X.D.; Yang, J.; Guo, Y.F.; Zhao, Y.M.; Zhou, T.; Zhang, X.; Ju, M.M.; Li, Z.H.; Zhao, G.F. Spatial genetic structure and demographic history of the dominant forest oak Quercus fabri hance in subtropical China. Front. Plant Sci. 2021, 11, 583284. [Google Scholar] [CrossRef]
  77. Comes, H.P.; Kadereit, J.W. The effect of Quaternary climatic changes on plant distribution and evolution. Trends Plant Sci. 1998, 3, 432–438. [Google Scholar] [CrossRef]
  78. Hewitt, G.M. Genetic consequences of climatic oscillations in the Quaternary. Philos. Trans. R. Soc. London. Ser. B Biol. Sci. 2004, 359, 183–195. [Google Scholar] [CrossRef] [Green Version]
  79. Shi, Y. Characteristics of late Quaternary monsoonal glaciation on the Tibetan Plateau and in East Asia. Quatern. Int. 2002, 97, 79–91. [Google Scholar] [CrossRef]
  80. Zheng, B.; Xu, Q.; Shen, Y. The relationship between climate change and Quaternary glacial cycles on the Qinghai–Tibetan Plateau: Review and speculation. Quatern. Int. 2002, 97, 93–101. [Google Scholar] [CrossRef]
  81. Hao, Q.; Wang, L.; Oldfield, F.; Guo, Z. Extra-long interglacial in Northern Hemisphere during MISs 15-13 arising from limited extent of Arctic ice sheets in glacial MIS 14. Sci. Rep. 2015, 5, 1–8. [Google Scholar] [CrossRef]
  82. Guo, Z.; Liu, T.; Fedoroff, N.; Wei, L.; Ding, Z.; Wu, N.; Lu, H.; Jiang, W.; An, Z. Climate extremes in loess of China coupled with the strength of deep-water formation in the North Atlantic. Glob. Planet. Chang. 1998, 18, 113–128. [Google Scholar] [CrossRef]
  83. Chen, X.D.; Yang, J.; Feng, L.; Zhou, T.; Zhang, H.; Li, H.M.; Bai, G.Q.; Meng, X.; Zhao, G.F. Phylogeography and population dynamics of an endemic oak (Quercus fabri Hance) in subtropical China revealed by molecular data and ecological niche modeling. Tree Genet. Genomes 2020, 16, 2. [Google Scholar] [CrossRef]
  84. Tian, S.; Kou, Y.; Zhang, Z.; Yuan, L.; Li, D.; López-Pujol, J.; Fan, D.M.; Zhang, Z. Phylogeography of Eomecon chionantha in subtropical China: The dual roles of the Nanling Mountains as a glacial refugium and a dispersal corridor. BMC Evol. Biol. 2018, 18, 20. [Google Scholar] [CrossRef] [PubMed] [Green Version]
Figure 1. Structure analysis results and genetic composition of each population in three Cerris oaks. The K = 2 (a) and K = 3 (b) clusters were shown. The unweighted pair-group method using arithmetic averages (UPGMA) dendrogram using Nei’s (1972) distance (Ds) of 44 populations (c) and principal coordinates analysis (PCoA) of 759 individuals of three Cerris oaks (d).
Forests 12 01164 g001
Figure 2. The four models for the species demographical history of the three oak species (Q. variabilis, Q. chenii and Q. acutissima) in DIYABC (A). The four tested historical demographic models proposed for the populations of the three Cerris oaks (B).
Forests 12 01164 g002
Figure 3. A comparison of potential habits under the present climate and two past climatic scenarios. (a,b) Overlap areas of the LGM and LIG with the present for the Q. variabilis, respectively; (c,d) Overlap areas of the LGM and LIG with the present for the Q. acutissima, respectively; (e,f) Overlap areas of the LGM and LIG with the present for Q. chenii, respectively. The blue and purple represent the present and past potential distribution, respectively. The orange represents the overlap of present and past potential distribution.
Forests 12 01164 g003
Table 1. Analyses of molecular variance (AMOVA) based on 16 nSSR data for intra and inter-species of the three Cerris oaks. Notes: Df, degrees of freedom; SS, sum of squares; significance levels: *** p < 0.001; 1000 permutations; FCT, divergence among species; FST, divergence among populations; FSC, divergence among populations within species.
Source of VariationDfSSVariation (%)Fixation Index
Q. variabilis
Among populations18322.5718.97FST = 0.090 ***
Within populations6532613.89891.03
Total6712936.469
Q. acutissima
Among populations19739.15821.37FST = 0.214 ***
Within populations6562513.00078.63
Total6753252.158
Q. chenii
Among populations454.1345.45FST = 0.055 ***
Within populations165757.50194.55
Total169811.635
All samples
Among species21056.08419.52FCT = 0.195 ***
Among populations
within species
411104.49711.76FSC = 0.146 ***
Within populations14745764.86068.72FST = 0.313 ***
Total15177925.441
Table 2. Historical gene flow as estimated by Migrate-n among three related species. QV, Q. variabilis; QA, Q. acutissima; QC, Q. chenii; numbers in parentheses are the lower 5% and upper 95% of posterior distribution; M, mutation-scaled immigration rate; m, immigration rate; μ, mutation rate; →, source populations.
M (m/μ)
SpeciesθQV→QA→QC→
QV0.896 (0.881–0.911) 4.571 (4.349–4.790)7.2180 (6.963–7.479)
QA1.540 (1.514–1.567)9.098 (8.819–9.382) 5.2464 (5.039–5.459)
QC3.412 (3.310–3.517)2.3863 (2.291–2.484)2.6501 (2.550–2.753)
Table 3. Posterior parameter estimates (median and 95% confidence intervals) for the best supported demographical model 2.
ParameterN1N2N3NAT1
(Generations)
Ta
(Generations)
µp
Species referred toQVQAQCQV+QA+QCQC from QADifferentiation of QV and QA
Median5.52 × 1054.45 × 1058.78 × 1057.14 × 1041.20 × 1052.48 × 1058.33 × 10−62.69 × 10⁻¹
Lower_bound
(2.5%)
2.69 × 1052.20 × 1056.60 × 1054.84 × 1036.34 × 1042.03 × 1055.67 × 10−61.74 × 10⁻¹
Upper_bound
(97.5%)
9.28 × 1058.45 × 1059.91 × 1056.00 × 1051.91 × 1052.97 × 1051.00 × 10−53.00 × 10⁻¹
RMAE0.1450.1380.1430.3260.1580.0870.1290.132
N1, effective population size of Q. variabilis; N2, effective population size of Q. acutissima; N3, effective population size of Q. chenii; NA, effective population size of ancestral population; t1, time since divergence between Q. acutissima and Q. chenii; ta, time since divergence between Q. acutissima and Q. variabilis.
Publisher’s Note: MDPI stays neutral with regard to jurisdictional claims in published maps and institutional affiliations.

