
Nitrate Uptake from an Aquifer by Two Plantation Forests: Plausibility Strengthened by Process-Based Modelling

 ,
,  , ,
, ,
Abstract
:1. Introduction
2. Materials and Methods
2.1. Sites and Data
2.2. Modelling
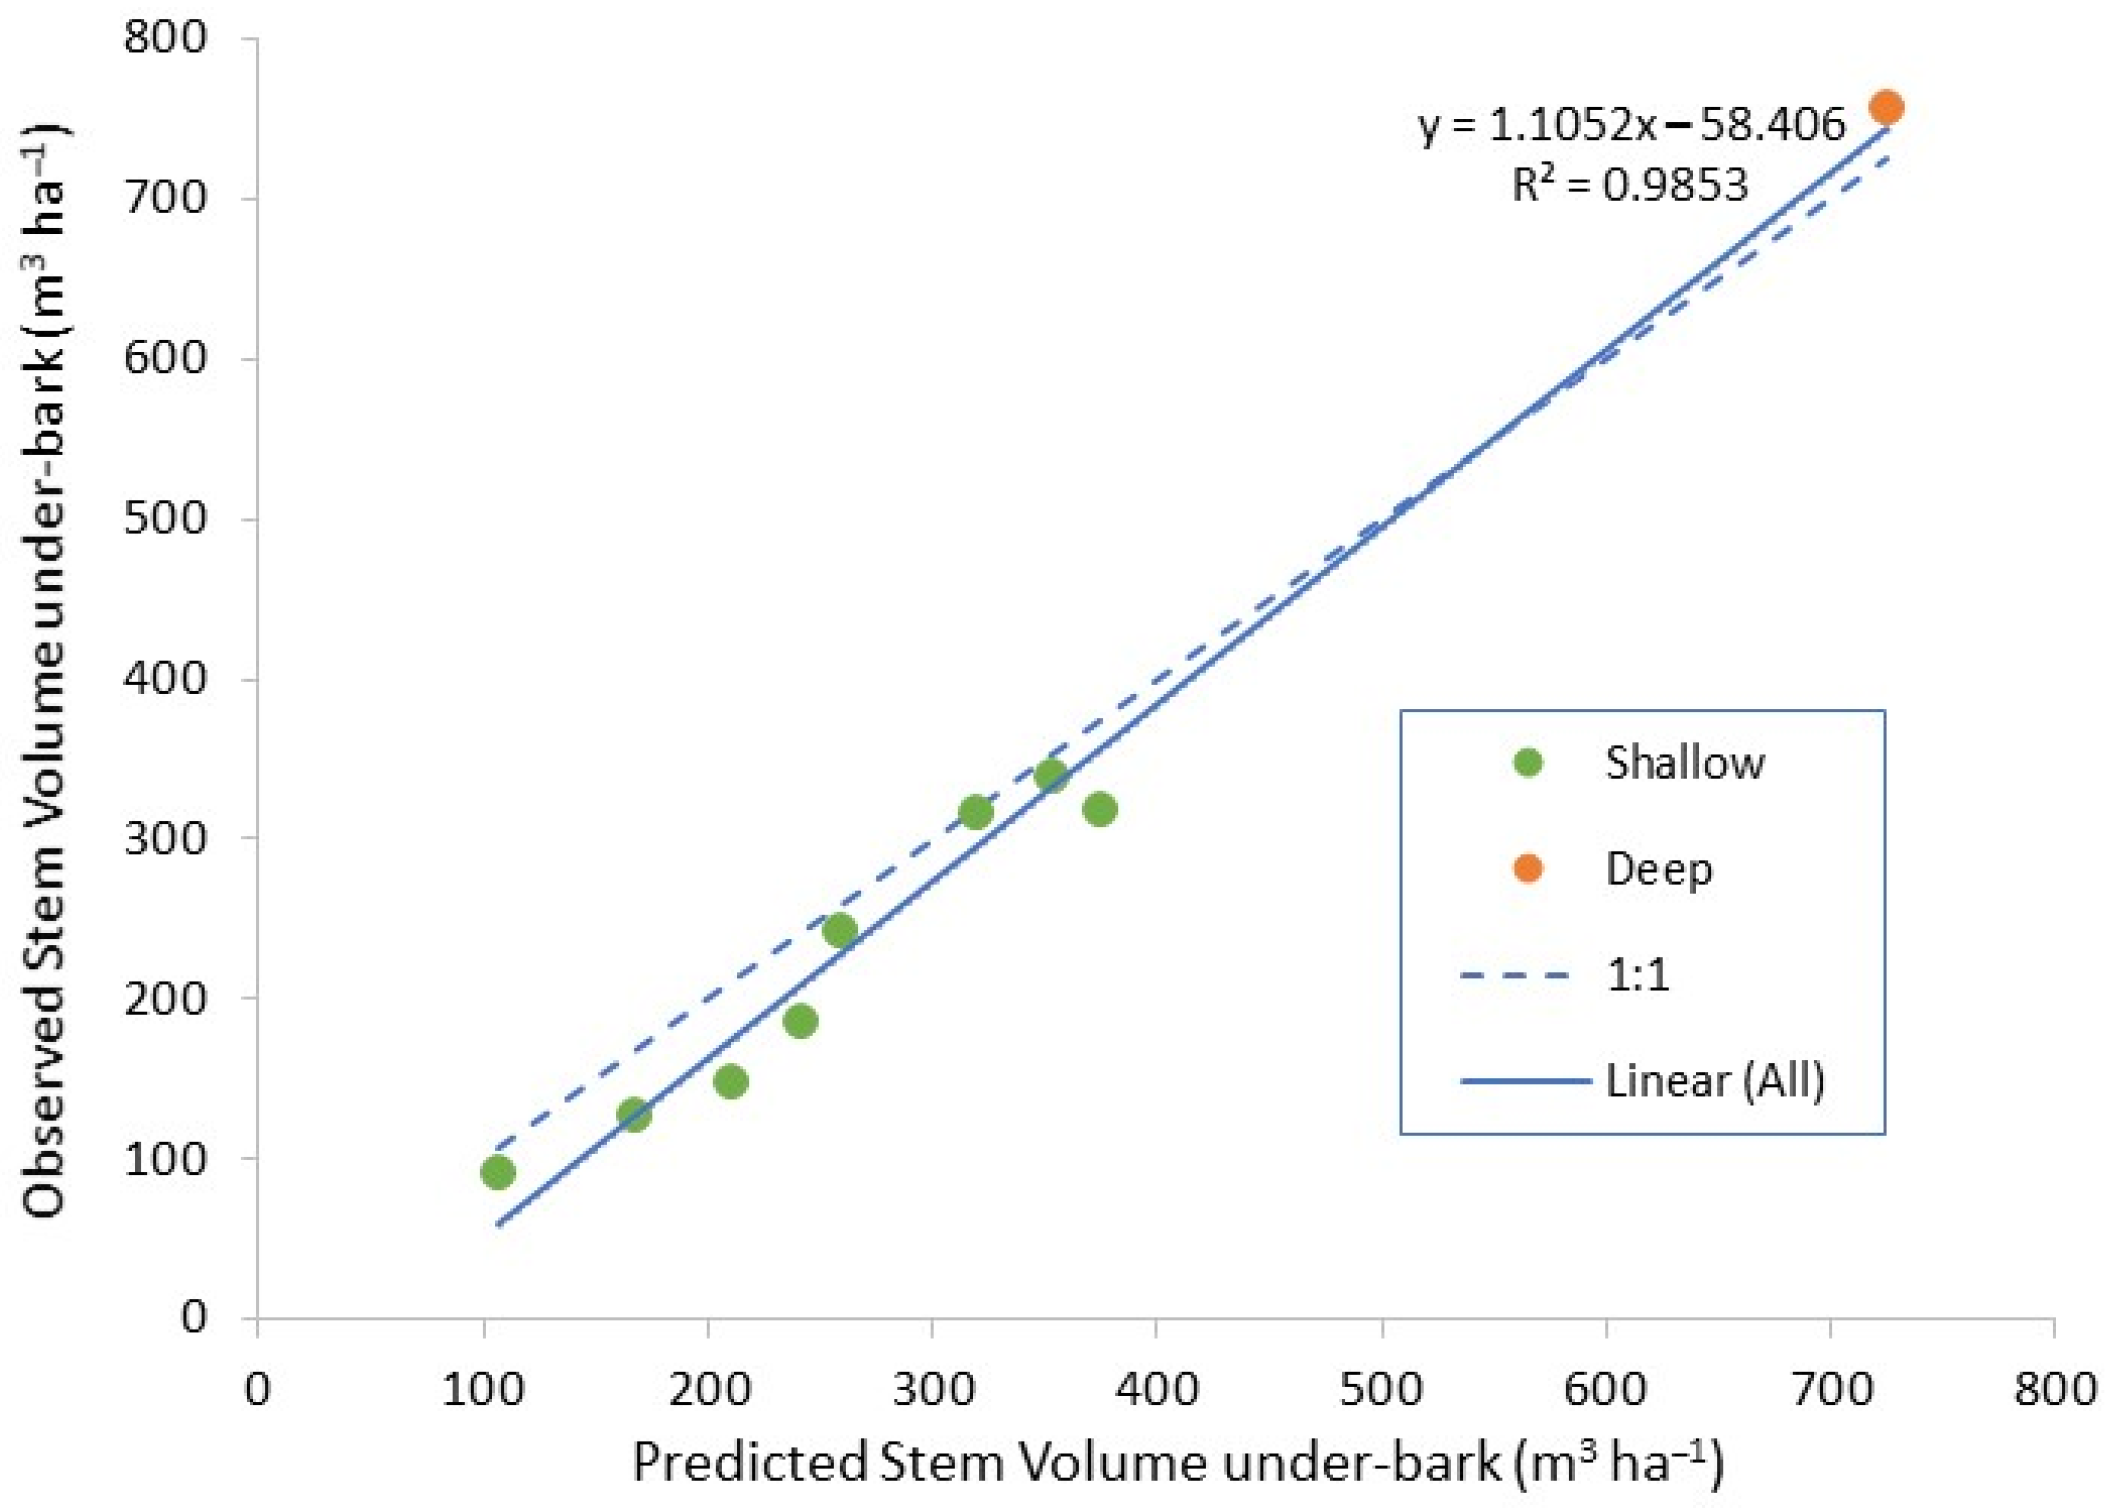
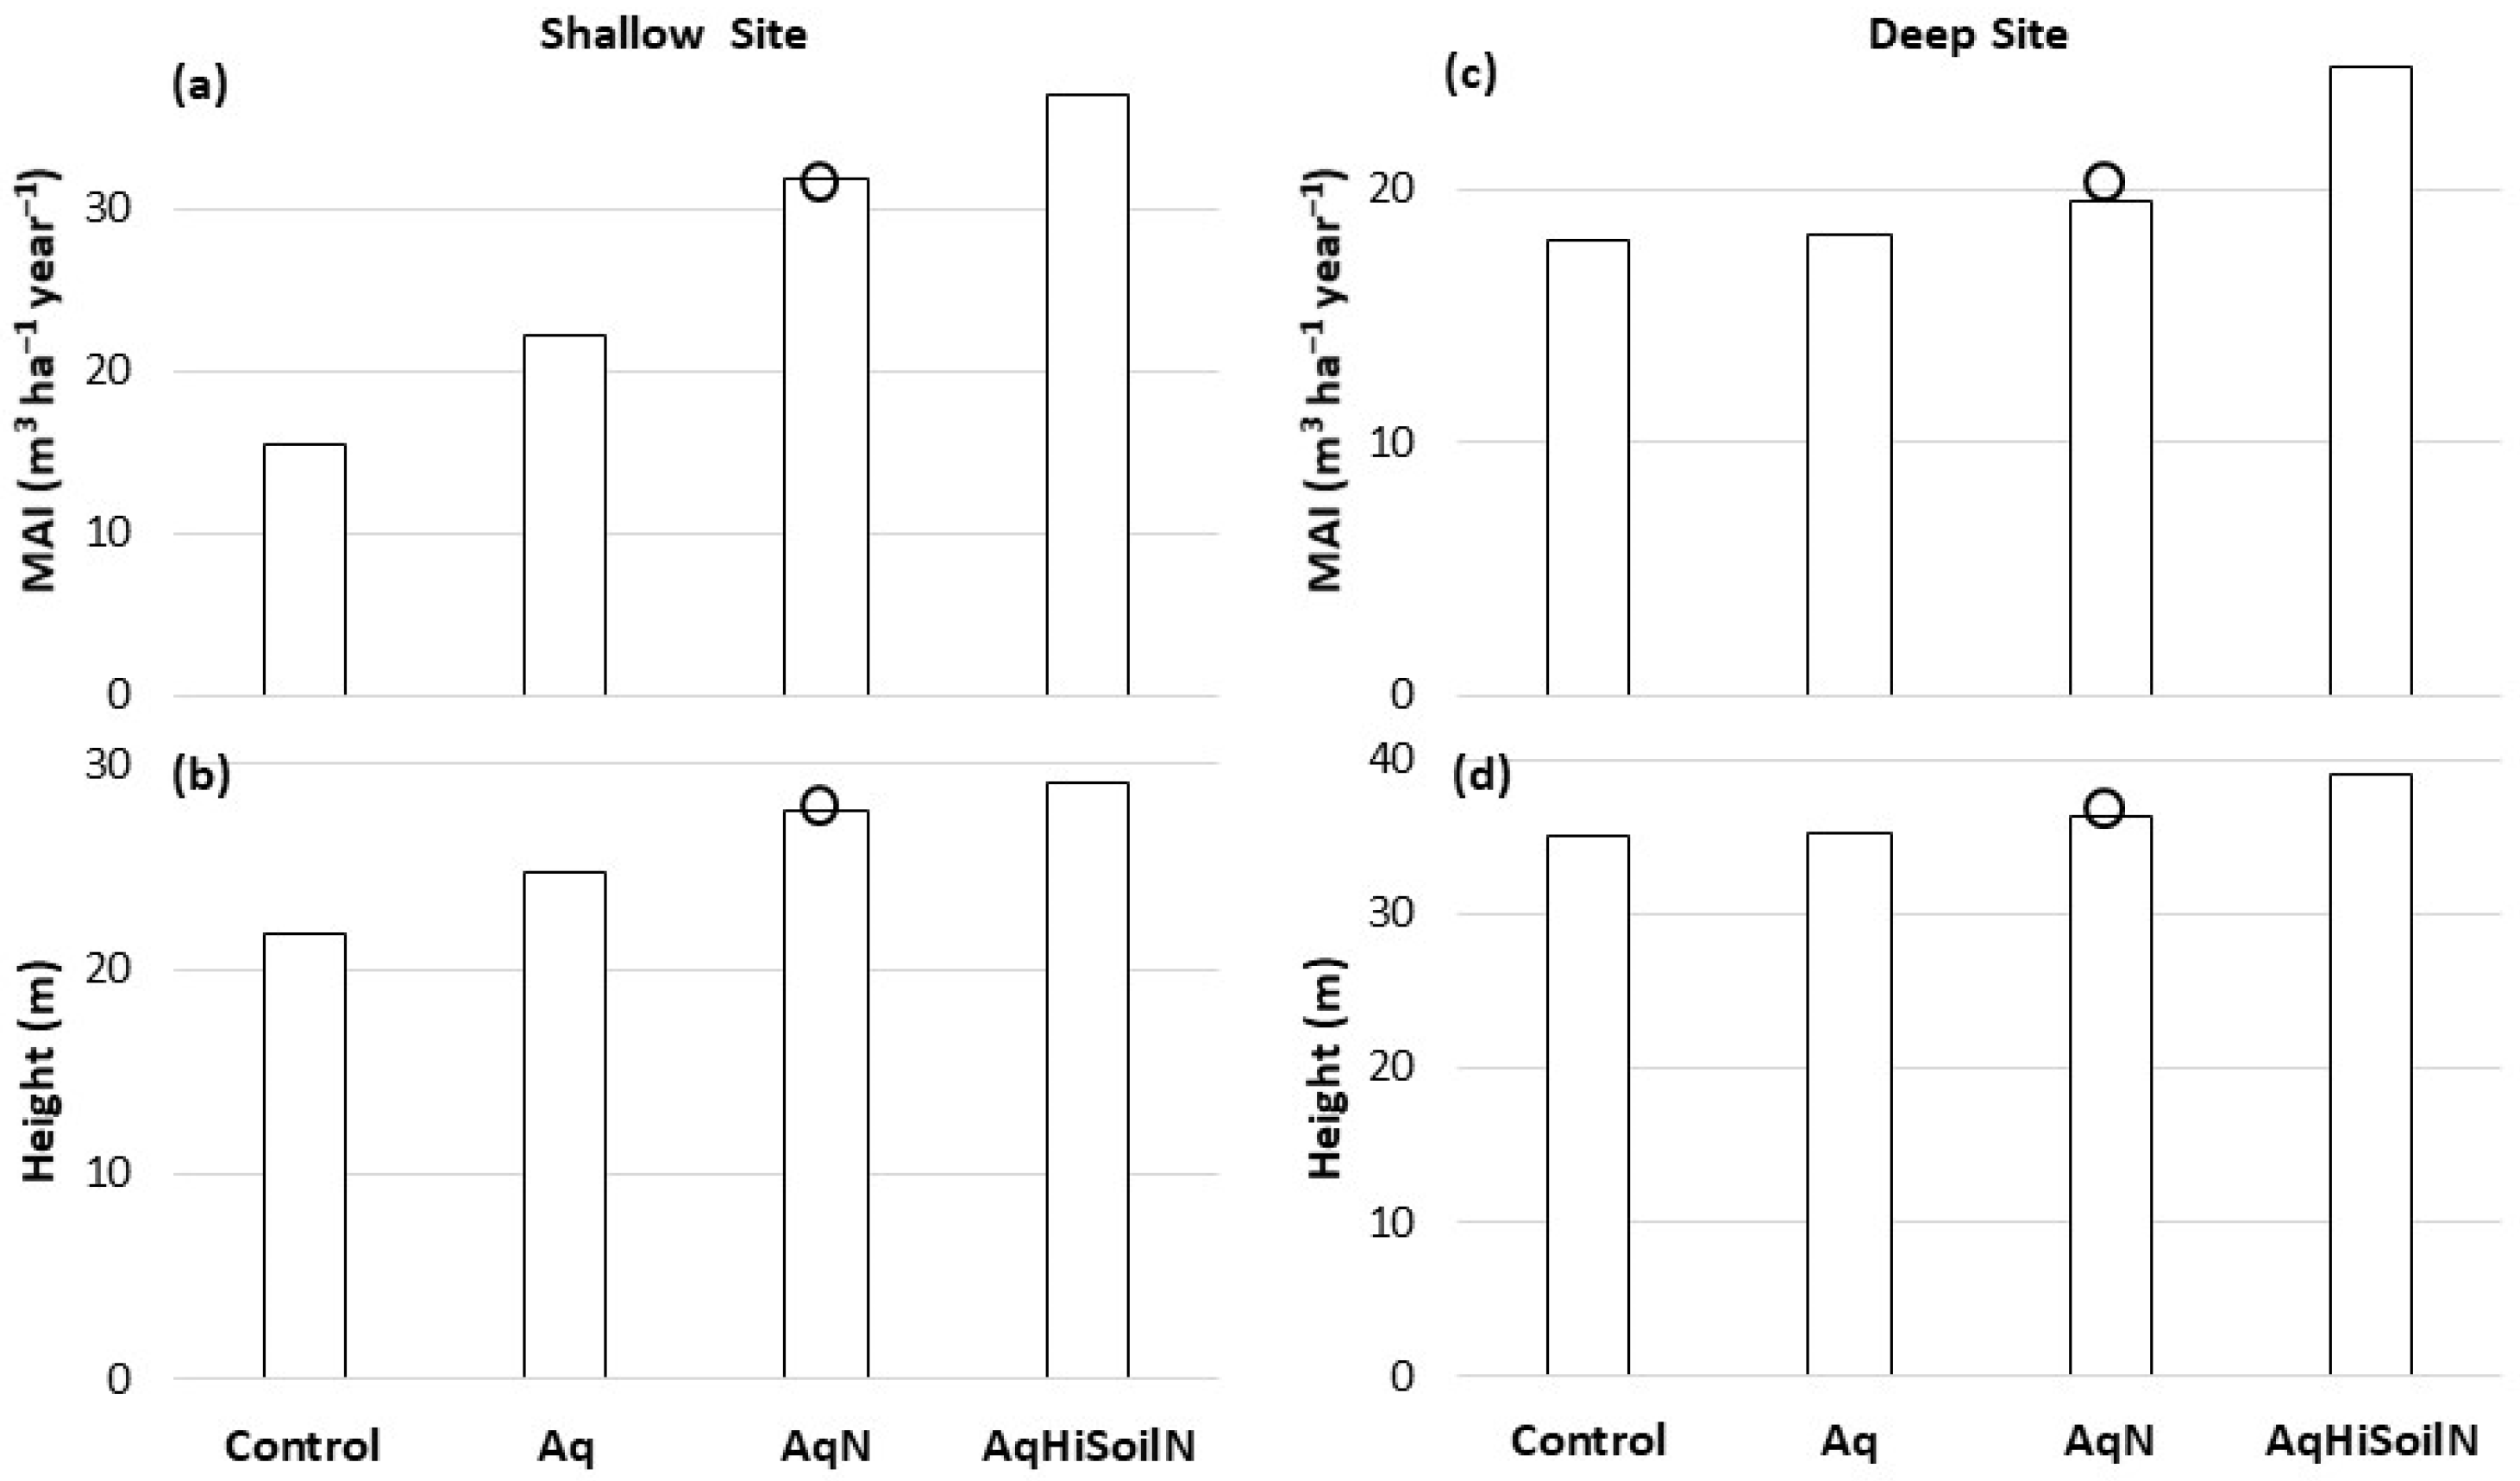
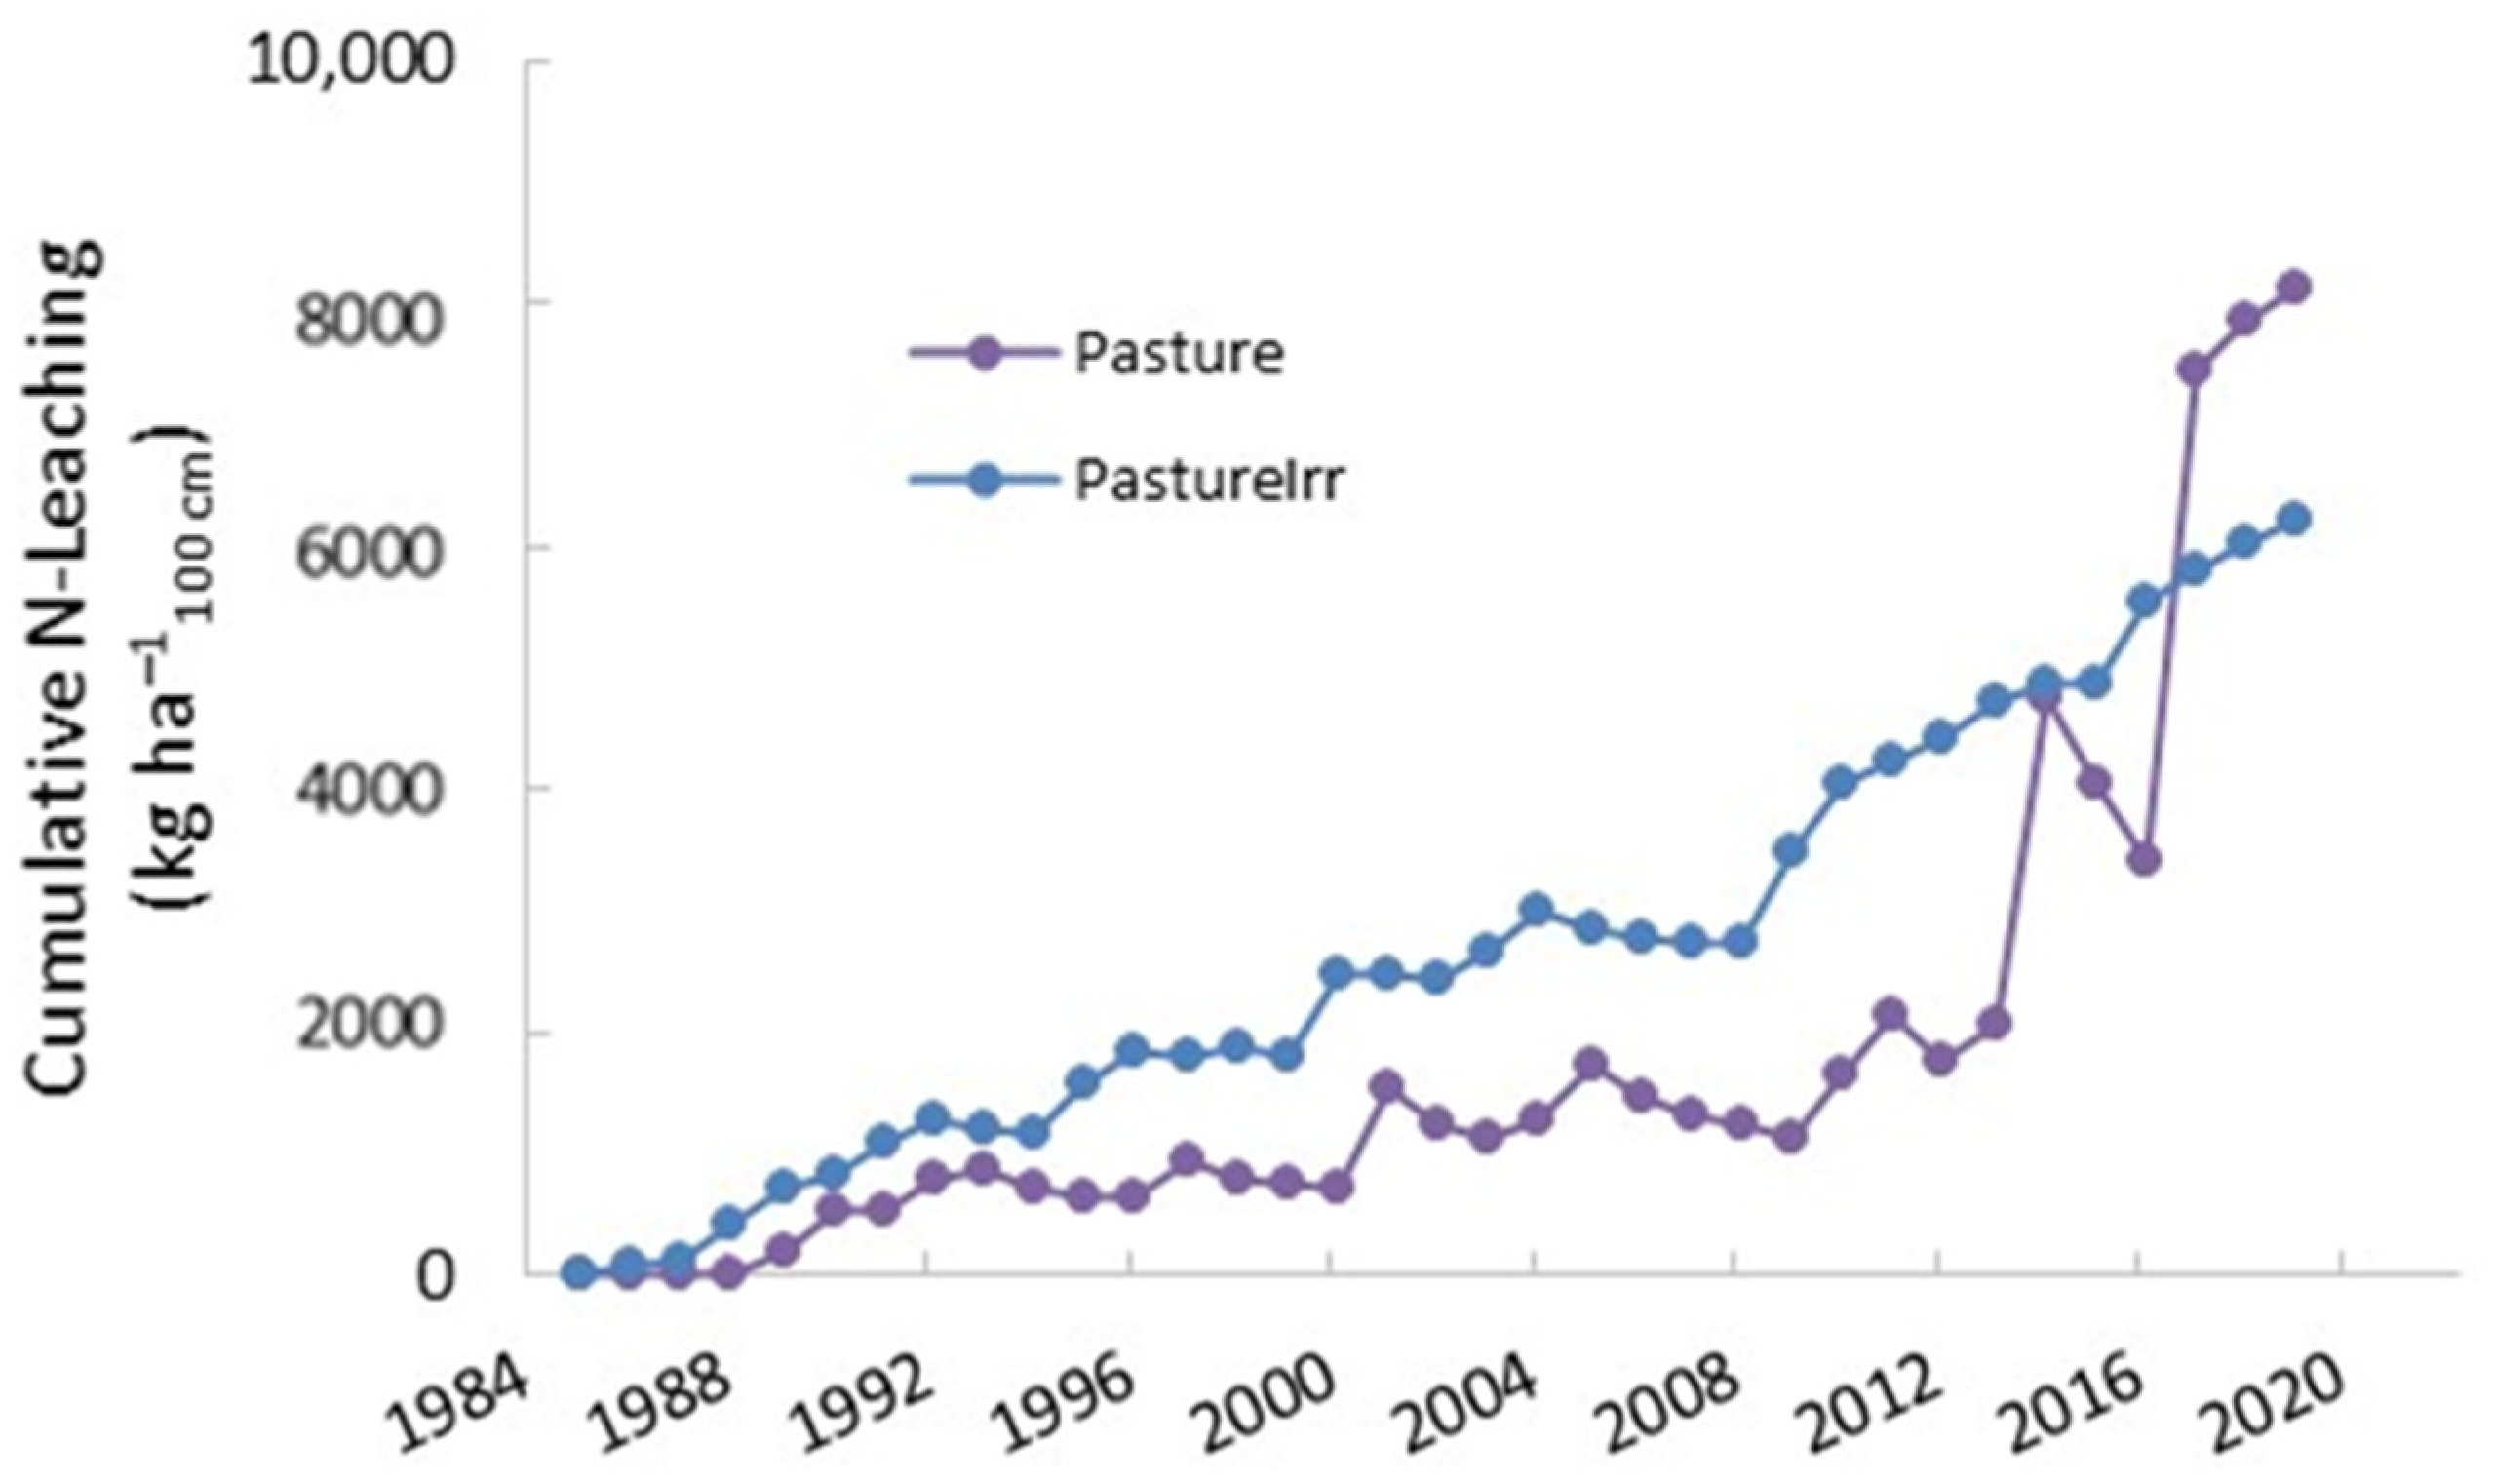
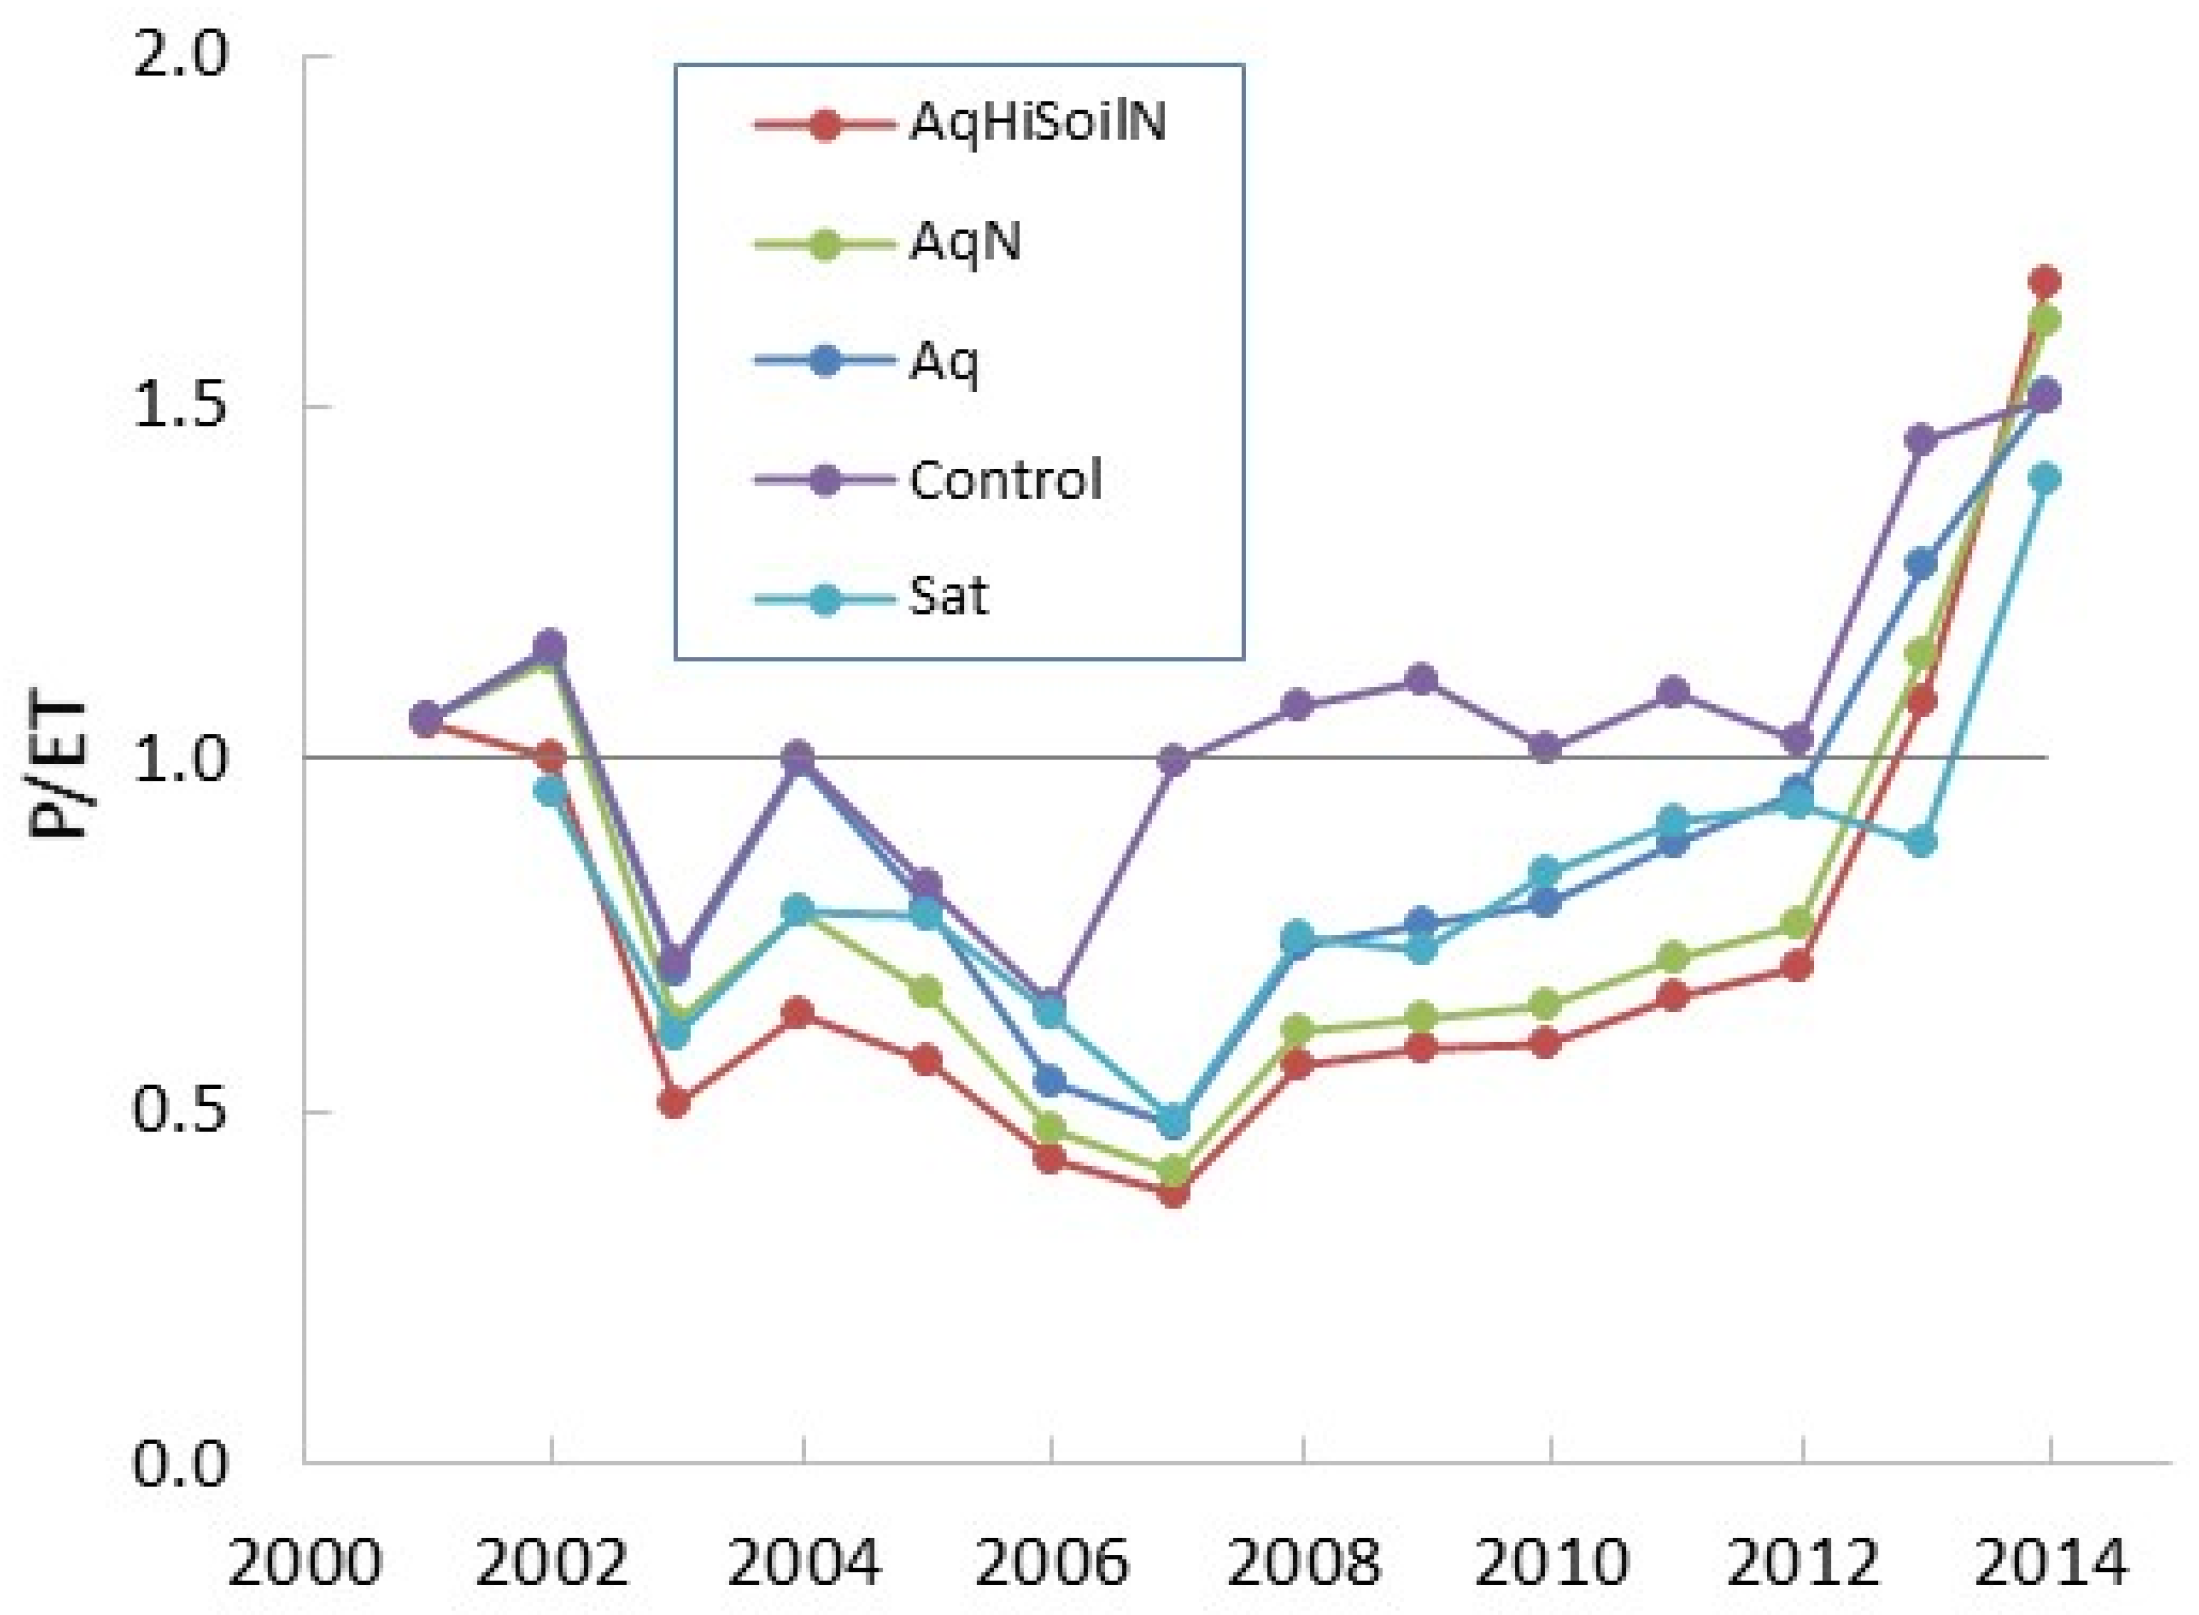
3. Results
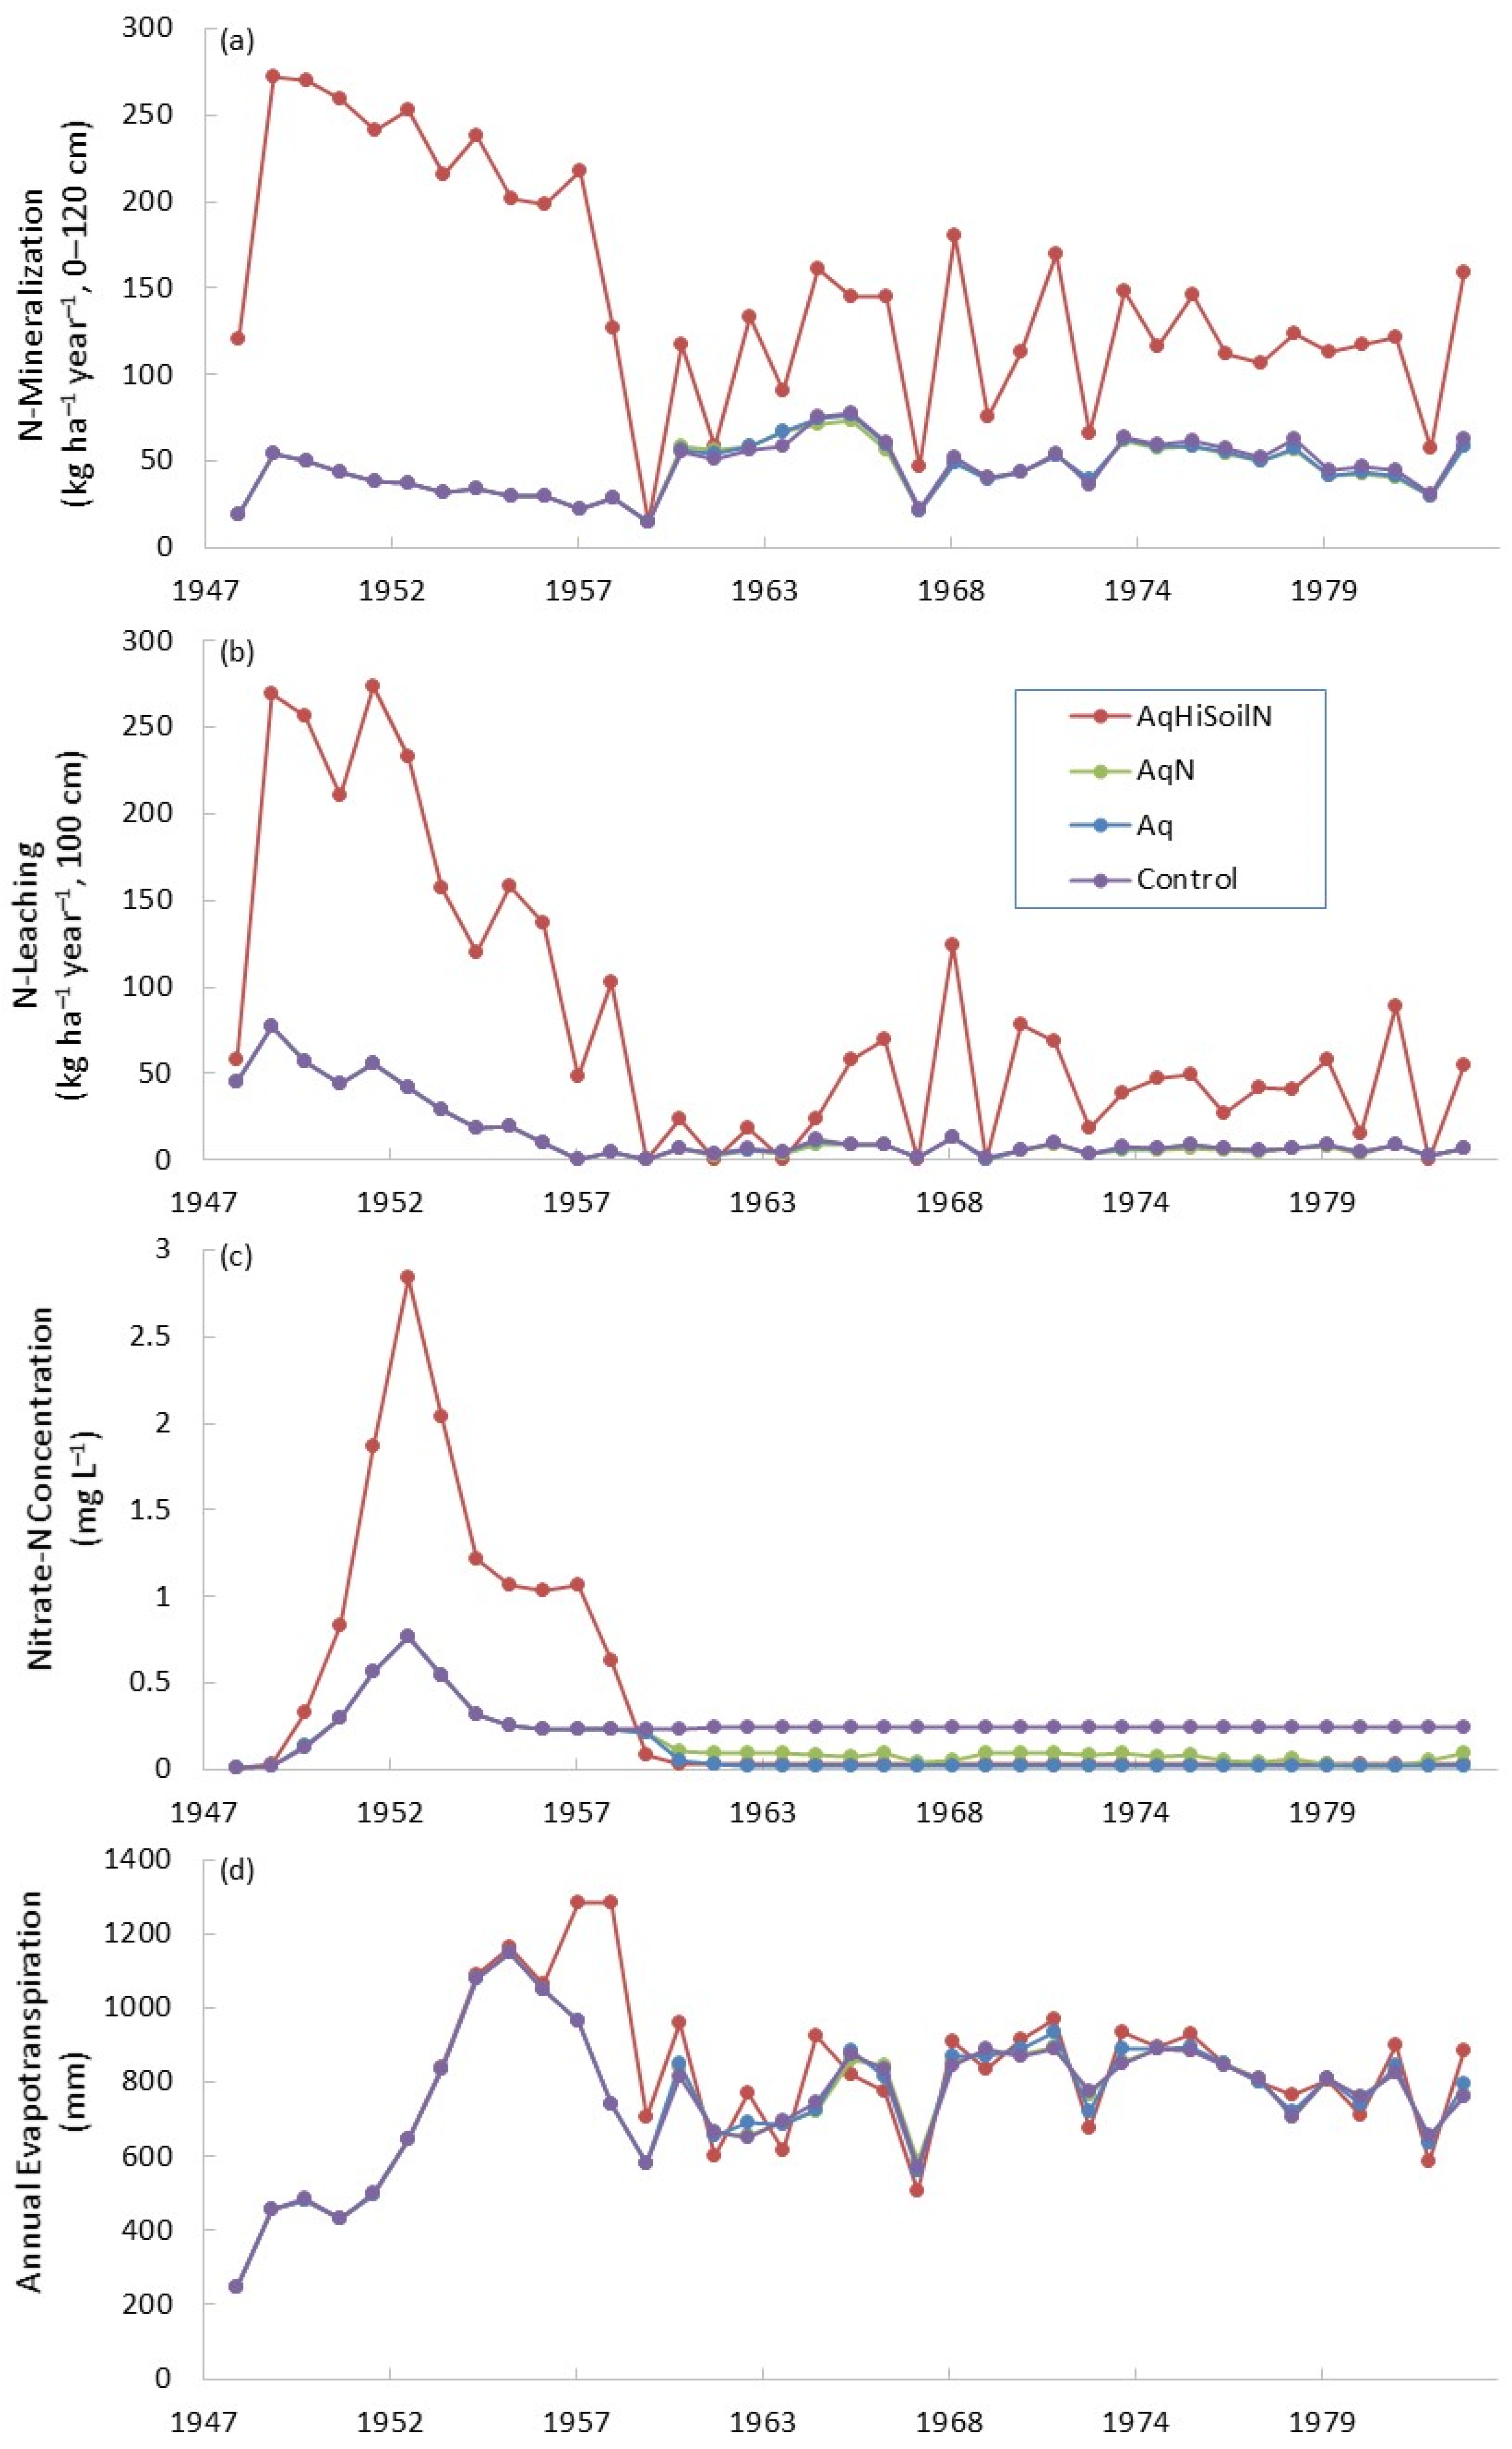
3.1. Shallow Site
3.2. Deep Site
4. Discussion
5. Conclusions
Supplementary Materials
Author Contributions
Funding
Institutional Review Board Statement
Informed Consent Statement
Data Availability Statement
Acknowledgments
Conflicts of Interest
References
- Benyon, R.G.; Theiveyanathan, S.; Doody, T.M. Impacts of tree plantations on groundwater in south-eastern Australia. Aust. J. Bot. 2006, 54, 181–192. [Google Scholar] [CrossRef]
- Harrington, N.; Lamontagne, S. (Eds.) Framework for a Regional Water Balance Model for the South Australian Limestone Coast Region; Research Technical Report Series No. 13/14; Goyder Institute for Water: Adelaide, Australia, 2013; 252p. [Google Scholar]
- O’Hehir, J.F.; Nambiar, E.K.S. Productivity of three successive rotations of P. radiata plantations in South Australia over a century. For. Ecol. Manag. 2010, 259, 1857–1869. [Google Scholar] [CrossRef]
- Nambiar, E.K.S. Relationships between water, nutrients and productivity in Australian forests: Application to wood production and quality. Plant Soil 1995, 168, 427–435. [Google Scholar] [CrossRef]
- Carlyle, J.C.; Nambiar, E.S. Relationships between net nitrogen mineralization, properties of the forest floor and mineral soil, and wood production in Pinus radiata plantations. Can. J. For. Res. 2001, 31, 889–898. [Google Scholar] [CrossRef]
- Doody, T.M.; Benyon, R.G. Direct measurement of groundwater uptake through tree roots in a cave. Ecohydrology 2011, 4, 644–649. [Google Scholar] [CrossRef]
- Harvey, D. Accounting for Plantation Forest Groundwater Impacts in the Lower South East of South Australia; South Australian Department of Water, Land and Biodiversity Conservations: Adelaide, Australia, 2009; 52p. Available online: https://www.waterconnect.sa.gov.au/Content/Publications/DEW/DWLBC_Technical_Report_2009_13.pdf (accessed on 9 December 2021).
- Lamontagne, S. Groundwater delivery rate of nitrate and predicted change in nitrate concentration in Blue Lake, South Australia. Mar. Freshw. Res. 2002, 53, 1129–1142. [Google Scholar] [CrossRef]
- Gorey, P.G. Monitoring and Modelling Natural and Anthropogenic Inputs of Nitrogen into an Unconfined Aquifer in the South East of South Australia. Ph.D. Thesis, Flinders University, Adelaide, Australia, 2009; 419p. [Google Scholar]
- LWRRDC Contamination of Australian Groundwater Systems with Nitrate; Land and Water Resources Research Development Corporation: Canberra, Australia, 1999; Occasional Paper 1999, 03/99. Available online: https://www.vgls.vic.gov.au/client/en_AU/vgls/search/detailnonmodal/ent:$002f$002fSD_ILS$002f0$002fSD_ILS:126333/ada?qu=Groundwater+--+Pollution.&d=ent%3A%2F%2FSD_ILS%2F0%2FSD_ILS%3A126333%7EILS%7E62&av=0&ps=300&h=8 (accessed on 9 December 2021).
- Schmidt, L.; Schulz, T.; Correll, R.; Shrale, G. Diffuse source nitrate pollution of groundwater in relation to land management systems of the south east of South Australia. In Proceedings of the International Conference on Diffuse Pollution: Solutions-Innovations, Perth, Australia, 16–20 May 1999; pp. 442–453. [Google Scholar]
- Garnett, T.P.; Shabala, S.N.; Smethurst, P.J.; Newman, I.A. Kinetics of ammonium and nitrate uptake by eucalypt roots and associated proton fluxes measured using ion selective microelectrodes. Funct. Plant Biol. 2003, 30, 1165–1176. [Google Scholar] [CrossRef]
- Sands, P.J.; Smethurst, P.J. Modelling nutrient uptake and plant growth in Ingestad units using Michaelis-Menten-like nutrient-uptake kinetics. Aust. J. Plant Physiol. 1995, 22, 823–831. [Google Scholar]
- Carlyle, J.C.; Lowther, J.R.; Smethurst, P.J.; Nambiar, E.K.S. Influence of chemical properties on nitrogen mineralization and nitrification in podzolized sands. Implications for forest management. Soil Res. 1990, 28, 981–1000. [Google Scholar] [CrossRef]
- Holzworth, D.; Huth, N.I.; Fainges, J.; Brown, H.; Zurcher, E.; Cichota, R.; Verrall, S.; Herrmann, N.I.; Zheng, B.; Snow, V. APSIM Next Generation: Overcoming challenges in modernising a farming systems model. Environ. Model. Softw. 2018, 103, 43–51. [Google Scholar] [CrossRef]
- Smethurst, P.J.; Valadares, R.V.; Huth, N.I.; Almeida, A.C.; Elli, E.F.; Neves, J.C. Generalized model for plantation production of Eucalyptus grandis and hybrids for genotype-site-management applications. For. Ecol. Manag. 2020, 469, 118164. [Google Scholar] [CrossRef]
- Elli, E.F.; Sentelhas, P.C.; Bender, F.D. Impacts and uncertainties of climate change projections on Eucalyptus plantations productivity across Brazil. For. Ecol. Manag. 2020, 474, 118365. [Google Scholar] [CrossRef]
- Elli, E.F.; Huth, N.; Sentelhas, P.C.; Carneiro, R.L.; Alvares, C.A. Ability of the APSIM Next Generation Eucalyptus model to simulate complex traits across contrasting environments. Ecol. Model. 2020, 419, 108959. [Google Scholar] [CrossRef]
- Gold, A.J.; Jacinthe, P.A.; Groffman, P.M.; Wright, W.R.; Puffer, R.H. Patchiness in Groundwater Nitrate Removal in a Riparian Forest. J. Environ. Qual. 1998, 27, 146–155. [Google Scholar] [CrossRef] [Green Version]
- Pinay, G.; Ruffinoni, C.; Wondzell, S.; Gazelle, F. Change in Groundwater Nitrate Concentration in a Large River Floodplain: Denitrification, Uptake, or Mixing? J. N. Am. Benthol. Soc. 1998, 17, 179–189. [Google Scholar] [CrossRef]
- Rassam, D.W.; Pagendam, D.E.; Hunter, H.M. Conceptualisation and application of models for groundwater–surface water interactions and nitrate attenuation potential in riparian zones. Environ. Model. Softw. 2008, 23, 859–875. [Google Scholar] [CrossRef]
- Smethurst, P.J.; Nambiar, E.K.S. Distribution of carbon and nutrients and fluxes of mineral nitrogen after clear-felling a Pinus radiata plantation. Can. J. For. Res. 1990, 20, 1490–1497. [Google Scholar] [CrossRef]
- Smethurst, P.J.; Nambiar, E.K.S. Effects of slash and litter management on fluxes of nitrogen and tree growth in a young Pinus radiata plantation. Can. J. For. Res. 1990, 20, 1498–1507. [Google Scholar] [CrossRef]
- Brown, K.G.H.; Harrington, G.; Lawson, J. Review of Groundwater Resource Condition and Management Principles for the Tertiary Limestone Aquifer in the South East of South Australia; South Australian Government-Department of Water, Land and Biodiversity Conservation: Adelaide, Australia, 2006; 100p.
- Cichota, R.; Snow, V. Simulating plant growth in diverse pastures with new forage models in APSIM. Agron. N. Z. 2018, 48, 77–89. [Google Scholar]
- Benyon, R.G.; Doody, T.M.; Theiveyanathan, S.; Koul, V. Plantation Forest Water Use in Southwest Victoria. Forest and Wood Products Australia Project Number PNC064-0607. Report. 2009. Available online: https://www.fwpa.com.au/images/resources/PNC064-0607_Plantation_Water_Use_Research_Report_0.pdf (accessed on 9 December 2021).
- Adams, M.A.; Attiwill, P.M. Nutrient balance in forests of northern Tasmania. 1. Atmospheric inputs and within-stand cycles. For. Ecol. Manag. 1991, 44, 93–113. [Google Scholar] [CrossRef]
- Son, Y. Non-symbiotic nitrogen fixation in forest ecosystems. Ecol. Res. 2001, 16, 183–196. [Google Scholar] [CrossRef]
- Valadares, R.V.; Neves, J.C.L.; Costa, M.D.; Smethurst, P.J.; Peternelli, L.A.; Jesus, G.L.; Cantarutti, R.B.; Silva, I.R. Modeling rhizosphere carbon and nitrogen cycling in Eucalyptus plantation soil. Biogeosciences 2018, 15, 4943–4954. [Google Scholar] [CrossRef] [Green Version]
- Harrington, N.; Wood, C.; Yan, W. Lower South East Water Balance Project Phase 1—Review of the Conceptual Model and Recommendations for a Modelling Approach. Department for Water. DFW Technical Report 2011/12. 2011. Available online: https://www.waterconnect.sa.gov.au/Content/Publications/DEW/DFW_TR_2011_12.pdf (accessed on 9 December 2021).
- Christie, K.M.; Smith, A.P.; Rawnsley, R.P.; Harrison, M.T.; Eckard, R.J. Simulated seasonal responses of grazed dairy pastures to nitrogen fertilizer in SE Australia: Pasture production. Agric. Syst. 2018, 166, 36–47. [Google Scholar] [CrossRef]
- Christie, K.M.; Smith, A.P.; Rawnsley, R.P.; Harrison, M.T.; Eckard, R.J. Simulated seasonal responses of grazed dairy pastures to nitrogen fertilizer in SE Australia: N loss and recovery. Agric. Syst. 2020, 182, 102847. [Google Scholar] [CrossRef]
- Bell, L.W.; Moore, A.D.; Thomas, D.T. Diversified crop-livestock farms are risk-efficient in the face of price and production variability. Agric. Syst. 2021, 189, 103050. [Google Scholar] [CrossRef]
- Guerschman, J.P.; Van Dijk, A.I.J.M.; Mattersdorf, G.; Beringer, J.; Hutley, L.B.; Leuning, R.; Pipunic, R.C.; Sherman, B.S. Scaling of potential evapotranspiration with MODIS data reproduces flux observations and catchment water balance observations across Australia. J. Hydrol. 2009, 369, 107–119. [Google Scholar] [CrossRef]
- Van Niel, T.G.; McVicar, T.R.; Li, L. Generating Continuous 25 m 8-Day Actual Evaporation Grids Using Spatio-Temporal Blending of Landsat and MODIS Data for the Darwin Catchments; CSIRO: Sandy Bay, Australia, 2017. [CrossRef]
- Stewart, S.B.; O’Grady, A.P.; Mount, R.; England, J.; Opie, K.; Roxburgh, S.; Ware, C.; Scheufele, G.; McVicar, T.; Van Niel, T.; et al. Experimental Natural Capital Accounts for the Forestry Industry in the Green Triangle; Report to Forests and Wood Products Australia and Department of Agriculture, Water and the Environment as part of the Rural Research for Development and Profit Program (Project Number RnD4Profit-16-03-003); CSIRO: Sandy Bay, Australia, 2021; 193p.
- McVicar, T.R.; Van Niel, T.G.; Li, L. Remote Sensing of Land-Use-Specific Actual Evapotranspiration of Entire Catchments Containing Plantations. Forest and Wood Products Australia Project Number PNC286-1112. Report. 2017. Available online: https://www.fwpa.com.au/images/resources/-2017/Final_Report_PNC286-1112.pdf (accessed on 9 December 2021).
- Crosbie, R.S.; Davies, P.; Harrington, N.; Lamontagne, S. Ground truthing groundwater-recharge estimates derived from remotely sensed evapotranspiration: A case in South Australia. Hydrogeol. J. 2015, 23, 335–350. [Google Scholar] [CrossRef]
- White, D.A.; McGrath, J.F.; Ryan, M.G.; Battaglia, M.; Mendham, D.S.; Kinal, J.; Downes, G.M.; Crombie, D.S.; Hunt, M.E. Managing for water-use efficient wood production in Eucalyptus globulus plantations. For. Ecol. Manag. 2014, 331, 272–280. [Google Scholar] [CrossRef]
- Knowles, A.E. Aspects of the Nutrition and Physiology of Eucalyptus Globulus. Ph.D. Thesis, University of Tasmania, Hobart, Australia, 2007; 225p. [Google Scholar]
- Smethurst, P.J.; Nambiar, E.K.S. Role of weeds in the management of nitrogen in a young Pinus radiata plantation. New For. 1989, 3, 203–224. [Google Scholar] [CrossRef]
- Smethurst, P.J.; Nambiar, E.K.S. An appraisal of the in situ soil-core technique for measuring nitrogen uptake by a young Pinus radiata plantation. Soil Biol. Biochem. 1989, 21, 939–942. [Google Scholar] [CrossRef]
- Woods, P.V.; Nambiar, E.K.S.; Smethurst, P.J. Effect of annual weeds on water and nitrogen availability to Pinus radiata trees in a young plantation. For. Ecol. Manag. 1992, 48, 145–163. [Google Scholar] [CrossRef]
- Sands, R.; Nambiar, E.S. Water relations of Pinus radiata in competition with weeds. Can. J. For. Res. 1984, 14, 233–237. [Google Scholar] [CrossRef]
- May, B.; Smethurst, P.; Carlyle, C.; Mendham, D.; Bruce, J.; Baillie, C. Review of Fertiliser Use in Australian Forestry. Forest and Wood Products Australia Report PRC072-0708; Melbourne, Australia. 2009. Available online: https://www.fwpa.com.au/images/processing/PRC072-0708_Fertiliser_Review_Research_Report_0.pdf (accessed on 9 December 2021).
- Luedeling, E.; Smethurst, P.J.; Baudron, F.; Bayala, J.; Huth, N.I.; van Noordwijk, M.; Ong, C.K.; Mulia, R.; Lusiana, B.; Muthuri, C.; et al. Field-scale modeling of tree–crop interactions: Challenges and development needs. Agric. Syst. 2016, 142, 51–69. [Google Scholar] [CrossRef]
- Smethurst, P.J.; Huth, N.I.; Masikati, P.; Sileshi, G.W.; Akinnifesi, F.K.; Wilson, J.; Sinclair, F. Accurate crop yield predictions from modelling tree-crop interactions in gliricidia-maize agroforestry. Agric. Syst. 2017, 155, 70–77. [Google Scholar] [CrossRef] [Green Version]


| Site Attribute | Shallow Site | Deep Site |
|---|---|---|
| Latitude | −37.3615 | −37.8842 |
| Longitude | 140.6730 | 140.9497 |
| Elevation (m) | 57 | 45 |
| Mean daily temperature (C) a | 14.27 | 13.87 |
| Mean annual precipitation (mm) a | 613 | 818 |
| Mean annual pan evaporation (mm) a | 1350 | 1290 |
| Soil Taxonomy | Alfasol | Spodic quartzipsamment |
| Australian Soil Classification | Sodosol grey | Arenosol grey |
| Previous landuse | Pasture | Uncertain |
| Year planted | 2000 | 1947 |
| Silviculture | E. globulus Labill. | P. radiata D.Don |
| establishment weed control, fertilized at age 4 years, unthinned, unpruned | no weed control, fertilizer at planting, thinned, pruned | |
| Plantation Measurements: | ||
| Year measured | 2010 | 1984 |
| Stocking initial, final (stems ha−1) | 1164, 873 | 1600 b, 162 |
| Average tree height (m) | 28.4 | 37 |
| Basal area (1.3 m heightover-bark, m2 ha−1) | 32.1 | 33.9 |
| Volume (stem woodunder-bark m3 ha−1) | 316 | 756 c |
| MAIub (stem woodunder-bark m3 ha−1 year−1) | 31.6 | 20.4 c |
| Attribute | Shallow Site: | Deep Site: | ||
|---|---|---|---|---|
| APSIM | SLGA | APSIM | SLGA | |
| C (%, 0–15 cm) | 1.93 a | 2.47 | 1.20 a | 4.96 |
| C:N (0–15 cm) | 12.5 a | 32.2 | 29.0 a | 39.2 |
| pH (0–15 cm) | 5.89 a | 5.39 | 6.10 a | 4.95 |
| Total profile depth (m) | 10 | 2 | 30.0 | 2 |
| Maximum root depth (m) | 10 | 22.9 | ||
| Depth to aquifer (m) | 4 a | 23.0 a | ||
| PAWC b,c (mm) | 895 | 1427 | ||
| Initial available water c (mm) | 627 | 1198 | ||
| Initial profile mineral-N c (kg ha−1) | 36 | 36 | ||
Publisher’s Note: MDPI stays neutral with regard to jurisdictional claims in published maps and institutional affiliations. |
© 2022 by the authors. Licensee MDPI, Basel, Switzerland. This article is an open access article distributed under the terms and conditions of the Creative Commons Attribution (CC BY) license (https://creativecommons.org/licenses/by/4.0/).
Share and Cite
Smethurst, P.J.; McVicar, T.R.; Huth, N.I.; Bradshaw, B.P.; Stewart, S.B.; Baker, T.G.; Benyon, R.G.; McGrath, J.F.; Van Niel, T.G. Nitrate Uptake from an Aquifer by Two Plantation Forests: Plausibility Strengthened by Process-Based Modelling. Forests 2022, 13, 184. https://doi.org/10.3390/f13020184
Smethurst PJ, McVicar TR, Huth NI, Bradshaw BP, Stewart SB, Baker TG, Benyon RG, McGrath JF, Van Niel TG. Nitrate Uptake from an Aquifer by Two Plantation Forests: Plausibility Strengthened by Process-Based Modelling. Forests. 2022; 13(2):184. https://doi.org/10.3390/f13020184
Chicago/Turabian StyleSmethurst, Philip J., Tim R. McVicar, Neil I. Huth, Ben P. Bradshaw, Stephen B. Stewart, Thomas G. Baker, Richard G. Benyon, John F. McGrath, and Thomas G. Van Niel. 2022. "Nitrate Uptake from an Aquifer by Two Plantation Forests: Plausibility Strengthened by Process-Based Modelling" Forests 13, no. 2: 184. https://doi.org/10.3390/f13020184
APA StyleSmethurst, P. J., McVicar, T. R., Huth, N. I., Bradshaw, B. P., Stewart, S. B., Baker, T. G., Benyon, R. G., McGrath, J. F., & Van Niel, T. G. (2022). Nitrate Uptake from an Aquifer by Two Plantation Forests: Plausibility Strengthened by Process-Based Modelling. Forests, 13(2), 184. https://doi.org/10.3390/f13020184