Abstract
As an important nonwood bioresource, fishscale bamboo (Phyllostachys heteroclada Oliver) is widely distributed in the subtropical region of China. Rhombic-spot disease, caused by Neostagonosporella sichuanensis, is one of the most serious diseases that threatens fishscale bamboo health. However, there is limited knowledge about how rhombic-spot disease influences the diversity and structures of phyllosphere fungal communities. In this study, we investigated the phyllosphere fungal communities from stems, branches, and leaves of fishscale bamboo during a rhombic-spot disease outbreak using 18S rRNA sequencing. We found that only the phyllosphere fungal community from stems was significantly affected by pathogen invasion in terms of community richness, diversity, and structure. FUNGuild analysis revealed that the major classifications of phyllosphere fungi based on trophic modes in stems, branches, and leaves changed from symbiotroph-pathotroph, no obvious dominant trophic mode, and symbiotroph to saprotroph, saprotroph–pathotroph–symbiotroph, and saprotroph–symbiotroph, respectively, after pathogen invasion. The fungal community composition of the three tissues displayed significant differences at the genus level between healthy and diseased plants. The associations among fungal species in diseased samples showed more complex co-occurrence network structures than those of healthy samples. Taken together, our results highlight the importance of plant pathological conditions for the assembly of phyllosphere fungal communities in different tissues.
1. Introduction
The phyllosphere is composed of aerial parts of plants, such as leaves, stems, flowers, buds, and fruits [1,2]. Phyllosphere microorganisms (mainly bacteria, filamentous fungi, yeast, algae, etc.) are some of the most important components of microbial communities on Earth [3]. These microorganisms contain both epiphytic microorganisms inhabiting plant tissue surfaces and endophytic microorganisms living asymptomatically within plant tissues [3]. Epiphytic microorganisms mainly rely on nutrients deposited on plant tissues from the atmosphere or those exudates from tissues, while endophytic microorganisms absorb nutrients from host tissues [4]. A number of studies using either traditional culture-dependent methods or high-throughput sequencing technologies have shown that the phyllosphere bacterial community basically consists of the bacterial phyla Proteobacteria, Actinobacteria, and Bacteroidetes across different plant species [5,6,7]. However, less is known about fungi, although there have been studies analyzing the fungal community in the phyllosphere of different plant species (e.g., Arabidopsis, wheat, rice, maize, Populus, and tropical mangrove) [4,8,9,10,11,12].
Different from the relatively weak and buffered fluctuations of environmental conditions in the rhizosphere, the phyllosphere is a complex, extreme, and unstable habitat that is frequently challenged by several stress factors, such as temperature, humidity, UV radiation, and limited nutrient availability [13,14,15,16,17]. In addition to these abiotic stress factors, biotic stress factors, mainly pathogens and insects, also affect phyllosphere microbial changes [18,19,20]. Several studies have shown that the indigenous phyllosphere microbiome of leaves shifted as a consequence to pathogen attack [21,22,23,24]. For example, Suda et al. (2009) [22] found that powdery mildew infection resulted in larger bacterial populations, greater diversity and richness, and also changed the structure of the phyllosphere bacterial community. Similarly, angular leaf spot infection affected the phyllosphere fungal communities of cucumber leaves, all diversity indices of which exhibited a trend of increasing first and then decreasing, as shown by Illumina MiSeq sequencing [24]. However, researchers have mostly focused on leaves, while the changes in the phyllosphere microbial community in other tissues, such as stems and branches, after pathogen infection are still yet to be fully explored [18]. The lack of such information will hinder or even mislead predictions about the changes of phyllosphere microbial diversity, community structure, and function after infection by a pathogen. Therefore, it is necessary to improve our understanding of the changes of phyllosphere microbial communities of stems, branches, and leaves with plant pathological status.
Fishscale bamboo (Phyllostachys heteroclada Oliver), belonging to the family Bambuso-ideae (Graminales, Gramineae, Bambusoideae, Phyllostachys, monopodial bamboo), favors warm and humid climate and is widely cultivated in the Yellow River and Yangtze River basins of China [25]. Due to its strong adaptability, fast growth, and subterranean stems (viz. rhizomes), it plays a crucial role in ecological protection and restoration applications. In addition, because of its wide distribution, high yield, and good flexibility as well as the use of bamboo shoots for consumption and bamboo asphalt for Chinese medicine, P. heteroclada has been regarded as an economically important bamboo species [26,27,28]. Pathogens and insects are crucial drivers of tree mortality and forest dynamics [29], and their damage is normally limited by host resistance and environmental conditions limiting disease emergence [30]. However, plant disease outbreaks are increasing in the context of global climate change [31]. In recent years, a new disease, rhombic-spot disease, caused by Neostagonosporella sichuanensis and reported by C.L. Yang, X.L. Xu and K.D. Hyde (Ascomycota, Dothideomycetes, Pleosporales, Phaeosphaeriaceae), was first discovered in Ya’an City, Sichuan Province. It is one of the major diseases of P. heteroclada that results in extensive damage to fishscale bamboo forests [32,33]. Infected plants have restricted growth or even die in severe cases [33]. At present, the influences of the phyllosphere fungal community by rhombic-spot disease are unknown.
Studying the changes of phyllosphere fungi in the stem, branch, and leaf tissues of fishscale bamboo after infection by rhombic-spot disease might help us understand the changes in phyllosphere microbes from different tissues under pathogen stress from a new perspective. Therefore, in this study, we hypothesized that phyllosphere fungal communities change after pathogen invasion and that competition between indigenous fungal colonization and pathogens occurs. We randomly collected the healthy and diseased stems, branches, and leaves from fishscale bamboo located in three bamboo forests of Ya’an City, Sichuan Province. We aimed to characterize the phyllosphere fungal community of fishscale bamboo using Illumina HiSeq sequencing and studied the effects of rhombic-spot disease on the phyllosphere fungal community compositions. We also compared the main differences in trophic modes using FUNGuild analysis and the associations among fungal species via molecular ecological network analysis in stems, branches, and leaves with and without rhombic-spot symptoms.
2. Materials and Methods
2.1. Site Description, Sample Collection, and Processing
Samples were collected from three fishscale bamboo forests, including Shangli Town (103°7′6.00″ E, 30°12′16.25″ N, alt. 961 m), Zhougongshan Town (103°2′59.87″ E, 29°50′8.56″ N, alt. 1133 m), and Yanchang Town (103°4′44.40″ E, 29°43′33.95″ N, alt. 951 m) in Ya’an City (known as “Rain City” and “Sky Leak” due to the abundant rainfall), Sichuan Province, and Southwest China, respectively. All sites are characterized by a subtropical wet monsoon climate, with average annual temperature of 14.1–17.9 °C and an annual mean precipitation of approximately 1250–1800 mm. The annual variation of temperature and humidity in each sample plot is basically the same (Figures S1 and S2).
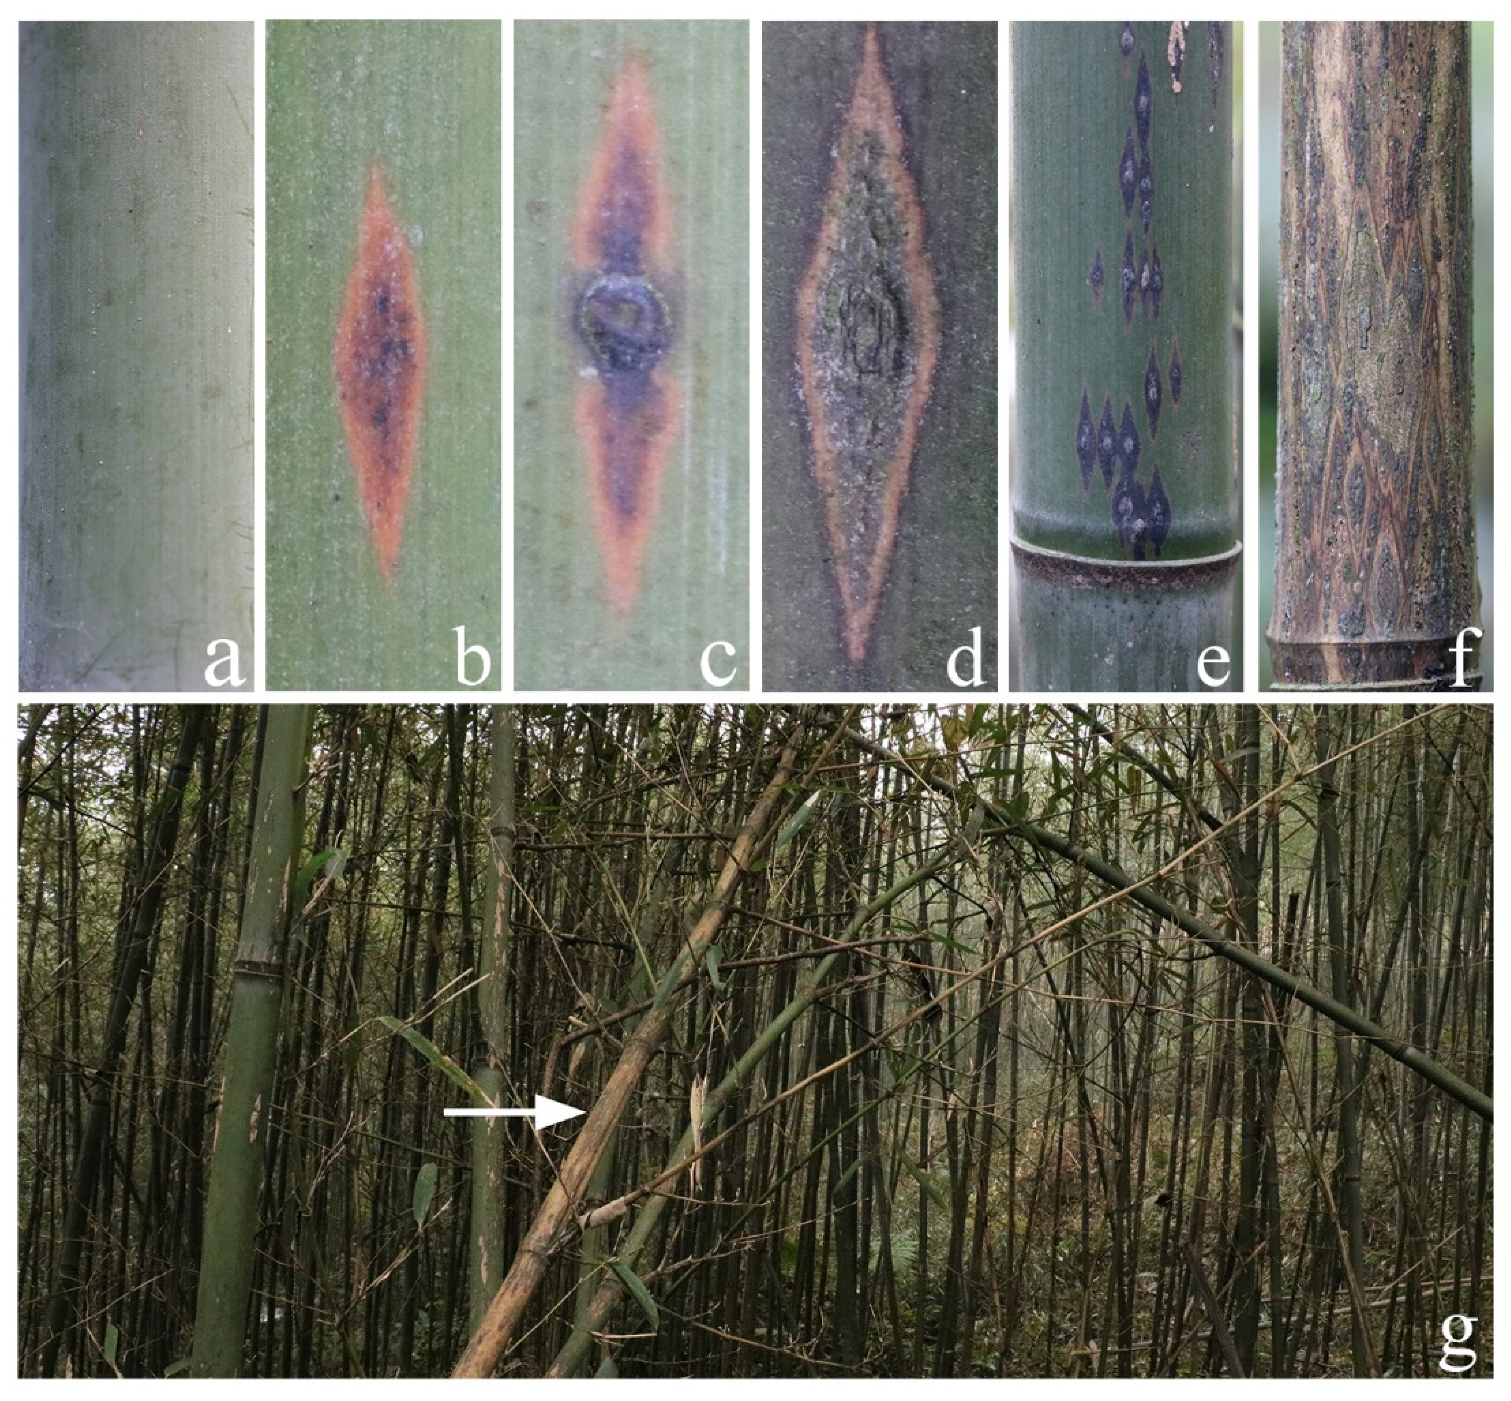
In our previous study, we summarized the occurrence regularity of rhombic-spot disease through continuous field observation [33]. From November to April, small brown or dark brown lesions were formed on the windward side of fishscale bamboo stems, branches, and exposed rhizomes (Figure 1a). Then, the small lesions gradually expanded and evolved into diamond-shaped, nearly diamond-shaped, oval, or irregular lesions, which were often connected into one piece or scattered (Figure 1e). Subsequently, ascomas formed in the center of the lesions (Figure 1b,c). Mature ascospores spread mainly through wind and rain. During this period, the conidia of the pathogen were formed and spread together with the ascospores. Generally, February to April is the major outbreak period. From May to October, the pathogen is mainly latent in the host diseased tissue in the form of mycelia and conidia. Based on this, we collected samples on 7 April 2017, during the major outbreak period of the disease.
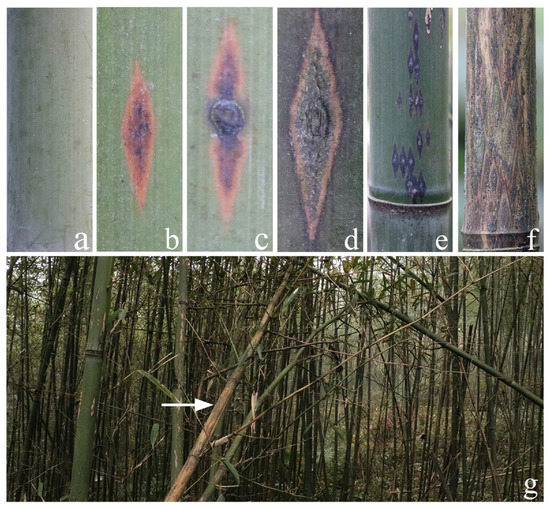
Figure 1.
(a) The healthy stem. (b–d) Lesions at different stages of onset infected by rhombic-spot disease. (e) Lesions that connect into one piece or scatter around living bamboo. (f) Lesions that connect into one piece or scatter around dead bamboo. (g) Overall picture of the bamboo forest after infection. The white arrow points to the dead fishscale bamboo.
First, we defined three healthy and diseased zones from each sample plot. The healthy zones were those in which no plants showing rhombic-spot symptoms were found, and diseased zones (disease incidence > 90%) were also defined. Healthy and diseased zones were randomly distributed across the field. Then, 5 plant individuals of each zone, including healthy bamboo and bamboo severely diseased by N. sichuanensis (25% ≤ the proportion of lesion area every stem or branch ≤ 50%), were collected using a five-point sampling method [34]. Subsequently, 10 stems, branches, and leaves were randomly collected from each plant individual, and 5 plant individuals from the same zone were combined as a replicate. In total, 54 plant samples were collected (3 replicates × 3 positions (stem, branch, and leaf) × 2 pathological conditions × 3 plots).
All the samples were immediately put into sterile plastic bags, labelled, and transferred to the laboratory in an ice box. They were stored at −80 °C until further processing. Samples were processed as previously reported [24,35,36], with minor modifications. The samples were cut into small segments and immersed in 100 mL of sterile distilled PBS (0.1% Tween 80). After vigorous shaking at 30 °C for 180 rpm for 4 h, the resulting cell suspension was filtered with a 5 μm filter membrane and centrifuged at 4 °C at 12,000 rpm to collect the precipitate, which was stored in liquid nitrogen until DNA extraction.
2.2. DNA Extraction, PCR Amplification, and Illumina Sequencing
Total genomic DNA extraction was performed using the CTAB/SDS method. The degree of DNA degradation and potential contamination were confirmed with 1% agarose gel electrophoresis. The DNA purity was controlled (A260/280 ranging from 1.8–2.0) using a NanoPhotometer® spectrophotometer (IMPLEN, Westlake Village, CA, USA), while the DNA concentration was checked (>50 ng/mL) using a Qubit® dsDNA Assay Kit in a Qubit® 2.0 Flurometer (Life Technologies, Westlake Village, CA, USA). The fungal internal transcribed spacer 1 (ITS1) region of rRNA was amplified with ITS5F (5′-GGAAGTAAAAGTCGTAACAAGG-3′) and ITS2R (5′-GCTGCGTTCTTCATCGATGC-3′) primers. The 30 μL PCR mixture consisted of 15 μL of Phusion® High-Fidelity PCR Master Mix (NEB, Waltham, MA, USA), 0.2 μM of each primer, and 10 ng of DNA template. The PCR procedure was set at 98 °C for 1 min, with 30 cycles of denaturation at 98 °C for 10 s, annealing at 50 °C for 30 s, and extension at 72 °C for 30 s, followed by a final extension at 72 °C for 5 min. A 1X loading buffer (containing SYBR green) was added to PCR products at an equal volume. Then, the PCR amplicon bands were detected by 2% agarose gel electrophoresis and purified using a GeneJET Gel Extraction Kit (Thermo Scientific, Waltham, MA, USA). One microgram of DNA for each sample was used as the input material for the DNA sample preparation. A sequencing library was generated by adding index codes to the product using the NEB Next® Ultra™ DNA Library Prep Kit for Illumina (NEB, USA) following the manufacturer’s instructions. The library was applied to an Illumina HiSeq platform for sequencing using 250 bp paired-end reads on a cBot Cluster Generation System (Illumina, Westlake Village, CA, USA) following the manufacturer’s recommendations.
2.3. Data Processing and Bioinformatics
After Illumina HiSeq sequencing, the paired-end raw reads were assigned to samples based on their unique barcodes and merged with the lowest overlap of 10 bp using the FLASH tool (version 1.2.7) [37]. The quality filtering of the raw fastq reads was processed using the Quantitative Insights into Microbial Ecology (QIIME) software package version 1.9.1 [38,39]. Chimera sequences were detected and removed through BLAST UNITE database (Version 8.2) using UCHIME version 11 [40,41]. Clustering of operational taxonomic units (OTUs) was carried out using pick_de_novo_otus.py at 97% similarity. Then, representative sequences for each OTU were picked, and taxonomic information was annotated for each representative sequence with the RDP classifier using UNITE database (Version 8.2) [42]. Finally, the OTUs with total counts in each sample less than 20 were deleted, and the OTUs rarified in each sample were used for subsequent analysis.
2.4. Statistical Analysis
To compute alpha diversity, we calculated the Chao1 and Shannon indices using Qiime (Version 1.9.1) [39]. The data were analyzed for normality using the Shapiro–Wilk test and were assessed by independent-sample t-test at 5% probability using the software IBM SPSS (Version 27.0). To determine the difference between fungal community structures, principal coordinate analysis (PCoA) was performed based on Bray–Curtis dissimilarity using the R (version 3.2) package phyloseq [43]. The significance of the fungal diversity under different pathological conditions was tested using MRPP, anosim, and permutational analysis of variance (PERMANOVA) using adonis with 999 permutations in the vegan package [44].
The relative abundance of phyllosphere dominant fungi at the class and genus level was drawn using Microsoft Excel 2019. The relative abundance of the healthy and diseased groups was log10 (lg) transformed, and then the differences between each group were assessed by performing the independent-sample t-test (p < 0.05) using the software IBM SPSS (Version 27.0). Heatmap clustering on the top 35 fungal relative abundance at the genus level among healthy and diseased samples was depicted using the pheatmap function in the pheatmap package version 1.0.8 [45]. FUNGuild (https://github.com/UMN FuN/FUNGuild, accessed on 22 June 2021) [46] was used to predict the functions of phyllosphere fungi from the stems, branches, and leaves in healthy and diseased fishscale bamboo.
To compare the differences in associations among fungal species in phyllosphere fungal communities from healthy and diseased samples, we constructed phylogenetic molecular ecological networks (MENs) using a random matrix theory (RMT)-based approach [47] in the molecular ecological network analysis pipeline (MENAP) (http://ieg4.rccc.ou. edu/mena/, accessed on 27 September 2021) [48]. Firstly, only the OTUs appearing in more than half the samples for each group were kept without log-transferring prior to obtaining the Pearson correlation matrix. Then, we chose a cutoff with the highest p value for the similarity matrix to construct the network. Finally, the network plots were visualized with Cytoscape software 3.9.0 [49].
3. Results
3.1. Characterization of Illumina Sequencing Data
Illumina sequencing of the 18S rRNA gene produced a total of 4,036,483 reads from the 54 samples. After removing the low-quality data, connectors, and barcode sequences, 3,901,914 high-quality sequences remained. These sequences were clustered into 2593 different OTUs at a 97% sequence similarity level. Of the 2593 OTUs, 2568 were identified as fungi. The fungi represented included 1482 Ascomycotes, 662 Basidiomycotes, 15 Mortierellomycotes, 8 Rozellomycotes, 7 Chytridiomycotes, 5 Mucoromycotes, 3 Glomer-omycotes, 1 Olpidiomycote, 1 Blastocladiomycote, and 384 unknown fungi (Table S1). At this sequencing depth, each rarefaction curve for the observed OTUs had reached an asymptote, suggesting that the quantity of sequencing data was reasonable (Figure S3).
3.2. Effects of Rhombic-Spot Pathogen Invasion on the Phyllosphere Fungal Community Diversity and Structure of Fishscale Bamboo
The Chao1 (Figure 2a) and Shannon (Figure 2b) indices were significantly (df = 9, F = 16.582 and 4.370, p < 0.001 and p < 0.05, respectively) lower in the healthy stems than in the diseased stems. In contrast, no significant differences were found between healthy and diseased branches (df = 9, F = 0.798 and 1.712, p > 0.05) or between healthy and diseased leaves (df = 9, F = 0.750 and 0.346, p > 0.05), although the two diversity indices were higher in the diseased samples than in the healthy samples.
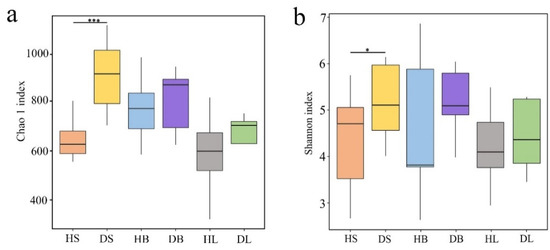
Figure 2.
Operational taxonomic unit (OTU) richness, diversity, and structure of phyllosphere fungi from healthy and diseased stems, branches, and leaves. (a) Richness. (b) Diversity. Note: HS, stem samples from healthy fishscale bamboo; DS, stem samples from diseased fishscale bamboo; HB, branch samples from healthy fishscale bamboo; DB, branch samples from diseased fishscale bamboo; HL, leaf samples from healthy fishscale bamboo; DL, leaf samples from diseased fishscale bamboo. * indicates that the difference between HS and DS was significant at 0.05; *** indicates that the difference between HS and DS was significant at 0.001.
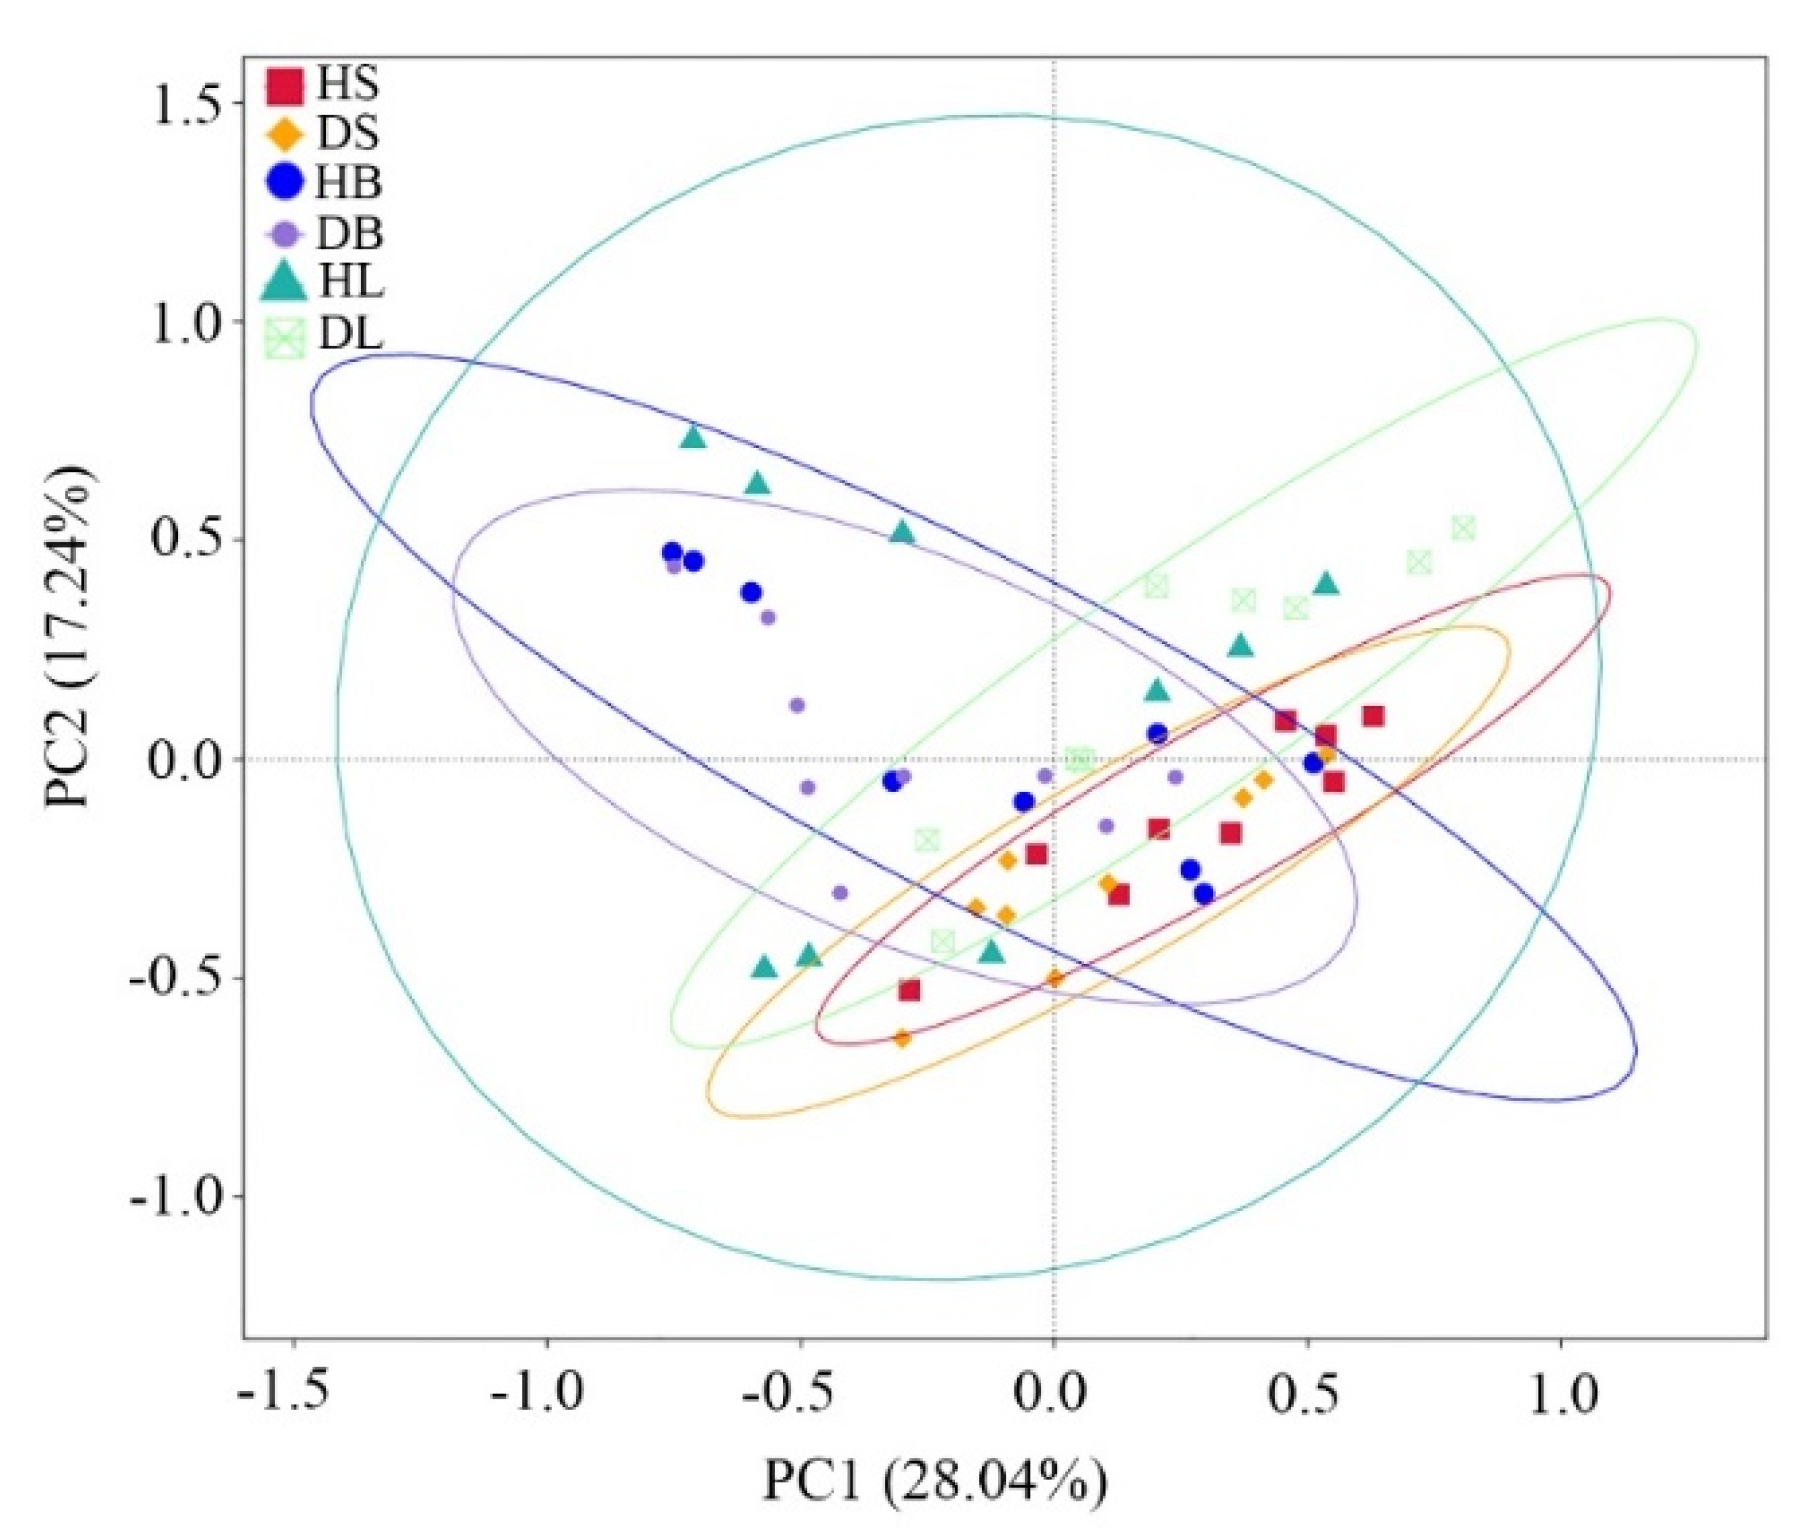
PCoA using Bray–Curtis dissimilarity showed that the first two principal coordinates (PC1 + PC2) explained 45.28% of the total variance (Figure 3). The results showed that the phyllosphere fungal communities in the stem, branch, and leaf tissues barely changed between healthy and diseased samples. The nonparametric multivariate statistical tests (MRPP, adonis, and anosim) indicated that the fungal communities in the stems significantly (p = 0.01, 0.02, and 0.03, respectively) changed between healthy and diseased samples, while few differences (p > 0.05) were observed between healthy and diseased branches or between healthy and diseased leaves (Table 1).
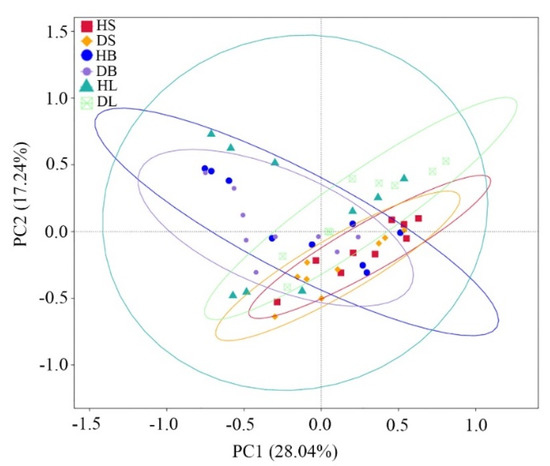
Figure 3.
Principal coordinate analysis (PCoA) based on Bray–Curtis distance of the phyllosphere fungal community dissimilarities in healthy and diseased stems, branches, and leaves.

Table 1.
The dissimilarity of the fungal community composition in the phyllosphere of three different groups.
3.3. Effects of Rhombic-Spot Pathogen Invasion on the Phyllosphere Fungal Community Compositions of Fishscale Bamboo
Across all samples, Ascomycota was the predominant fungal phylum and accounted for 37% to 66% of the total reads (Table S2). At the class level, three classes (Dothideomycetes, Sordariomycetes, and Tremellomycetes) dominated in all healthy and diseased samples, with varying relative abundances (Figure 4a). The community compositions at this level varied between healthy and diseased group in the same tissue, but most of them had no significance. Only the Dothideomycetes in the diseased stems, the unidentified_Pezizomycotina in the diseased branches, and the Lecanoromycetes in diseased leaves were significantly (df = 16, t = 2.902, 3.628, and 2.912, respectively, p < 0.05) more abundant than the corresponding healthy samples.
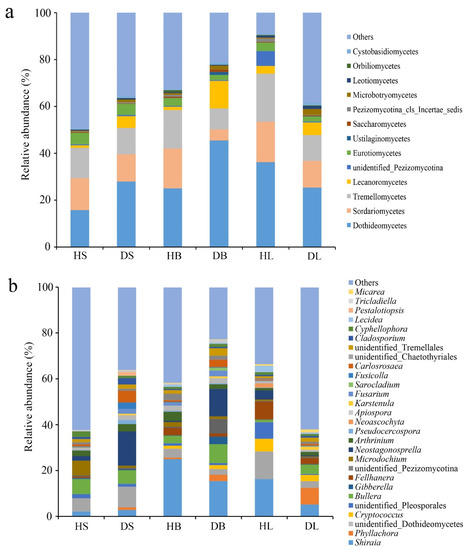
Figure 4.
Relative abundance of fungi at the class (a) and genus (b) levels in the healthy and diseased stem, branch, and leaf tissue samples. The fungal class and genus representing < 1% of the total composition were classified as “others”.
The fungal genus compositions across different samples were highly diverse (Figure 4b). The relative abundance of Neostagonosporella was significantly higher in the diseased stems and branches than in the healthy samples (p < 0.001). Interestingly, its abundance in the diseased leaves compared to healthy ones was significantly lower (p < 0.05). In addition, several fungal genera were significantly different between healthy and diseased stems. Three genera, unidentified Pezizomycotina (df = 16, t = 3.063, p < 0.05), Neoascochya (df = 16, t = 4.449, p < 0.001), and Lecidea (df = 16, t = 3.549, p < 0.05) were enriched in the healthy samples, and the others were more abundant in the diseased samples, including Phyllachora (df = 16, t = 4.072, p < 0.05), Arthrinium (df = 16, t = 5.051, p < 0.001), Apiospora (df = 16, t = 2.561, p < 0.05), and Carlosrosaea (df = 16, t = 2.262, p < 0.05). However, the relative abundances of only one genus, Phyllachora were significantly (p < 0.05) higher in the diseased branches than in the healthy samples. On the other hand, the decreases in the numbers of unidentified Pleosporales (df = 16, t = 2.265, p < 0.05), Apiospora (df = 16, t = 2.259, p < 0.05), and Lecidea (df = 16, t = 4.868, p < 0.001) in the diseased leaves were significant. In contrast, the numbers of Phyllachora (df = 16, t = 2.745, p < 0.05), Bullera (df = 16, t = 2.329, p < 0.05), Fellhanera (df = 16, t = 2.236, p < 0.05), and Carlosrosaea (df = 16, t = 5.269, p < 0.001) increased significantly in the diseased leaves.
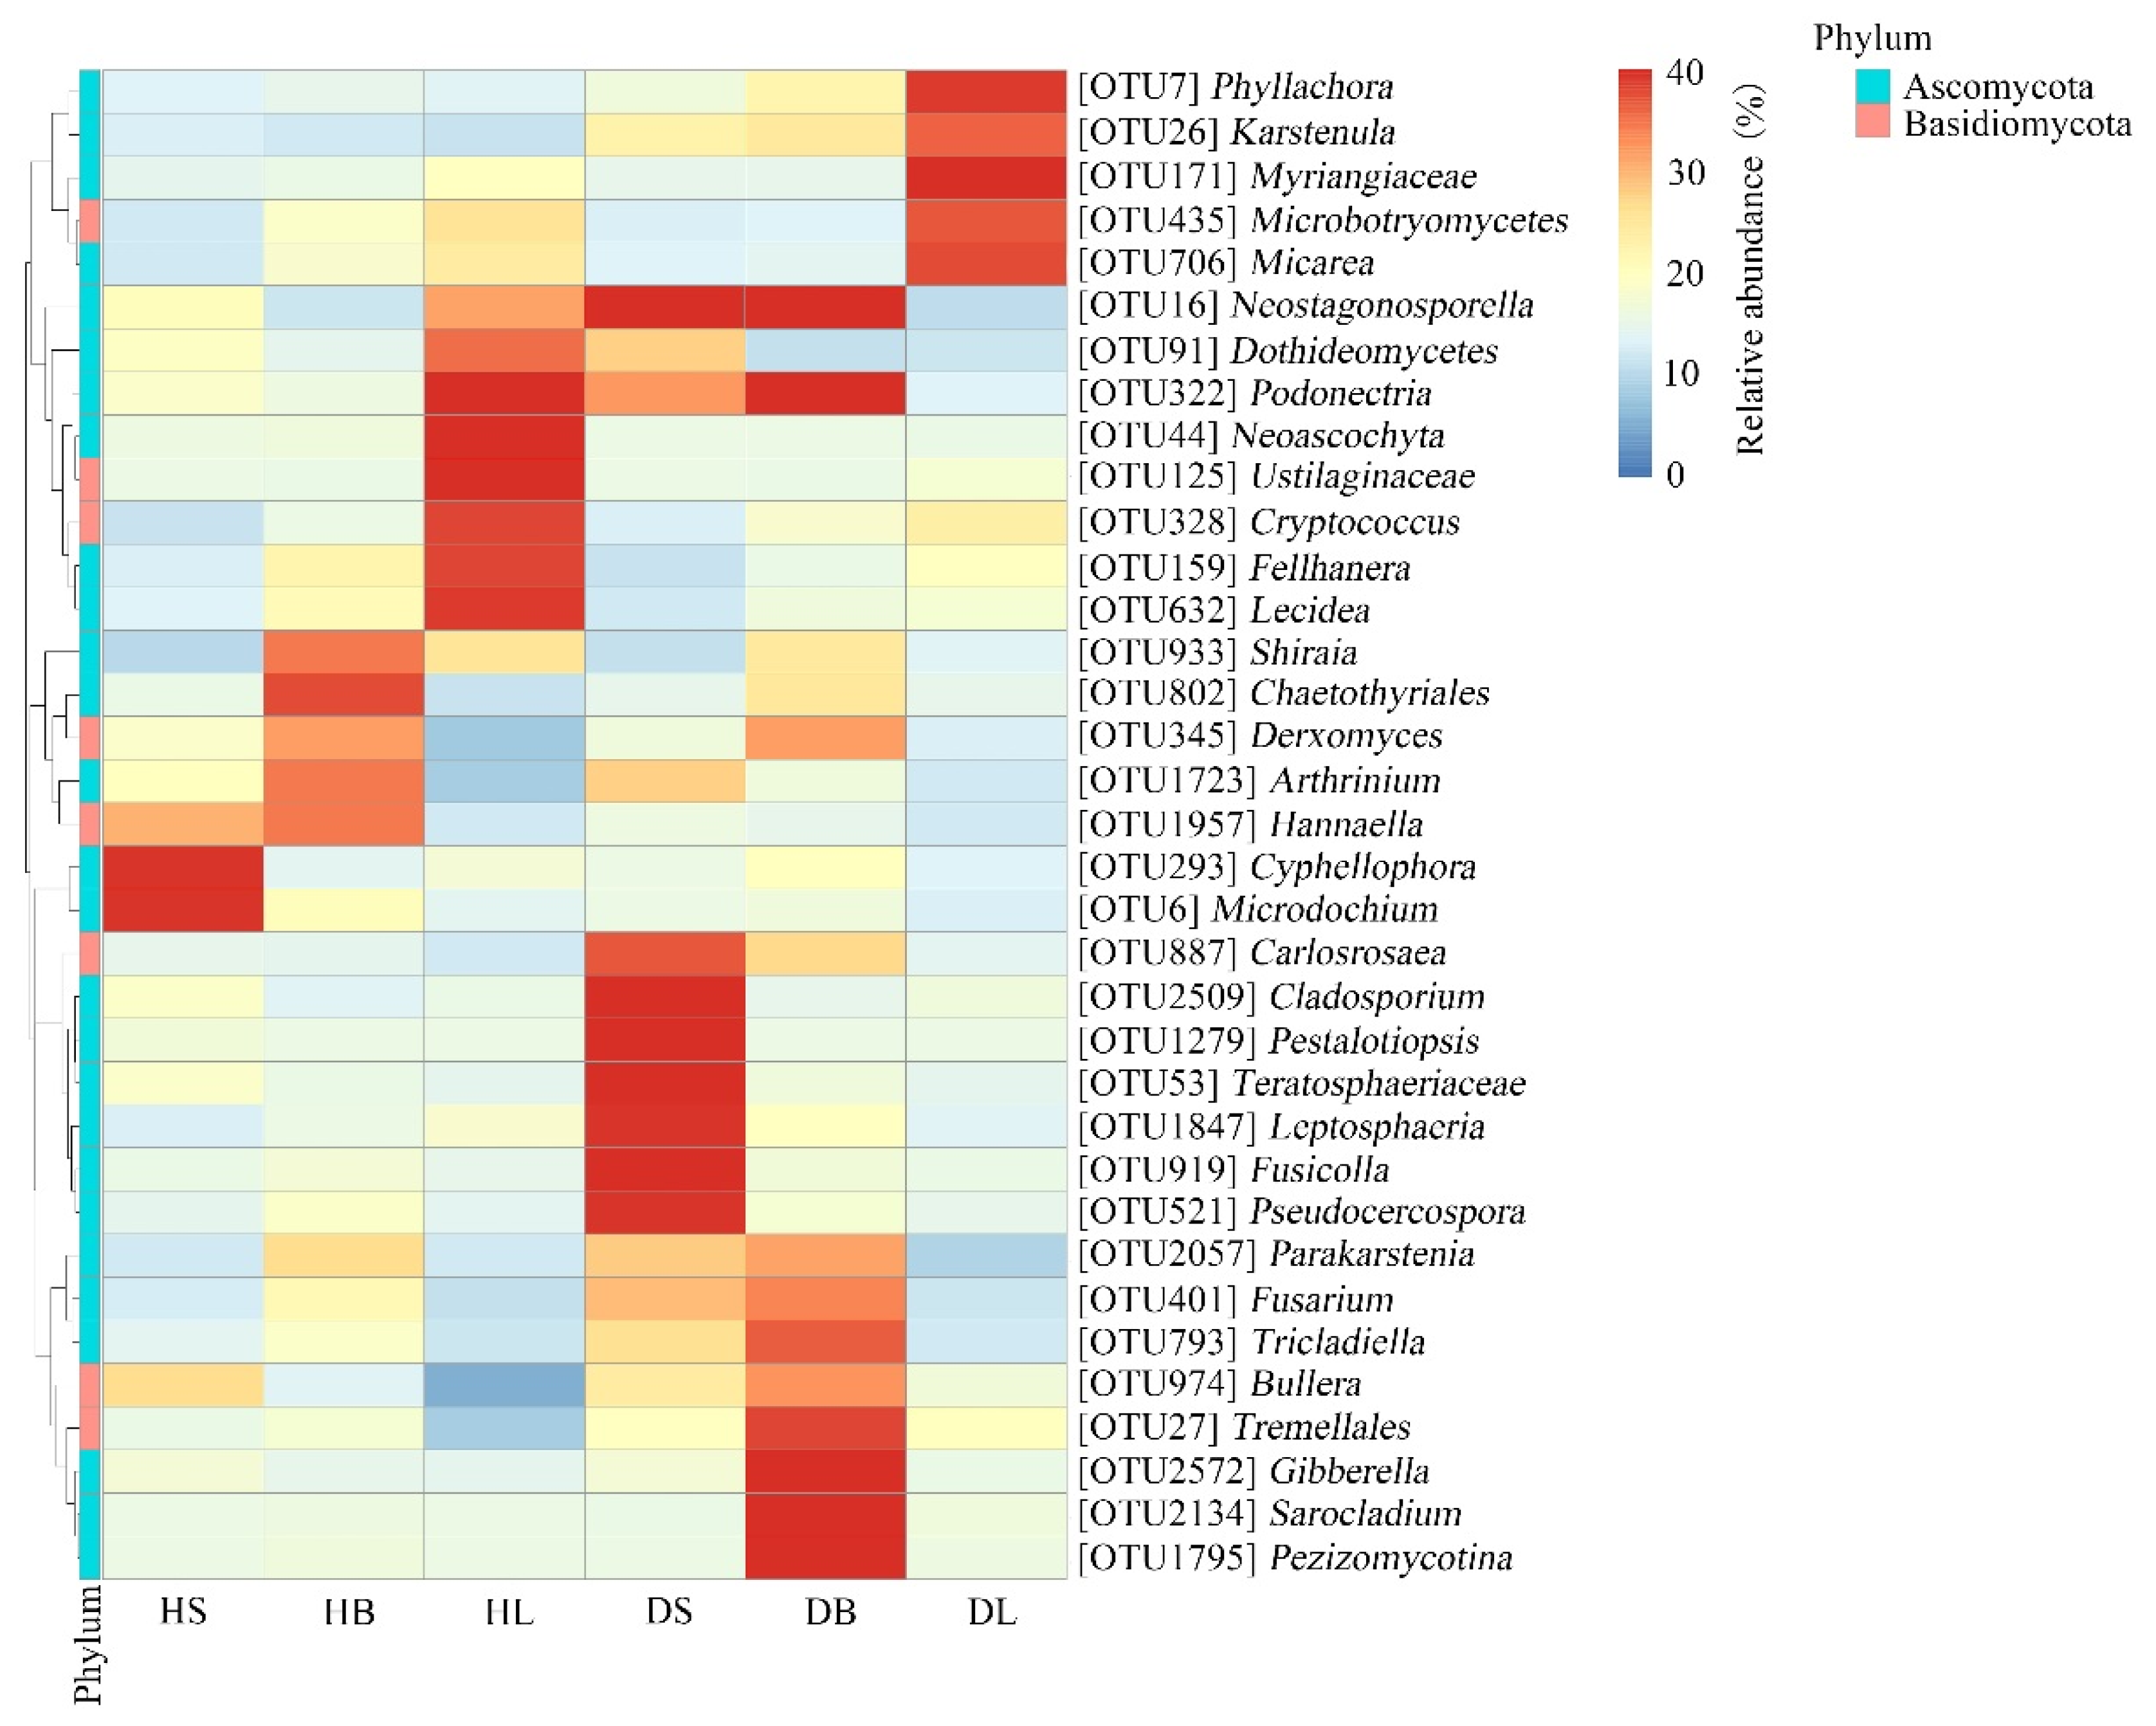
The taxa heatmap indicated that the occurrence of some relatively abundant phyllosphere fungal OTUs was biased among different tissues (Figure 5). For example, among healthy host tissues, two OTUs (Cyphellophora OTU293 and Microdochium OTU6) were distributed mainly in the healthy stem samples, one OTU (Chaetothyriales OTU802) occurred mainly in the healthy branch samples, and five OTUs (Neoascochyta OTU44, Ustilaginaceae OTU125, Cryptococcus OTU328, Fellhanera OTU159, and Lecidea OTU632) were present mainly in the healthy leaf samples. In addition, after infection, the distribution of relative fungal OTUs in the same tissue changed significantly. For example, two OTUs (Cyphellophora OTU293 and Microdochium OTU6) existed mainly in the healthy stems, while seven OTUs (Carlosrosaea OTU887, Cladosporium OTU2509, Pestalotiopsis OTU1279, Teratosphaeriaceae OTU53, Leptosphaeria OTU1847, Fusicolla OTU919, and Pseudocercospora OTU521) occurred mainly in the diseased stems. Our previous experiment showed that the main pathogen of rhombic-spot disease on fishscale bamboo is N. sichuanensis. In this experiment, the data showed that after infection, the relative abundance of Neostagonosporella in the stems and branches increased significantly. Interestingly, the relative abundance of the pathogen in the leaves decreased greatly (Figure 5).
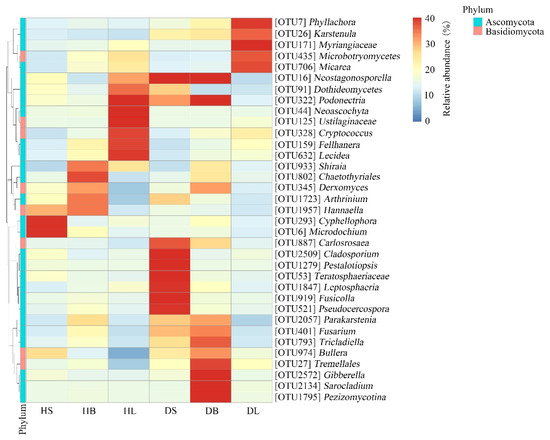
Figure 5.
Heatmap clustering of the distribution of relatively abundant phyllosphere fungal OTUs in the healthy and diseased tissues (stems, branches, and leaves). The color of each heatmap cell represents the relative abundance of the corresponding phyllosphere fungal OTUs. Cluster analysis was based on the Bray–Curtis method.
3.4. FUNGuild Analysis
FUNGuild analysis was used to predict the nutritional modes and functional groups of the fungal communities from the healthy and diseased stem, leaf, and branch tissues of fishscale bamboo. The results showed that the phyllosphere fungi can be classified into eight trophic mode groups, with varying relative abundances (Figure 6a). For stem tissues, pathotroph–symbiotroph dominated in the healthy samples, whereas saprotroph showed the most enriched abundance in the diseased samples. Although there was no obvious dominant trophic mode in the healthy branch tissues, pathotroph–saprotroph–symbiotroph was the main trophic mode in the diseased branches. In addition, the leaf samples from healthy bamboo were mainly composed of symbiotrophs, while the saprotroph–symbiotroph group dominated the leaf samples from diseased bamboo.
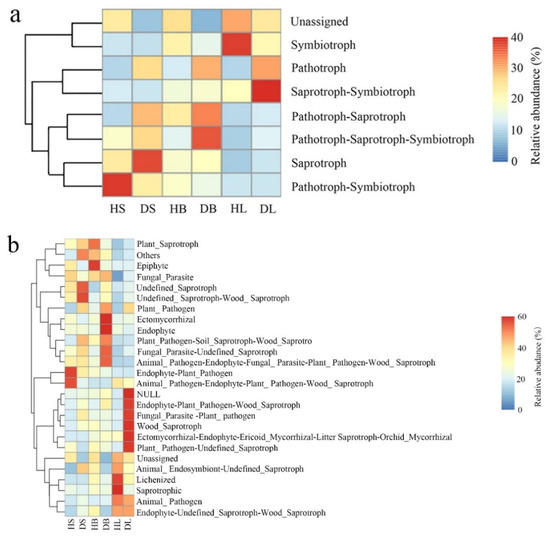
Figure 6.
Relative abundance of predicted nutritional modes of phyllosphere fungi in stem, branch, and leaf tissue samples of healthy and diseased fishscale bamboo. (a) Relative abundance of trophic modes. (b) Relative abundance of fungal guilds.
On the other hand, the relative abundance of fungi in different tissues was represented by 26 fungal guild groups (Figure 6b). In general, the fungal guild group abundance varied in different samples. For example, healthy stem tissues were abundantly composed of endophyte–plant pathogen and animal pathogen–endophyte–plant pathogen–wood saprotroph guilds, while undefined saprotroph and undefined saprotroph–wood saprotroph guilds dominated the diseased stem samples. Two guild groups (lichenized and saprotrophic guilds) were predominant in the leaf tissues from healthy samples, and six guild groups (NULL, endophyte-plant pathogen–wood saprotroph, fungal parasite-plant pathogen, wood saprotroph, ectomycorrhizal–endophyte–ericoid mycorrhizal, litter saprotroph–orchid mycorrhizal, and plant pathogen-undefined saprotroph guilds) mainly occurred in the leaf samples from diseased bamboo.
3.5. The Species Associations among Fungal Communities
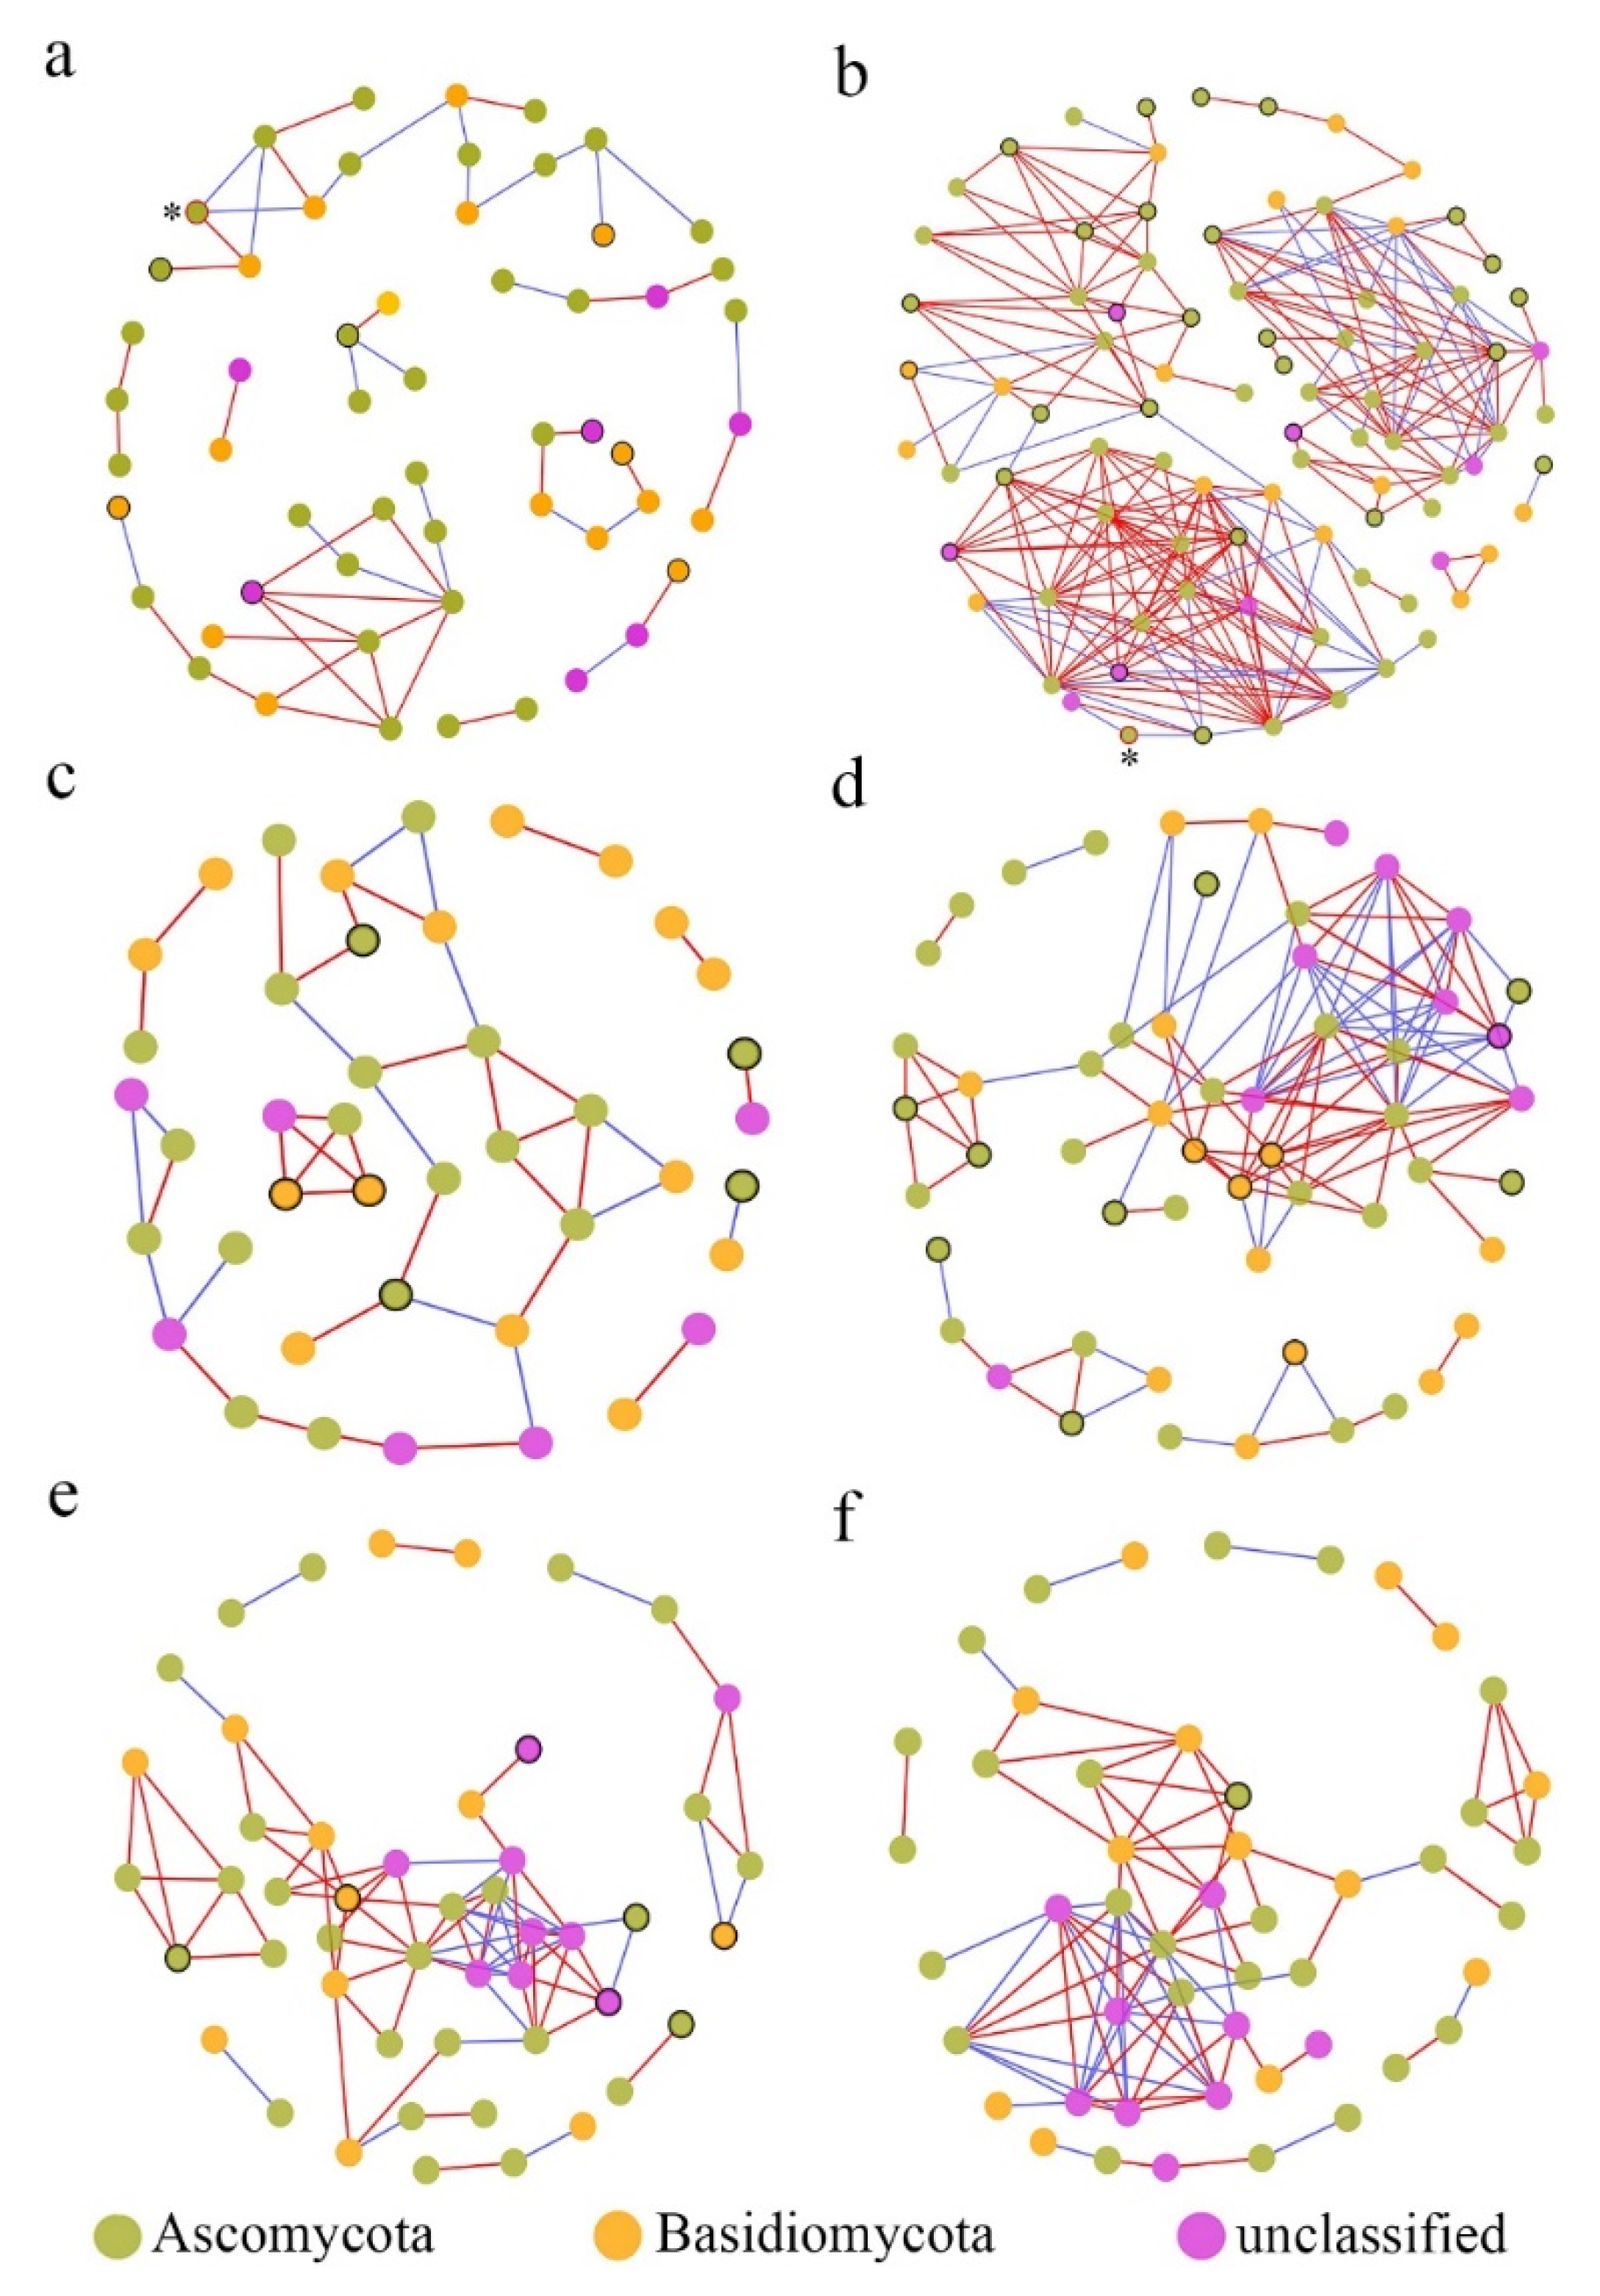
In the fungal co-occurrence network structures of phyllosphere fungi, the diseased samples showed higher complexity and more connections than those of healthy samples (Table 2), which indicated that the network structures tended to be more complex and closer under pathogen pressure. For instance, the number of network nodes and links in diseased stems was 87 and 256, respectively, and only 56 and 53 in healthy stems. However, the total number of nodes and links was not obviously different between healthy leaves (49 nodes, 83 links) and diseased samples (49 nodes, 86 links), possibly revealing that the network structure of the phyllosphere fungi from leaf samples was barely affected by pathogen invasion. On the other hand, the number of network modules decreased after pathogen invasion (Table 2). For example, the number of modules was 11 in the healthy stem samples and only 7 in the corresponding diseased samples. This also suggested that the fungi were associated more closely with diseased samples than with healthy samples [24]. Furthermore, the average clustering coefficients (avgCCs) (0.089–0.504) of the empirical network of all samples were higher than those of the corresponding random network (0.02–0.131), indicating that the six networks constructed had typical small-world network characteristics [50]. The modularity values of all empirical networks (0.496–0.799) were obviously higher than those (0.326–0.730) of the corresponding random networks, suggesting that the constructed network had modular topology characteristics [51]. Visual networks were constructed to display the associations among fungal species in the fungal communities of healthy and diseased samples using Cytoscape software, as shown in Figure 7. In general, there were obviously more complex network topological structures of the investigated phyllosphere fungal zones in the diseased stem and branch tissues than in the corresponding healthy samples, while there were few differences in the network structure between healthy and diseased leaf samples. In addition, we found that the pathogen Neostagonosporella appeared only in the fungal interaction network structure of healthy and diseased stems.
Table 2.
Topological features of the phyllosphere fungal community networks in healthy and diseased samples.
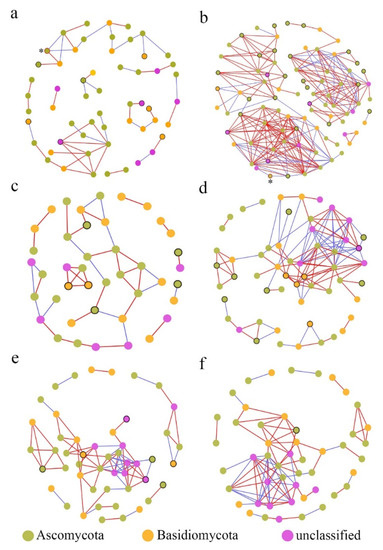
Figure 7.
Molecular ecological networks of fungal associations in the fungal communities of healthy and diseased samples. (a) Stem samples from diseased fishscale bamboo. (b) Stem samples from diseased fishscale bamboo. (c) Branch samples from healthy fishscale bamboo. (d) Branch samples from diseased fishscale bamboo. (e) Leaf samples from healthy fishscale bamboo. (f) Leaf samples from diseased fishscale bamboo. Node colors indicate phylum-level taxonomy. Red links indicate positive correlations between nodes, and blue links indicate negative correlations between nodes. Circles marked by black borders in healthy samples represent OTUs that disappeared after onset, and those in diseased samples represent newly emerged OTUs after onset. Circles marked by red borders and * represent the pathogen Neostagonosporella.
According to the disappearance or emergence of new OTUs from the same tissues in the networks under pathogen invasion (Figure 7 and Table 3), the number of saprotrophic fungal genera, including Fusicolla, Penicillium, Rhinocladiella, and Aspergillus, and potential pathotrophic fungal genera, including Clonostachys, Genolevuria, Fusarium, and Botrytis, significantly increased in stem tissue samples. Moreover, in branch samples, the potential pathotrophic fungal genera also significantly increased. Interestingly, some potential pathogens in the leaves disappeared, and few new fungi appeared after the bamboo was infected.
Table 3.
Disappeared/emerged new OTUs of the phyllosphere fungal community networks after pathogen invasion from the same tissues.
4. Discussion
4.1. Phyllosphere Fungal Richness, Diversity, and Community Structure of Fishscale Bamboo Stem Tissues Were Highly Changed by Rhombic-Spot Infection
There is a large number of microbes residing on the phyllosphere surfaces of plants, which can prevent the outgrowth of bacterial and fungal pathogens [1]. However, many factors, such as susceptible host genotype and age as well as adverse environmental factors (e.g., high temperature, high humidity, and freezing injury) may provide an opportunity for the pathogen to colonize the phyllosphere [3].
Studies have indicated that successful infection by pathogens changed the fungal diversity and community structure of the phyllosphere [24,34,35, 52]. In this study, we investigated the richness and diversity of phyllosphere fungi from healthy and rhombic-spot infected stems, branches, and leaves of fishscale bamboo. Both the Chao and Shannon–Wiener indices showed that the richness and diversity significantly increased only in the stem tissues of diseased plants compared to the corresponding healthy samples. Nevertheless, although the two indices were higher, no obvious differences were noticed in the diseased branches or leaves compared with the corresponding healthy samples. In addition, the PCoA analysis and dissimilarity test revealed significant difference in the fungal community structure between the healthy and diseased stems. These results suggested that rhombic-spot pathogen caused an increase in the fungal community richness, diversity, and a significant difference in structure. We found that the rhombic-spot pathogen mainly infected fishscale bamboo stems, branches, and exposed rhizomes through our previous field observations [33]. A possible reason for the richness and diversity significant increase in the stems is that the bamboo stem tissues were infected and destroyed by the pathogen and more microorganisms entering these tissues.
Studies have suggested the fungal richness and diversity showed different changes at different fungal disease severities [35,52]. For example, the fungal community richness and diversity increased first and then declined with powdery mildew infection [39]. Unfortunately, the association between these indices of phyllosphere and disease severities is unclear. In our study, we chose only one onset stage, when the proportion of lesion area on every stem or branch was approximately 25–50%. In addition, the sample plants were severely diseased, but they did not exhibit withered symptoms at this stage. Therefore, it is necessary to continue to study the effects of different damage levels of rhombic-spot infection on the phyllosphere microbes from different tissues of fishscale bamboo in future studies.
4.2. Healthy and Diseased Fishscale Bamboo Harbored Distinct Phyllosphere Fungal Taxonomic and Functional Compositions
Many previous studies on other plants showed that Ascomycota was the most abundant phylum in the phyllosphere community of leaves [1,4,21,24,53]. In our study, we found that Ascomycota was the most prevalent phylum associated with all tissue samples, including healthy stems, branches, and leaves, which might indicate that phyllosphere fungal phylotypes of different plant tissues are consistent at the phylum level.
The relative abundance of the dominant phyllosphere fungal genera indicated that the healthy and diseased fishscale bamboo enriched distinct fungal members. More potential pathogenic genera were enriched in the diseased stems and branches. The potential pathogen genera were enriched significantly in the diseased stems, including Neostagonosporella, Phyllachora [54], and Arthrinium [55], whereas a potential pathogen genus (Neoascochyta [56]), and a symbiotic fungi genus (Lecidea [57]) were significantly enriched in the healthy stem samples. The relative abundance of two potential pathogen genera (Neostagonosporella and Phyllachora) significantly increased in the diseased branches, but no fungi were significantly enriched in the healthy branches compared to the corresponding diseased samples. The same result was also found in a previous study on the rhizosphere fungal genera members between the healthy and diseased plants [58]. Interestingly, the higher antifungal members (Bullera [59] and Carlosrosaea [60]) were found in the diseased leaves, and the enriched potential pathogenic genus shifted from Arthrinium to Phyllachora.
On the other hand, the results of heatmap clustering for the relative abundance of the dominant phyllosphere fungal OTUs were in line with the above results, in which more potential pathogenic genera were enriched in the diseased stems and branches. The number of potential pathogens with dominant positions increased in the three tissues after rhombic-spot pathogen invasion. Specifically, these potential pathogens included Cladosporium [61], Pestalotiopsis [62], Leptosphaeri [63], and Pseudocercospora [64] in diseased stems; Fusarium, Gibberella [65], and Sarocladium [66] in diseased branches; and Phyllachora in diseased leaves. Conversely, only one potential pathogen, Microdochium [67], in healthy stems was distributed with a relatively high percentage, and no possible pathogen dominated in healthy branches or leaves, except for unidentified genera. These results indicated that the immune systems of fishscale bamboo tissues were possibly damaged by successful colonization and growth of the pathogen, which may provide opportunities for the colonization of other potential pathogens.
The changes in the phyllosphere community attacked by pathogens may occur through microbe–microbe interactions or altered plant defense responses [2]. In this study, according to FUNGuild analysis, we observed high proportions of saprotroph and saprotroph–pathotroph–symbiotroph groups in diseased stems and branches, respectively, whereas the diseased leaves were dominated by a saprotroph–symbiotroph group. This might be explained by the successful rhombic-spot pathogen invasion of stems and branches leading to the destruction of the plant’s defense system and partial tissue necrosis. Saprotrophs are the predominant decomposers of dead or weak plants and play a crucial role in decomposing organisms and energy and nutrient cycling [68]. Therefore, we presumed that the diseased tissue structure of fishscale bamboo was severely degraded, wounds were exposed, and nutrients were leaked, which caused the abundance of saprotroph and saprotroph–pathotroph–symbiotroph groups in diseased fishscale bamboo stems and branches, respectively, to increase. This may also be why the diversity of phyllosphere fungi in diseased fishscale bamboo stems and branches increased.
4.3. Fungal Co-Occurrence Network Characteristics Were Highly Correlated with Pathological Conditions of Fishscale Bamboo
Molecular ecological network (MEN) analysis based on random matrix theory has been increasingly employed to reflect potential microbial associations in various ecosystems because of its strong robustness and consistency [69,70]. Generally, a more complex network means a more stable community structure [71,72]. In our study, the network associations among phyllosphere fungi from three different tissue samples of healthy and diseased fishscale bamboo were analyzed and visualized. The results showed that the phyllosphere fungal co-occurrence networks of diseased samples had higher complexity and more links than those of the healthy samples in the stem, branch, and leaf components, indicating that the invasion of rhombic-spot pathogen changed the composition of the phyllosphere fungal community and further strengthened the associations among species in the fungal community. Furthermore, we found that the variety of potential pathogens or saprophytes clearly increased in the stems and branches, indicating that more potential pathogens or saprophytes were involved in constructing new and more stable phyllosphere fungal interaction network structures of stem and branch tissues, which might aggravate the spread of diseases. On the other hand, previous studies have revealed that positive and negative interactions usually mean mutualism and competition under environmental stress [48,73]. In our results, the pathogen Neostagonosporella appeared only in the fungal interaction network structures of healthy and diseased stems. In addition, for healthy stems, the pathogen coexisted with the genera Microdochium and Carlosrosaea but competed with Hannaella. Studies have shown that Hannaella has a plant-growth-promoting trait [74,75], indicating that Hannaella might have an antagonistic effect on the pathogen. For the diseased stems, there were no fungi that directly competed with the pathogen. Moreover, two fungi, the potential pathogen Fusarium and the unidentified fungi, coexist with Neostagonosporella, suggesting that the successful invasion of the pathogen breaks the inherent competitive relationship and forms a more stable relationship with the new fungi.
5. Conclusions
This study provides the first example of research comparing the diversity, nutritional modes, composition structures, and network associations of phyllosphere fungal communities in healthy and rhombic-spot infected stem, branch, and leaf tissues of fishscale bamboo using high-throughput DNA sequencing techniques. Significant differences in phyllosphere fungal richness and diversity were observed between healthy and diseased stems, although the richness and diversity were higher also in the diseased branches or leaves than in the corresponding healthy samples. Moreover, the diseased stems and branches were dominated by saprotroph and saprotroph–pathotroph–symbiotroph groups, respectively, whereas a high proportion of the saprotroph–symbiotroph group was identified in the diseased leaves compared to the corresponding healthy samples. After pathogen invasion, the variety of potential pathogen genera increased, and some of them occupied important positions in the fungal co-occurrence network structures. In addition, the competitive relationships among fungal species in the diseased stem and branch samples were more complex and stable than those of healthy samples, while there were few differences between healthy and diseased leaf samples under rhombic-spot pathogen stress. Our findings may help us to understand host plant-specific fungal community structures and show how these communities change under rhombic-spot pathogen stress. This may be a starting reference for research on the associations of microorganisms in phyllosphere fungal communities of different tissues.
Supplementary Materials
The following supporting information can be downloaded at: https://www.mdpi.com/article/10.3390/f13020185/s1. Figure S1. Dynamics of temperature in various sites (the number on the horizontal axis represents the monthly average temperature). Figure S2. Dynamics of relative humidity in various sites (the number on the horizontal axis represents the monthly average relative humidity). Figure S3. Rarefaction curves in healthy and diseased stem, branch, and leaf tissues associated with fishscale bamboo, clustering at 97% sequence similarity. HS, stem samples from healthy fishscale bamboo; DS, stem samples from diseased fishscale bamboo; HB, branch samples from healthy fishscale bamboo; DB, branch samples from diseased fishscale bamboo; HL, leaf samples from healthy fishscale bamboo; DL, leaf samples from diseased fishscale bamboo. Table S1. Fungal molecular identification in healthy and diseased stems, branch, and leaf tissues associated with fishscale bamboo at a 97% sequence identity level. Table S2. Relative abundance of phyllosphere fungi at the phylum level in healthy and diseased stems, branch, and leaf tissues of fishscale bamboo.
Author Contributions
Conceptualization, L.L. (Lijuan Liu); methodology, L.L. (Lijuan Liu) and Y.L. (Yinggao Liu); validation, L.L. (Lijuan Liu), C.Y., X.X., X.W., M.L., F.T. and Y.L. (Yinggao Liu); formal analysis, L.L. (Lijuan Liu); investigation, C.Y., X.X., X.W., M.L., R.C. and F.T.; resources, Y.L. (Yinggao Liu); data curation, L.L. (Lijuan Liu) and Y.L. (Yinggao Liu); writing—original draft preparation, L.L. (Lijuan Liu); writing—review and editing, L.L. (Lijuan Liu), C.Y., T.L., Y.L. (Yufeng Liu) and Y.L. (Yinggao Liu); visualization, C.Y. and X.X.; supervision, Y.L. (Yinggao Liu); project administration, L.L. (Lijuan Liu). All authors have read and agreed to the published version of the manuscript.
Funding
This research received no external funding.
Acknowledgments
We would like to thank the Forestry Bureau of Yucheng District, Ya’an City, for their help in sample collection.
Conflicts of Interest
The authors declare no conflict of interest.
References
- Liu, H.W.; Brettell, L.E.; Singh, B. Linking the phyllosphere microbiome to plant health. Trends Plant Sci. 2020, 25, 841–844. [Google Scholar] [CrossRef] [PubMed]
- Koskella, B. The phyllosphere. Curr. Biol. 2020, 30, R1143–R1146. [Google Scholar] [CrossRef] [PubMed]
- Chen, T.; Nomura, K.; Wang, X.L.; Sohrabi, R.; Xu, J.; Yao, L.Y.; Paasch, B.C.; Ma, L.; Kremer, J.; Cheng, Y.T.; et al. A plant genetic network for preventing dysbiosis in the phyllosphere. Nature 2020, 508, 7850. [Google Scholar] [CrossRef] [PubMed]
- Yao, H.; Sun, X.; He, C.; Maitra, P.; Li, X.C.; Guo, L.D. Phyllosphere epiphytic and endophytic fungal community and network structures differ in a tropical mangrove ecosystem. Microbiome 2019, 7, 57. [Google Scholar] [CrossRef] [Green Version]
- Kinkel, L.L. Microbial population dynamics on leaves. Annu. Rev. Phytopathol. 1997, 35, 327–347. [Google Scholar] [CrossRef]
- Bai, Y.; Muller, D.B.; Srinivas, G.; Garrido-Oter, R.; Potthoff, E.; Rott, M.; Dombrowski, N.; Munch, P.C.; Spaepen, S.; Remus-Emsermann, M.; et al. Functional overlap of the Arabidopsis leaf and root microbiota. Nature 2015, 528, 364–369. [Google Scholar] [CrossRef]
- Wagner, M.R.; Lundberg, D.S.; Del Rio, T.G.; Tringe, S.G.; Dangl, J.L.; Mitchell-Olds, T. Host genotype and age shape the leaf and root microbiomes of a wild perennial plant. Nat. Commun. 2016, 7, 12151. [Google Scholar] [CrossRef] [Green Version]
- Horton, M.W.; Bodenhausen, N.; Beilsmith, K.; Meng, D.Z.; Muegge, B.D.; Subramanian, S.; Vetter, M.M.; Vilhjalmsson, B.J.; Nordborg, M.; Gordon, J.I.; et al. Genome-wide association study of Arabidopsis thaliana leaf microbial community. Nat. Commun. 2014, 5, 5320. [Google Scholar] [CrossRef]
- Sapkota, R.; Jørgensen, L.N.; Nicolaisen, M. Spatiotemporal variation and networks in the mycobiome of the wheat canopy. Front. Plant Sci. 2017, 8, 1357. [Google Scholar] [CrossRef] [Green Version]
- Agler, M.T.; Ruhe, J.; Kroll, S.; Morhenn, C.; Kim, S.T.; Weigel, D.; Kemen, E.M. Microbial hub taxa link host and abiotic factors to plant microbiome variation. PLoS Biol. 2016, 14, e1002352. [Google Scholar] [CrossRef] [Green Version]
- Wagner, M.R.; Roberts, J.H.; Balint-Kurti, P.; Holland, J.B. Heterosis of leaf and rhizosphere microbiomes in field-grown maize. New Phytol. 2020, 228, 1055–1069. [Google Scholar] [CrossRef] [PubMed]
- Busby, P.E.; Peay, K.G.; Newcombe, G. Common foliar fungi of Populus trichocarpa modify Melampsora rust disease severity. New Phytol. 2016, 209, 1681–1692. [Google Scholar] [CrossRef] [PubMed] [Green Version]
- Jumpponen, A.; Jones, K.L. Massively parallel 454 sequencing indicates hyperdiverse fungal communities in temperate Quercus macrocarpa phyllosphere. New Phytol. 2009, 184, 438–448. [Google Scholar] [CrossRef]
- Perreault, R.; Laforest-Lapointe, I. Plant-microbe interactions in the phyllosphere: Facing challenges of the anthropocene. ISME J. 2021. [Google Scholar] [CrossRef] [PubMed]
- Kumar, J.; Babele, P.K.; Singh, D.; Kumar, A. UV-B radiation stress causes alterations in whole cell protein profile and expression of certain genes in the rice phyllospheric bacterium Enterobacter cloacae. Front. Microbiol. 2016, 7, 1440. [Google Scholar] [CrossRef]
- Bulgarelli, D.; Schlaeppi, K.; Spaepen, S.; Ver Loren van Themaat, E.; Schulze-Lefert, P. Structure and functions of the bacterial microbiota of plants. Annu. Rev. Plant Biol. 2013, 64, 807–838. [Google Scholar] [CrossRef] [Green Version]
- Vorholt, J.A. Microbial life in the phyllosphere. Nat. Rev. Microbiol. 2012, 10, 828–840. [Google Scholar] [CrossRef]
- Gong, T.Y.; Xin, X.F. Phyllosphere microbiota: Community dynamics and its interaction with plant hosts. J. Integr. Plant Biol. 2021, 63, 297–304. [Google Scholar] [CrossRef]
- Humphrey, P.T.; Whiteman, N.K. Insect herbivory reshapes a native leaf microbiome. Nat. Ecol. Evol. 2020, 4, 221–229. [Google Scholar] [CrossRef]
- Bulgari, D.; Casati, P.; Quaglino, F.; Bianco, P.A. Endophytic bacterial community of grapevine leaves influenced by sampling date and phytoplasma infection process. BMC Microbiol. 2014, 14, 198. [Google Scholar] [CrossRef] [Green Version]
- Erlacher, A.; Cardinale, M.; Grosch, R.; Grube, M.; Berg, G. The impact of the pathogen Rhizoctonia solani and its beneficial counterpart Bacillus amyloliquefaciens on the indigenous lettuce microbiome. Front. Microbiol. 2014, 5, 175. [Google Scholar] [CrossRef] [PubMed] [Green Version]
- Suda, W.; Nagasaki, A.; Shishido, M. Powdery mildew-infection changes bacterial community composition in the phyllosphere. Microbes Environ. 2009, 24, 217–223. [Google Scholar] [CrossRef] [PubMed] [Green Version]
- Zhang, Z.; Kong, X.; Jin, D.; Yu, H.; Zhu, X.; Su, X.F.; Wang, P.; Zhang, R.Y.; Jia, M.H.; Deng, Y. Euonymus japonicus phyllosphere microbiome is significantly changed by powdery mildew. Arch. Microbiol. 2019, 201, 1099–1109. [Google Scholar] [CrossRef] [PubMed]
- Luo, L.Y.; Zhang, Z.; Wang, P.; Han, Y.Q.; Jin, D.C.; Su, P.; Tan, X.Q.; Zhang, D.Y.; Muhammad-Rizwan, H.; Lu, X.Y.; et al. Variations in phyllosphere microbial community along with the development of angular leaf-spot of cucumber. ABM Expr. 2019, 9, 76. [Google Scholar] [CrossRef] [PubMed] [Green Version]
- Lin, X.J.; Wu, G.J.; Xu, J.H. Study on Witchs’ broom of fishscale bamboo I. symptoms and pathogens. J. Cent. South For. Univ. 1987, 7, 133–138. [Google Scholar]
- Janzen, D.H. Why bamboos wait so long to flower? Annu. Rev. Ecol. Syst. 1976, 7, 347–391. [Google Scholar] [CrossRef]
- Artero, M.L.; Sharma, R.; Savin, V.J.; Vincenti, F. Plasmapheresis reduces proteinuria and serum capacity to injure glomeruli in patients with recurrent focal glomerulosclerosis. Am. J. Kidney Dis. 1994, 23, 574–581. [Google Scholar] [CrossRef]
- Franklin, D.C. Synchrony and asynchrony: Observations and hypotheses for the flowering wave in a long lived semelparous bamboo. J. Biogeogr. 2014, 31, 773–786. [Google Scholar] [CrossRef]
- Simler-Williamson, A.B.; Rizzo, D.M.; Cobb, R.C. Interacting effects of global change on forest pest and pathogen dynamics. Annu. Rev. Ecol. Evol. Syst. 2019, 50, 381–403. [Google Scholar] [CrossRef]
- Welsh, C.; Lewis, K.; Woods, A. The outbreak history of Dothistroma needle blight: An emerging forest disease in northwestern British Columbia, Canada. Can. J. For. Res. 2009, 39, 2505–2519. [Google Scholar] [CrossRef]
- Ristaino, J.B.; Anderson, P.K.; Bebber, D.P.; Brauman, K.A.; Cunniffe, N.J.; Fedoroff, N.V.; Finegold, C.; Garrett, K.A.; Gilligan, C.A.; Jones, C.M.; et al. The persistent threat of emerging plant disease pandemics to global food security. Proc. Natl. Acad. Sci. USA 2021, 118, e2022239118. [Google Scholar] [CrossRef] [PubMed]
- Yang, C.L.; Xu, X.L.; Wanasinghe, D.N.; Jeewon, R.; Phookamsak, R.; Liu, Y.G.; Liu, L.J.; Hyd, K.D. Neostagonosporella sichuanensis gen. et sp. nov. (Phaeosphaeriaceae, Pleosporales) on Phyllostachys heteroclada (Poaceae) from Sichuan Province, China. Mycokeys 2019, 46, 119–150. [Google Scholar] [CrossRef] [PubMed]
- Qi, R.H.; Yang, C.L.; Li, L.; Liu, C.; Xu, X.L.; Liu, Y.F.; Zeng, Q.; Liu, L.J.; Liu, Y.G. Pathogenic characteristics biological characteristics and drug control test of pathogen causing rhombic-spot of Phyllostachys Heteroclada. J. Northeas. For. Univ. 2021, 49, 19–24. [Google Scholar]
- Zhang, Y.; Han, M.Z.; Song, M.N.; Tian, J.; Song, B.Z.; Hu, Y.J.; Zhang, J.; Yao, Y.C. intercropping with aromatic plants increased the soil organic matter content and changed the microbial community in a pear orchard. Front. Microbiol. 2021, 12, 616932. [Google Scholar] [CrossRef] [PubMed]
- Zhang, Z.; Luo, L.Y.; Tan, X.Q.; Kong, X.; Yang, J.G.; Wang, D.H.; Zhang, D.Y.; Jin, D.C.; Liu, Y. Pumpkin powdery mildew disease severity influences the fungal diversity of the phyllosphere. PeerJ 2018, 6, 4559. [Google Scholar] [CrossRef] [Green Version]
- Nerva, L.; Pagliarani, C.; Pugliese, M.; Monchiero, M.; Gonthier, S.; Gullino, M.L.; Gambino, G.; Chitarra, W. Grapevine phyllosphere community analysis in response to elicitor application against powdery mildew. Microorganisms 2019, 7, 662. [Google Scholar] [CrossRef] [Green Version]
- Magoc, T.; Salzberg, S.L. FLASH: Fast length adjustment of short reads to improve genome assemblies. Bioinformatics 2011, 27, 2957–2963. [Google Scholar] [CrossRef]
- Bokulich, N.A.; Subramanian, S.; Faith, J.J.; Gevers, D.; Gordon, J.I.; Knight, R.; Mills, D.A.; Caporaso, J.G. Quality-filtering vastly improves diversity estimates from Illumina amplicon sequencing. Nat. Methods 2013, 10, 57–59. [Google Scholar] [CrossRef]
- Caporaso, J.G.; Kuczynski, J.; Stombaugh, J.; Bittinger, K.; Knight, R. QIIME allows analysis of high-throughput community sequencing data. Nat. Methods 2010, 7, 335–336. [Google Scholar] [CrossRef] [Green Version]
- Edgar, R.C.; Haas, B.J.; Clemente, J.C.; Quince, C.; Knight, R. UCHIME improves sensitivity and speed of chimera detection. Bioinformatics 2011, 27, 2194–2200. [Google Scholar] [CrossRef] [Green Version]
- Haas, B.J.; Gevers, D.; Earl, A.M.; Feldgarden, M.; Ward, D.V.; Giannoukos, G.; Ciulla, D.; Tabbaa, D.; Highlander, S.K.; Sodergren, E. Chimeric 16S rRNA sequence formation and detection in Sanger and 454-pyrosequenced PCR amplicons. Genome Res. 2011, 21, 494–504. [Google Scholar] [CrossRef] [PubMed] [Green Version]
- Wang, Q.; Garrity, G.M.; Tiedje, J.M.; Cole, J.R. Naive Bayesian classifier for rapid assignment of rRNA sequences into the new bacterial taxonomy. Appl. Environ. Microb. 2007, 73, 5261–5267. [Google Scholar] [CrossRef] [PubMed] [Green Version]
- McMurdie, P.J.; Holmes, S. phyloseq: An R package for reproducible interactive analysis and graphics of microbiome census data. PLoS ONE 2013, 8, e61217. [Google Scholar] [CrossRef] [Green Version]
- Oksanen, J.; Blanchet, F.G.; Kindt, R.; Legendre, P.; O’Hara, R.B.; Simpson, G.L.; Solymos, P.; Stevens, M.H.H.; Wagner, H. Vegan: Community Ecology Package. R Package Version 1.17-3. Available online: http://CRAN.R-project.org/package=vegan. (accessed on 22 June 2021).
- Kold, R. Pheatmap: Pretty Heatmaps. R Package Version 1.0.8. Available online: http://cran.rproject.org/package=pheatmap (accessed on 22 June 2021).
- Nguyen, N.H.; Song, Z.; Bates, S.T.; Branco, S.; Tedersoo, L.; Menke, J.; Schilling, J.S.; Kennedy, P.G. FUNGuild: An open annotation tool for parsing fungal community datasets by ecological guild. Fungal Ecol. 2016, 20, 241–248. [Google Scholar] [CrossRef]
- Deng, Y.; Jiang, Y.H.; Yang, Y.; He, Z.L.; Luo, F.; Zhou, J.Z. Molecular ecological network analyses. BMC Bioinform. 2012, 13, 113. [Google Scholar] [CrossRef] [PubMed] [Green Version]
- Deng, Y.; Zhang, P.; Qin, Y.J.; Tu, Q.C.; Yang, Y.F.; He, Z.L.; Schadt, C.W.; Zhou, J.Z. Network succession reveals the importance of competition in response to emulsified vegetable oil amendment for uranium bioremediation. Environ. Microbiol. 2016, 18, 205–218. [Google Scholar] [CrossRef] [PubMed]
- Otasek, D.; Morris, J.H.; Bouças, J.; Pico, A.R.; Demchak, B. Cytoscape Automation: Empowering workflow-based network analysis. Genome Biol. 2019, 20, 185. [Google Scholar] [CrossRef] [Green Version]
- Watts, D.J.; Strogatz, S.H. Collective dynamics of ’small-world’ networks. Nature 1998, 393, 440–442. [Google Scholar] [CrossRef]
- Newman, M.E.J. Modularity and community structure in networks. Proc. Natl. Acad. Sci. USA 2016, 103, 8577–8582. [Google Scholar] [CrossRef] [Green Version]
- Töpfer, N. Environment-coupled models of leaf metabolism. Biochem. Soc. Trans. 2021, 49, 119–129. [Google Scholar] [CrossRef]
- Griffiths, S.M.; Galambao, M.; Rowntree, J.; Goodhead, I.; Hall, J.; Brien, D.O.; Atkinson, N.; Antwis, R.E. Complex associations between cross-kingdom microbial endophytes and host genotype in ash dieback disease dynamics. J. Ecol. 2020, 108, 291–309. [Google Scholar] [CrossRef] [Green Version]
- Yang, C.L.; Xu, X.L.; Liu, Y.G.; Hyde, K.D.; Mckenzie, E.H.C. A new species of Phyllachora (Phyllachoraceae, Phyllachorales) on Phyllostachys heteroclada from Sichuan, China. Phytotaxa 2019, 392, 18. [Google Scholar] [CrossRef]
- Yan, H.; Jiang, N.; Liang, L.Y.; Yang, Q.; Tian, C.M. Arthrinium trachycarpum sp. nov. from Trachycarpus fortunei in China. Phyotaxa 2019, 400, 203–210. [Google Scholar] [CrossRef]
- Wilson, A.; Cuddy, W.S.; Park, R.F.; Harm, G.F.S.; Priest, M.J.; Bailey, J.; Moffitt, M.C. Investigating hyperparasites as potential biological control agents of rust pathogens on cereal crops. Australas Plant Path 2020, 48, 231–238. [Google Scholar] [CrossRef]
- Schmull, M.; Miadlikowska, J.; Pelzer, M.; Stocker-Worgotter, E.; Hofstetter, V.; Fraker, E.; Hodkinson, B.P.; Reeb, V.; Kukwa, M.; Lumbsch, H.T.; et al. Phylogenetic affiliations of members of the heterogeneous lichen-forming fungi of the genus Lecidea sensu Zahlbruckner (Lecanoromycetes, Ascomycota). Mycologia 2011, 103, 983–1003. [Google Scholar] [CrossRef] [Green Version]
- Huang, X.; Liu, S.; Liu, X.; Zhang, S.; Li, L.; Zhao, H.; Zhao, J.; Zhang, J.; Cai, Z. Plant pathological condition is associated with fungal community succession triggered by root exudates in the plant-soil system. Soil Biol. Biochem. 2020, 151, 108046. [Google Scholar] [CrossRef]
- de Tenório, D.A.; de Medeiros, E.V.; Lima, C.S.; da Silva, J.M.; de Barros, J.A.; Neves, R.P.; Laranjeira, D. Biological control of Rhizoctonia solani in cowpea plants using yeast. Trop. Plant Pathol. 2019, 44, 113–119. [Google Scholar] [CrossRef]
- Marques, A.R.; Resende, A.A.; Gomes, F.C.O.; Santos, A.R.O.; Rosa, C.A.; Duarte, A.A.; de Lemos-Filho, J.P.; dos Santos, V.L. Plant growth–promoting traits of yeasts isolated from the tank bromeliad Vriesea minarum L.B. Smith and the effectiveness of Carlosrosaea vrieseae for promoting bromeliad growth. Braz. J. Microbiol. 2021, 52, 1417–1429. [Google Scholar] [CrossRef]
- Rosado, A.W.C.; Custodio, F.A.; Pinho, D.B.; Ferreira, A.P.S.; Pereira, O.L. Cladosporium species associated with disease symptoms on Passiflora edulis and other crops in Brazil, with descriptions of two new species. Phytotaxa 2019, 409, 239–260. [Google Scholar] [CrossRef]
- Wang, Y.C.; Xiong, F.; Lu, Q.H.; Hao, X.Y.; Zheng, M.X.; Wang, L.; Li, N.N.; Ding, C.Q.; Wang, X.C. Diversity of Pestalotiopsis-like species causing gray blight disease of tea plants (Camellia sinensis) in China, including two novel Pestalotiopsis species, and analysis of their pathogenicity. Plant Dis. 2019, 103, 2548–2558. [Google Scholar] [CrossRef]
- Marra, R.; Li, H.; Barbetti, M.J.; Sivasithamparam, K.; Vinale, F.; Lorito, P.C. Proteomic analysis of the interaction between brassica napus cv. surpass 400 and virulent or avirulent isolates of Leptosphaeria maculans. J. Plant Pathol. 2010, 92, 89–101. [Google Scholar] [CrossRef]
- Thomas, E.; Noar, R.D.; Daub, M.E. A polyketide synthase gene cluster required for pathogenicity of Pseudocercospora fijiensis on banana. PLoS ONE 2021, 16, e0258981. [Google Scholar] [CrossRef] [PubMed]
- Hove, F.V.; Waalwijk, C.; Logrieco, A.; Munaut, F.; Moretti, A. Gibberella musae (Fusarium musae) sp. nov., a recently discovered species from banana is sister to F. Verticillioides. Mycologia 2011, 103, 570–585. [Google Scholar] [CrossRef] [Green Version]
- Zhang, J.; Lu, Z.; Ren, T.; Cong, R.H.; Lu, J.W.; Li, X.K. Metabolomic and transcriptomic changes induced by potassium deficiency during Sarocladium oryzae infection reveal insights into rice sheath rot disease resistance. Rice 2021, 14, 81. [Google Scholar] [CrossRef] [PubMed]
- Mattox, C.M.; Kowalewski, A.R.; McDonald, B.W.; Lambrinos, J.G.; Daviscourt, B.L.; Pscheidt, J.W. Nitrogen and iron sulfate affect Microdochium patch severity and turf quality on annual bluegrass putting greens. Crop Sci. 2017, 57, 293–300. [Google Scholar] [CrossRef]
- Promputtha, I.; Lumyong, S.; Dhanasekaran, V.; McKenzie, E.H.C.; Hyde, K.D.; Jeewon, R. A phylogenetic evaluation of whether endophytes become saprotrophs at host senescence. Microb. Ecol. 2007, 53, 579–590. [Google Scholar] [CrossRef]
- Zhou, J.Z.; Deng, Y.; Luo, F.; He, Z.L.; Yang, Y.F. Phylogenetic molecular ecological network of soil microbial communities in response to elevated CO2. MBio 2011, 2, 00122-11. [Google Scholar] [CrossRef] [Green Version]
- de Menezes, A.B.; Prendergast-Miller, M.T.; Richardson, A.E.; Toscas, P.; Farrell, M.; Macdonald, L.M.; Baker, G.; Wark, T.; Thrall, P.H. Network analysis reveals that bacteria and fungi form modules that correlate independently with soil parameters. Environ. Microbiol. 2015, 17, 2677–2689. [Google Scholar] [CrossRef]
- Liang, Y.T.; Zhao, H.H.; Deng, Y.; Zhou, J.Z.; Li, G.H.; Sun, B. Long-term oil contamination alters the molecular ecological networks of soil microbial functional genes. Front. Microbiol. 2016, 7, 60. [Google Scholar] [CrossRef] [Green Version]
- Mougi, A.; Kondoh, M. Diversity of interaction types and ecological community stability. Science 2012, 337, 349–351. [Google Scholar] [CrossRef]
- Faust, K.; Raes, J. Microbial interactions: From networks to models. Nat. Rev. Microbiol. 2012, 10, 538–550. [Google Scholar] [CrossRef] [PubMed]
- Masenya, K.; Thompson, G.D.; Tekere, M.; Makhalanyane, T.P.; Pierneef, R.E.; Rees, D.J.G. Pathogen infection influences a distinct microbial community composition in sorghum RILs. Plant Soil 2021, 463, 555–572. [Google Scholar] [CrossRef]
- Nutaratat, P.; Srisuk, N.; Arunrattiyakorn, P.; Limtong, S. Plant growth-promoting traits of epiphytic and endophytic yeasts isolated from rice and sugar cane leaves in Thailand. Fungal Biol. 2014, 118, 683–694. [Google Scholar] [CrossRef] [PubMed]


Publisher’s Note: MDPI stays neutral with regard to jurisdictional claims in published maps and institutional affiliations. |
© 2022 by the authors. Licensee MDPI, Basel, Switzerland. This article is an open access article distributed under the terms and conditions of the Creative Commons Attribution (CC BY) license (https://creativecommons.org/licenses/by/4.0/).