Abstract
The environmental knowledge of inhabitants residing in a highly biodiverse mountainous region of western Mexico with an important economic forestry sector was investigated. Indices of environmental knowledge, by average and through a factor analysis, were developed and characterized using survey data collected in 2018 and 2021. These indices showed high levels of correlation, and followed similar patterns of distributions. Ordinary least squares and quantile regressions were used to examine social, economic, demographic, and perceptions as determinant factors of the generated indices. Age and education were repeatedly found as important factors influencing environmental knowledge, while income and gender were consistently not significant factors. Furthermore, environmental knowledge was related to quality of life. The index developed by factor analysis generated more significantly stable parameter results across percentiles of environmental knowledge. The indices were recommended for monitoring environmental knowledge in long term studies.
1. Introduction
The relationship between people and their environment forms the basis of sustainable development. Social, cultural, and economical human factors affect this relationship, thus, influencing environmental perceptions and sustainability [1,2]. Environmental knowledge includes concepts and patterns related to ecological systems, problems, and protection actions [3]. Specifically, the concept of environmental knowledge comprises the understanding of the ecological system, its natural laws and relationships, effects and environmental issues, along with possible actions for environmental conservation [4,5,6]. This knowledge is generated by scientific method, and often is acquired by individuals through formal education [5,7].
Knowledge about environmental processes can be related to positive pro-environmental conduct [8,9], but this relationship is not always strong [10]. Accumulated ecological knowledge is expected to have an effect on conscious behavior, which in turn, can produce social change and pro-environmental conduct [9]. Knowledge of environmental processes combined with variables such as age, accumulated knowledge, and behavior might also have positive effects on pro-environment conduct [6].
Non-formal education, through traditional beliefs and experiences, can be a way to obtain environmental knowledge [7,11]. Traditional ecological knowledge, usually acquired by non-formal education, affects how natural resources are maintained [12] and the ways in which cultural and economic systems are incorporated to management practices [13,14]. Traditional environmental knowledge also promotes collaborative actions to address community problems and proposes solutions focused on sustainability [15]. This interconnection of local knowledge and culture has been indicated to be a critical factor to effective local conservation efforts [14,16,17].
Regional cultural differences affect environmental knowledge [18]. Inside a single geographic region, socioeconomic differences produce different levels of knowledge, with more educational level attainment related to higher ecological understanding [19]. Within a natural protected area, a community is likely to increase environmental perceptions and their appreciation [20]. Therefore, evaluating and understanding a community’s environmental knowledge can inform specific environmental policies and decision-making processes for natural areas management [5].
Western Mexico is a highly biodiverse region. In particular, the mountains of Talpa de Allende municipality, in Jalisco state, are species and ecosystem rich, which are of high economic value [21]. At a national level, Jalisco ranks third in number of pine (Pinus spp.) (21) and oak (Quercus spp.) (45) species [22,23] In addition to these highly diverse tree genera, the Talpa de Allende region contains temperate and cloud forests with at least 40 endemic species and hardwood species listed as endangered or vulnerable [24]. Pines, oaks, and firs (Abies spp.) constitute 70, 9.8, and 2.5% respectively, of the total timber production of Mexico. Jalisco, together with the states of Chihuahua, Durango, Michoacán, and Oaxaca account for more than 60% of the timber production in Mexico [25]. Jalisco ranks third in total stem tree volume produced, with Talpa de Allende municipality an important contributor (14%) to the timber produced [26]. The biological importance of forests in Talpa de Allende region was recently recognized with the establishment of natural areas with protection statuses, such as state parks and watersheds areas [27]. Forestry, agriculture, and religious tourism are important economic activities in this rural area [21](166–206).
Illegal logging, forest fires, and irregular agricultural expansions are the leading causes of environmental degradation in western Mexico and in the Talpa de Allende region [28]. Community perceptions have indicated that water resources and air quality deterioration are the leading environmental conflicts affecting their quality of life. Soil erosion and excessive logging are also important environmental problems that communities are currently facing [2]. The environmental knowledge that inhabitants of an ecosystem possess might affect the perceptions of natural resources degradation and, in turn, their capacity to react, prevent, or end biodiversity and ecosystems loss [18,29].
Thus, identification of gaps in environmental knowledge and perceptions can inform and guide management policies as well as the response of society to biodiversity threats and conservation efforts. Indices can summarize the complexity of the collected data and provide information that can be used to guide actions for the society and the environment in a region [18]. An environmental index can be developed as a practical and robust indicator for synthesizing knowledge related to the environment [3,5,18,19,30,31], considering that no current consensus exists as to how measure environmental knowledge [7,9,14,16,32,33,34]. Indices to evaluate environmental knowledge can be applied to generate indicators of environmental knowledge appropriate for different natural ecosystems, to determine the factors that impact environmental knowledge, and to track shifts in knowledge over time [29,35].
This study aims to understand the environmental knowledge of inhabitants living in a highly biodiverse mountainous region with an important economic forestry sector. Accordingly, the following research questions guide this research: How to represent environmental knowledge from a population by using indices in a mountainous region? What are the most important factors determining the indices of environmental knowledge? To achieve this objective, first, indices that represent environmental knowledge are developed and characterized, and secondly, the determinant factors of environmental knowledge are identified.
2. Materials and Methods
2.1. Study Area
The study was conducted in Talpa de Allende, a rural municipality, conformed by a small capital town and interior communities. The municipality is located in central-western Mexico in the state of Jalisco (Figure 1), and is situated along a mountainous region (Sierra Madre del Sur) with proximity to the Pacific coastal plain, between geographic coordinates 20.04271–20.51096 N and 104.75533–105.20027 W. It is the fifth largest municipality of Jalisco (out of 125), with an area of 2685 km2. Elevation ranges from 200 to 2700 m, and has a mean annual precipitation of 1600 mm and mean annual temperature of 20 °C [36]. The region is primarily composed of pine forests, pine-oak forests, and cloud forests. These forests contain a larger number of tree species, as well as endemic and endangered plants than other areas in Jalisco that have been exploited and plundered illegally [24,28] The environmental conflicts for this region have been studied [2]. A natural protected area, with no residing inhabitants, i.e., the Maple Forest State Park, was established to preserve the biodiversity of this municipality; and there is already a proposed natural area for conservation, i.e., the Sierra El Cuale Watershed Protection Area [21].
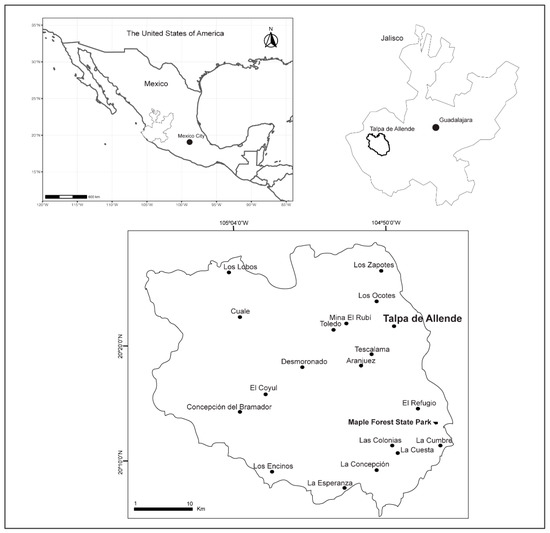
Figure 1.
Study area. The Talpa de Allende municipality is located in western Mexico. The population center and the main rural villages are depicted on the bottom map.
2.2. The Survey
Surveys were conducted in March 2018 and February 2021. The 2021 survey was not affected by the SARS-CoV-2 pandemic since most restrictions were already lifted in the state of Jalisco. The surveys were part of a long-term study of the interaction between society and the environment, started in 2017, with initial funding from the environmental agency of the Jalisco state [37]. Surveyed inhabitants included both residents of the capital town as well as the interior communities (Figure 1). Surveyed inhabitants were required to have at least two years of residence in the municipality of Talpa de Allende. The requirement of residence allowed for control of the measurements and to account for the criteria that the population’s perceptions about the environment were partly forged by their experiences with the environment. The survey was reviewed for missing information immediately after completion. If survey participants left any questions unanswered, follow-up questions were asked in order to inquire into any question that was left unanswered. If the participant refused to answer the missing questions, the survey was discarded in downstream processing. This procedure for quality control generated a greater number of useful observations in the statistical analyses.
Sample selection was implemented using a random sampling procedure that could generate robust statistical inferences when there is no theoretical foundation for segmentation. This generates equal probability of selection to all elements of the population and, thus, equal weights to the surveyed individuals [38]. By randomly sampling, biases and opinions that could overvalue or undervalue the measurements were reduced, and consequently, the obtained sample was able to include a more representative dataset from the residing population. An extraordinary effort was made to collect data from the interior communities of the municipality, which were only accessible by special 4 × 4 vehicles, since the roads of mountainous terrains were not regularly maintained. The obtained samples in 2018 and 2021 represented the municipality, as the capital town and interior communities’ inhabitants had equal probability of being recruited [2,37]. This provided enough variation in the representative data for conducting the statistical analyses [38,39].
Sample sizes were determined based on the minimum observable percentage difference [2,40]. For both years, 2018 and 2021, a sample size of 116 observations was determined taking into consideration 10% as the minimum observable percentage difference, error type I of 5%, and a statistical power of 80%. In 2018 the survey resulted on 168 observations whereas, in 2021, 138 observations were obtained. These obtained samples generated a minimum observable percentage difference of 7.1 and 8.5% in 2018 and 2021, respectively. The obtained number of observations in the samples were greater than the estimated sample size required for the study. Despite the small imbalances in the number of observations, they were sufficient, since our study area is a municipality within the state of Jalisco in Mexico. The obtained samples were acceptable considering that in studies representing metropolitan areas with larger populations such as Montreal and Mexico City, between 50 and 60 observations have been used for regression analyses [41]; moreover, studies representing Argentina and Colombia have used 168 and 130 observations, respectively [18].
2.3. Survey Data
Inhabitants were asked about environmental knowledge in a subset of 10 item questions. Responses could vary between one to 10 in the Likert scale. The scale of the item questions was such that ten meant the person perceived the evaluated environmental relationship to be most truthful according to the degree of agreement and disagreement. The survey requested answers with the following instruction: “Rate from 1 to 10 the following sentences about the environment (1, disagreement and 10, agreement)”. In this way, the questions were designed to capture more environmental knowledge as they were scored higher (Table 1). The items were written at a basic level of environmental knowledge, and therefore, the responses were comparable across individuals and survey years at the municipal level. Previous research has indicated that when items were at a high level of environmental knowledge, individuals from all the levels of knowledge had difficulty responding to the item [18,19]. The items were developed to capture basic, relevant, and general environmental knowledge according to the ecosystem of the municipality of Talpa de Allende, which is primarily rural and mountainous [2,24,37]. The major question topics included were about forest fires, water supply, logging, rivers, fauna, rain, the legal system, and water quality. These topics not only captured general environmental knowledge but also local knowledge according to the ecosystem of the study area [21]. Moreover, since the economic sector of tourism was an important contributor to the environmental conflicts of the municipality [37], tourism was also included on question seven (Table 1).

Table 1.
Survey item questions for the elaboration of environmental knowledge indices.
The current literature is not conclusive as to how environmental knowledge should be measured, in part, because of the diversity of ecosystems, populations, and investigation objectives [7,9,14,30,32,33,34]. During the development stage of the survey items, the literature on environmental knowledge was consulted [3,5,18,19,30,31]. Hence, in this study, the items were developed at a basic level of knowledge using unambiguous language [18,19,31]. The response ranges were chosen so that numeric data were generated that would allow for quantitative analyses in a long-term study in the study area [2,37].
The survey included a set of questions to evaluate perceptions as follows: Perceptions of the role of the municipality to conserve the environment (Municipality), the quality of life (QOL), and the environment as a determinant factor on quality of life (PEDQOL) were surveyed with the 1–10 scale previously mentioned [2]. The perceived environmental conflicts were evaluated with nine questions, rated 1–10, in which 10 implied the conflict was assessed as very severe; the topics included excessive logging, water scarcity, forest fires, air quality deterioration, deterioration of water quality in rivers and streams, infrequent rains, loss of fauna in forests, irresponsible tourism, and soil degradation. Detailed descriptions of these measurements are found in [2].
Individuals were also asked to provide age, gender, income level, and education level. Age was recorded as the number of years of age expressed by the individual. Gender was recorded as female or male. Income was recorded according to the income category selected by the individual from five categories of monthly income, in Mexican pesos (lower than 10,000; between 10,000 and 20,000; between 20,000 and 30,000; between 30,000 and 50,000; and more than 50,000). Education was recorded as the highest attained degree of education of the respondent.
2.4. Data Analysis
Two indices of environmental knowledge were developed based on information from the 10 questions EK1–EK10 (Table 1) that included a myriad of topics designed to represent environmental knowledge of residents. The first index was constructed based on an average scale [2]. This type of index was also used to quantify local importance of a particular knowledge from survey data [42]. The second index used principal factor analysis to obtain factor regression scores [43]. In contrast to index by the average scale, estimation of factor scores was performed for the pooled data using the 2018 and 2021 surveys, as well as for individual surveys for each survey year because of the multivariate nature of factor analysis.
Cronbach’s alpha and cumulative explained variation metrics were used to evaluate both indices [44,45]. Additionally, Kaiser–Meyer–Olkin statistics were obtained [46]. Later, both indices were used as dependent variables in the regression analysis by ordinary least squares and quantile regression, both were estimated with bootstrapped standard errors. Quantile regressions were implemented because varying parameter estimates over different percentiles of the conditional distribution of the indices could be generated [47]. Accordingly, quantile regressions results were obtained at different percentiles (10, 25, 50, 75, and 90) for evaluating the effects of the independent variables at low, medium, and high levels of environmental knowledge.
The independent variables used to explain the indices of environmental knowledge were age, gender, income, education, QOL, municipality, and PEDQOL. Age was recorded as the number of years. Gender was registered as a binary variable recorded as: females assigned the value of one and males assigned the value of zero. Education was recorded as the number of years that a person took to attain their highest level of education. Income was evaluated as a binary variable, where the value 0 was assigned to people who received a monthly income of 10,000 Mexican pesos (500 USD) or less and the value 1 was assigned to people who received an income greater than that amount. Traditionally, income is measured as a continuous variable or as a variable with diverse income categories; however, the binary categorization was implemented because the inhabitants of the municipality were wary of organized crime and common violence, which caused them to be unwilling to elucidate their real incomes. The expectation was that using simple income categories that did not make individuals feel as potential targets of violent events would reduce the bias in their responses. To prevent multicollinearity among independent variables, the average perception on the nine measurements of the identified environmental conflicts was calculated to represent conflicts. This variable was named conflict. Since the second survey was conducted in February 2021, to control for any possible effect from the SARS-CoV-2 pandemic that would impact our results, the time effect of the pandemic was considered on the regressions with aggregated data. Thus, temporal change on environmental knowledge was evaluated with a binary variable named time effect. Accordingly, the observations from the 2018 survey were recorded with zeros, and otherwise, the value of one was assigned. Multicollinearity of the independent variables was evaluated as well as the homoscedasticity and normality of the regression residuals. Data analysis for this research was conducted on the software Stata SE [48].
3. Results
3.1. Descriptive Statistics of the Variables
Descriptive statistics of the variables for the 2018 and 2021 surveys are shown separately in Table 2. In 2021, respondents were, on average, 36 years of age, while in 2018, they were relatively younger, with an average age of 32 years old. Surveyed inhabitants in 2021 had more educated with 14 years of education, on average, while in 2018, they reported 11 years. The survey in 2021 had a more balanced gender gap with 53% female respondents, whereas in 2018, the survey had 58%. Respondents registered higher incomes in 2021, 41% reported monthly income greater than 10,000 Mexican pesos (approximately 500 USD) in contrast to 2018 where 19% of surveyed inhabitants reported such incomes.
Table 2.
Descriptive statistics from the 2018 and 2021 surveys.
The descriptive statistics of the variables revealed quantitative changes in the evaluations to questions about environmental knowledge (EK1–EK10) between the 2018 survey and the 2021 survey (Table 2). In general, surveyed residents, on average, responded lower on ten questions on the 2021 survey as compared with on the 2018 survey. On average, they gave the highest grading to the question on forest fires and quality of forest areas (EK1) on the 2018 survey, while on the 2021 survey, the highest was the question about logging and reduction in forest areas (EK3). However, it is notable that these questions occupied the second place in the years that they did not occupy the first place. In contrast, the question on environmental quality and the enforcement of the laws (EK9) was consistently graded the lowest on both survey years (Table 2).
The descriptive statistics of environmental perceptions indicated that perceptions about the responsibility of the municipality to conserve the environment did not change much, shifting on average from 6.31 (in 2018) to 6.23 (in 2021). However, the perceptions of surveyed inhabitants of their own QOL were very stable, an average of 7.72 (in 2018) and an average of 7.71 (in 2021) (Table 2). In contrast, the overall maintained perception on environmental conflicts as measured by the variable “conflict” shifted from an average of 6.98 (in 2018) to an average of 6.50 (in 2021) (Table 2).
3.2. Environmental Indices
The questions on environmental knowledge (EK1–EK10) were used to develop two indices to represent environmental knowledge (Table 1). These indices were obtained from the average responses and by the factor scores from the factor analysis (Table 2). The correlation between both indices was above 0.99 for the 2018 and 2021 surveys as well as for the aggregated data corresponding to both surveys. Nevertheless, as expected, both indices displayed some differences on their respective descriptive statistics (Table 3).
Table 3.
Descriptive statistics of environmental knowledge indices.
The first index measured the average on the ten questions (EK1–EK10) responded to by residents of the municipality. The average response decreased from 8.48 in 2018 to 8.18 in 2021 (Table 3). This is consistent with the overall observed change in the responses to the questions. The indices both exhibited some differences on their distributions, although for the 2021 survey, the standard deviation changed to 1.63 in 2021 as compared with 1.45 in 2018, even though the minimum value shifted from 3.0 in 2018 to 3.7 in 2021 which reduced the range of its distribution (Figure 2). The Cronbach’s alpha statistics were calculated for the interitem correlations of the pairs of variables used in the index of environmental knowledge by average (EK1–EK10). These variables were used in the average index in the summative score of the items. The central idea of this statistic was that as the Cronbach’s alpha approximates one, the random sample of unweighted items measure the same unobserved factor and, in our case, the same theoretical concept of environmental knowledge [44]. The Cronbach’s alpha reached 0.89 for the whole set of observations from the 2018 and 2021 combined surveys, while 0.91 was reached for the 2018 sample and 0.87 for the 2021 sample. With a statistic score above 0.8, the Cronbach’s alpha statistic shows that the variables used in the index of environmental knowledge are highly reliable. Moreover, these statistics implied high levels of correlation of the summatory scale formed by the variables with the underlying factor, i.e., 0.95 for 2018, 0.93 for 2021, and 0.94 for the combined 2018 and 2021 samples.
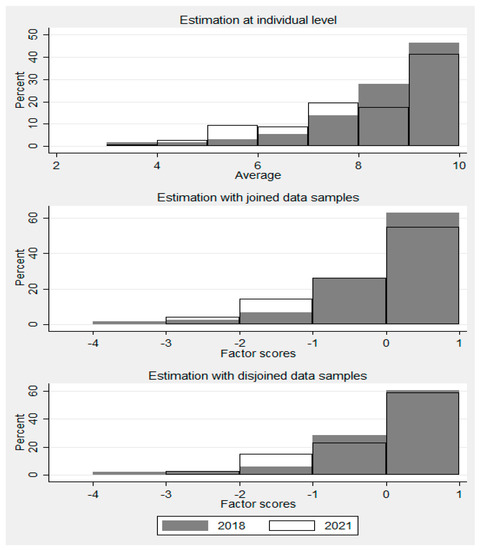
Figure 2.
Distributions of environmental knowledge indices. Estimation, by average, for each respondent took the mean value for the 10 item questions, EK1–EK10; these were also used for the estimation of factor scores generated from the combined 2018 and 2021 surveys, and separately.
The index of environmental knowledge obtained by factor analysis did not change its average of zero in both the 2018 survey and the 2021 survey (Table 3). The standard deviations of the factor scores, in contrast to the previous index, were steadier during the study period (0.95 in 2021 and 0.97 in 2018). Similar to the index by average, the minimum shifted from -3.75 in 2018 to -2.66 in 2021, which changed its distribution range (Figure 2). For this index, the variables EK1–EK10 were evaluated for the number of factors in the principal factor analysis. According to the overall Kaiser–Meyer–Olkin statistic, the 2018–2021 data was suitable for factor analysis, as it reached 0.89 as the measure of sampling adequacy, indicating that the proportion of variance could be caused by an underlying factor. The overall Kaiser–Meyer–Olkin statistics for 2018 and 2021 were 0.92 and 0.83, respectively. It was found that one linear combination of the variables contributed to the containment of high levels of accumulative variance. For the 2018 and 2021 pooled data, it was found that 92% of the variance was explained with one factor, whereas, separately, the 2018 data reached 95% and the 2021 data reached 85%. Finally, in the three aforementioned factor analyses, only one eigenvalue was greater than one, and with the accumulative explained variance with one factor. Taken together, this empirical evidence points to the unidimensionality of the evaluated data. Consequently, this indicates that no other conceptualized variables, other than environmental knowledge, was measured.
The estimated environmental knowledge indices for the respondents were graphically presented. The histograms of the environmental knowledge indices revealed very similar distributions of their respective data (Figure 2). In general, respondents had greater disparities on their concentration in the index by average as compared with the indices by factor analysis. It is important to observe the left skewed distributions of the indices; consequently, there is a moderately higher concentration of sampled inhabitants at higher percentiles in the 2018 indices, and accordingly, a relatively higher concentration of respondents at lower percentiles in the 2021 indices. Hence, more respondents were concentrated at lower percentiles in 2021 as compared with those surveyed in 2018, across both indices (Figure 2). These differences may be due to changes that were occurring at the population level, and this would imply a change in environmental knowledge in the period 2018–2021 in this region, as it was demonstrated in the descriptive statistics (Table 3).
3.3. Estimation of Relationships Determining Environmental Knowledge
Regression analyses were conducted to determine which variables might have an influence on environmental knowledge. The estimation of parameters was accomplished firstly by ordinary least squares (Table 4) and the inferences were made with estimated bootstrapped standard errors. The generated indices were utilized as the dependent variables in three sets of regressions. The first set corresponds to the 2018 survey data, the second set used the 2021 data, and the third set used the 2018 and 2021 pooled data. The coefficient of determination R2 ranged from 0.25 to 0.343.
Table 4.
OLS regression parameters for environmental knowledge indices.
The ordinary least squares estimation revealed the importance of education and PEDQOL, followed by age and perceptions of QOL. In all the regression analyses, education consistently had a positive and statistically significant effect on environmental knowledge, in both indices and both survey years. Likewise, the effects of PEDQOL were statistically significant and positive (Table 4). Less conclusive were the effects due to the perceptions of conflict and perceptions of the environmental responsibility of the municipality (Table 4). Age had no significant effect on the 2021 survey in both indices, but had a positive and significant effect in the 2018 and pooled data.
The regression results also indicated that environmental knowledge was also positively affected by QOL. Although the effects were not statistically significant in 2018, the effects were statistically significant in 2021 for both indices (Table 4). Moreover, the effect on the environmental knowledge index by average shifted from being significant at the 10% level of significance to being significant at the 5% level of significance from the sample of 2018 to the combined 2018 and 2021 samples. This may be due to greater sample size and possibly due to relatively low sensitivity of the 2018 results; however, the descriptive statistics of QOL revealed higher variation in 2018 (Table 2).
Temporal change in environmental knowledge was evaluated through the regressions. The binary variable time effect was negative and statistically significant at the 5% level of significance on the index by average and was significant at the 10% level of significance on the index by factor scores. These results point at the changing nature of environmental knowledge in a population. In this study, environmental knowledge decreased significantly in the 2018–2021 period after controlling for other variables (Table 4).
Perceptions of conflict played a less important but positive role in the determination of environmental knowledge. The effect did not achieve statistical significance in 2018 or in 2021. However, the effect was significant at a 90% level of confidence in the combined 2018–2021 surveys (Table 4). Based on this empirical evidence, it is not clear whether experiencing increasing environmental conflicts has a positive cumulative effect on the attained environmental knowledge (Table 4). Likewise, the perceptions of environmental responsibility of the municipality were weakly significant in the 2021 survey. This is in direct contrast to the effects of gender and income, whose effects were not statistically significant even at the 10% level of significance, neither on the index by average nor by factor scores.
The quantile regression results utilized the pooled data from the 2018 and 2021 surveys to evaluate the sensibility of the parameters at different percentiles of the distribution of the indices of environmental knowledge (Table 5). Perceptions of conflict were more sensitive in the index by factor scores as compared with the index by average. The variable conflict was significant at a 5% level of significance at the 10th and 25th percentiles in the index by average. Meanwhile, in the index by factor scores it reached statistical significance at the 10th and 75th percentiles, at 95 and 90% levels of confidence (Table 5). From these results, it can be inferred that the effect of conflict declined as more environmental knowledge was attained (Figure 3).
Table 5.
Quantile regression parameter estimates of environmental knowledge indices.
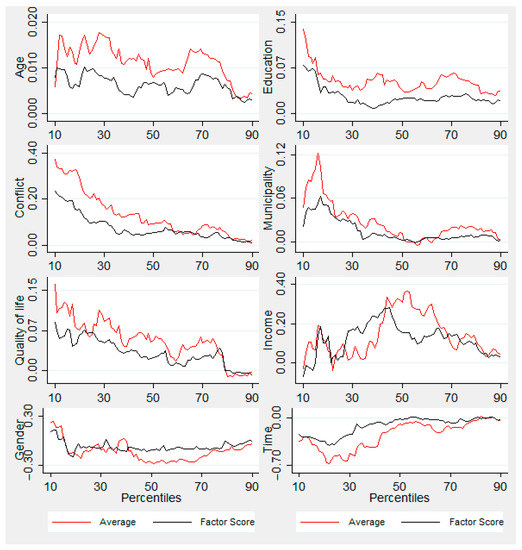
Figure 3.
Quantile regression parameters for environmental knowledge indices. The parameter estimations utilized the pooled data from 2018 and 2021.
The positive effects of education were statistically significant at the 10th, 75th, and 90th percentiles for both indices. Its effect was relatively more homogeneous in terms of its significance as compared with the variable conflict. The effects of education were consistent with the results from ordinary least squares regressions; however, it is plausible that at intermediate percentiles of environmental knowledge, experience with conflicts takes slightly more importance than education (Table 5).
The effect of age was significantly different from zero at the 75th percentile at the 10% level of significance in the index by average. In contrast, the effect of age in the index by factor scores was statistically significant, nevertheless, it was not significant at the 10th and 90th percentiles (Table 5). In contrast, the parameter of PEDQOL not only was positive and statistically significantly different from zero in both indices, but, the parameters in general, were relatively stable across the evaluated percentiles as no major shift was distinguished (Table 5).
Gender, income, and QOL did not have significant effects on environmental knowledge using the results from both indices and across different percentiles (Table 5). Likewise, the parameter for the perceptions of environmental responsibility of the municipality had no significant impact on the indices of environmental knowledge (Table 5). Nevertheless, graphically, such effect reached a peak at approximately the 15th percentile, and from that point forward it diminished (Figure 3). These results imply that the perception of the municipal government held by citizens in terms of environmental responsibility may have a higher impact on those inhabitants with lower environmental knowledge (Figure 3).
The variable time effect was consistently negative across percentiles and indices, similar to the ordinary least squares regressions. It was only statistically significant at the 25th percentile, different from zero at a 5% level of significance for both indices. This suggests that the observed reduction in environmental knowledge occurred at lower percentiles in the period 2018–2021, meanwhile, higher percentiles did not experience a significant change (Figure 3).
4. Discussion
4.1. Indices of Environmental Knowledge
The prevalent environmental knowledge of inhabitants of the studied mountainous region consists of the effects of forest fires and excessive logging. Together, both issues are the most known environmental relationships during the three-year period. Frequent human-induced forest fires are a recurring event, and it is often related to the agricultural system of the region. Thus, it is expected that the community has incorporated an understanding of the phenomenon. It is possible that the current trend of excessive and illegal logging, which has dominated the region since 2016, has increased the interest of the community in both issues [2,28]. The histogram distributions of environmental knowledge indexes indicated a relatively high level of environmental knowledge held by inhabitants from the municipality, at the population level. The distributions had a noticeable high proportion of individuals to the right, implying skewness to the left, and a relatively smaller proportion of individuals with lower environmental knowledge [48,49].
Survey data from 2018 and 2021 were used to develop indices of environmental knowledge considering the extant literature [3,5,7,9,14,16,18,19,30,31,32,33,34]. As expected, both indices by average and through factor analysis were able to represent environmental knowledge from multiple measurements of environmental relationships as perceived by survey respondents. The provided empirical evidence showed these indices can be used to model environmental knowledge, and to not only monitor such measurements but also to evaluate what influences them [50]. However, there was some disparity in the distribution of the indices generated by average as compared with the indices that were developed by factor analysis. Specifically, at intermediate quantiles in a year-by-year comparison the factor scores showed similar distributions to the indices that were generated by average. This is perhaps due to the measurements themselves, as the average was taken at the inhabitant level, while the factor scores from the factor analysis takes into consideration the variation of all the observations in the corresponding sample [45,51]. Furthermore, even though the indices by average and the indices by factor analysis were highly correlated, the indices by factor analysis performed better at generating significantly stable parameter results across percentiles of environmental knowledge in quantile regressions, even though both types of indices performed equally well in regressions by ordinary least squares.
Therefore, an index by factor scores slightly outperformed an index by average. Nevertheless, both types of indices are recommended for characterizing environmental knowledge, and the index by average could be interpreted as a robustness check. In regressions for instance, the index by average allowed the determination of the consistency of the statistical significance of the estimated parameters with factor score indices. Moreover, such robustness checks were improved in quantile regressions, as the stability of the parameters was evaluated at varying percentiles of the dependent variable [47]. All in all, the developed indices were able to represent and measure the theoretical concept of environmental knowledge. Likewise, the indices presented had enough variation, and were evaluated and monitored over time in this research, i.e., in 2018 and 2021 [29,31,42,52].
4.2. Determinants Factors
The descriptive statistics indicated, on average, a small decline in environmental knowledge from 2018 to 2021, even though, on average, the sampled individuals had attained more years of education. However, the statistical regression analyses demonstrated that education had a positive relationship with environmental knowledge as measured by the index by average and the index by factor analysis.
As residents of Talpa de Allende attain more education, it is expected that more environmental knowledge will accumulate, while all other factors are maintained constant. Higher levels of environmental knowledge related to a higher formal educational level were also documented in the biodiverse region of southeastern Mexico, such knowledge allowed inhabitants to link different ecological processes that affected them [19]. An understanding of ecological systems can improve in a region not only through formal education but also through experiences with the rural and mountainous settings of the region. These regional differences were documented in a similar rural region nearby a natural protected area [20]. The knowledge acquired by different sources, from either formal or informal education, explained the ecological knowledge of inhabitants in a natural area of Spain [7]. In contrast, in this study, the presented statistical results showed that inhabitants who experienced more environmental conflicts were more environmental knowledgeable; however, these conflicts were more important for those individuals at lower percentiles of environmental knowledge. From these results, it can be inferred that knowledge and conflict could possibly be affecting each other simultaneously, and this deserves future investigation [2,53]. Environmental knowledge was positively affected by age according to the regression results, both by ordinary least squares and quantile regressions, maintaining other independent variables constant that also included the time effect variable for survey years 2018 and 2021. The effect of age was obtained despite, on average, respondents were slightly older with relatively less environmental knowledge in 2021 as compared with in 2018. This did not change the interpretation of the effect. The descriptive statistics do not consider controlling independent variables when a change in a variable is analyzed. In other words, unlike statistical regression analyses, descriptive statistics cannot provide statistical inferences about the effect of a variable into another variable, since it is not possible to estimate the covariance among variables and parameters for evaluating hypotheses about the effects of independent variables [47,48].
The presented results show that as people become older the more environmental knowledge they retain. This would suggest that educational programs aimed at increasing environmental knowledge might have greater effects in younger individuals, as adults are more likely to have fewer knowledge gaps that need to be reinforced. These results, maintaining other determining causes constant, imply that older people, in general, would have significantly more environmental knowledge than younger people. The loss of knowledge in younger generations from rural areas has been documented in the neighboring state of Michoacán. This region has experienced a significant degradation of its natural habitat, which could explain the almost total environmental ignorance among its inhabitants [33]. Thus, older people in Talpa de Allende have more environmental knowledge than younger people, maintaining other factors constant.
The perception that the environment determines quality of life was related to the attained environmental knowledge of the inhabitants. The indices both showed that increasing levels of environmental knowledge were experienced by those individuals that were more aware that their quality of life was being determined by the environment. The perception of quality of life related to the environment has become more significant over time [2]. This pattern is more evident in rural areas since the availability of natural resources is related to a healthy ecosystem [54]. In the case of Talpa de Allende, a rural municipality, it is likely that as the environment deteriorates it might generate a lower quality of life [28].
The environmental knowledge indices suggested a decline of environmental knowledge in the population during the study time period. Although knowledge is evolving over time, a number of factors could contribute to the decline, a process that has been studied in traditional environmental knowledge [32]. Studies have identified possible causes for the decline of such knowledge, including formal education, occupational change, habitat degradation, age, and gender, among others [31,32]. While the current trends of habitat degradation in western Mexico are high, the age factor could better explain the slight decline in environmental knowledge, where older people accumulated more knowledge than the younger age groups. A knowledge gap between younger and older people has also been found in a short-time-span study that concluded that there was knowledge erosion over time [29] It is not clear whether the change in the environmental knowledge in Talpa de Allende is a fluctuation accurately recovered by the indices for a three-year period or part of a consistent trend of decline. It is, thus, necessary to continue to monitor it over a longer time span. Future research should study the underling factors causing the declining trend in environmental knowledge or determine whether the observed decline is just a transitory change.
5. Conclusions
In this research, two indices of environmental knowledge were developed and evaluated utilizing survey data in the 2018–2021 period. One index was estimated by average and a second index was estimated through factor analysis. The developed indices were able to represent environmental knowledge, and the determinant factors that influenced them were disentangled.
The indices were both able to represent, in a summarized manner, the environmental knowledge that survey participants possessed. However, the index by factor scores outperformed the index by average in its capacity to generate statistical significance of independent variables in regression analyses; thus, the index by average is recommended as a robustness check since both indices were highly correlated. By using both indices, environmental knowledge of a population can be measured and monitored over time.
The factors influencing environmental knowledge were evaluated using regression analyses. Age and education were factors that had important effects on environmental knowledge but income and gender repeatedly had no effect. Additionally, environmental conflict perceptions and self-perceived quality of life did exert effects on the level of knowledge that inhabitants had about their environment. Therefore, both indices were useful in regression analyses for identifying the determinant factors that influenced environmental knowledge.
In the studied period and according to the presented empirical evidence, there was a decline in environmental knowledge as measured by the indexes. This decline was not explained by either demographic or socioeconomic factors considered in the analyses. Thus, future research should investigate the direct causes that can produce a decline in environmental knowledge attained by citizens, and determine whether the decline is transitory or permanent.
Author Contributions
C.I.G.-J., writing original draft, methodology, data analysis, investigation, data curation, grammar checking, conceptualization, writing review and editing, supervision; Y.L.V.-R., funding acquisition, writing original draft, conceptualization, investigation, writing review and editing; B.Y.Q.-C., data curation, investigation; K.G.-V., data curation, investigation. All authors have read and agreed to the published version of the manuscript.
Funding
Secretaría de Medio Ambiente y Desarrollo Territorial (SEMADET): PED 2013- 2033 / 4451; Consejo Nacional de Ciencia y Tecnología: No. 311076/2020.
Data Availability Statement
The data presented in this study are available on request from the corresponding author.
Acknowledgments
The authors are grateful to Biologist Antonio Rafael Ordorica Hermosillo for facilitating the logistics of this research, and for facilitating research funding from the Secretaría de Medio Ambiente y Desarrollo Territorial of the state of Jalisco.
Conflicts of Interest
The authors declare no conflict of interest. The funders had no role in the design of the study; in the collection, analyses, or interpretation of data; in the writing of the manuscript, or in the decision to publish the results.
References
- UNESCO. United Nations Decade of Education for Sustainable Development, 2005–2014: Draft International Implementation Scheme. 2005. Available online: https://unesdoc.unesco.org/ark:/48223/pf0000139937 (accessed on 11 January 2022).
- García-Jiménez, C.I.; Vargas-Rodriguez, Y.L.; Quiroz, B.Y. Conflictos ambientales y sus efectos en la calidad de vida en una región occidental de México. Econ. Soc. Territ. 2019, 19, 273–304. [Google Scholar]
- Frick, J.; Kaiser, F.G.; Wilson, M. Environmental knowledge and conservation behavior: Exploring prevalence and structure in a representative sample. Pers. Individ. Differ. 2004, 37, 1597–1613. [Google Scholar] [CrossRef]
- Roczen, N.; Kaiser, F.G.; Bogner, F.X. A competence model for environmental education. Environ. Behav. 2014, 46, 972–992. [Google Scholar] [CrossRef]
- Cheung, L.T.O.; Fok, L.; Tsang, E.P.K.; Fang, W.; Tsang, H.Y. Understanding residents’ environmental knowledge in a metropolitan city of Hong Kong, China. Environ. Educ. Res. 2015, 21, 507–524. [Google Scholar] [CrossRef]
- Geiger, S.M.; Geiger, M.; Wilhelm, O. Environment-specific vs. general knowledge and their role in pro-environmental behavior. Front. Psychol. 2019, 10, 1–12. [Google Scholar] [CrossRef] [PubMed]
- Cebrián-Piqueras, M.A.; Filyushkina, A.; Johnson, D.N.; Lo, V.B.; López-Rodríguez, M.D.; March, H.; Plieninger, T.; Oteros-Rozas, E.; Peppler-Lisbach, C.; Quintas-Soriano, C.; et al. Scientific and local ecological knowledge, shaping perceptions towards protected areas and related ecosystem services. Landscape Ecol. 2020, 35, 2549–2567. [Google Scholar] [CrossRef]
- Geiger, S.M.; Dombois, C.; Funke, J. The role of environmental knowledge and attitude: Predictors for ecological behavior across cultures? an analysis of Argentinean and German students. Umweltpsychologie 2018, 22, 69–87. [Google Scholar]
- Liobikienė, G.; Poškus, M.S. The importance of environmental knowledge for private and public sphere pro-environmental behavior: Modifying the value-belief-norm theory. Sustainability 2019, 11, 3324. [Google Scholar] [CrossRef]
- Otto, S.; Pensini, P. Nature-based environmental education of children: Environmental knowledge and connectedness to nature, together, are related to ecological behaviour. Global Environ. Chang. 2017, 47, 88–94. [Google Scholar] [CrossRef]
- Urda, E.G.; Bonan, L. Saber no alcanza para actuar: Revisión y reflexiones acerca de la relación entre el conocimiento y la adopción de conductas ambientales. Ciência Educ. 2017, 23, 357–372. [Google Scholar] [CrossRef]
- Gómez-Baggethun, E. Perspectivas del conocimiento ecológico local ante el proceso de globalización. Pap. Relac. Ecosociales Cambio Glob. 2009, 107, 57–67. [Google Scholar]
- Drew, J.A. Use of traditional ecological knowledge in marine conservation. Conserv. Biol. 2005, 19, 1286–1293. [Google Scholar] [CrossRef]
- Prober, S.M.; Raisbeck-Brown, N.; Porter, N.B.; Williams, K.J.; Leviston, Z.; Dickson, F. Recent climate-driven ecological change across a continent as perceived through local ecological knowledge. PLoS ONE 2019, 14, e0224625. [Google Scholar] [CrossRef] [PubMed]
- Kitamura, K.; Nakagawa, C.; Sato, T. Formation of a community of practice in the watershed scale, with integrated local environmental knowledge. Sustainability 2018, 10, 404. [Google Scholar] [CrossRef]
- Aswani, S.; Lemahieu, A.; Sauer, W.H. Global trends of local ecological knowledge and future implications. PLoS ONE 2018, 13, e0195440. [Google Scholar] [CrossRef]
- CBD (Convention on Biological Diversity). Traditional Knowledge, Innovations and Practices. 2021. Available online: https://www.cbd.int/traditional (accessed on 11 January 2022).
- Geiger, S.M.; Otto, S.; Diaz-Marin, J.S. A diagnostic environmental knowledge scale for Latin America/Escala diagnóstica de conocimientos ambientales para Latinoamérica. Psyecology 2014, 5, 1–36. [Google Scholar] [CrossRef]
- Padilla, L.S.; Luna, A.M. Percepción y conocimiento ambiental en la costa de Quintana Roo: Una caracterización a través de encuestas. Investig. Geográficas 2003, 52, 99–116. [Google Scholar]
- Granada, H.; Cortés, C.M. Conocimiento y valoración de la calidad ambiental de la reserva forestal Bosque de Yotoco: Perspectiva psicoambiental. Psicol. Caribe 2015, 32, 442–458. [Google Scholar] [CrossRef]
- Vargas-Rodriguez, Y.L.; Vázquez, J.; Quintero, T.; Muñiz-Castro, M.A.; Shalisko, V. Estudio Técnico Justificativo para la Declaratoria del Parque Estatal Bosque de Arce, Talpa de Allende, Jalisco; Secretaría de Desarrollo Urbano-Secretaría de Medio Ambiente y Desarrollo Territorial del Estado de Jalisco-Savho Consultoría y Construcción S. A. de C.V.: Guadalajara, Mexico, 2010; pp. 1–238. [Google Scholar]
- Gernandt, D.S.; Pérez-de la Rosa, J.A. Biodiversity of Pinophyta (conifers) in Mexico. Rev. Mex. Biodiv. 2014, 85, 126–133. [Google Scholar] [CrossRef]
- Valencia, S. Diversidad del género Quercus (Fagaceae) en México. Bot. Sci. 2004, 75, 33–53. [Google Scholar] [CrossRef]
- Vargas-Rodriguez, Y.L.; Platt, W.J.; Vázquez, J.; Boquin, G. Selecting relict montane cloud forests for conservation priorities: The case of western Mexico. Nat. Area J. 30, 156–173. [CrossRef]
- SEMARNAT. Anuario Estadístico de la Producción Forestal 2018; Secretaría de Medio Ambiente y Recursos Naturales: Mexico City, Mexico, 2021; pp. 1–297. [Google Scholar]
- SEMADES. Ordenamiento Ecológico Territorial del Estado de Jalisco; Gobierno de Jalisco, Secretaría de Medio Ambiente para el Desarrollo Sustentable: Guadalajara, Mexico, 2006; pp. 1–185. [Google Scholar]
- Vargas-Rodriguez, Y.L.; Vázquez, J.; Quintero, T.; Muñiz-Castro, M.A.; Shalisko, V.; García-Jiménez, C.I.; Fernández, J.A.; De Fuentes, K.; Lanoue, C. Propuesta para la protección del bosque mesófilo con arce (Jalisco, México), bajo la categoría de parque estatal. In Recursos Forestales en el Occidente de México: Diversidad, Manejo, Producción, Aprovechamiento y Conservación; Salcedo-Pérez, E., Hernández, E., Vásquez, J., Escoto, T., Díaz, N., Eds.; Universidad de Guadalajara: Guadalajara, Mexico, 2013; Volume 2, pp. 510–536. [Google Scholar]
- García-Jiménez, C.I.; Vargas-Rodriguez. Y.L. Passive government, organized crime, and massive deforestation: The case of western Mexico. Conserv. Sci. Pract. 2021, 3, e562. [Google Scholar]
- Yinghe, H.; Yeo-Chang, Y. What makes the traditional forest-related knowledge deteriorate? A case of Dengcen village in Southwestern China. Forest Policy Econ. 2021, 125, 1–18. [Google Scholar] [CrossRef]
- Arcury, T.A.; Johnson, T.P. Public environmental knowledge: A statewide survey. J. Environ. Educ. 1987, 18, 31–37. [Google Scholar] [CrossRef]
- Certain, G.; Skarpaas, O.; Bjerke, J.W.; Framstad, E.; Lindholm, M.; Nilsen, J.E.; Nybø, S. The Nature Index: A general framework for synthesizing knowledge on the state of biodiversity. PLoS ONE. 2011, 6, e18930. [Google Scholar] [CrossRef]
- Zent, S. Processual perspectives on traditional environmental knowledge, continuity, erosion, transformation, innovation. In Understanding Cultural Transmission in Anthropology: A Critical Synthesis; Ellen, R., Lycett, S.J., Johns, S.E., Eds.; Berghahn Books: New York, NY, USA, 2013; pp. 213–265. [Google Scholar]
- Reyes-González, A.; Camou-Guerrero, A.; Del-Val, E.; Ramírez, M.I.; Porter-Bolland, L. Biocultural diversity loss: The decline of native stingless bees (Apidae: Meliponini) and local ecological knowledge in Michoacán, Western México. Hum. Ecol. 2020, 48, 411–422. [Google Scholar] [CrossRef]
- Malcolm, C.D.; Bravo, M.L.; Chávez, R.M. Reported capture, fishery perceptions, and attitudes toward fisheries management of urban and rural artisanal, small-scale fishers along the Bahía de Banderas coast, Mexico. Environ. Chall. 2021, 4, 1–10. [Google Scholar] [CrossRef]
- Zent, S.; Maffi, L. Final report on indicator No. 2: Methodology for developing a vitality index of traditional environmental knowledge (VITEK) for the project Global Indicators of the Status and Trends of Linguistic Diversity and Traditional Knowledge. In Global Indicators of the Status and Trends of Linguistic Diversity and Traditional Knowledge; Terralingua: Salt Spring Island, BC, Canada, 2009; pp. 2–9. [Google Scholar]
- INEGI. Compendio de Información Geográfica Municipal 2010 Talpa de Allende Jalisco; Instituto Nacional de Estadística y Geografía: Aguascalientes, Mexico, 2010; pp. 1–11. [Google Scholar]
- García-Jiménez, C.I. Estudio de las Percepciones, Intereses y Conflictos sobre los Recursos Naturales en el Municipio de Talpa de Allende, Primera Fase del Proyecto; Secretaría de Medio Ambiente y Desarrollo Territorial del Estado de Jalisco: Guadalajara, Mexico, 2018; pp. 1–55. [Google Scholar]
- Arrazola, J.R.; Zavala, J.C. Diseño metodológico para la selección de una muestra representativa de estudiantes universitarios. Econ. Admin. 2014, 5, 54–67. [Google Scholar] [CrossRef]
- Greene, W.H. Econometric Analysis, 5th ed.; Prentice Hall: Hoboken, NJ, USA, 2003; pp. 41–55. [Google Scholar]
- Lozano-Rivas, W.A. Determinación del número mínimo de observaciones en investigación, obviando las estimaciones de la varianza de datos. Rev. Didáctica Ambient. 2011, 7, 54–61. [Google Scholar]
- Tello-Campos, C.A.; Aguilar-Martínez, A.G. Regeneración y calidad de vida urbana en el centro antiguo de las ciudades de Montreal y México: Una comparación. Econ. Soc. Territ. 2013, 13, 121–149. [Google Scholar] [CrossRef][Green Version]
- Estrada-Castillón, E.; Villarreal-Quintanilla, J.A.; Encina-Domínguez, J.A.; Jurado-Ybarra, E.; Cuéllar-Rodríguez, L.G.; Garza-Zambrano, P.; Gutiérrez-Santillán, T.V. Ethnobotanical biocultural diversity by rural communities in the Cuatrociénegas Valley, Coahuila; Mexico. J. Ethnobiol. Ethnomed. 2021, 17, 1–22. [Google Scholar] [CrossRef]
- Arowolo, M.O.; Adebiyi, M.O.; Adebiyi, A.A.; Okesola, O.J. A hybrid heuristic dimensionality reduction methods for classifying malaria vector gene expression data. IEEE Access 2020, 8, 182422–182430. [Google Scholar] [CrossRef]
- Cronbach, L.J. Coefficient alpha and the internal structure of tests. Psychometrika 1951, 16, 297–334. [Google Scholar] [CrossRef]
- Reio, T.G.; Shuck, B. Exploratory factor analysis: Implications for theory, research, and practice. Adv. Dev. Hum. Resour. 2015, 17, 12–25. [Google Scholar] [CrossRef]
- Kaiser, H.F. An index of factorial simplicity. Psychometrika 1974, 39, 31–36. [Google Scholar] [CrossRef]
- Cade, B.S.; Noon, B.R. A gentle introduction to quantile regression for ecologists. Front. Ecol. Environ. 2003, 1, 412–420. [Google Scholar] [CrossRef]
- StataCorp, L.L.C. Stata Software SE/13; StataCorp LLC: College Station, TX, USA, 2013. [Google Scholar]
- Handcock, M.S.; Morris, M. Relative Distribution Methods in the Social Sciences; Springer: New York, NY, USA, 2006; pp. 213–225. [Google Scholar]
- Aráuz, A.F. Aplicación del análisis factorial confirmatorio a un modelo de medición del rendimiento académico en lectura. Rev. Cienc. Econ. 2015, 33, 39–65. [Google Scholar]
- DiStefano, C.; Zhu, M.; Mîndrilã, D. Understanding and using factor scores: Considerations for the applied researcher. Pract. Assess. Res. Eval. 2009, 14, 1–11. [Google Scholar]
- Guitton, H. Índices e indicadores. Rev. Econ. Estad. 1960, 4, 9–23. [Google Scholar]
- Buchanan, K.S. Contested discourses, knowledge, and socio-environmental conflict in Ecuador. Environ. Sci. Policy 2013, 30, 19–25. [Google Scholar] [CrossRef]
- Lebel, L.; Wattana, S.; Talerngsri, P. Assessments of ecosystem services and human well-being in Thailand build and create demand for coproductive capacity. Ecol. Soc. 2015, 20, 1–13. [Google Scholar] [CrossRef]


Publisher’s Note: MDPI stays neutral with regard to jurisdictional claims in published maps and institutional affiliations. |
© 2022 by the authors. Licensee MDPI, Basel, Switzerland. This article is an open access article distributed under the terms and conditions of the Creative Commons Attribution (CC BY) license (https://creativecommons.org/licenses/by/4.0/).