Abstract
The conversion of forests could change soil characteristics and, in turn, impact the microbial community. However, the long-term effect of forest transformation on bacterial and archaeal composition and diversity, especially on nitrogen functional communities, is poorly understood. This study aimed to explore the response of soil bacterial and archaeal communities, as well as nitrogen functional groups, to the conversion from natural broadleaved forests to Chinese fir (Cunninghamia lanceolate (Lamb.) Hook.) plantations in subtropical China by 16S rRNA amplicon sequencing. Except for soil bulk density (BD) and ammonium nitrogen (NH4+–N) content, other soil properties all decreased with the conversion from natural forests to plantations. Alpha diversity of bacteria and archaea declined with the transformation from natural forests to plantations. The composition of bacteria and archaea was significantly different between natural forests and plantations, which could be mainly attributed to the change in the content of soil organic carbon (SOC), total nitrogen (TN), nitrate nitrogen (NO3−–N), and available phosphorus (AP). The conversion of natural forests to plantations decreased the gene copies of ammonia-oxidizing archaea (AOA), ammonia-oxidizing bacteria (AOB), and nifH (nitrogen fixation function) but increased denitrification gene copies (i.e., nirS, nirK, and nosZ). In summary, our study emphasizes the long-term negative effect of the conversion from natural broadleaved forests into Chinese fir plantations on the diversity and richness of soil microbial communities, thereby deeply impacting the cycling of soil nitrogen.
1. Introduction
Forest ecosystems play an important role in regulating global biogeochemical cycles, maintaining species diversity, and resisting climate change [1], and are valued worldwide for the services they provide to society [2,3]. In forest ecosystems, tree species and composition have a great influence on soil biodiversity [4]. Soil biodiversity has as a critical role in determining the ecological and evolutionary response of terrestrial ecosystems to current and future environmental changes [5]. However, over the past 300 years, land-use activities, mainly for agricultural expansion and timber extraction, have resulted in a net loss of about 7 to 11 million km2 of the forest [6]. Land-use change has been identified as a major cause of soil carbon loss [7], and shows a significant contribution to greenhouse gas emissions [8]. Cultivation of natural land resources results in loss of organic matter, which directly affects the physical, chemical, and biological properties of soil [9]. As one of the most important parameters for the quality and sustainability of the ecosystem, soil organic carbon (SOC) is usually easily impacted by activities carried out for managing agricultural and forest ecosystems [7]. Highly managed forests, such as timber plantations in North America and oil-palm plantations in Southeast Asia, have also replaced many natural forests and currently cover 1.9 million km2 worldwide [6]. These changes in forest cover will affect various important ecosystem service functions, including biodiversity maintenance, climate regulation, carbon storage, nitrogen cycles, etc. [10].
The process of forest ecosystems is driven by the interaction between aboveground and underground components, and its stability and sustainability depend on the conversion of nutrients [11]. The structure and function of forest ecosystems are deeply affected by the dominant tree species [12], as they determine the features of the soil and vegetation [13]. Different compositions of tree species could influence the physicochemical and biological characteristics of soils, as well as the cycling of nutrients [4,14], resulting in changes in the diversity and richness of resources available to soil microbial communities. The shift of soil properties (such as soil pH, soil texture, soil nutrient availability), soil enzyme activity, topography, and management activities may lead to a change in soil microbial communities [15,16,17]. Loss of microbial diversity may negatively impact climate regulation, soil fertility, and terrestrial ecosystem productivity [18]. Soil microbial communities serve as a link between soils, plants, and atmospheres by engaging in activities of decomposition and biogeochemical cycles [19,20], and their composition and diversity are usually treated as crucial indicators that reflect the function and stability of the ecosystem [21]. Therefore, it is critical to understand the structure and function of soil microbial communities in reflecting and predicting the response of forest ecosystems to environmental condition changes.
Subtropical forests have experienced extensive forestry land use, in which forests are generally regarded as crops, while there are relatively few long-lived natural forests [10]. In the subtropical region, many countries (e.g., Australia, central Chile, southeastern Brazil, and southern China) have set up economic zones for intensive forestry practices [10]. Especially in the subtropical region of China, many native forests have been transformed into single-species plantations over the past decades [22]. Among them, the Chinese fir (Cunninghamia lanceolata) plantation covers approximately 10.96 million ha [23], accounting for 6% of the world’s forest plantations [24]. Given the large area of plantations, any small changes in these systems will bring a non-negligible impact on the whole terrestrial ecosystem. Afforestation may alter the structure and diversity of soil microbial communities by affecting the soil physicochemical properties, plant community compositions, litter input, and root exudates [14,25,26]. The long-term impact of the transformation from natural forests to plantations on soil microbial communities and functions remains poorly understood.
This study aims to explore the effect of the forest type transformation on the soil physicochemical characteristics, microbial community structure and diversity, and nitrogen cycling microbial functional groups through sequencing with 16S rRNA to the soil of natural broadleaved forests, mixed-species plantations, and Chinese fir plantations. Specifically, our objectives are to clarify: (i) the change in diversity and richness of bacterial and archaeal communities with the conversion from natural forests to plantations; (ii) the relationship between the change in microbial communities with the shift in soil physicochemical properties undergoing a transition of forest types; and (iii) the impact of the nitrogen functional community by the forest-type transformation.
2. Materials and Methods
2.1. Site Description
This study was conducted at the Changyuan forest farm (27°1′46″–27°1′55″ N, 118°24′41″–118°26′55″ E, 220–231 m a. s. l.) in Jianou city, Fujian Province, China. The site is located on the low mountain and hilly area of the south of the Wuyi Mountains, with relatively steep terrain and a slope ranging from 20° to 35°. It belongs to a subtropical monsoon climate, with a mean annual precipitation of 1650 mm and a mean annual temperature of 20 °C. The soil is developed from biotite granite with a more than 100 cm thick of the soil layer and is classified as red soil according to the Chinese Soil Classification System, which is equivalent to Ultisols in the United States Department of Agriculture (USDA) soil taxonomy [27]. Three forest-type stands were selected for this study, i.e., natural broadleaved forest (N), mixed-species plantation (M), and Chinese fir plantation (P) (Table S1). The natural broadleaved forest was dominated by Schima (Schima superba (Theaceae)), Japanese oak (Lithocarpus glaber (Thunb.)), Rubber tree (Hevea brasiliensis (Kunth. Muell.)), Chinese hemlock (Tsuga chinenesis (Franch.) Pritzel ex Diels.), Japanese zelkova (Zelkova serrata (Thunb.) Makino), and Chinese chinquapin (Castanea henryi (Skam) Rehder & Wilson). The mixed-species plantation and Chinese fir plantation were reconstructed from natural broadleaved forests more than 30 years ago. The mixed-species plantation was dominated by the tree species of C. lanceolata and S. superba. The main understory vegetation in these forests is listed in the Supplementary Materials.
2.2. Soil Sampling
For each type of forest, three sample plots (0.5 ha) were established and five pits (20 m × 20 m) were randomly selected within each plot. The distance between selected pits was maintained at more than 6 m. Given the transition zone for microbial communities occurring at 10–25 cm in natural forest soil [28] and 10–20 cm in poplar plantation soil [29], we collected soil samples from two depths (D1: 0–20 cm; D2: 20–50 cm) in this study. Ten soil samples from two depths in 5 pits were collected with soil drills (diameter: 2.5 cm), respectively, after removing the surface litter and herbs. To minimize deviations caused by sampling, we uniformly mixed soil samples at the same depth from the same plot and subsequently divided them into three composite samples. A total of 54 composite soil samples were collected, which were then subdivided into two portions. Samples for soil microbial analysis were transferred into sterilized centrifuge tubes (50 mL) and frozen in dry ice, then stored at −80 °C when returning to the laboratory. The rest of the samples were transferred into a container with ice bags and then stored at 4 °C when coming back to the laboratory. At the same time, we used the ring core (volume: 100 cm3; diameter: 5.05 cm; height: 5 cm) to collect soil samples from the two depths at each pit, wrapped with fresh-keeping film, and transported to the laboratory for the determination of soil bulk density (BD).
2.3. Soil Physical and Chemical Properties Analyses
Prior to measurement, fresh soil samples for physicochemical property analysis were sieved through 2 mm meshes to discard the fine roots and stones. Soil BD was measured gravimetrically. Soil water content (SWC) was evaluated by drying (105 °C for 24 h) and weighing samples. Soil pH was measured using a pH probe (AB15 + Basic, Accumet, San Diego, CA, USA) by mixing soil and water at a 1:2.5 volume ratio. Total nitrogen (TN) and mineral nitrogen (e.g., ammonium nitrogen, NH4+–N; nitrate nitrogen, NO3−–N) were determined as described by Feng et al. [29]. SOC was measured according to standard methods for soil analyses [30]. Dissolved organic carbon (DOC) was measured with a TOC analyzer (TOC-L, Shimadzu, Tokyo, Japan) by mixing soil and water in a 1:5 volume ratio. Soil microbial biomass carbon (MBC) and nitrogen (MBN) were assessed with fresh soil samples using a chloroform fumigation–extraction method, as described previously [31,32]. The fumigated and nonfumigated soil samples were extracted with 0.5 mol·L−1 potassium sulfate for 30 min, and measurements of MBC and MBN were performed using a TOC analyzer (TOC-L, Shimadzu, Tokyo, Japan) [33]. Soil available phosphorus (AP) was extracted with 0.5 mol·L−1 NaHCO3 for 1 h, and then analyzed colorimetrically at a wavelength of 882 nm with a UV-VIS spectrophotometer (UV-2550; Shimadzu, Tokyo, Japan) [34].
2.4. DNA Extraction of Soil Samples
Soil DNA extraction was conducted using the E.Z.N.A® Soil DNA Kit (Omega Bio-Tek, Norcross, GA, USA) following the manufacturer’s instructions. The concentration and purity from all extractions were determined with a NanoDrop 2000 UV-vis spectrophotometer (Thermo Scientific, Wilmington, DE, USA). The quality of DNA was checked with 1% agarose gel electrophoresis. Extracted DNA was stored at −20 °C for further analysis.
2.5. Quantitative PCR Assay of Functional Genes
The quantitative analysis of functional genes involved in nitrification, denitrification, and nitrogen fixation was conducted with the primer pairs amoA-1F/amoA-2R for the bacterial ammonia monooxygenase alpha subunit (amoA) [35], amoAF/amoAR for the archaeal amoA [36], cd3Af/R3cdR for cytochrome cd1-containing nitrite (NO2−) reductase (nirS) [37], F1aCu/R3Cu for copper-containing NO2− reductase (nirK) [38], nosZ-F/nosZ-1622R for nitrous oxide (N2O) reductase (norZ) [39], and nifHF/nifHR for nitrogenase reductase (nifH) [40], respectively. Detailed information on primers and reaction conditions used for amplification is presented in Table S2.
2.6. 16S rRNA Gene Amplicon Sequencing and Bioinformatics Analyses
Polymerase chain reaction (PCR) amplification was conducted by a thermocycler PCR system (GeneAmp 9700, ABI, Waltham, MA, USA) with the primer pair 515FmodF/806RmodR, the general primers for amplifying the V4 hypervariable region of the 16S rRNA gene in bacteria and archaea [29]. PCR amplification was performed in triplicate in a 20 µL reaction system: 4 μL of 5 × FastPfu buffer (Bioneer, Daejeon, Korea), 2 μL of 2.5 mM deoxyribonucleoside triphosphates (dNTPs; Larova, Teltow, Germany), 0.8 μL of each primer (5 μM), 0.4 μL of FastPfu polymerase (TransGen AP221-02, Beijing, China), 0.2 μL of bovine serum albumin (BSA; New England Biolabs (NEB), Ipswich, MA, USA), and 10 ng of template DNA. PCR was carried out using the following program: denaturation at 95 °C for 3 min, 27 cycles at 95 °C for 30 s, annealing at 55 °C for 30 s, and elongation at 72 °C for 45 s, with a final extension at 72 °C for 10 min. PCR products were extracted using agarose gel (2%), purified with an AxyPrep DNA Gel Extraction Kit (Axygen Biosciences, Union City, CA, USA), and further quantified by QuantiFluorTM-ST (Promega, Madison, WI, USA) according to the manufacturer’s instructions.
Purified amplicons were pooled in equimolar, and paired-end (2 × 300 bp) sequenced using an Illumina MiSeq platform (Illumina, San Diego, CA, USA) following the standard protocols by Majorbio Bio-pharm Technology Co. Ltd. (Majorbio, Shanghai, China). Raw fastq files were demultiplexed and quality-filtered with Trimmomatic, as well as merged using Fast Length Adjustment of Short reads (FLASH, https://ccb.jhu.edu/software/FLASH/, last accessed on 20 December 2021) with the following criteria: (i) reads were truncated when receiving a mean quality score less than 20 over a 50 bp sliding window; (ii) sequences that overlap length >10 bp were merged in terms of the overlap with mismatch <2 bp; (iii) primers were exactly matched allowing 2 nucleotide mismatching, and reads containing ambiguous bases were removed. Operational taxonomic units (OTUs) were clustered with 97% similarity cutoffs using UPARSE with a “greedy” algorithm that performs chimera filtering and OTUs clustering simultaneously [41]. The taxonomy of the qualified sequence was analyzed with the Ribosomal Database Project (RDP) Classifier algorithm (http://rdp.cme.msu.edu/, last accessed on 22 December 2021) against Silva (SSU128) 16S rRNA database [42] using a confidence threshold of 70% [43]. Sequence data are available through the National Center for Biotechnology Information (NCBI) Sequence Read Archive database (SRA) under the identification code PRJNA633237. After that, we performed functional annotation with the Functional Annotation of the Prokaryotic Taxa (FAPROTAX) database to explore the relevant potential microbial functions related to the nitrogen cycle [44].
2.7. Statistical Analyses
Shapiro–Wilk’s and Levene’s tests were employed to verify the normal distribution of residuals and the homogeneity of variance, respectively. One-way analysis of variance (ANOVA), followed by Tukey’s test was used to analyze the statistical differences of soil physicochemical properties resulting from the different land-use types based on three forest stands. Alpha (α) diversity of microbial communities was evaluated with Chao 1 (richness) and Shannon indexes (diversity) determined by the genera-level taxonomic matrices using PAST software v.3.2 [45]. Hierarchical clustering was carried out using USEARCH [41] to clarify the similarity and dissimilarity of soil microbial communities between different forest types. Venn graphs were used to identify the number of shared and unique OTUs at different soil depths among the three forest types based on a similarity level of 97% OTUs. Pearson’s correlation analysis and redundancy analysis (RDA) (CANOCO 5.0, http://www.canoco.com, last accessed on 23 December 2021) were applied to evaluate the relationship between soil factors and microbial communities. Two-way permutation multivariate analysis of variance (PERMANOVA) [46] was used to test variations of microbial community abundance at different soil depths from diverse forest-type habitats. Functional annotation of the nitrogen functional community in soil samples was carried out by the FAPROTAX database [44]. Pearson’s rank correlation coefficients were calculated to explore the relationship between microbial groups and soil physicochemical properties using the “NetworkX” package (http://networkx.github.io/, last accessed on 25 December 2021) in Python, and the calculations were corrected using the Benjamini–Hochberg FDR [47].
3. Results
3.1. Variation of Soil Physicochemical Properties with Conversion of Forest Types
Compared with the natural forest, the content of SWC, SOC, DOC, MBC, and MBN in the surface soil of plantations (including mixed-species plantations and pure Chinese fir plantations) after conversion decreased significantly (P < 0.05), but the NH4+–N content increased significantly (P < 0.05; Table 1). In addition, soil pH and the content of NO3−–N, TN, and AP decreased significantly (P < 0.05), regardless of the surface or subsurface soil after the natural forest converted to the plantation, while soil BD showed the opposite (P < 0.05). Overall, the variation of soil properties in surface soil (D1) was larger than that of subsurface soil (D2). Among them, the content of NO3−–N, TN, SOC, and AP had the greatest variation, regardless of the surface or subsurface soil.

Table 1.
Soil physicochemical properties of different soil depths from diverse forest types (mean ± standard deviation).
3.2. Alpha Diversity Patterns and Microbial Community Abundance
The richness and diversity of soil bacteria and archaea decreased significantly (P < 0.05) with soil depths (Figure 1). At the same soil layer, almost all the richness and diversity of bacteria and archaea declined significantly when the natural forest converted to the plantations (P < 0.05). Moreover, compared with the mixed-species plantation, the soil bacterial diversity of pure Chinese fir plantation decreased significantly (P < 0.05).
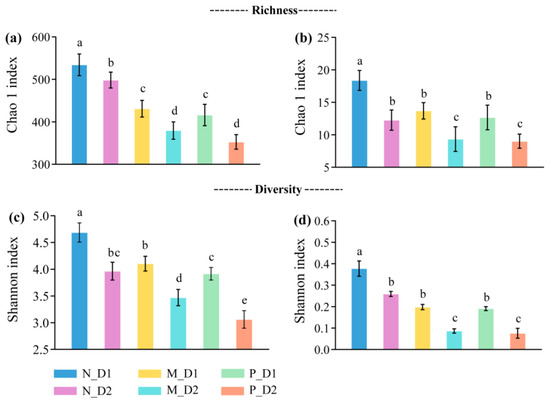
Figure 1.
Richness and diversity of the bacteria, (a,c), and archaea, (b,d), at the genera-level. N: Natural broadleaved forest, M: Mixed-species plantation, P: Chinese fir (Cunninghamia lanceolate (Lamb.) Hook.) plantation; D1: 0–20 cm, D2: 20–50 cm. Error bars represent the standard deviation (SD, n = 9). The lowercase letters denote the significant difference (P < 0.05) based on the Tukey test.
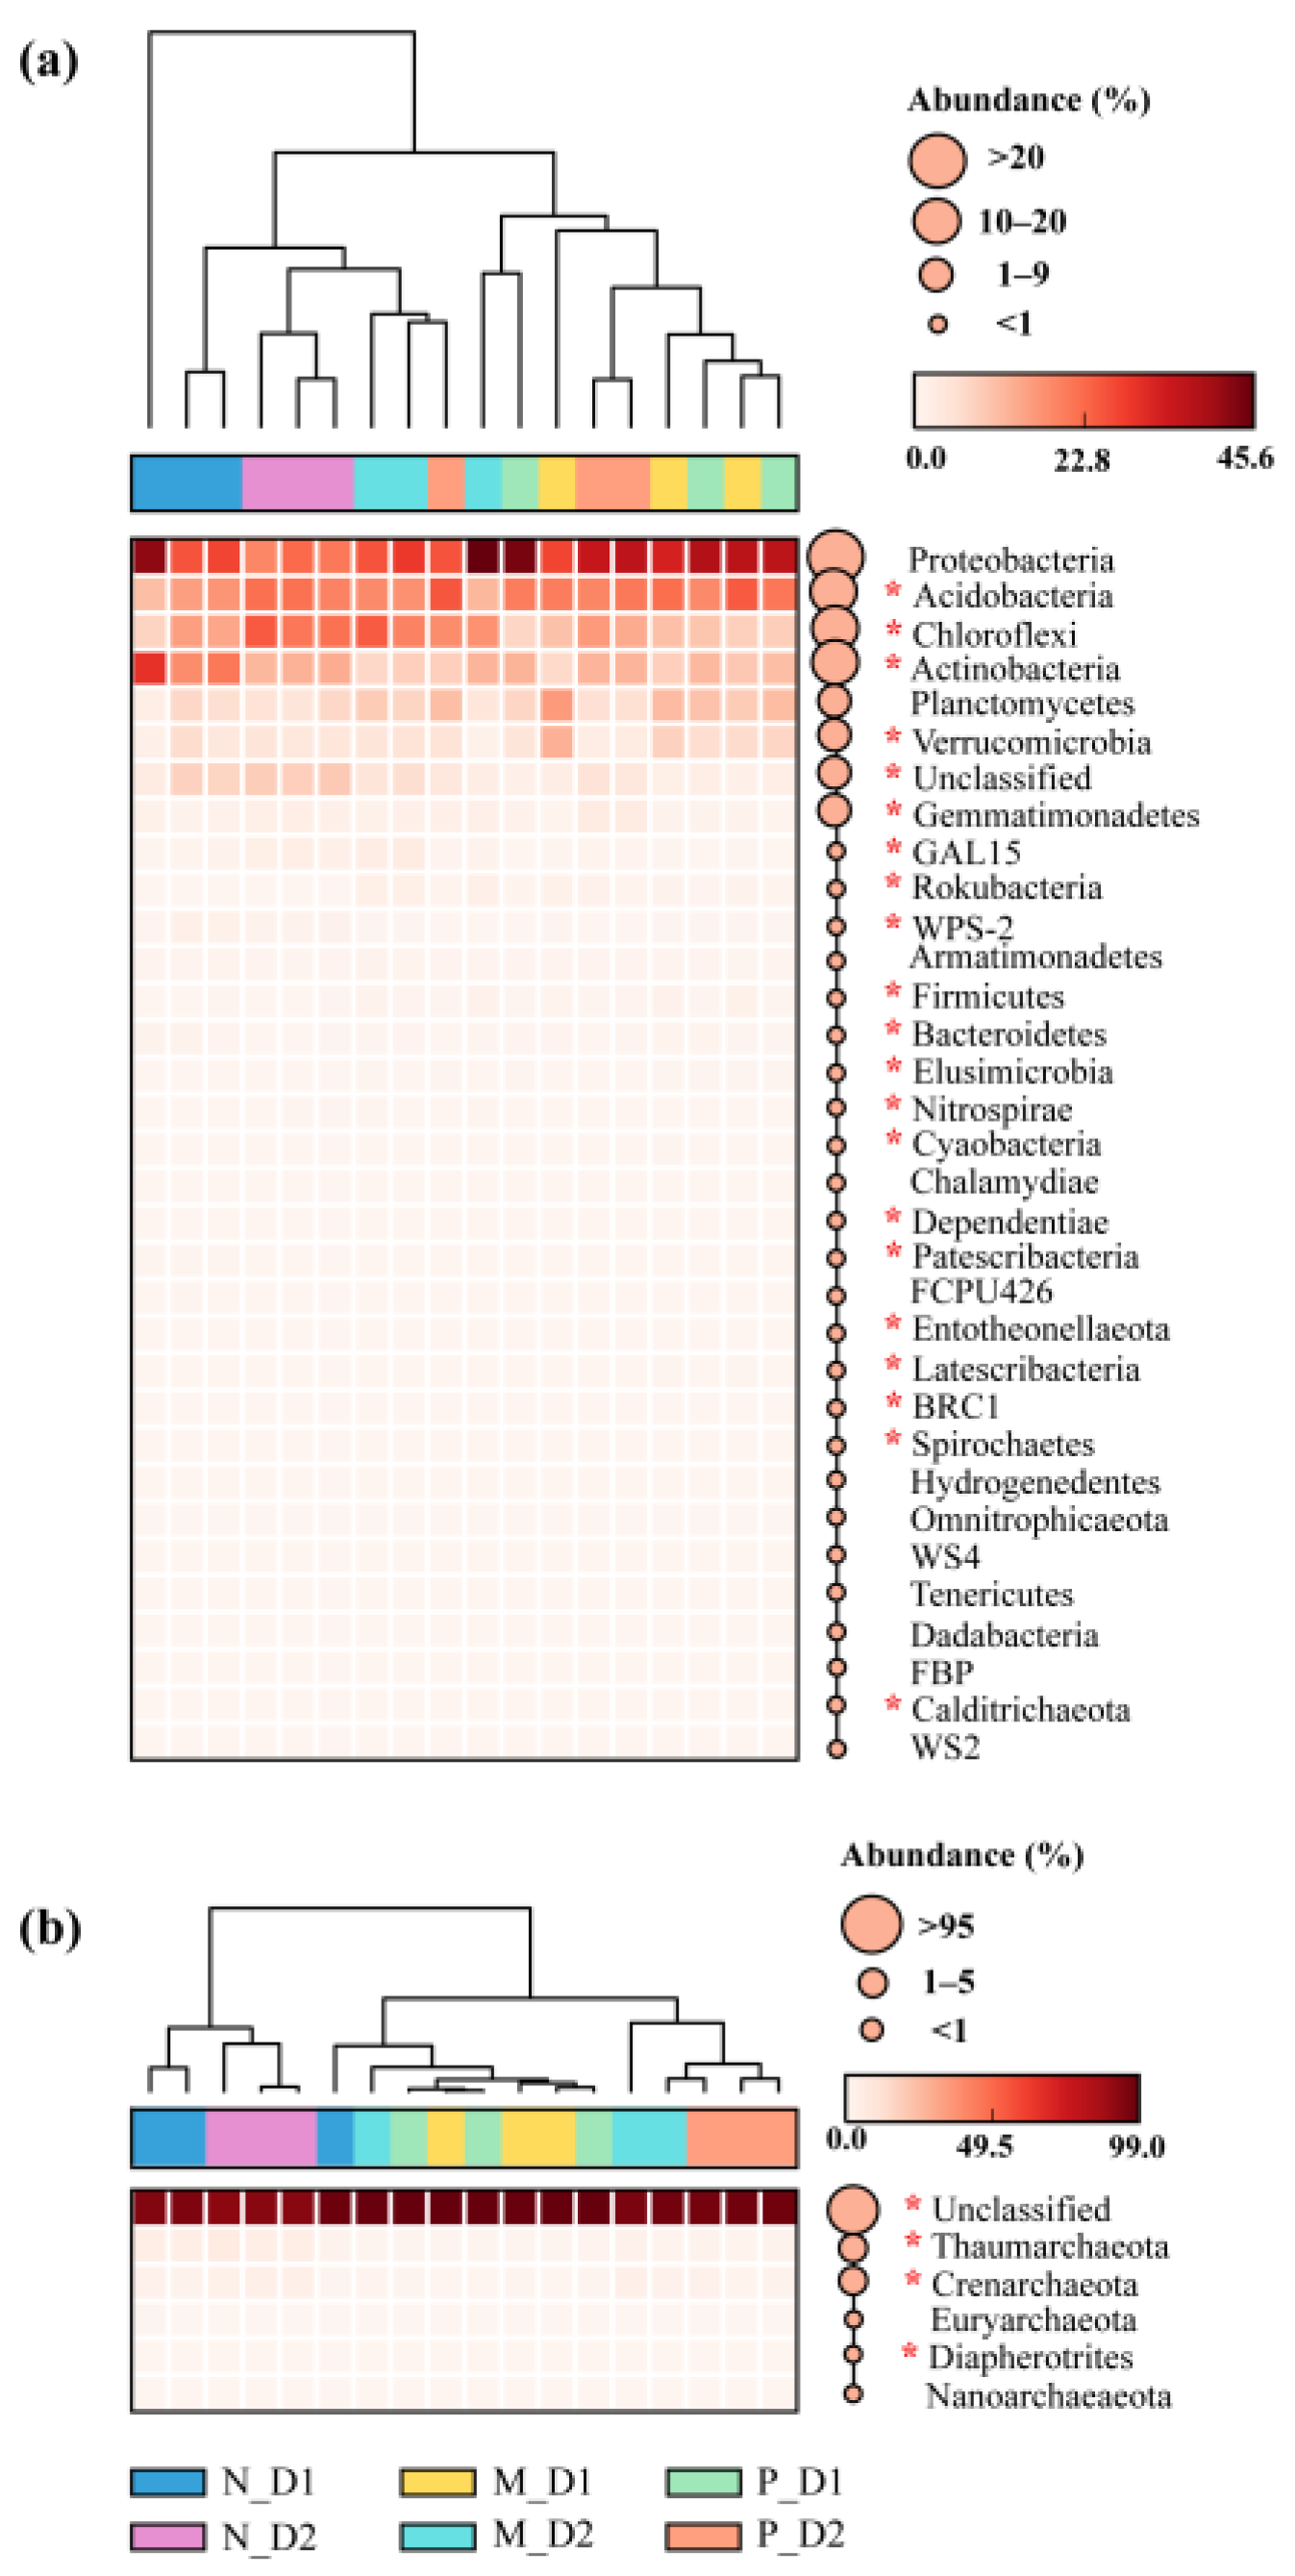
Overall, thirty-two known bacterial phyla and five known archaea phyla were observed in all samples (Figure 2a,b). As main bacterial phyla, an abundance of Proteobacteria (31.38%), Acidobacteria (19.09%), Chloroflexi (14.80%), Actinobacteria (12.62%), Planctomycetes (7.69%), Verrucomicrobia (4.91%), and Gemmatimonadetes (1.23%) together made up more than 91% of all bacteria. The abundance of unclassified archaea accounted for 96.28%, while the known phyla, such as Thaumarchaeota, Crenarchaeota, Euryarchaeota, Diapherotrites, and Nanoarchaeaeota together only accounted for 3.72% of the archaeal community. Actinobacteria, Chloroflexi, GAL15, WPS-2, Nitrospirae, Patescibacteria, Crenarchaeota, and Thaumarchaeota were more abundant in the natural forest soil (Figure S1). However, Acidobacteria, Calditrichaeota, Cyanobacteria, Dependentiae, Elusimicrobia, Entotheonellaeota, Firmicutes, Latescibacteria, Rokubacteria, and Diapherotrites showed a higher abundance in the plantation soil.

Figure 2.
Variations in the relative abundance of bacteria (a) and archaea (b) at the phylum level. N: Natural broadleaved forest, M: Mixed-species plantation, P: Chinese fir (Cunninghamia lanceolata) plantation; D1: 0–20 cm, D2: 20–50 cm. The asterisk (*) represents a significant difference by post hoc Tukey–Kramer test (P < 0.05 after Benjamini–Hochberg correction).
3.3. Microbial Community Composition and RDA Analysis
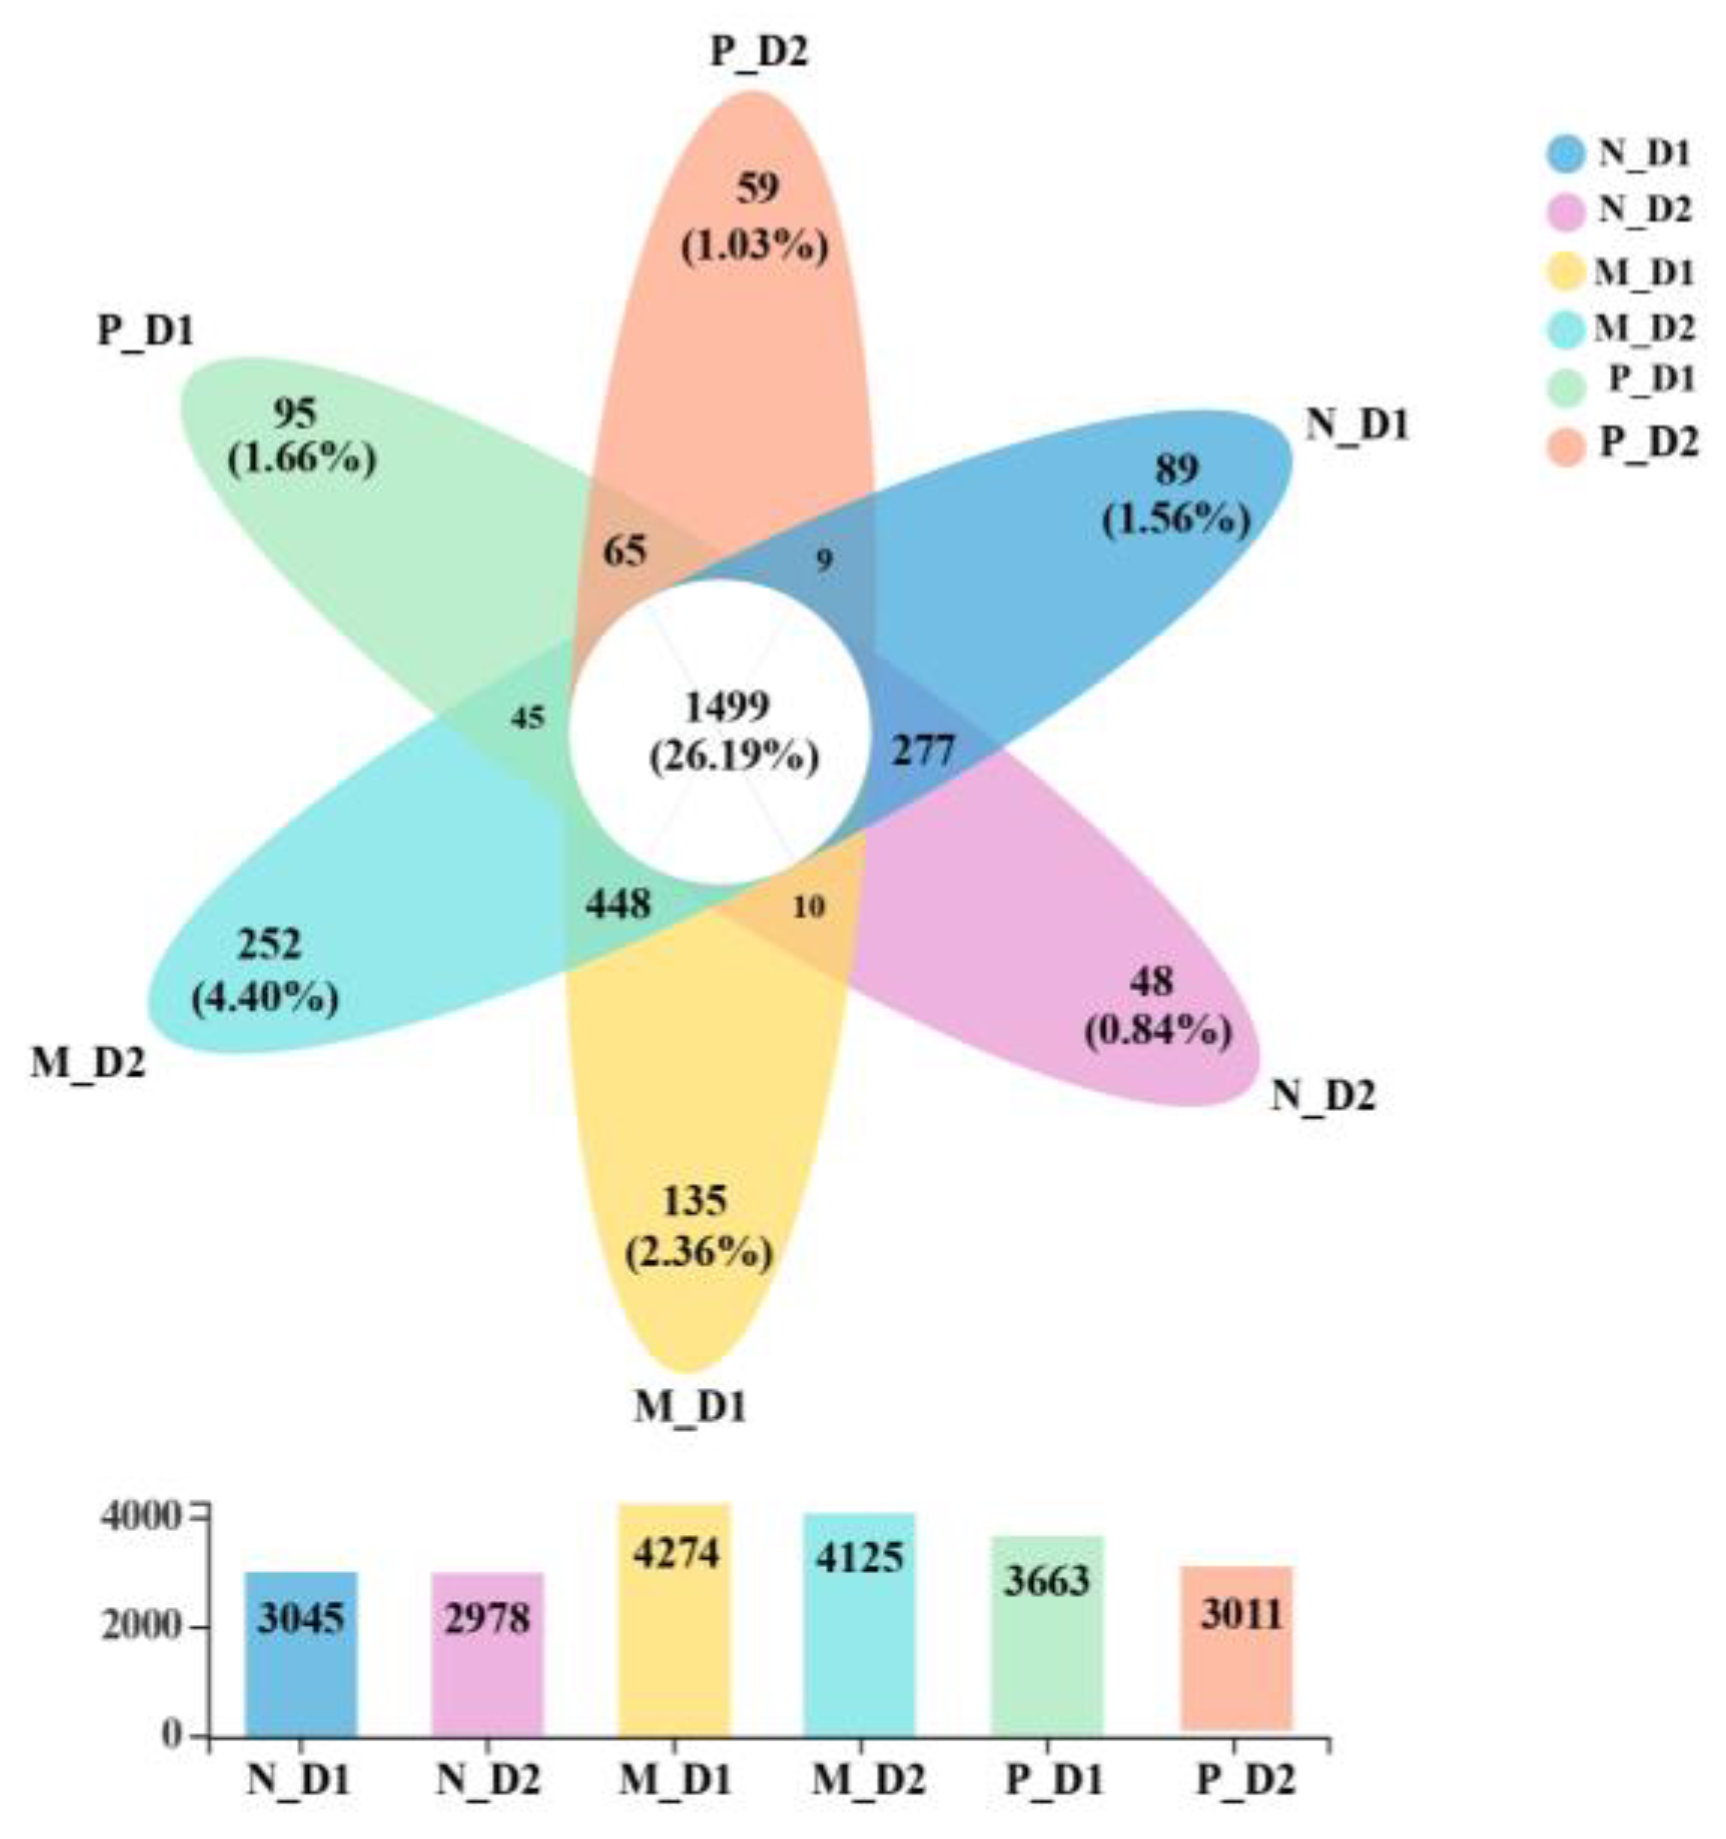
There were 1499 shared OTUs in all samples, accounting for 26.19% of all observed OTUs (5723; Figure 3). There were 89, 48, 135, 252, 95, and 59 unique OTUs in the surface (D1) and subsurface (D2) soil of the natural forest, mixed-species plantation, and Chinese fir plantation, respectively. The number of OTUs in the mixed-species plantation was higher than that of natural forests and pure Chinese fir plantations.

Figure 3.
Venn diagram of the number of shared and unique operational taxonomic units (OTUs). Overlapping parts represent the shared OTUs, non-overlapping parts represent the specific OTUs of the groups, and the number indicates the corresponding number of OTUs. The corresponding numbers in the bar are the number of OTUs to different groups. N: Natural broadleaved forest, M: Mixed-species plantation, P: Chinese fir (Cunninghamia lanceolata) plantation; D1: 0–20 cm, D2: 20–50 cm.
Cluster analysis showed that communities of soil bacteria and archaea in the natural broadleaved forest were clearly distinguished with those in the mixed-species plantation and the Chinese fir plantation (Figure 4a,c). Communities of bacteria and archaea at the same depth in all types of forests clustered together as one group, respectively. RDA analysis showed that the first and second axes altogether explained more than 60% of the total variation in the soil bacterial community (Figure 4b) and 52% in the soil archaeal community (Figure 4d), respectively. SOC (R2 = 0.74, P = 0.001), NO3−–N (R2 = 0.71, P = 0.001), TN (R2 = 0.33, P = 0.041), and AP (R2 = 0.45, P = 0.014) showed a significant correlation with the bacterial community structure. Moreover, NO3−–N (R2 = 0.60, P = 0.002), TN (R2 = 0.36, P = 0.028), and AP (R2 = 0.44, P = 0.01) were significantly correlated with the archaeal community structure.
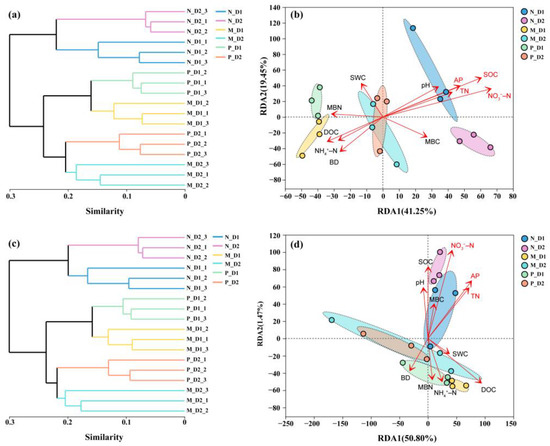
Figure 4.
Clustering analysis for soil bacterial (a) and archaeal (c) communities based on the Bray–Curtis dissimilarity at the OTU level. Redundancy analysis (RDA) of the relationship between bacterial (b) and archaeal (d) communities and soil physicochemical properties. Arrow’s length indicates correlated degree of soil physicochemical properties and bacterial and archaeal communities. The significant correlations are marked with red font (P < 0.05). Color ellipse indicates significant clusters based on permutation analysis (P < 0.05). N: Natural broadleaved forest, M: Mixed-species plantation, P: Chinese fir (Cunninghamia lanceolata) plantation; D1: 0–20 cm, D2: 20–50 cm. BD: bulk density; SWC: soil water content; NO3−–N: nitrate nitrogen; NH4+–N: ammonium nitrogen; TN: total nitrogen; SOC: soil organic carbon; DOC: dissolved organic carbon; MBC: microbial biomass carbon; MBN: microbial biomass nitrogen; AP: available phosphorus.
Potential interaction between soil physicochemical properties and microbes was evaluated by Pearson’s rank correlation (Figure S2). Rokubacteria (about seven properties) and Patescibacteria (about six properties) presented the highest number of interactions with soil factors. In addition, SOC (correlated with 16 phyla), NO3−–N (12 phyla), AP (11 phyla), and TN (9 phyla) were the soil factors most closely related to microbial groups.
3.4. Nitrogen Functional Genes Abundance
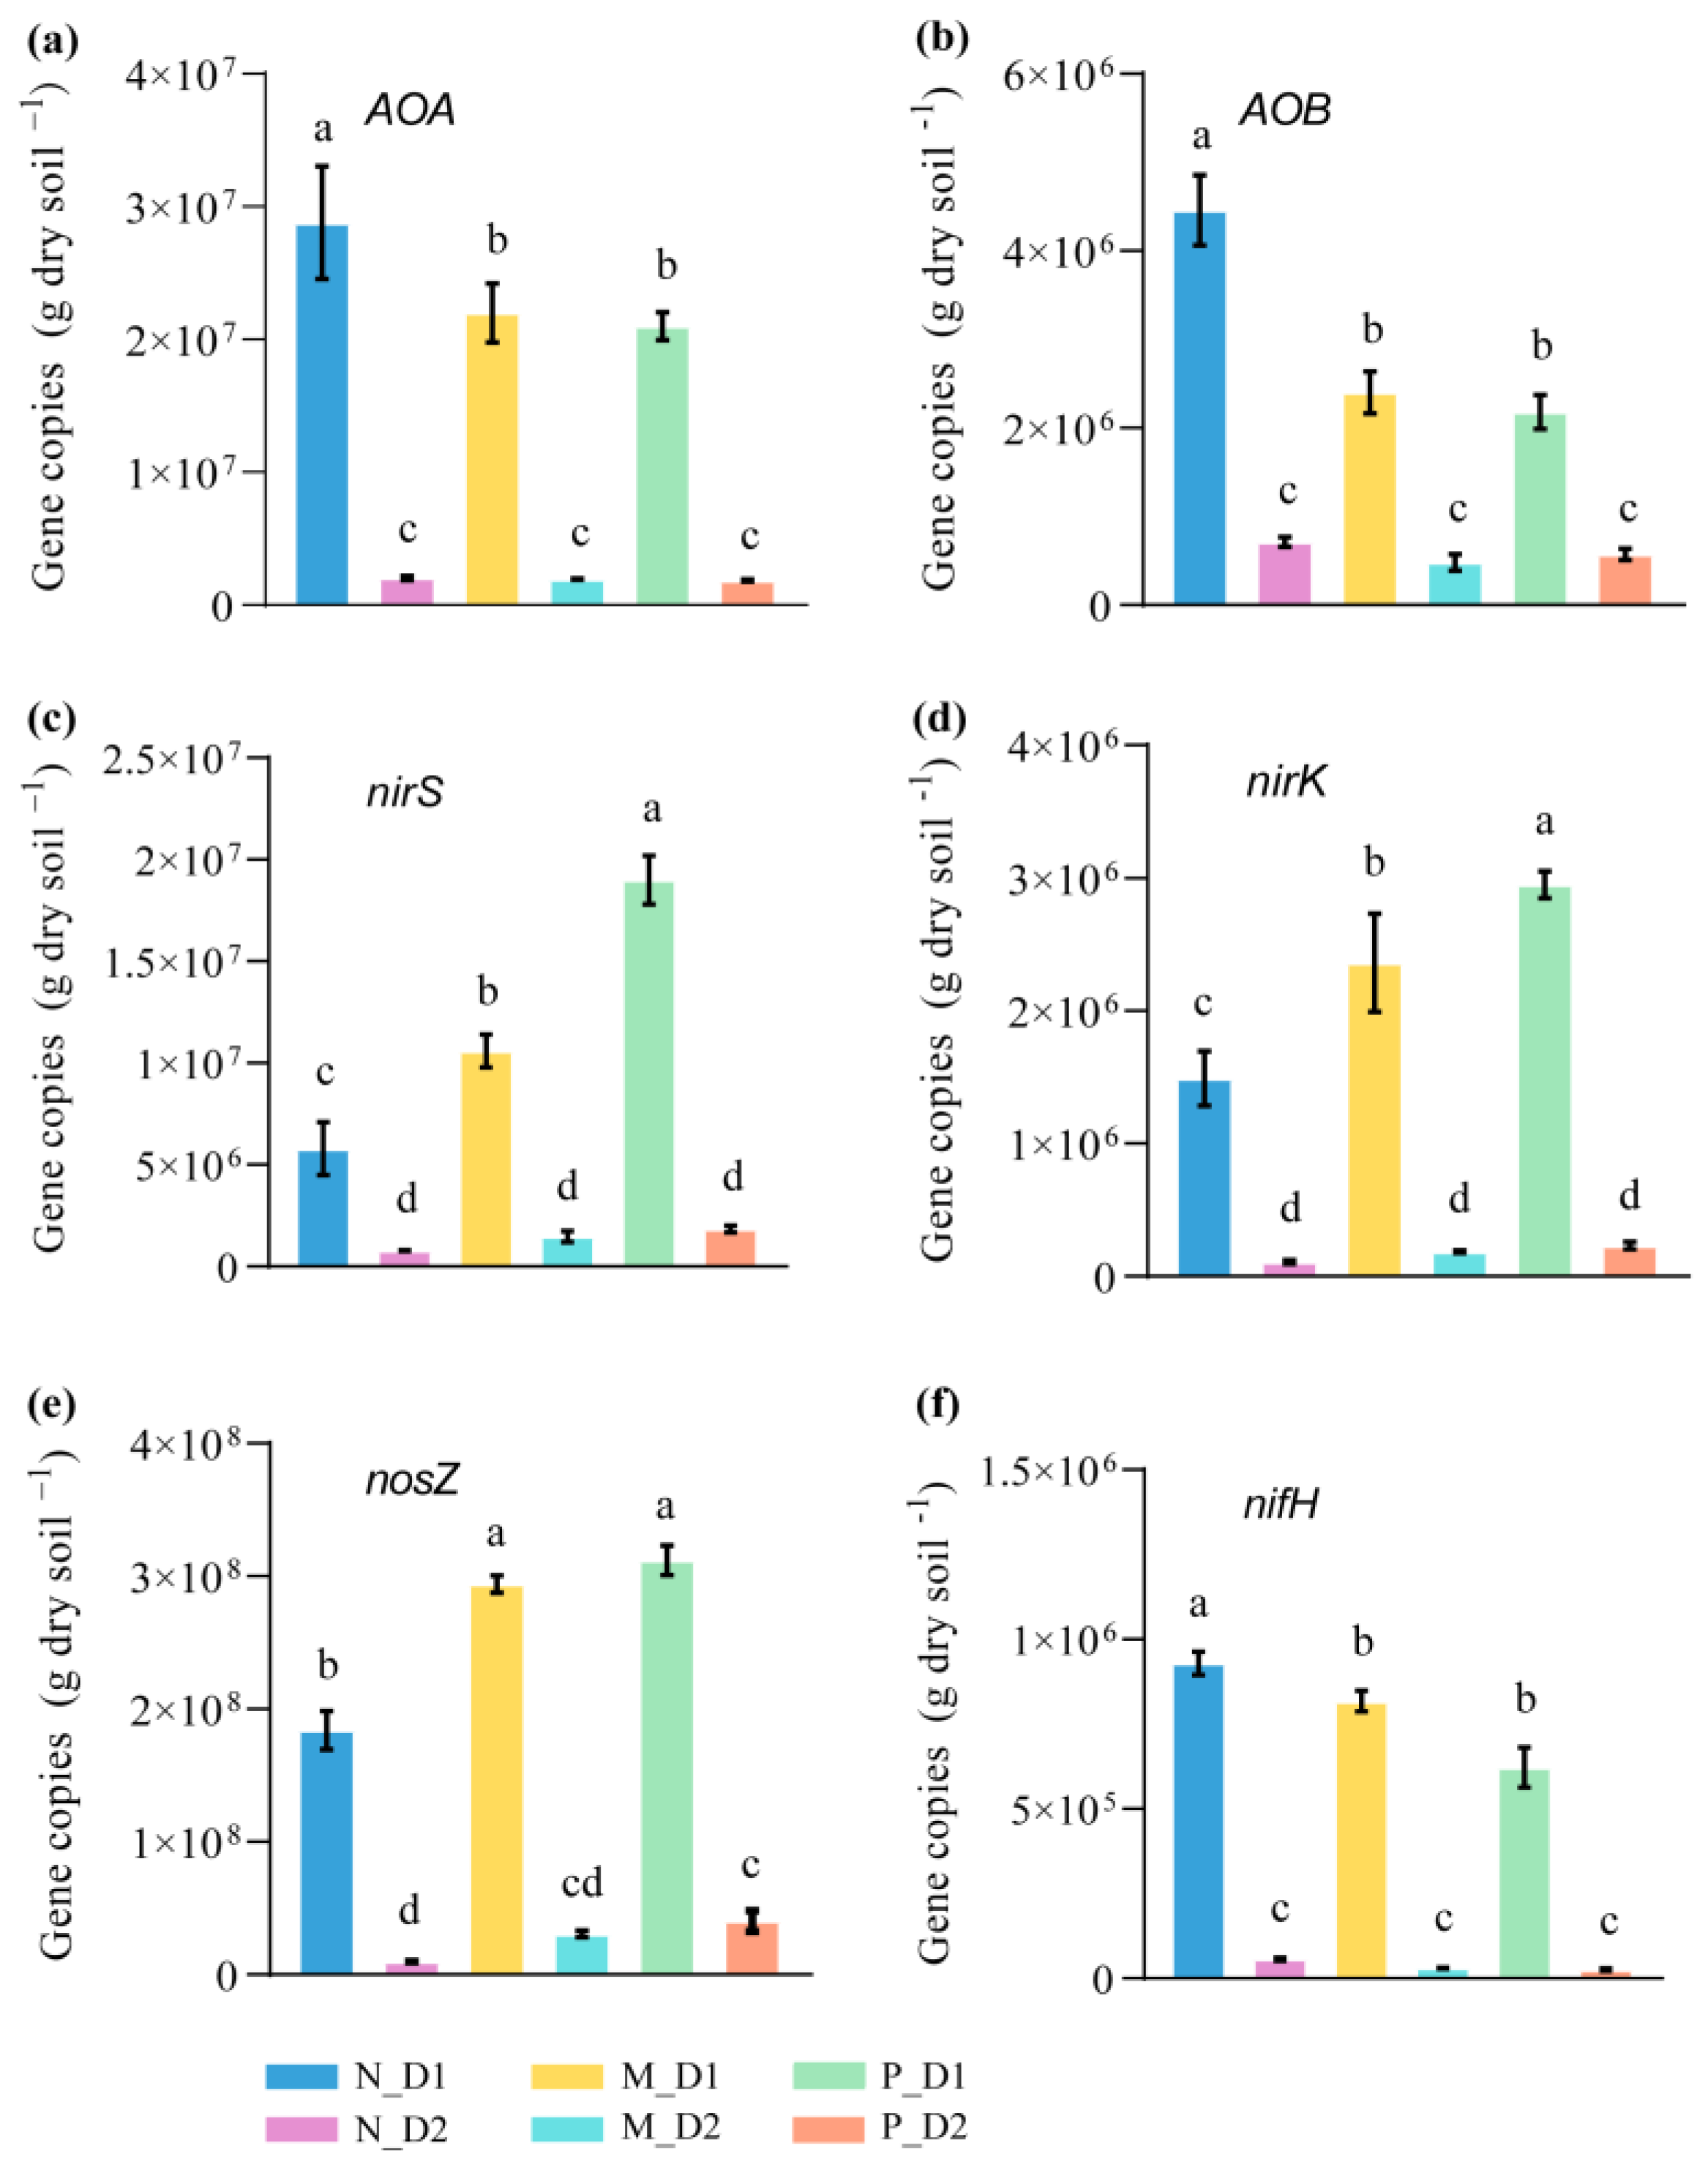
The number of gene copies of all nitrogen functional communities in the surface soil was significantly higher than that of the subsurface soil at the same forest types (Figure 5). All notable changes of gene copies caused by the conversion of forest types mainly occurred at the surface soil. The gene copies of ammonia-oxidizing archaea (AOA; F = 113.25, P < 0.001) and ammonia-oxidizing bacteria (AOB; F = 163.26, P < 0.001) in the mixed-species plantation and Chinese fir plantation were significantly lower than that of the natural broadleaved forest (Figure 5a,b). On the contrary, the number of denitrification gene copies, such as nirS (F = 351.26, P < 0.001), nirK (F = 114.09, P < 0.001), and nosZ (F = 749.47, P < 0.001), significantly increased after the conversion from natural forests to plantations (Figure 5c–e). Moreover, the gene copies of nifH (nitrogen fixation function) in natural forests was significantly higher than that of other forests (Figure 5f).
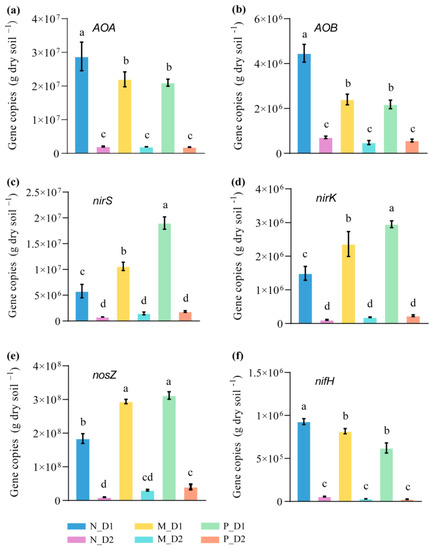
Figure 5.
Abundance of functional genes of amoA of archaea (ammonia-oxidizing archaea, AOA) (a), amoA of bacteria (ammonia-oxidizing bacteria, AOB) (b), nirS (c), nirK (d), nosZ (e), and nifH (f) from the soil samples. N: Natural broadleaved forest, M: Mixed-species plantation, P: Chinese fir (Cunninghamia lanceolata) plantation; D1: 0–20 cm, D2: 20–50 cm. Error bars represent the standard deviation (SD, n = 9). Lowercase letters indicate significant differences between groups based on the Tukey test (P < 0.05).
3.5. Correlations of Soil Properties and Nitrogen Functional Genes
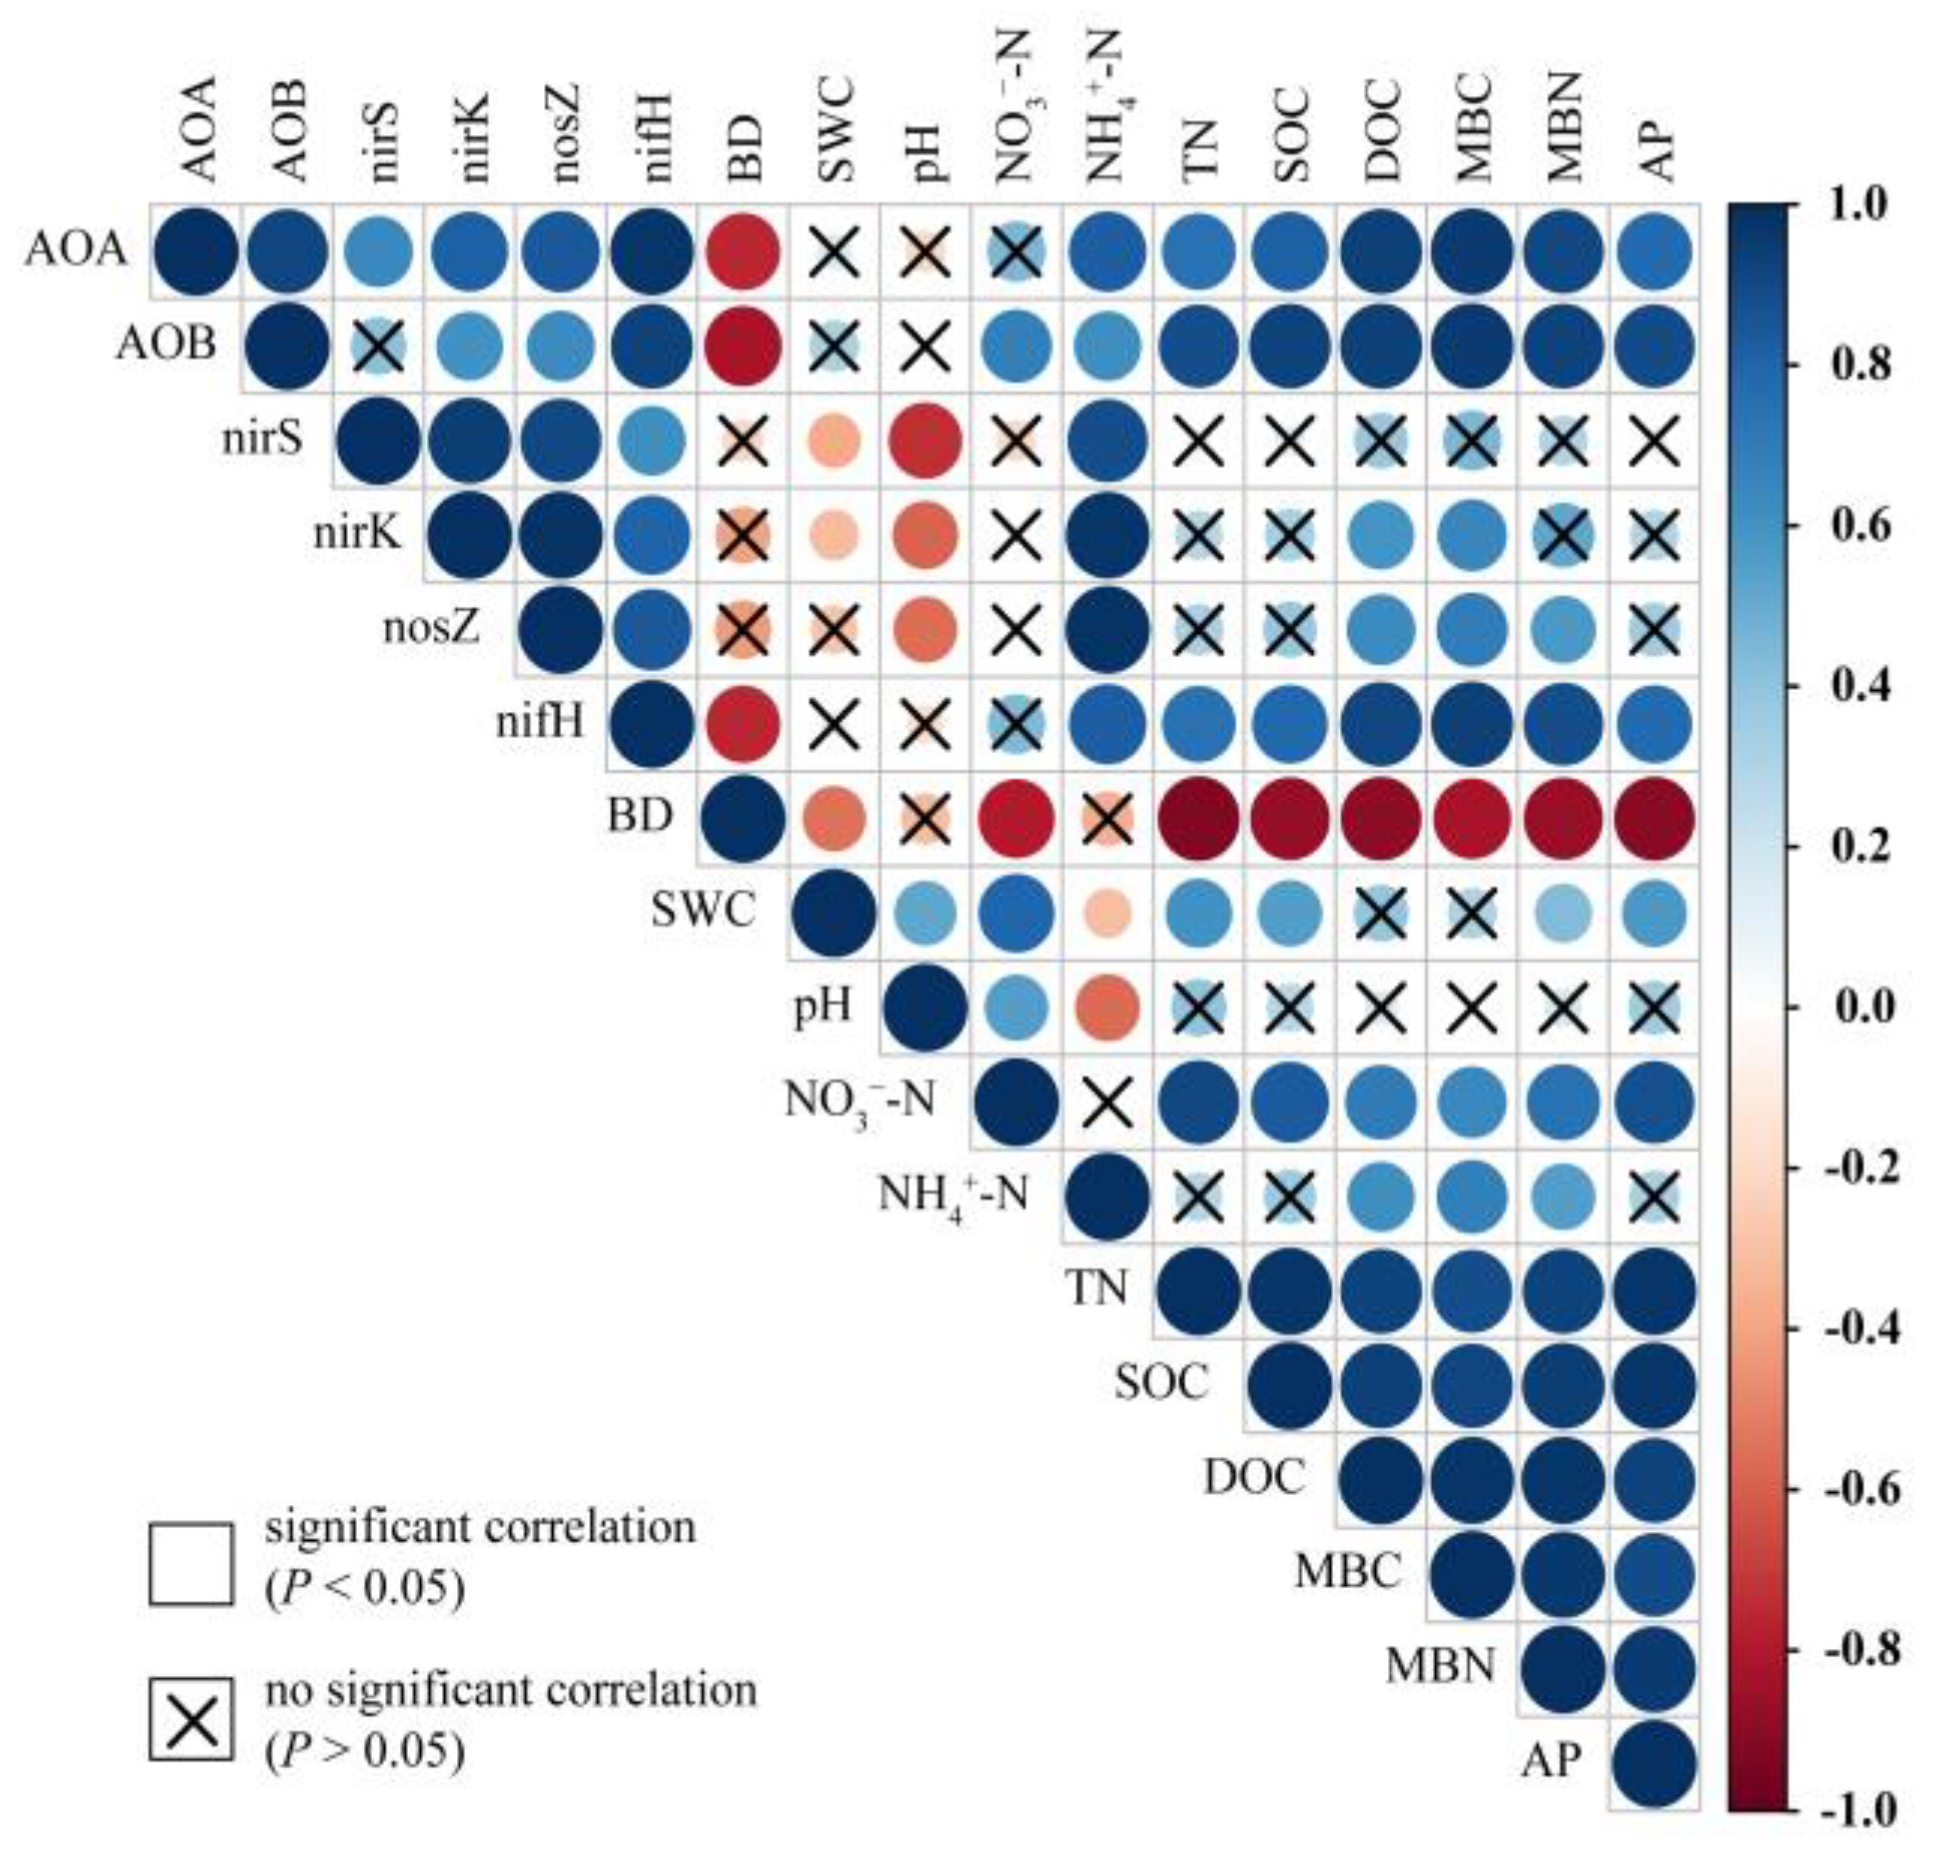
The abundance of AOA, AOB, and nifH showed a significantly negative correlation with BD, but a positive correlation with other soil properties (i.e., NH4+–N, TN, SOC, DOC, MBC, MBN, and AP) (Figure 6). The abundance of nirS was negatively correlated with SWC and pH but positively correlated with NH4+–N. The abundance of nirK was negatively correlated with SWC and pH but positively correlated with NH4+–N, DOC, and MBC. Moreover, the abundance of nosZ was negatively correlated with pH but positively correlated with NH4+–N, DOC, MBC, and MBN.

Figure 6.
Correlations between soil physicochemical properties and the abundance of functional communities related to the nitrogen cycle. The variables include soil bulk density (BD), soil water content (SWC), nitrate nitrogen (NO3−–N), ammonium nitrogen (NH4+–N), total nitrogen (TN), soil organic carbon (SOC), dissolved organic carbon (DOC), microbial biomass carbon (MBC), microbial biomass nitrogen (MBN), and available phosphorus (AP). The functional communities include ammonia-oxidizing archaea (AOA), ammonia-oxidizing bacteria (AOB), denitrifiers (nirS, nirK, and nosZ), and nitrogen fixers (nifH). The colors show the Pearson’s correlation coefficients and indicate a positive or negative correlation. The size of circles signifies the strength of the correlation. Non-significant correlations (P > 0.05) are marked.
3.6. Changes of Nitrogen Functional Communities with Forest Conversion
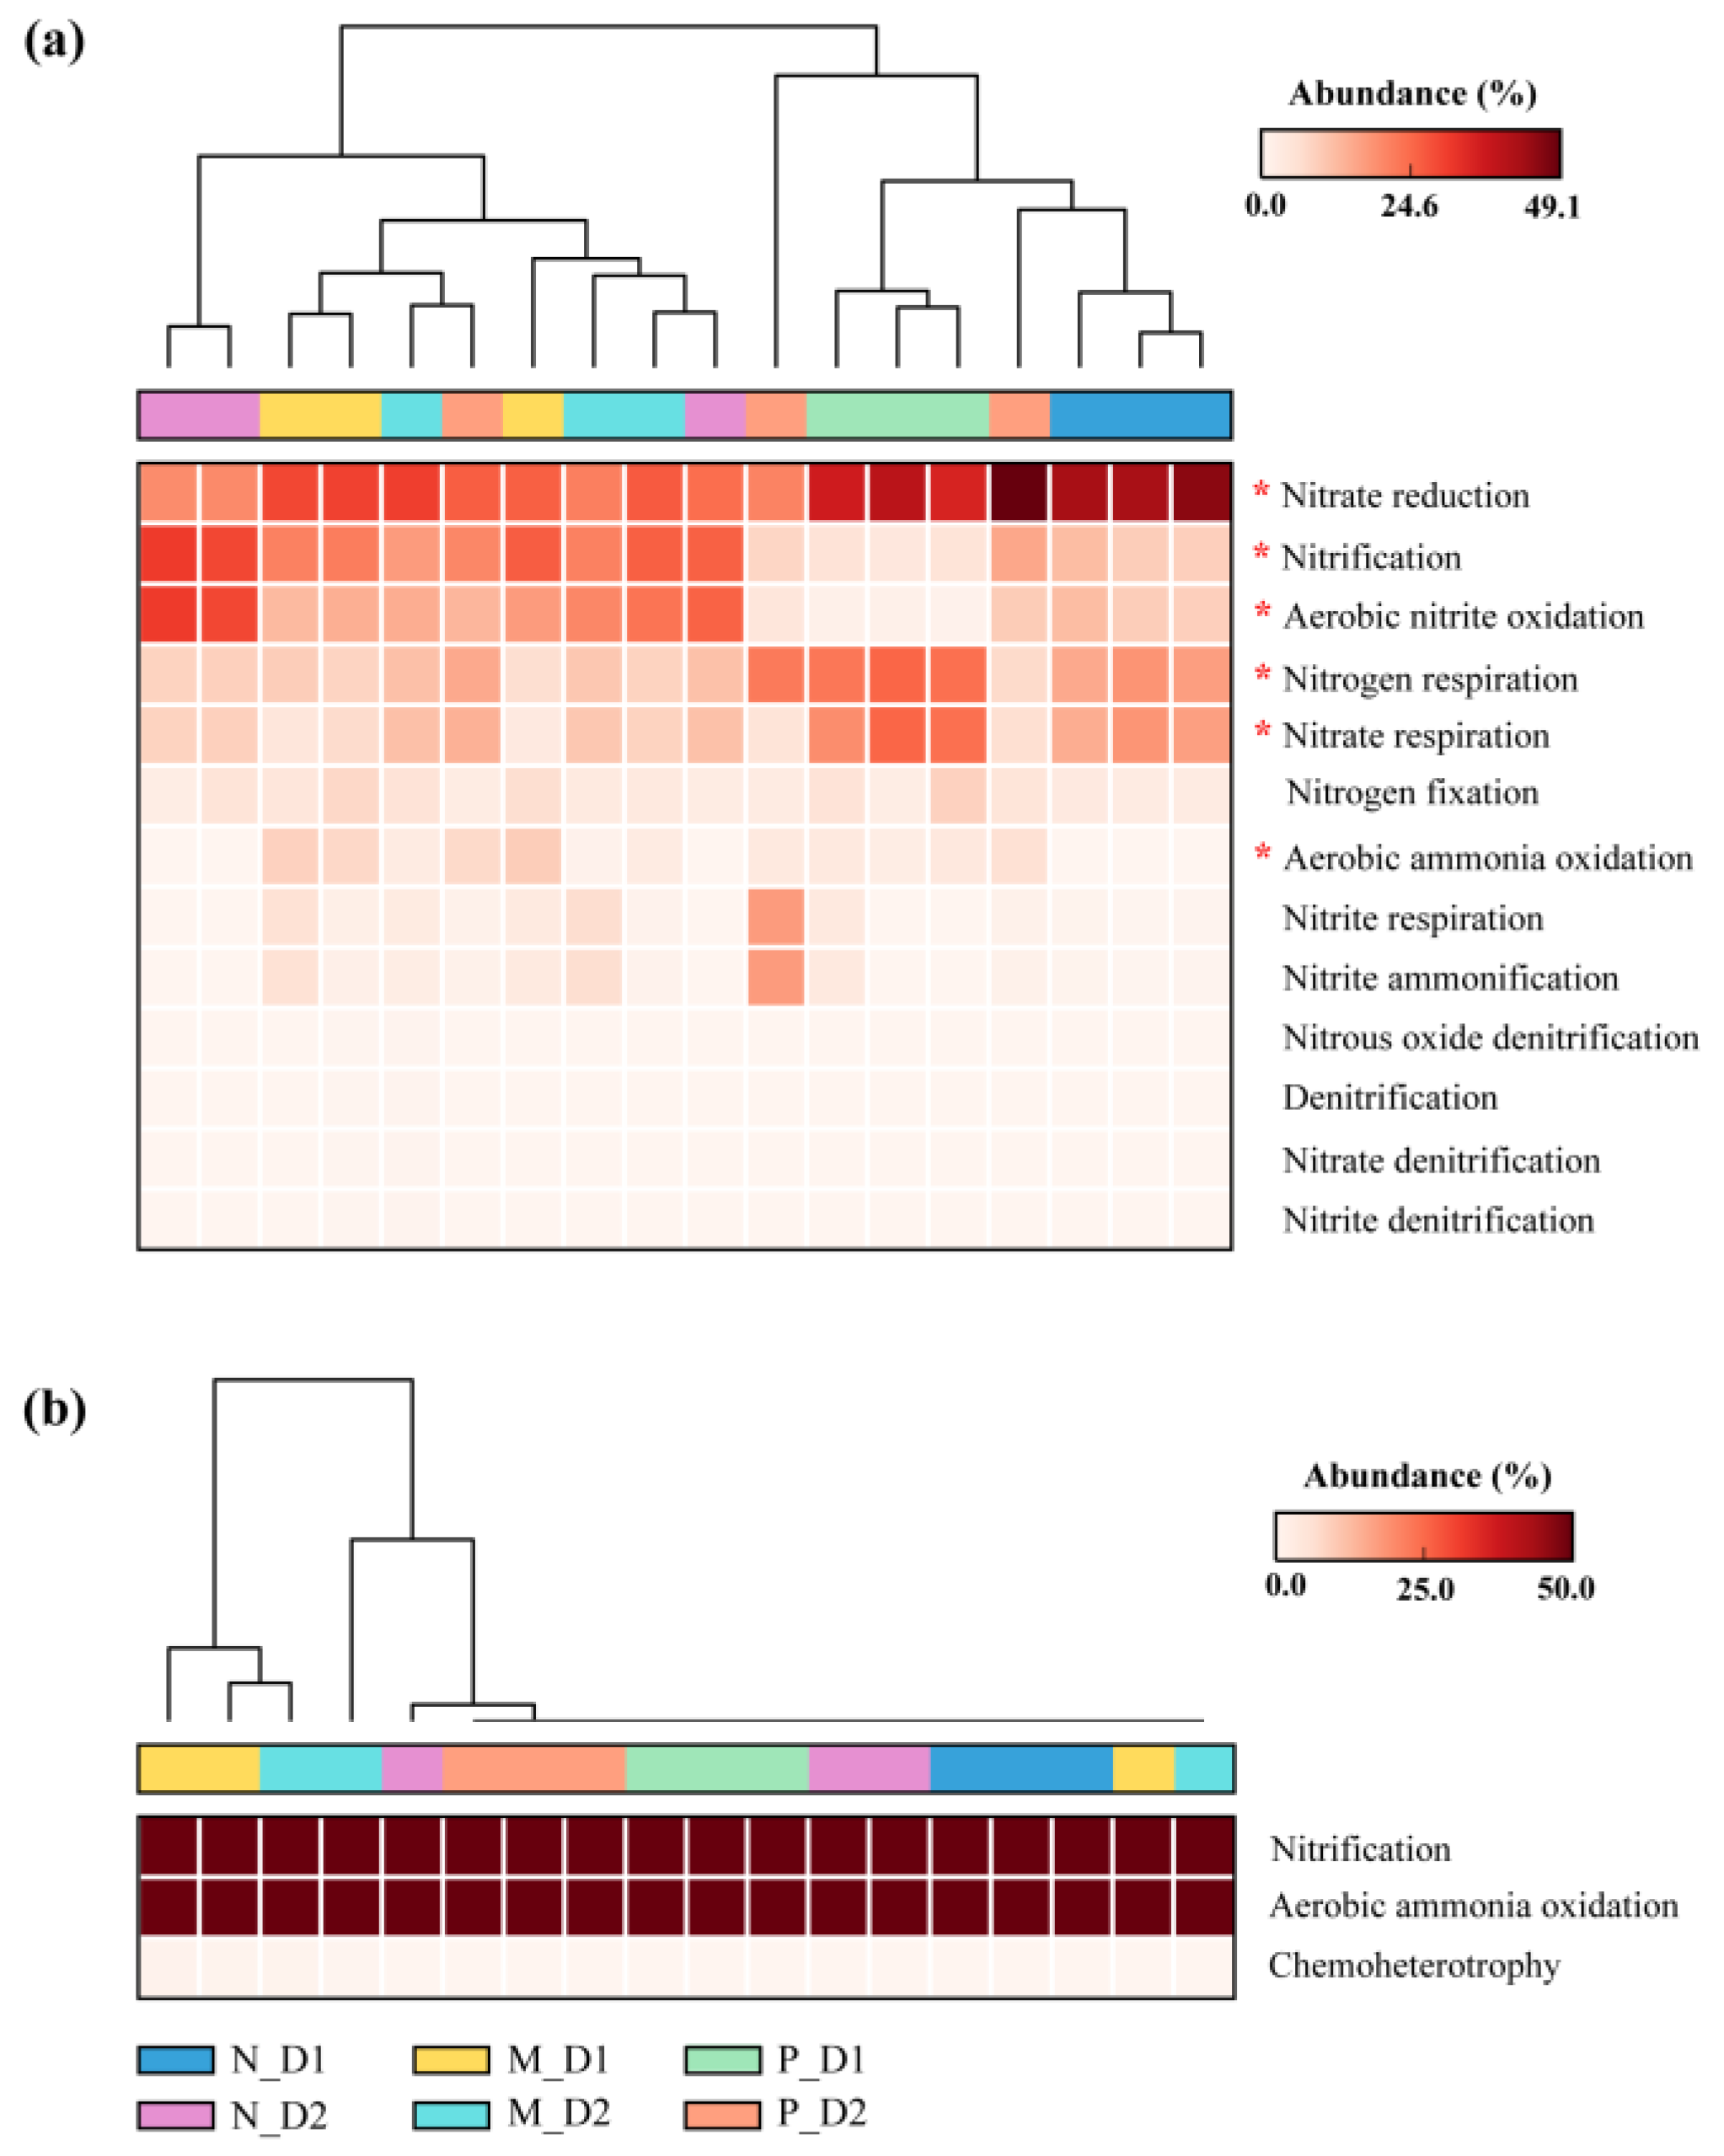
The relative abundance of nitrogen functional bacteria, including nitrate reduction, nitrification, aerobic nitrite oxidation, nitrogen respiration, nitrate respiration, and aerobic ammonia oxidation bacteria changed significantly with the conversion of forest types (P < 0.05; Figure 7). Specifically, nitrification and aerobic nitrite oxidation bacteria were more abundant in natural broadleaved forests and mixed-species plantations (P < 0.05; Figure S3). Aerobic ammonia oxidation bacteria were more abundant in pure Chinese fir plantations and surface soil of mixed-species plantations. However, nitrogen respiration and nitrate respiration bacteria were more abundant in the surface soil of pure Chinese fir plantations (P < 0.05). Finally, nitrate reduction bacteria only showed a significant difference between two soil depths in natural forests, i.e., the relative abundance of nitrate reduction bacteria in surface soil was higher than that of subsurface soil (P < 0.05).

Figure 7.
Variations in the relative abundance of the nitrogen functional bacteria (a) and archaea (b) identified by Functional Annotation of the Prokaryotic Taxa (FAPROTAX) database. N: Natural broadleaved forest, M: Mixed-species plantation, P: Chinese fir (Cunninghamia lanceolata) plantation; D1: 0–20 cm, D2: 20–50 cm. The asterisk (*) represents a significant difference determined by a post hoc Tukey–Kramer test (P < 0.05 after Benjamini–Hochberg correction).
4. Discussion
The structure of the soil microbial community is heavily determined by the overground populations of the ecosystem [48]. Changes in plant species have a significant influence on the composition of soil microbial communities [49]. Some previous studies reported an increase in the richness and diversity of microorganisms caused by the transition from natural forests to plantations [50,51]; however, we observed a converse result in this study, i.e., the conversion of natural forests to plantations led to a significant decline in the diversity and richness of bacteria and archaea (P < 0.05; Figure 1). This verifies our first objective regarding the changes in diversity and richness of bacteria and archaea communities with the forest conversion.
The decrease in bacteria may be due to the reduction of soil pH and soil organic carbon content [52,53]. A higher H+ concentration under a low pH status could destroy the permeability and stability of bacterial cell membranes [51], and then limit the microbial activity and bacterial growth [54]. The decrease in soil organic carbon input, after conversion from natural broadleaved forests to coniferous plantations [55], caused a decline of bacterial biomass [56]. Our observation of changes in soil physicochemical properties with a transformation of forest types confirmed these views. We found that soil pH, SOC, DOC, and MBC decreased significantly with the conversion from natural forests to plantations (Table 1). Soil pH in natural broadleaved forests is generally considered to be higher than in coniferous forests [57]. The decline of pH may be driven by the accumulation of nutrient cations in plant biomass and the increasing aluminum saturation of the soil exchange complex [58].
The reduction of archaea may be attributed to the change in ammonia concentrations with forest type conversion. On the one hand, Thaumarchaeota ammonia oxidizers tend to play a significant role in the nitrogen cycle when the ammonia concentration is too poor to sustain bacterial ammonia oxidizers in acidic forest soils [59]. On the other hand, archaea tend to be much less common and less active when the ammonia concentration is higher in acidic soil [60]. The soil of this study is a typical acid soil, and the pH ranged from 3.78 to 4.72 in the three forest types (Table 1). The concentration of NH4+–N increased significantly with the transformation from natural forest to plantation (Table 1). These findings reversely reflect the variation of archaea with the conversion of forest types.
Furthermore, microbial diversity and richness decreased significantly with soil depth (P < 0.05; Figure 1), which is consistent with previous studies [29,61]. The survival rate of some surface microorganisms in the underground soil declined due to the strong ecological filtration function of the vertical space [28]. Microbial communities in natural forests could be clearly distinguished from those in plantations (Figure 4a,c), which means the conversion of forest types has a significant effect on the composition of soil microbial communities. In underground vertical space, the microbial communities in the surface and subsurface soil presented an obvious stratification. This was supported by other studies. The transition zone for microbial communities usually occurred at a depth of 10–25 cm in natural forest soils [28]. In a poplar plantation, the transition zone for bacterial and archaeal communities was reported at a depth of 10–20 cm [29].
The 16S rRNA genes from soil bacteria belong to at least 32 phyla-level groups, and members of different phyla have various contributions to different soil bacterial communities [62]. The seven main bacterial phyla from this study were also observed in other ecosystems (Figure 2), such as forests [29,52], grasslands [63], and agricultural systems [64]. These findings suggested that soils from different ecosystems consist mainly of similar dominant bacterial communities, but the relative abundance of the taxa varied from those systems [65]. The abundance of archaea in soils is generally low [62]. In this study, the relative abundance of five known archaeal phyla was only 3.72%.
The relative abundance of bacteria and archaea in natural forests and plantations was significantly different (P < 0.05; Figure 2 and Figure S1). The main bacterial phylum—Actinobacteria—was more abundant in natural forests. As a copiotrophic taxon, the relative abundance of Actinobacteria was proven to positively correlate with soil pH [52], and increased with soil organic matter [65], total carbon, total nitrogen, and available nitrogen [66,67]. In this study, the higher content of SOC, DOC, MBC, TN, NO3−–N, MBN, and pH in natural forests than plantations supported these results. Interestingly, we found Chloroflexi was more abundant in subsurface soil of natural broadleaved forests and mixed-species plantations (Figure S1). This is consistent with the result of Frey et al. [68] who reported Chloroflexi to be more abundant in subsoils (110–155 cm) than in topsoil (0–25 cm). As an oligotrophic taxon, the presence of Chloroflexi in subsoils may indicate an adaptation of its members to the relatively low nutrient environment characteristics [68]. In addition, the relative abundance of Chloroflexi was reported to be positively correlated with soil pH [66]. In our study, a lower content of NH4+–N, SOC, DOC, MBC, MBN, and AP but a higher pH in subsurface soil (20–50 cm) of natural broadleaved forests and mixed-species plantations than surface soil (0–20 cm) from all forest types could be used for explaining these results. Moreover, the member of Chloroflexi includes autotrophic, heterotrophic, and mixotrophic taxa [69]. Therefore, different physiological strategies might be responsible for them coping with the conversion of forest types. Similarly, the main archaeal phylum—Crenarchaeota—has the same distribution pattern as Chloroflexi. We presumed that they adopted a similar oligotrophic survival strategy. The abundance of Crenarchaeota has been reported to be positively correlated with pH [70]. Crenarchaeal nitrifiers may have the potential ability to dominate the nitrifying community, although those Crenarchaeota seem to be oligotrophic nitrifiers, being relatively more abundant in soils with low nitrogen levels [71]. In addition, the natural forest has a more abundant Thaumarchaeota, which is consistent with the study of Pedrinho et al. [72]. These two archaeal phyla usually act as an important role in N cycling, and most of the members are involved in the process of ammonia oxidation in acidic soils [73]. The existence of an abundance of these microorganisms may help in the mineralization process and contribute to N availability [74].
On the contrary, some communities, such as the main bacterial phyla Acidobacteria have a higher abundance in plantations. This may be attributed to a relatively low soil pH in plantations. Previous studies have demonstrated that lower pH is beneficial to Acidobacteria, its distribution being negatively correlated with soil pH [75]. The Acidobacteria exhibit a slow metabolic rate under low nutrient conditions and are versatile heterotrophs [76] and oligotrophs [77]. However, other rare bacterial and archaeal communities with low relative abundance could not be ignored, and they have their preferred environments. Some of them may have unique traits or affect other species, thus affecting ecosystem function [78]. The strategies of these rare taxa have close interactions with abundant species, which may be attributed to the complex relationship with soil properties, especially the availability of carbon, nitrogen, and phosphorus (Figure S2). However, their ecological functions remain to be further explored. All these results demonstrate our second objective concerning the close relationship between microbial communities and soil physicochemical properties undergoing a transition of forest types.
There were more than 70% shared OTUs within three forest types (Figure 3). This indicates that the presence of core microbial communities could resist or adapt to the interference due to changes from forest tree species. We also found that the total and unique number of OTUs in the mixed-species plantation were all higher than that of natural broadleaved forests and pure Chinese fir plantations (Figure 3). As a result, mixed forests might provide a more suitable habitat and higher survival possibilities for microorganisms, compared with the natural forest and pure forest. Soil bacterial structure in the natural broadleaved forest is different from that in the coniferous forest [65]. Changes in tree species affect soil properties, and act on microbial communities [79]. It has been previously reported that soil nutrient availability is correlated with the microbial community [80]. Among numerous soil properties, we found that SOC, TN, NO3−–N, and AP have a significant influence on bacterial and archaeal community structures (Figure 4b,d), which may be attributed to the larger variation of these properties (Table 1). The content of these soil nutrients decreased significantly after the conversion of forests (Table 1), which will bring a negative influence on microbial growth. This result is consistent with previous studies on the conversion from natural forests to plantations [51,81].
The nitrogen cycle is one of the most essential ecological processes in which microorganisms participate [82]. Sequences linked to Proteobacteria and Acidobacteria were the most abundant in all three types of forests (Figure 2). Members of these phyla have wide metabolic and physiological diversity, which is very important for the soil carbon and nitrogen cycles [83,84]. It was reported that these two phyla are the predominant groups in acidic soil, and they are adversely affected by forest conversion and fertilizer use [85,86]. Previous studies have demonstrated that members of Alphaproteobacteria (especially the order Caulobacterales and Rhodospirillales) are responsible for the decomposition and recycling of organic compounds and play an important role in the denitrification process [87,88]. In this study, we observed that the conversion from natural forests to Chinese fir plantations, firstly, did not cause a reduction in the abundance of Proteobacteria and Acidobacteria, and secondly, brought a large increase in the abundance of Alphaproteobacteria. The growth of these taxa is projected to increase the denitrification potential of the soil nitrogen cycle in Chinese fir plantations. The increased number of denitrification gene copies, such as nirS, nirK, and nosZ (Figure 5c–e), and the more abundant nitrogen respiration and nitrate respiration bacteria (Figure S3) after the conversion from natural forests into plantations supported this hypothesis. Therefore, the conversion from natural broadleaved forests into Chinese fir plantations may increase the potential risk of N2O emissions in this area.
AOA and AOB could oxidize ammonium/ammonia into other forms of inorganic and reactive nitrogen in the N cycle [89]. In this study, the gene copies of AOA and AOB decreased after the conversion from natural forests into plantations (Figure 5). Interestingly, aerobic ammonia oxidation bacteria from the functional annotation of nitrogen functional communities showed a higher relative abundance in plantations (Figure S3). This seems to be contradictory. However, the low relative abundance of nitrification and aerobic nitrite oxidation bacteria in plantations may partly explain this contradiction (Figure S3). As a result, it may be the reduction of nitrification and aerobic nitrite oxidation bacteria rather than the decline of AOA and AOB abundances after conversion from natural forests to Chinese fir plantations, to be responsible for the weakening of soil nitrification potentials. The fade of nitrification may limit the production of N2O, since AOA and AOB are responsible for the production of N2O in the aerobic soil. In addition, members of Actinobacteria, such as the order Acidimicrobiales, Micromonosporales, Rubrobacterales, and Solirubrobacterales, can perform certain soil functions, including nitrogen fixation and organic material decomposition [90]. In this study, nitrogen fixation function (nifH) gene copies decreased with the conversion from natural forests to plantations (Figure 5f), which indicated a negative influence on soil nitrogen fixation processes. These results confirmed our third objective concerning the deep influence of forest-type transformations on nitrogen-functional communities.
5. Conclusions
The transformation of natural broadleaved forests into Chinese fir plantations could directly impact soil physicochemical properties and, in turn, affect the abundance, composition, and structure of soil bacterial and archaeal communities. Soil pH and nutrient quantity (content) and quality (availability), especially C, N, and P, significantly acted on the change of microbial communities. Among numerous soil properties, we observed that SOC, NO3−–N, TN, and AP were essential soil factors closely linked to the structure and composition of bacterial and archaeal communities. The rare taxa have a close relationship with soil physicochemical properties and abundant taxa, and thus their ecological functions need to be further determined. The functional group of denitrifies increased, while the functional group of nitrifiers and nitrogen fixation decreased after transforming from natural broadleaved forests into Chinese fir plantations. This suggests an enhancement of denitrification but a weakening of nitrification and nitrogen fixation in Chinese fir plantations. The enhancement of denitrification may increase the risk of N2O emission, but the fade of nitrification may limit the production of N2O. However, how the dynamic of N2O is affected by forest-type conversions needs to be further explored by combining with the measurement of N2O flux. In all, these findings can provide valuable insights into the role of forest conversions on the soil nitrogen cycle, in order to cope with global climate change.
Supplementary Materials
The following supporting information can be downloaded at: https://www.mdpi.com/article/10.3390/f13020158/s1, Figure S1: Comparison of the relative abundance of bacteria (a) and archaea (b) at the phyla level in different soil depths (D1: 0–20 cm, D2: 20–50 cm) from natural broadleaved forests (N), mixed-species plantations (M), and Chinese fir (Cunninghamia lanceolata) plantations (P); Figure S2: Pearson’s rank correlation coefficients and statistical significance between phyla of bacteria and archaea to soil physiochemical properties. Left figures (a,c) show the difference at 0.05 level, and right figures (b,d) show the difference at 0.01 level; Figure S3: Comparison of the relative abundance of nitrogen functional bacterial communities in different soil depth (D1: 0–20 cm, D2: 20–50 cm) from natural broadleaved forests (N), mixed-species plantations (M), and Chinese fir (Cunninghamia lanceolata) plantations (P); Table S1: Basic status of natural broadleaved forest (N), mixed-species forest (M), and Chinese fir (Cunninghamia lanceolata) plantation (P) (mean ± Standard deviation); Table S2: Primers and PCR amplification conditions used in qPCR analysis of nitrogen cycle functional genes.
Author Contributions
J.G., writing—original draft, methodology, and formal analysis; H.F., methodology, investigation, and data curation; P.M., writing—review and editing, grammar checking; W.W. and C.P. (Changhui Peng), methodology, writing—review and editing, supervision; L.F., J.S. and C.P. (Chang Pan), writing—review and editing; Y.Y., conceptualization, supervision, writing—review and editing, and funding acquisition. All authors have read and agreed to the published version of the manuscript.
Funding
This work was supported by the National Key Research and Development Program of China (grant nos. 2021YFD2201304), the China Scholarship Council (grant nos. 202008320477 and 202108320313), the Jiangsu Government Scholarship for Overseas Studies (JS-2020-194), and the Priority Academic Program Development of Jiangsu Higher Education Institution (PAPD).
Data Availability Statement
The data presented in this study are available on request from the corresponding author.
Conflicts of Interest
The authors declare no conflict of interest.
References
- Brockerhoff, E.G.; Barbaro, L.; Castagneyrol, B.; Forrester, D.I.; Gardiner, B.; González-Olabarria, J.R.; Lyver, P.O.; Meurisse, N.; Oxbrough, A.; Taki, H.; et al. Forest biodiversity, ecosystem functioning and the provision of ecosystem services. Biodivers. Conserv. 2017, 26, 3005–3035. [Google Scholar] [CrossRef] [Green Version]
- Pan, Y.D.; Birdsey, R.A.; Fang, J.Y.; Houghton, R.; Kauppi, P.E.; Kurz, W.A.; Phillips, O.L.; Shvidenko, A.; Lewis, S.L.; Canadell, J.G.; et al. A Large and Persistent Carbon Sink in the World’s Forests. Science 2011, 333, 988–993. [Google Scholar] [CrossRef] [PubMed] [Green Version]
- Piao, S.; Fang, J.; Ciais, P.; Peylin, P.; Huang, Y.; Sitch, S.; Wang, T. The carbon balance of terrestrial ecosystems in China. Nature 2009, 458, 1009–1013. [Google Scholar] [CrossRef]
- Tajik, S.; Ayoubi, S.; Khajehali, J.; Shataee, S. Effects of tree species composition on soil properties and invertebrates in a deciduous forest. Arab. J. Geosci. 2019, 12, 368. [Google Scholar] [CrossRef]
- Tajik, S.; Ayoubi, S.; Shirani, H.; Zeraatpisheh, M. Digital mapping of soil invertebrates using environmental attributes in a deciduous forest ecosystem. Geoderma 2019, 353, 252–263. [Google Scholar] [CrossRef]
- Foley, J.A.; De Fries, R.; Asner, G.P.; Barford, C.; Bonan, G.; Carpenter, S.R.; Chapin, F.S.; Coe, M.T.; Daily, G.C.; Gibbs, H.K.; et al. Global consequences of land use. Science 2005, 309, 570–574. [Google Scholar] [CrossRef] [Green Version]
- Falahatkar, S.; Hosseini, S.M.; Mahiny, A.S.; Ayoubi, S.; Wang, S.-q. Soil organic carbon stock as affected by land use/cover changes in the humid region of northern Iran. J. Mt. Sci. 2014, 11, 507–518. [Google Scholar] [CrossRef]
- Ayoubi, S.; Sadeghi, N.; Abbaszadeh Afshar, F.; Abdi, M.R.; Zeraatpisheh, M.; Rodrigo-Comino, J. Impacts of oak deforestation and rainfed cultivation on soil redistribution processes across hillslopes using 137Cs techniques. For. Ecosyst. 2021, 8, 32. [Google Scholar] [CrossRef]
- Khormali, F.; Ajami, M.; Ayoubi, S.; Srinivasarao, C.; Wani, S.P. Role of deforestation and hillslope position on soil quality attributes of loess-derived soils in Golestan province, Iran. Agric. Ecosyst. Environ. 2009, 134, 178–189. [Google Scholar] [CrossRef]
- Hansen, M.C.; Potapov, P.V.; Moore, R.; Hancher, M.; Turubanova, S.A.; Tyukavina, A.; Thau, D.; Stehman, S.V.; Goetz, S.J.; Loveland, T.R.; et al. High-resolution global maps of 21st-century forest cover change. Science 2013, 342, 850–853. [Google Scholar] [CrossRef] [PubMed] [Green Version]
- de Gannes, V.; Bekele, I.; Dipchansingh, D.; Wuddivira, M.N.; De Cairies, S.; Boman, M.; Hickey, W.J. Microbial Community Structure and Function of Soil Following Ecosystem Conversion from Native Forests to Teak Plantation Forests. Front. Microbiol. 2016, 7, 1976. [Google Scholar] [CrossRef] [PubMed] [Green Version]
- Kitson, E.; Bell, N.G.A. The response of microbial communities to peatland drainage and rewetting. A review. Front. Microbiol. 2020, 11, 582812. [Google Scholar] [CrossRef]
- Urbanova, M.; Snajdr, J.; Baldrian, P. Composition of fungal and bacterial communities in forest litter and soil is largely determined by dominant trees. Soil Biol. Biochem. 2015, 84, 53–64. [Google Scholar] [CrossRef]
- Nakayama, M.; Imamura, S.; Taniguchi, T.; Tateno, R. Does conversion from natural forest to plantation affect fungal and bacterial biodiversity, community structure, and co-occurrence networks in the organic horizon and mineral soil? For. Ecol. Manag. 2019, 446, 238–250. [Google Scholar] [CrossRef]
- Fierer, N.; Jackson, R.B. The diversity and biogeography of soil bacterial communities. Proc. Natl. Acad. Sci. USA 2006, 103, 626–631. [Google Scholar] [CrossRef] [PubMed] [Green Version]
- Tajik, S.; Ayoubi, S.; Lorenz, N. Soil microbial communities affected by vegetation, topography and soil properties in a forest ecosystem. Appl. Soil Ecol. 2020, 149, 103514. [Google Scholar] [CrossRef]
- Tajik, S.; Ayoubi, S.; Nourbakhsh, F. Prediction of soil enzymes activity by digital terrain analysis: Comparing artificial neural network and multiple linear regression models. Environ. Eng. Sci. 2012, 29, 798–806. [Google Scholar] [CrossRef]
- Delgado-Baquerizo, M.; Maestre, F.T.; Reich, P.B.; Jeffries, T.C.; Gaitan, J.J.; Encinar, D.; Berdugo, M.; Campbell, C.D.; Singh, B.K. Microbial diversity drives multifunctionality in terrestrial ecosystems. Nat. Commun. 2016, 7, 10541. [Google Scholar] [CrossRef] [Green Version]
- van der Heijden, M.G.; Bardgett, R.D.; van Straalen, N.M. The unseen majority: Soil microbes as drivers of plant diversity and productivity in terrestrial ecosystems. Ecol. Lett. 2008, 11, 296–310. [Google Scholar] [CrossRef] [PubMed]
- Vitali, F.; Mastromei, G.; Senatore, G.; Caroppo, C.; Casalone, E. Long lasting effects of the conversion from natural forest to poplar plantation on soil microbial communities. Microbiol. Res. 2016, 182, 89–98. [Google Scholar] [CrossRef]
- Wagg, C.; Bender, S.F.; Widmer, F.; van der Heijden, M.G.A. Soil biodiversity and soil community composition determine ecosystem multifunctionality. Proc. Natl. Acad. Sci. USA 2014, 111, 5266–5270. [Google Scholar] [CrossRef] [PubMed] [Green Version]
- Meng, M.; Chen, H.; Lin, J.; Liu, X.; Guo, X.; Yuan, Y.; Zhang, J. Long term forest conversion affected soil nanoscale pores in subtropical China. Catena 2020, 185, 104289. [Google Scholar] [CrossRef]
- Bai, S.; Qiu, W.; Zhang, H.; Wang, Y.; Berninger, F. Soil respiration following Chinese fir plantation clear-cut: Comparison of two forest regeneration approaches. Sci. Total Environ. 2020, 709, 135980. [Google Scholar] [CrossRef]
- Xiong, D.; Huang, J.; Yang, Z.; Cai, Y.; Lin, T.-C.; Liu, X.; Xu, C.; Chen, S.; Chen, G.; Xie, J.; et al. The effects of warming and nitrogen addition on fine root exudation rates in a young Chinese-fir stand. For. Ecol. Manag. 2020, 458, 117793. [Google Scholar] [CrossRef]
- Tedersoo, L.; Bahram, M.; Cajthaml, T.; Põlme, S.; Hiiesalu, I.; Anslan, S.; Harend, H.; Buegger, F.; Pritsch, K.; Koricheva, J.; et al. Tree diversity and species identity effects on soil fungi, protists and animals are context dependent. ISME J. 2016, 10, 346–362. [Google Scholar] [CrossRef] [Green Version]
- Llado, S.; Lopez-Mondejar, R.; Baldrian, P. Forest soil bacteria: Diversity, involvement in ecosystem processes, and response to global change. Microbiol. Mol. Biol. Rev. 2017, 81, e00063-16. [Google Scholar] [CrossRef] [Green Version]
- Staff, S.S. Keys to Soil Taxonomy, 12th ed.; USDA-Natural Resources Conservation Service: Washington, DC, USA, 2014; pp. 283–303.
- Eilers, K.G.; Debenport, S.; Anderson, S.; Fierer, N. Digging deeper to find unique microbial communities: The strong effect of depth on the structure of bacterial and archaeal communities in soil. Soil Biol. Biochem. 2012, 50, 58–65. [Google Scholar] [CrossRef]
- Feng, H.; Guo, J.; Wang, W.; Song, X.; Yu, S. Soil depth determines the composition and diversity of bacterial and archaeal communities in a poplar plantation. Forests 2019, 10, 550. [Google Scholar] [CrossRef] [Green Version]
- Lu, R. Soil and Agro-Chemical Analytical Methods; China Agricultural Science and Technology Press: Beijing, China, 1999; pp. 146–195. [Google Scholar]
- Brookes, P.C.; Landman, A.; Pruden, G.; Jenkinson, D.S. Chloroform fumigation and the release of soil nitrogen: A rapid direct extraction method to measure microbial biomass nitrogen in soil. Soil Biol. Biochem. 1985, 17, 837–842. [Google Scholar] [CrossRef]
- Vance, E.D.; Brookes, P.C.; Jenkinson, D.S. An extraction method for measuring soil microbial biomass C. Soil Biol. Biochem. 1987, 19, 703–707. [Google Scholar] [CrossRef]
- Ren, C.; Zhang, W.; Zhong, Z.; Han, X.; Yang, G.; Feng, Y.; Ren, G. Differential responses of soil microbial biomass, diversity, and compositions to altitudinal gradients depend on plant and soil characteristics. Sci. Total Environ. 2018, 610–611, 750–758. [Google Scholar] [CrossRef] [PubMed]
- Olsen, S.R. Estimation of Available Phosphorus in Soils by Extraction with Sodium Bicarbonate; United States Department of Agriculture: Washington, DC, USA, 1954; pp. 1–19.
- Rotthauwe, J.H.; Witzel, K.P.; Liesack, W. The ammonia monooxygenase structural gene amoA as a functional marker: Molecular fine-scale analysis of natural ammonia-oxidizing populations. Appl. Environ. Microbiol. 1997, 63, 4704–4712. [Google Scholar] [CrossRef] [Green Version]
- Francis, C.A.; Roberts, K.J.; Beman, J.M.; Santoro, A.E.; Oakley, B.B. Ubiquity and diversity of ammonia-oxidizing archaea in water columns and sediments of the ocean. Proc. Natl. Acad. Sci. USA 2005, 102, 14683–14688. [Google Scholar] [CrossRef] [PubMed] [Green Version]
- Palmer, K.; Biasi, C.; Horn, M.A. Contrasting denitrifier communities relate to contrasting N2O emission patterns from acidic peat soils in arctic tundra. ISME J. 2012, 6, 1058–1077. [Google Scholar] [CrossRef] [Green Version]
- Hallin, S.; Lindgren, P.-E. PCR detection of genes encoding nitrite reductase in denitrifying bacteria. Appl. Environ. Microbiol. 1999, 65, 1652–1657. [Google Scholar] [CrossRef] [PubMed] [Green Version]
- Kloos, K.; Mergel, A.; Rosch, C.; Bothe, H. Denitrification within the genus Azospirillum and other associative bacteria. Aust. J. Plant Physiol. 2001, 28, 991–998. [Google Scholar] [CrossRef]
- Rösch, C.; Mergel, A.; Bothe, H. Biodiversity of denitrifying and dinitrogen-fixing bacteria in an acid forest Soil. Appl. Environ. Microbiol. 2002, 68, 3818–3829. [Google Scholar] [CrossRef] [Green Version]
- Edgar, R.C. Search and clustering orders of magnitude faster than BLAST. Bioinformatics 2010, 26, 2460–2461. [Google Scholar] [CrossRef] [Green Version]
- Quast, C.; Pruesse, E.; Yilmaz, P.; Gerken, J.; Schweer, T.; Yarza, P.; Peplies, J.; Glöckner, F.O. The SILVA ribosomal RNA gene database project: Improved data processing and web-based tools. Nucleic Acids Res. 2012, 41, D590–D596. [Google Scholar] [CrossRef]
- Zheng, H.; Liu, Y.; Chen, Y.; Zhang, J.; Li, H.; Wang, L.; Chen, Q. Short-term warming shifts microbial nutrient limitation without changing the bacterial community structure in an alpine timberline of the eastern Tibetan Plateau. Geoderma 2020, 360, 113985. [Google Scholar] [CrossRef]
- Louca, S.; Parfrey, L.W.; Doebeli, M. Decoupling function and taxonomy in the global ocean microbiome. Science 2016, 353, 1272–1277. [Google Scholar] [CrossRef] [PubMed]
- Hammer, Ø.; Harper, D.A.; Ryan, P.D. PAST: Paleontological statistics software package for education and data analysis. Palaeontol. Electron. 2001, 4, 9. [Google Scholar]
- Anderson, M.J. A new method for non-parametric multivariate analysis of variance. Austral Ecol. 2001, 26, 32–46. [Google Scholar]
- Benjamini, Y.; Hochberg, Y. Controlling the false discovery rate: A practical and powerful approach to multiple testing. J. R. Statist. Soc. B 1995, 57, 289–300. [Google Scholar] [CrossRef]
- Wardle, D.A.; Bardgett, R.D.; Klironomos, J.N.; Setälä, H.; van der Putten, W.H.; Wall, D.H. Ecological linkages between aboveground and belowground biota. Science 2004, 304, 1629–1633. [Google Scholar] [CrossRef]
- Lange, M.; Eisenhauer, N.; Sierra, C.A.; Bessler, H.; Engels, C.; Griffiths, R.I.; Mellado-Vázquez, P.G.; Malik, A.A.; Roy, J.; Scheu, S.; et al. Plant diversity increases soil microbial activity and soil carbon storage. Nat. Commun. 2015, 6, 6707. [Google Scholar] [CrossRef]
- Ponge, J.-F.; Pérès, G.; Guernion, M.; Ruiz-Camacho, N.; Cortet, J.; Pernin, C.; Villenave, C.; Chaussod, R.; Martin-Laurent, F.; Bispo, A.; et al. The impact of agricultural practices on soil biota: A regional study. Soil Biol. Biochem. 2013, 67, 271–284. [Google Scholar] [CrossRef] [Green Version]
- Liu, T.; Wu, X.; Li, H.; Alharbi, H.; Wang, J.; Dang, P.; Chen, X.; Kuzyakov, Y.; Yan, W. Soil organic matter, nitrogen and pH driven change in bacterial community following forest conversion. For. Ecol. Manag. 2020, 477, 118473. [Google Scholar] [CrossRef]
- Lauber, C.L.; Hamady, M.; Knight, R.; Fierer, N. Pyrosequencing-based assessment of soil pH as a predictor of soil bacterial community structure at the continental scale. Appl. Environ. Microbiol. 2009, 75, 5111–5120. [Google Scholar] [CrossRef] [Green Version]
- Maestre, F.T.; Delgado-Baquerizo, M.; Jeffries, T.; Eldridge, D.J.; Ochoa, V.; Gozalo, B.; Quero, J.L.; García-Gómez, M.; Gallardo, A.; Ulrich, W.; et al. Increasing aridity reduces soil microbial diversity and abundance in global drylands. Proc. Natl. Acad. Sci. USA 2015, 112, 15684–15689. [Google Scholar] [CrossRef] [Green Version]
- Zarafshar, M.; Bazot, S.; Matinizadeh, M.; Bordbar, S.K.; Rousta, M.J.; Kooch, Y.; Enayati, K.; Abbasi, A.; Negahdarsaber, M. Do tree plantations or cultivated fields have the same ability to maintain soil quality as natural forests? Appl. Soil Ecol. 2020, 151, 103536. [Google Scholar] [CrossRef]
- Olorunfemi, I.E.; Fasinmirin, J.T.; Olufayo, A.A.; Komolafe, A.A. Total carbon and nitrogen stocks under different land use/land cover types in the Southwestern region of Nigeria. Geoderma Reg. 2020, 22, e00320. [Google Scholar] [CrossRef]
- Zhang, B.; Wang, H.; Yao, S.; Bi, L. Litter quantity confers soil functional resilience through mediating soil biophysical habitat and microbial community structure on an eroded bare land restored with mono Pinus massoniana. Soil Biol. Biochem. 2013, 57, 556–567. [Google Scholar] [CrossRef]
- Wang, Q.-K.; Wang, S.-L. Soil microbial properties and nutrients in pure and mixed Chinese fir plantations. J. For. Res. 2008, 19, 131–135. [Google Scholar] [CrossRef]
- Rhoades, C.; Binkley, D. Factors influencing decline in soil pH in Hawaiian Eucalyptus and Albizia plantations. For. Ecol. Manag. 1996, 80, 47–56. [Google Scholar] [CrossRef]
- He, J.-Z.; Hu, H.-W.; Zhang, L.-M. Current insights into the autotrophic thaumarchaeal ammonia oxidation in acidic soils. Soil Biol. Biochem. 2012, 55, 146–154. [Google Scholar] [CrossRef]
- Baldrian, P. Forest microbiome: Diversity, complexity and dynamics. FEMS Microbiol. Ecol. 2017, 41, 109–130. [Google Scholar] [CrossRef] [Green Version]
- Snajdr, J.; Valaskova, V.; Merhautova, V.; Herinkova, J.; Cajthaml, T.; Baldrian, P. Spatial variability of enzyme activities and microbial biomass in the upper layers of Quercus petraea forest soil. Soil Biol. Biochem. 2008, 40, 2068–2075. [Google Scholar] [CrossRef]
- Janssen, P.H. Identifying the dominant soil bacterial taxa in libraries of 16S rRNA and 16S rRNA genes. Appl. Environ. Microbiol. 2006, 72, 1719–1728. [Google Scholar] [CrossRef] [PubMed] [Green Version]
- Will, C.; Thurmer, A.; Wollherr, A.; Nacke, H.; Herold, N.; Schrumpf, M.; Gutknecht, J.; Wubet, T.; Buscot, F.; Daniel, R. Horizon-specific bacterial community composition of german grassland soils, as revealed by pyrosequencing-based analysis of 16S rRNA genes. Appl. Environ. Microbiol. 2010, 76, 6751–6759. [Google Scholar] [CrossRef] [Green Version]
- Acosta-Martínez, V.; Dowd, S.; Sun, Y.; Allen, V. Tag-encoded pyrosequencing analysis of bacterial diversity in a single soil type as affected by management and land use. Soil Biol. Biochem. 2008, 40, 2762–2770. [Google Scholar] [CrossRef]
- Lin, Y.-T.; Whitman, W.B.; Coleman, D.C.; Chiu, C.-Y. Effects of reforestation on the structure and diversity of bacterial communities in subtropical low mountain forest soils. Front. Microbiol. 2018, 9, 1968. [Google Scholar] [CrossRef]
- Deng, J.; Yin, Y.; Zhu, W.; Zhou, Y. Variations in soil bacterial community diversity and structures among different revegetation types in the Baishilazi Nature Reserve. Front. Microbiol. 2018, 9, 2874. [Google Scholar] [CrossRef] [PubMed] [Green Version]
- Wang, J.; Shi, X.; Zheng, C.; Suter, H.; Huang, Z. Different responses of soil bacterial and fungal communities to nitrogen deposition in a subtropical forest. Sci. Total Environ. 2021, 755, 142449. [Google Scholar] [CrossRef]
- Frey, B.; Walthert, L.; Perez-Mon, C.; Stierli, B.; Köchli, R.; Dharmarajah, A.; Brunner, I. Deep soil layers of drought-exposed forests harbor poorly known bacterial and fungal communities. Front. Microbiol. 2021, 12, 674160. [Google Scholar] [CrossRef]
- Bennett, A.C.; Murugapiran, S.K.; Hamilton, T.L. Temperature impacts community structure and function of phototrophic Chloroflexi and Cyanobacteria in two alkaline hot springs in Yellowstone National Park. Environ. Microbiol. Rep. 2020, 12, 503–513. [Google Scholar] [CrossRef] [PubMed]
- Bates, S.T.; Berg-Lyons, D.; Caporaso, J.G.; Walters, W.A.; Knight, R.; Fierer, N. Examining the global distribution of dominant archaeal populations in soil. ISME J. 2011, 5, 908–917. [Google Scholar] [CrossRef] [Green Version]
- Di, H.J.; Cameron, K.C.; Shen, J.P.; Winefield, C.S.; O’Callaghan, M.; Bowatte, S.; He, J.-Z. Nitrification driven by bacteria and not archaea in nitrogen-rich grassland soils. Nat. Geosci. 2009, 2, 621–624. [Google Scholar] [CrossRef]
- Pedrinho, A.; Mendes, L.W.; Merloti, L.F.; da Fonseca, M.d.C.; Cannavan, F.d.S.; Tsai, S.M. Forest-to-pasture conversion and recovery based on assessment of microbial communities in Eastern Amazon rainforest. FEMS Microbiol. Ecol. 2019, 95, fiy236. [Google Scholar] [CrossRef] [Green Version]
- Kerfahi, D.; Tripathi, B.M.; Slik, J.W.F.; Sukri, R.S.; Jaafar, S.; Adams, J.M. Distinctive soil archaeal communities in different variants of tropical equatorial forest. Microb. Ecol. 2018, 76, 215–225. [Google Scholar] [CrossRef] [Green Version]
- Camenzind, T.; Hättenschwiler, S.; Treseder, K.K.; Lehmann, A.; Rillig, M.C. Nutrient limitation of soil microbial processes in tropical forests. Ecol. Monogr. 2018, 88, 4–21. [Google Scholar] [CrossRef]
- Jones, R.T.; Robeson, M.S.; Lauber, C.L.; Hamady, M.; Knight, R.; Fierer, N. A comprehensive survey of soil acidobacterial diversity using pyrosequencing and clone library analyses. ISME J. 2009, 3, 442–453. [Google Scholar] [CrossRef]
- Ward, N.L.; Challacombe, J.F.; Janssen, P.H.; Henrissat, B.; Coutinho, P.M.; Wu, M.; Xie, G.; Haft, D.H.; Sait, M.; Badger, J.; et al. Three genomes from the phylum Acidobacteria provide insight into the lifestyles of these microorganisms in soils. Appl. Environ. Microbiol. 2009, 75, 2046–2056. [Google Scholar] [CrossRef] [PubMed] [Green Version]
- Nemergut, D.R.; Cleveland, C.C.; Wieder, W.R.; Washenberger, C.L.; Townsend, A.R. Plot-scale manipulations of organic matter inputs to soils correlate with shifts in microbial community composition in a lowland tropical rain forest. Soil Biol. Biochem. 2010, 42, 2153–2160. [Google Scholar] [CrossRef]
- Jousset, A.; Bienhold, C.; Chatzinotas, A.; Gallien, L.; Gobet, A.; Kurm, V.; Küsel, K.; Rillig, M.C.; Rivett, D.W.; Salles, J.F.; et al. Where less may be more: How the rare biosphere pulls ecosystems strings. ISME J. 2017, 11, 853–862. [Google Scholar] [CrossRef]
- Ushio, M.; Kitayama, K.; Balser, T.C. Tree species-mediated spatial patchiness of the composition of microbial community and physicochemical properties in the topsoils of a tropical montane forest. Soil Biol. Biochem. 2010, 42, 1588–1595. [Google Scholar] [CrossRef]
- Hofmann, K.; Lamprecht, A.; Pauli, H.; Illmer, P. Distribution of prokaryotic abundance and microbial nutrient cycling across a high-alpine altitudinal gradient in the Austrian central alps is affected by vegetation, temperature, and soil nutrients. Microb. Ecol. 2016, 72, 704–716. [Google Scholar] [CrossRef] [PubMed]
- Krashevska, V.; Klarner, B.; Widyastuti, R.; Maraun, M.; Scheu, S. Impact of tropical lowland rainforest conversion into rubber and oil palm plantations on soil microbial communities. Biol. Fertil. Soils 2015, 51, 697–705. [Google Scholar] [CrossRef]
- Canfield, D.E.; Glazer, A.N.; Falkowski, P.G. The evolution and future of earth’s nitrogen cycle. Science 2010, 330, 192–196. [Google Scholar] [CrossRef] [PubMed] [Green Version]
- Kielak, A.M.; Barreto, C.C.; Kowalchuk, G.A.; van Veen, J.A.; Kuramae, E.E. The ecology of Acidobacteria: Moving beyond genes and genomes. Front. Microbiol. 2016, 7, 744. [Google Scholar] [CrossRef] [Green Version]
- Gałązka, A.; Grządziel, J.; Gałązka, R.; Ukalska-Jaruga, A.; Strzelecka, J.; Smreczak, B. Genetic and functional diversity of bacterial microbiome in soils with long term impacts of petroleum hydrocarbons. Front. Microbiol. 2018, 9, 1923. [Google Scholar] [CrossRef] [PubMed]
- Mendes, L.W.; de Lima Brossi, M.J.; Kuramae, E.E.; Tsai, S.M. Land-use system shapes soil bacterial communities in Southeastern Amazon region. Appl. Soil Ecol. 2015, 95, 151–160. [Google Scholar] [CrossRef]
- Navarrete, A.A.; Tsai, S.M.; Mendes, L.W.; Faust, K.; de Hollander, M.; Cassman, N.A.; Raes, J.; Van Veen, J.A.; Kuramae, E.E. Soil microbiome responses to the short-term effects of Amazonian deforestation. Mol. Ecol. 2015, 24, 2433–2448. [Google Scholar] [CrossRef]
- Yarwood, S.A.; Myrold, D.D.; Hogberg, M.N. Termination of belowground C allocation by trees alters soil fungal and bacterial communities in a boreal forest. FEMS Microbiol. Ecol. 2009, 70, 151–162. [Google Scholar] [CrossRef] [Green Version]
- Merloti, L.F.; Mendes, L.W.; Pedrinho, A.; de Souza, L.F.; Ferrari, B.M.; Tsai, S.M. Forest-to-agriculture conversion in Amazon drives soil microbial communities and N-cycle. Soil Biol. Biochem. 2019, 137, 107567. [Google Scholar] [CrossRef]
- Wang, Y.-F.; Gu, J.-D. Effects of allylthiourea, salinity, and pH on ammonia/ammonium-oxidizing prokaryotes in mangrove sediment incubated in laboratory microcosms. Appl. Microbiol. Biotechnol. 2014, 98, 3257–3274. [Google Scholar] [CrossRef] [PubMed]
- Ventura, M.; Canchaya, C.; Tauch, A.; Chandra, G.; Fitzgerald, G.F.; Chater, K.F.; van Sinderen, D. Genomics of Actinobacteria: Tracing the evolutionary history of an ancient phylura. Microbiol. Mol. Biol. Rev. 2007, 71, 495–548. [Google Scholar] [CrossRef] [Green Version]


Publisher’s Note: MDPI stays neutral with regard to jurisdictional claims in published maps and institutional affiliations. |
© 2022 by the authors. Licensee MDPI, Basel, Switzerland. This article is an open access article distributed under the terms and conditions of the Creative Commons Attribution (CC BY) license (https://creativecommons.org/licenses/by/4.0/).