Abstract
Analysis of the progression of forest fires is critical in understanding fire regimes and managing the risk of active fires. Major fire events in Korea mostly occur in the eastern mountainous areas (Gangwon Province), where the wind and moisture conditions are prone to fire in the late winter season. Despite the significance of the fire events in the area both in terms of frequency and severity, their spatial progression characteristics and their dependency on forest types have not been sufficiently analyzed so far, particularly with satellite data. This study first derived the severity map for the Uljin fire which occurred in March 2022, using a series of satellite images acquired over the fire period with very high frequency (every 5 days), and analyzed the characteristics of spatio-temporal progression in terms of forest types. The analysis revealed that the core fire area expanded very rapidly in the first few days, followed by an intensification phase that elevated severity in the active areas with marginal expansion in the peripheral areas. The analysis of the progression showed that the fire did not expand selectively by the forest type, despite the clear difference in their severity levels in the burned areas, where coniferous forest exhibited 3 times higher severity than deciduous forest.
1. Introduction
Forest fire significantly affects forest ecology by altering the chemical and biological properties of the soil, composition of vegetation community, habitat quality, as well as human activities such as land use and timbering. In terms of long-term perspective, forest fire plays an important role in determining local landscape, ecosystem, weather, and climate by inducing changes in greenhouse gas emission, aerosols emission, runoff and erosion, albedo in snow/ice areas, and surface temperature [1,2,3,4,5]. Recent studies also revealed that fire regime changes are being driven by climate change that induces changes in lightning frequency, precipitation, wind, temperature conditions, and consequently the length of dry seasons [6,7,8,9]. Globally, forest fires occur in over 200,000 locations annually, burning areas of approximately 3.5–4.5 million km2, and the number of severe forest fires is increasing in many areas of the world [10].
For understanding fire regimes and fire dynamics, identification of the spatial distribution of burned areas and monitoring its temporal progression with severity variation is important. As identified in many studies, its feedback on the ecology is not straightforward and even counter-intuitive sometimes, where the response to human efforts on fire control and management is often complex and unexpected [11]. For example, past studies showed that human intervention to suppress nonlethal frequent fires increased susceptibility to severe fires by altering fuel dynamics in an unexpected manner [12,13]. The recent increase in air temperature, precipitation extremes, and winds is also a factor that intensifies the severity of fire episodes and alters the progression behaviors [11].
Due to its large-scale characteristic, fire progression mapping and the associated severity analysis can be conducted effectively with the use of satellite images. Tracking active fires is possible with satellites equipped with mid- or long-wave thermal infrared sensors which can detect smoldering and flames of ongoing fires [14]. MODIS and Sentinel-3 which provide almost a one-day revisit period with roughly 1 km spatial resolution, have been extensively used for active fire monitoring in many locations [15,16]. Burned area mapping is also possible with such mid-resolution sensors through detecting changes in the bidirectional reflectance distribution function (BRDF) (e.g., MODIS burned area product) of each location [14], which is effective in tracing the aftermath of long-lasting large fires. Satellite sensors having spatial resolution around tens of meters (e.g., Landsat, Sentinel-2) are capable of detecting burned areas and assessing their severity in 10–20 m resolution (Sentinel-2) and 30 m (Landsat series) and were applied to various types of forest biomes such as temperate forest in North America and Eurasia [17,18,19] tropical forest in South Asia and Central/South America [20,21], boreal forest in North America and Siberia [22,23], and Mediterranean forest [19,24].
A recent forest fire that occurred in Uljin, Korea, in March 2022, was the historically longest forest fire in Korea since the 1950s when the authority started to keep the record, which lasted officially for 9 days. The Uljin fire event that is of interest in this study will be referred to as F22-U, hereafter. According to the media report, F22-U burnt approximately 20,923 ha [25], which is comparable to the Donghaean forest fire in 2000 (23,794 ha), Goseong forest fire in 1996 (3762 ha) and 2019 (2872 ha), and Yangyang forest fire in 2005 (973 ha), which all occurred in Gangwon Province of Korea.
Studies on fire progression are scarce for the fires in Gangwon Province, primarily because most of the past fires in the area were extinguished within a couple of days, and the revisit period of satellites is not short enough to resolve the rapid change in fire expansion. Past studies for the area that used satellite images are mainly focused on mapping burned area and severity [26,27], post-fire change analysis [28], and detection of fires in low-resolution satellites [29]. F22-U’s relatively long duration and the clear sky condition during the period allowed continuous monitoring of its progression with Sentinel-2 that have both relatively high spatial (10–20 m) and temporal resolution (5 days). Although the satellite has no thermal bands, equipped with both near-infrared and short-wave infrared bands, it can be used to assess the fire severity of an individual scene, as well as the change in the severity for multitemporal scenes.
This study investigates characteristics of fire distribution and spatio-temporal variation of severity for F22-U based on multitemporal Sentinel-2 images of a 2-week period, which has not been attempted on the past large forest fires in Korea due to their short duration. The main objectives of this study are (1) to evaluate the dependence of fire expansion rate on the phases of fire, (2) to analyze the dependence of fire severity on forest types, and (3) to investigate whether specific forest type facilitates fire progression, if so, how much. To map the burned area with Sentinel-2 image data, differential normalized burned ratio (dNBR) [30] was applied to them and the changes in burned areas were monitored based on individual scenes. Burned area mapping based on BRDF change was not feasible in our case since the timing of the fire event was right before the sprouting season (April), which would lead to rapid change in land cover types of burned area. For a realistic conversion of dNBR to composite burn index (CBI), a separate site surveying was conducted to construct a relationship between them. Lastly, dependence of fire expansion and intensification on forest type (conifers vs. deciduous) was analyzed based on the satellite images and the forest type map provided by Korea Forest Service (KFS).
2. Materials
2.1. The Fire Events and the Geography
The ignition of F22-U was at Buk-myeon, Uljin, Republic of Korea (129°18′ E, 37°2′ N) at approximately 11:00 am on 4 March 2022 (Figure 1a). The effective area for F-22U is in the eastern part of the Taebaek Mountains, which is bounded approximately by 129°12′ E–129°30′ E, 36°7′ N–37°10′ N (Figure 1b). The average elevation of the area is 463 m and the maximum elevation is 1258 m. In Korea, large forest fires mostly occur in Gangwon province, particularly in the late dry season (February–April) when winds are strong and humidity is low compared to the western region of Korea due to Föhn winds that pass over the Taebaek Mountains [31]. There were 5086 forest fires in Korea from 2011 to 2021 which burnt a total of 11,962 ha., and approximately 60% occurred in the dry and windy spring season [32,33].
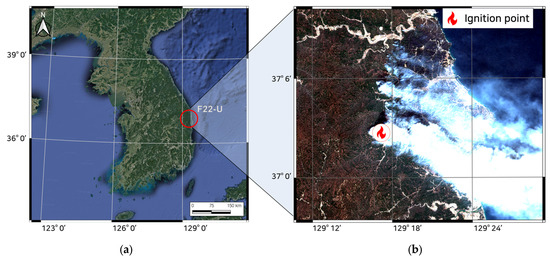
Figure 1.
(a) Location of forest fire outbreak, F22-U, and (b) the Sentinel-2 RGB image captured the beginning phase of the fire event (5 March 2022). The ignition location is marked on the map.
Based on the forest type map produced by KFS, the study area is dominated by pine trees (Pinus densiflora), accounting for approximately 70% of the area, followed by hard pines and coniferous trees. KFS updates the forest-type map every year and the 2021 edition is used in this study. The map is on a 1:5000 scale and classifies the entire south Korean area into four forest types; conifers, deciduous, mixed, and bamboo. In this study, the forest-type map was resampled to a 10 m grid to match the satellite images.
2.2. Satellite Data: Sentinel-2
Sentinel-2 comprises a constellation of two polar-orbiting satellites each of which has a 10-day revisit period, thus providing a 5-day temporal resolution in tandem. The RGB bands (Band 2, Band 3, and Band 4) and near-infrared (NIR) band (Band 8) have a 10 m resolution, while the two short-wave infrared (SWIR) bands (Band 11 and Band 12) have a 20 m resolution. To derive a severity index in a 10 m resolution, we interpolated the Band 11 image into the 10 m grid using linear interpolation. Atmospheric correction was performed through the Sen2Core algorithm, which eventually transforms top-of-atmosphere radiance into surface reflectance [34].
To minimize the impact of topography, a topography correction was performed using the SCS + C method [35], which is based on the equation:
where and are uncorrected and corrected reflectance, respectively, and are the solar zenith and slope angle, is the incidence angle, and is the correction parameter. The correction parameter was derived only from the forest pixels in individual scenes, which were selected based on the forest-type map. Digital elevation model (DEM) with the same spatial resolution as a satellite image is required for the calculation of slope angle and aspect angle. At this time, the DEM data acquired from the National Geographic Information Institute (NGII) (originally 5 m resolution) were resampled into the 10-m grid to match with the satellite data. Sentinel-2 images available during the event period (23 February–4 April 2022) were searched for in the Sentinel-2 archive, and images from five dates, 23 February, 5, 10, 15 March, and 4 April 2022, were found to have cloud cover less than 10%. The first date (23 February) scene was only used as the pre-fire reference, so the other 4 images were used for the analysis of the fire progress. The Sen2Cor algorithm which is a built-in function in the sentinel application platform (SNAP) toolbox was used for the atmospheric correction in this study.
3. Method
3.1. Preprocessing of Satellite Images
Anomaly removal and normalization: The major source of anomalous pixels in the used images was fire smoke occurring in the beginning phase of events, as shown in Figure 1. Smoke typically increases the severity estimates and makes retrieval of surface properties extremely difficult with the visible bands. To remove the anomaly pixels, the scene classification map generated from the Sen2Cor was used. Pixels classified as “water”, “snow”, “clouds” (both middle probability and high probability), and “unclassified” were removed from the analysis. To remove the residual differences in reflectance across the images of different dates, the mean reflectance over the forest pixels was equalized with respect to the reference scene (23 February), according to the normalization process recommended in the FireMON protocol [30].
Normalized Burn Ratio (NBR): The NBR, a measure of fire severity, was calculated using the reflectance of the NIR band and the SWIR as:
where, in our study, Band 8 (center wavelength: 842 nm) was used for , and Band 12 (center wavelength: 2190 nm) for . Difference in NBR, namely the differential normalized burn ratio (dNBR) [36], is simply:
where the NBR from 23 February is , and the NBR of the following dates is , respectively.
3.2. Validation of Severity on Site
Field measurements for the severity validation were conducted in Donghae area on 21 April. A total of 20 plots in three different sites (named Site A, Site B, and Site C) were visited and composite burn index (CBI) was assessed for each plot with visual inspection and drone images according to the protocol specified in the FireMON document [30]. Following the sampling method of FireMon Landscape Assessment, each plot was sampled within a radius of 15 m, for the evaluation items such as the burning amount of branches by size, duff, color change of soil and stone, etc. The sites (A, B, and C) were selected based on the forest type map so that the collected samples evenly represent the different forest types and the various severity levels. Site A comprises mostly conifers which suffered the most severe fire damages. Site B and Site C were selected to secure samples of deciduous trees with varying levels of severity. Photos of representative plots in the sites are presented in Figure 2, which clearly shows the differences in fire damage by severity and by forest type.
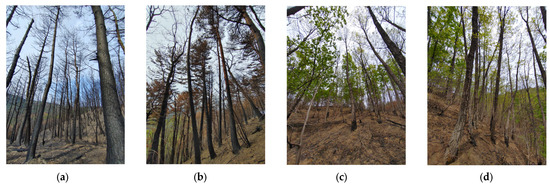
Figure 2.
Photos for representative plots in each site: (a) A01, (b) A06, (c) B04, and (d) C05.
Synoptic images were taken from a drone and orthorectified images were produced to assess the overall damage status of all three sites (Figure 3). The drone and camera used for the synoptic images were DJI Phantom 4 Pro V2 and RGB camera mounted on the drone. DJI Terra software was used for generating orthorectified images. The orthorectified images were primarily used for assessing the entries in CBI protocol (e.g., percent change in coverage), and also used for precisely identifying the validation plots in the satellite images (e.g., precise pixel location of plots, and reconfirmation of forest types). The evaluated CBI for the surveyed plots is available in Table 1.
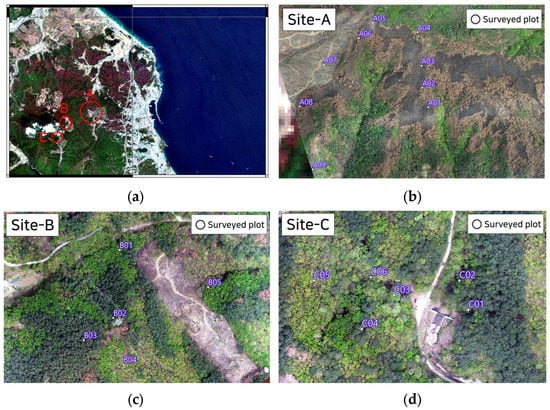
Figure 3.
(a) The satellite image showing the 3 survey sites in Donghae, and the orthorectified images from UAV for (b) Site-A, (c) Site-B, (d) Site-C.

Table 1.
The list of surveyed plots presented with its forest type and the assessed CBI.
4. Results
4.1. Interpretation of Fire Severity
The scatter plot for the field-measured CBI and the dNBR of corresponding pixels in the Sentinel images is presented in Figure 4. The plot shows that the coefficient of determination is 0.8035 when fitted with a second-order polynomial, exhibiting a well-defined monotonic relationship. Severity levels were classified into 3 classes by referring to FireMON [30], the US National Park Service (NPS) fire monitoring handbook [37], and other previous studies [38,39]; low severity (LS), moderate severity (MS), and high severity (HS), corresponding to the CBI ranges of 1.5–2.0 for LS, 2.0–2.5 for MS, and >2.5 for HS. The dNBR threshold between “Unburned” and “LS” is determined as three times of standard deviation of forest pixel dNBR calculated from a pair of pre-fire satellite images, which is 64 in dNBR scaled by 1000. The conversion table between dNBR and CBI for the suggested severity levels is presented in Table 2.
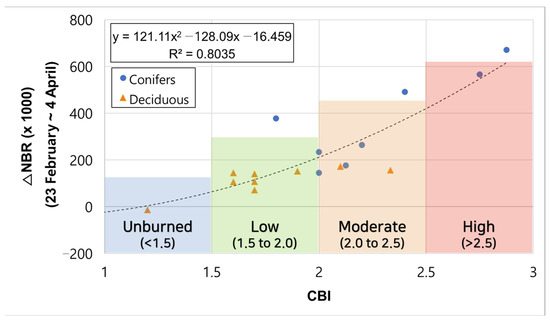
Figure 4.
The scatter plot for CBI and dNBR for the surveyed plots.
Table 2.
Conversion table for dNBR and fire severity.
4.2. Fire Progress F22-U Observed by Sentinel-2
Figure 5 presents the severity maps of four dates. The first scene of fire detection was on 5 March (Figure 5a), which shows that the fire expanded more than 10 km to the north in approximately 24 h from the ignition (ignition was at 11:00 KST (Korea Standard Time), 4 March 2022) along the southerly wind. However, the fire agency reported the fire already occupied a similar extent at 21:00 KST, 4 March, just 10 h after the ignition. Although the smoke-contaminated pixels were removed from the scene, there were still residual thin smoke plumes in the southern area which erroneously created spuriously high severity areas.
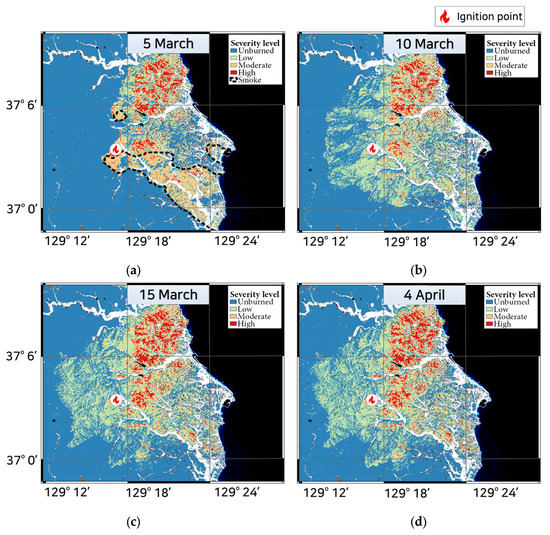
Figure 5.
The severity map derived from Sentinel-2 images for (a) 5 March, (b) 10 March, (c) 15 March, and (d) 4 April.
The scene on 10 March (Figure 5b) shows that the overall extent expanded in all directions, creating many patchy burnt spots in LS around the initial extent of the previous scene. The LS area almost tripled from 2636 ha to 7326 ha from 5–10 March. The overall severity also intensified producing more MS pixels in total than the previous scene, increasing from 1487 ha to 1926 ha.
The scene on 15 March (Figure 5c) shows that the fire extent expanded marginally in all directions and the severity greatly intensified in all active fire areas. The LS area increased by approximately 7% (513 ha), the HS area increased by approximately 60% (584 ha), and the MS area remained at a similar level (1926 ha vs. 2050 ha). As a general trend, intensification progressed in the central area, and expansion occurred in the peripheral area.
The scene on 4 April (Figure 5d) depicts the scene after the fire had been completely extinguished by the authority (13 March). It shows that the severity marginally intensified for two weeks after 15 March, where only 59 ha of LS and 9 ha of HS were added.
4.3. Distribution of Severity
The change in the total burned area is demonstrated in Figure 6. Note that the burned area was calculated as the sum of image pixels that exhibit a severity greater than or equal to LS. Thus, the estimate would be different from the total fire-affected area announced by the authority, which is calculated as the whole area encompassed by the outer boundary of the damaged area. The total burned area of our study amounted to 5237 ha on 5 March, approximately 24 h after ignition. This is almost half the final burned area (11,457 ha). The expansion rate was high at the beginning of the fire event and gradually decreased. The calculated rates were 986 ha/day from 5–10 March, 244 ha/day from 10–15 March, and 4 ha/day from 15 March–4 April period.
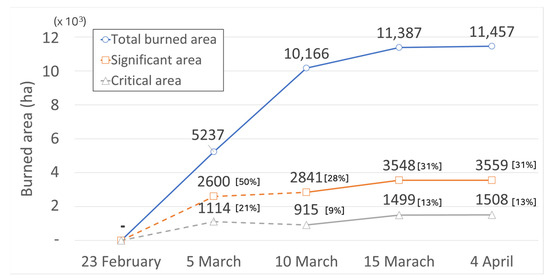
Figure 6.
The temporal change in the burned area for the total burned area (all severity levels), the significant area (severity > LS), and the critical area (severity > MS). Figures on the data points are estimated burned areas, and the percentage in the bracket is the ratio of each area to the total area. The dotted line indicates burned areas of low accuracy caused by clouds and fire smoke.
The “significant area”, defined as having a severity greater than LS, also increased gradually after the first day (the orange line in Figure 6). As the 5 March scene contains strong positive anomalies caused by smoke, the estimated area of 2600 ha in the graph is considered overestimated. If the same increase rate as the total burned area is adopted, the corrected estimates would be approximately 1571 ha on 5 March, implying that the significant area also doubled by the end of the event after the first day. The ratios of the significant area to the total area at each scene were maintained at approximately 30% throughout the whole period; the percentage at each scene was 49.6% (overestimated by smoke), 27.9%, 31.2%, and 31.1% on the four respective dates. The “critical area” defined as pixels having severity greater than MS accounts for approximately 10% of the total burned area on each date.
4.4. Effects of Forest Type on Fire Progression
Figure 7 shows the change in the burned area by forest types for the three severity levels. For all dates and all severity levels, burned areas were greater in conifers than in deciduous, which is natural because conifers dominate the event area in pre-fire status. For the study area, the pre-fire abundance percentage calculated from the forest type map was 59%, 34%, and 7% for conifers, deciduous, and mixed forest, respectively. The post-fire burned area percentage was calculated as 58%, 35%, and 7%, which is not significantly different from that of pre-fire, implying that the fire did not proceed with any preference for a particular forest type. However, as shown in Figure 7, the severity level exhibited a clear difference by forest type. However, the pre-fire abundance ratio (conifers:deciduous = 1.7) increased with severity and changed depending on the fire phase. The conifer-to-deciduous ratio was similar to the pre-fire ratio for LS in the early phase (1.9 for LS on 10 March) but was much higher for higher severity levels (4.9 for MS, 12.3 for HS) on the same date, implying that the conifers are more vulnerable to fire. As the fire phase proceeded, the ratio for MS stabilized from 4.9 (10 March), to 2.8 (15 March) and 3.2 (4 April), showing that the intensification was rapid in conifers (thus having a higher ratio in the early days), and intensification in deciduous took place slowly resulting in a lower ratio in the later days.
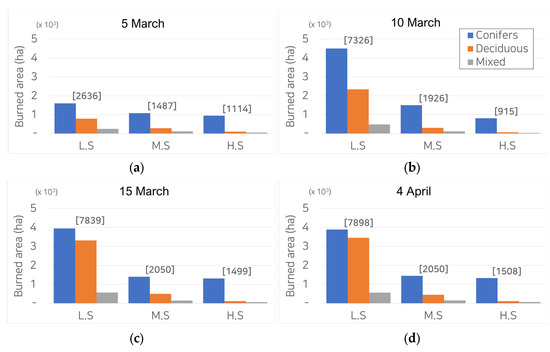
Figure 7.
The histograms of burned areas by the severity levels and the forest types. The four sub-figures are for (a) 5 March, (b) 10 March, (c) 15 March, and (d) 4 April, respectively. The figures in the bracket are burned areas for the corresponding severity levels (the sum for all forest types).
Table 3 shows the statistics on the overall burned areas by forest types and the severity levels as of 4 April. The final estimated mean CBI is 2.05 for the entire burned area, 2.23 for the conifer area, and 1.73 for the deciduous area, clearly suggesting higher severity for conifers. When compared to the total burned area (100%), the significant area accounts for 31% of the total burned area, and the critical area accounts for 13%, which was stable throughout the fire period as also shown in Figure 6. In the significant area, conifers take a 5 times higher ratio than deciduous forest (24% vs. 5%), and in the critical area the ratio soars even higher to 12%:1%, which confirms the previous observation that conifers are more vulnerable than deciduous.
Table 3.
Pre- and post-fire area statistics by the forest types and their final mean CBI as of 4 April (the area portion was calculated with respect to the entire burned area).
5. Discussion
The severity analysis showed that the burned areas of conifers had significantly higher severity than deciduous, but it did not affect the course of fire progression in a statistical sense. The expansion pattern did not exhibit any dependence on the forest type, as shown in the similarity between the pre-fire and the post-fire abundance by forest types. This is rather counter-intuitive because severe fire in conifers usually involves exhaustive combustion of branches and leaves located in high positions, which can be thought to be in a more favorable condition for transferring fire to nearby trees [40]. Other studies conducted for Korean forests also testify that crown fires in conifers usually induce higher heat transfer than surface fire, accompanied by higher heat column [40,41,42]. Dense coniferous forest usually has high fire risk particularly when the variation in topography is high, affected by the strong heat transfer and fire brand that spread intense fire rapidly to the surrounding areas [40]. Our field survey data also confirm that the burn ratio of branches and leaves is significantly higher for conifers than the deciduous.
Insignificant differences in fire spread between conifers and deciduous despite the clear difference in crown fire behavior may be due to the compensation by the rapid surface fire spread in deciduous forests. Our site surveying shows that the sites in deciduous forests have more ground-level fuels (e.g., fallen dry leaves, and small branches) than the sites in coniferous forests in our study area. An independent experiment conducted for Korean forest fuels showed that surface fire spreads 1.5–2 times faster for a deciduous species than a coniferous species when wind is moderate to strong, supporting our observation [43]. The difference in the charcoal height of the trunks between the two forest types is that coniferous forest had much higher charcoal height (1–10 m), while deciduous had it only up to 50 cm, exhibiting the crown fire is definitely not the major spread agent in deciduous forest.
Implications for fire management are as follows. Firstly, fire expansion can take place very rapidly in the first few hours, and in that phase, forest type is not a dominant factor that decides the course of expansion. Secondly, from the perspective of sole fire management, deciduous forest is more desirable for new plots because it takes more time to get intensified into high severity than coniferous forests, having higher chances to be regenerated in post-fire environments.
6. Conclusions
This study conducted spatial analysis on fire progression and severity for the massive fire episode that occurred in Uljin, Korea, which lasted more than a week. Observation of the progress from a satellite revealed that the expansion rate was extremely higher in the beginning phase (a couple of days from the ignition), followed by the second phase where the expansion and intensification took place simultaneously but in different locations and with a different speed for different forest types. The expansion in the second phase took place in the marginal area of existing active fires regardless of forest type, and the intensification was at a higher rate for coniferous forest. The fire progression, however, was not affected by the forest type, showing a similar burned area ratio between confiners and deciduous for pre- and post-fire conditions, although the susceptibility was much higher for conifers with the overall CBI around 2.3 than deciduous forests having CBI around 1.73 after the fire.
The quantitative and analytic results from the study can be summarized as following:
- The total burned area is 11,457 ha, and the critical area, defined as CBI > 2.5, was 1508 ha.
- Almost half of the burned area was generated in the first 24 h from the ignition.
- The expansion rate in the area was highest in the beginning with 558 ha/day from 5–10 March, slowed down to 218 ha/day from 10–15 March, and ended as 11 ha/day from 15 March–4 April.
- Fire expansion did not prefer any forest type (conifer vs. deciduous), but the severity was much higher for conifer (the final mean CBI was 2.23 for conifer, and 1.73 for deciduous).
- Approximately one-third of the total burned area had moderate severity (CBI > 2.0), and the critical area (CBI > 2.5) takes about 10% of all burned areas, where the ratio was maintained throughout the whole fire event period.
- The burned area reported by media (20,923 ha) is almost 80% larger than the satellite-based burned area (11,457 ha) due to the difference in the definition of burned area and the calculation method.
It should be noted that the fire expansion was suppressed to some degree by firefighting activities, making it difficult to interpret the results as being solely derived from natural factors such as topography, winds, forest distribution, and soil moisture condition. Nevertheless, the derived statistics are expected to help improve establishing firefighting strategy, assessment of economic loss, calculation of carbon stock change, and establishment of restoration plans. Future work includes geographic analysis of the spatial fire expansion pattern in relation to wind direction, topography, and other meteorological data sets with an emphasis on severity variation by forest types.
Author Contributions
Data curation, W.K.; formal analysis, S.B.; methodology, W.K.; resources, J.L.; validation, J.L.; visualization, S.B.; writing—original draft, S.B.; writing—review and editing, W.K. All authors have read and agreed to the published version of the manuscript.
Funding
The study was carried out with the support of the forest science R&D project “Development of image pre-processing technology for forest planning satellite sensor system (Project No. FTIS 202020179A00-2022-BB01)” the Forest Service, Republic of Korea.
Data Availability Statement
Not applicable.
Conflicts of Interest
The authors declare no conflict of interest.
References
- Randerson, J.T.; Liu, H.; Flanner, M.G.; Chambers, S.D.; Jin, Y.; Hess, P.G.; Pfister, G.; Mack, M.; Treseder, K.; Welp, L.; et al. The Impact of Boreal Forest Fire on Climate Warming. Science 2006, 314, 1130–1132. [Google Scholar] [CrossRef] [PubMed]
- Gersh, M.; Gleason, K.E.; Surunis, A. Forest Fire Effects on Landscape Snow Albedo Recovery and Decay. Remote Sens. 2022, 14, 4079. [Google Scholar] [CrossRef]
- Liu, Z.; Ballantyne, A.P.; Cooper, L.A. Biophysical Feedback of Global Forest Fires on Surface Temperature. Nat. Commun. 2019, 10, 241.s. [Google Scholar] [CrossRef] [PubMed]
- Jiang, Y.; Yang, X.-Q.; Liu, X.; Qian, Y.; Zhang, K.; Wang, M.; Li, F.; Wang, Y.; Lu, Z. Impacts of Wildfire Aerosols on Global Energy Budget and Climate: The Role of Climate Feedbacks. J. Clim. 2020, 33, 3351–3366. [Google Scholar] [CrossRef]
- Inbar, M.; Tamir, M.I.; Wittenberg, L. Runoff and Erosion Processes after a Forest Fire in Mount Carmel, a Mediterranean Area. Geomorphology 1998, 24, 17–33. [Google Scholar] [CrossRef]
- Flannigan, M.D.; Stocks, B.J.; Wotton, B.M. Climate Change and Forest Fires. Sci. Total Environ. 2000, 262, 221–229. [Google Scholar] [CrossRef] [PubMed]
- Stocks, B.J.; Fosberg, M.; Lynham, T.; Mearns, L.; Wotton, B.; Yang, Q.; Jin, J.; Lawrence, K.; Hartley, G.; Mason, J.; et al. Climate Change and Forest Fire Potential in Russian and Canadian Boreal Forests. Clim. Chang. 1998, 38, 1–13. [Google Scholar] [CrossRef]
- Millar, C.I.; Stephenson, N.L. Temperate Forest Health in an Era of Emerging Megadisturbance. Science 2015, 349, 823–826. [Google Scholar] [CrossRef]
- Gillett, N.; Weaver, A.; Zwiers, F.; Flannigan, M. Detecting the Effect of Climate Change on Canadian Forest Fires. Geophys. Res. Lett. 2004, 31. [Google Scholar] [CrossRef]
- Hua, L.; Shao, G. The Progress of Operational Forest Fire Monitoring with Infrared Remote Sensing. J. For. Res. 2017, 28, 215–229. [Google Scholar] [CrossRef]
- Scaduto, E.; Chen, B.; Jin, Y. Satellite-Based Fire Progression Mapping: A Comprehensive Assessment for Large Fires in Northern California. IEEE J. Sel. Top. Appl. Earth Obs. Remote Sens. 2020, 13, 5102–5114. [Google Scholar] [CrossRef]
- Schoennagel, T.; Turner, M.G.; Romme, W.H. The Influence of Fire Interval and Serotiny on Postfire Lodgepole Pine Density in Yellowstone National Park. Ecology 2003, 84, 2967–2978. [Google Scholar] [CrossRef]
- Stephens, S.L.; Collins, B.M.; Fettig, C.J.; Finney, M.A.; Hoffman, C.M.; Knapp, E.E.; North, M.P.; Safford, H.; Wayman, R.B. Drought, Tree Mortality, and Wildfire in Forests Adapted to Frequent Fire. BioScience 2018, 68, 77–88. [Google Scholar] [CrossRef]
- Justice, C.; Giglio, L.; Korontzi, S.; Owens, J.; Morisette, J.; Roy, D.; Descloitres, J.; Alleaume, S.; Petitcolin, F.; Kaufman, Y. The MODIS Fire Products. Remote Sens. Environ. 2002, 83, 244–262. [Google Scholar] [CrossRef]
- Loboda, T.V.; Giglio, L.; Boschetti, L.; Justice, C.O. Regional Fire Monitoring and Characterization Using Global NASA MODIS Fire Products in Dry Lands of Central Asia. Front. Earth Sci. 2012, 6, 196–205. [Google Scholar] [CrossRef]
- Morisette, J.T.; Giglio, L.; Csiszar, I.; Setzer, A.; Schroeder, W.; Morton, D.; Justice, C.O. Validation of MODIS Active Fire Detection Products Derived from Two Algorithms. Earth Interact. 2005, 9, 1–25. [Google Scholar] [CrossRef]
- Ndalila, M.N.; Williamson, G.J.; Bowman, D.M. Geographic Patterns of Fire Severity Following an Extreme Eucalyptus Forest Fire in Southern Australia: 2013 Forcett-Dunalley Fire. Fire 2018, 1, 40. [Google Scholar] [CrossRef]
- Cardil, A.; Mola-Yudego, B.; Blázquez-Casado, Á.; González-Olabarria, J.R. Fire and Burn Severity Assessment: Calibration of Relative Differenced Normalized Burn Ratio (RdNBR) with Field Data. J. Environ. Manag. 2019, 235, 342–349. [Google Scholar] [CrossRef]
- Giddey, B.L.; Baard, J.A.; Kraaij, T. Verification of the Differenced Normalised Burn Ratio (DNBR) as an Index of Fire Severity in Afrotemperate Forest. S. Afr. J. Bot. 2022, 146, 348–353. [Google Scholar] [CrossRef]
- Edwards, A.C.; Russell-Smith, J.; Maier, S.W. A Comparison and Validation of Satellite-Derived Fire Severity Mapping Techniques in Fire Prone North Australian Savannas: Extreme Fires and Tree Stem Mortality. Remote Sens. Environ. 2018, 206, 287–299. [Google Scholar] [CrossRef]
- Santos, S.M.B.D.; Bento-Gonçalves, A.; Franca-Rocha, W.; Baptista, G. Assessment of Burned Forest Area Severity and Postfire Regrowth in Chapada Diamantina National Park (Bahia, Brazil) Using Dnbr and Rdnbr Spectral Indices. Geosciences 2020, 10, 106. [Google Scholar] [CrossRef]
- Boucher, J.; Beaudoin, A.; Hébert, C.; Guindon, L.; Bauce, É. Assessing the Potential of the Differenced Normalized Burn Ratio (DNBR) for Estimating Burn Severity in Eastern Canadian Boreal Forests. Int. J. Wildland Fire 2016, 26, 32–45. [Google Scholar] [CrossRef]
- Delcourt, C.J.; Combee, A.; Izbicki, B.; Mack, M.C.; Maximov, T.; Petrov, R.; Rogers, B.M.; Scholten, R.C.; Shestakova, T.A.; van Wees, D.; et al. Evaluating the Differenced Normalized Burn Ratio for Assessing Fire Severity Using Sentinel-2 Imagery in Northeast Siberian Larch Forests. Remote Sens. 2021, 13, 2311. [Google Scholar] [CrossRef]
- García-Llamas, P.; Suárez-Seoane, S.; Taboada, A.; Fernández-Manso, A.; Quintano, C.; Fernández-García, V.; Fernández-Guisuraga, J.M.; Marcos, E.; Calvo, L. Environmental Drivers of Fire Severity in Extreme Fire Events That Affect Mediterranean Pine Forest Ecosystems. For. Ecol. Manag. 2019, 433, 24–32. [Google Scholar] [CrossRef]
- Wildfires: Fire Extinguishing in Samcheok, Uljin 2022. Available online: https://www.bbc.com/korean/news-60688695 (accessed on 24 October 2022).
- Lim, C.-H.; Kim, Y.S.; Won, M.; Kim, S.J.; Lee, W.-K. Can Satellite-Based Data Substitute for Surveyed Data to Predict the Spatial Probability of Forest Fire? A Geostatistical Approach to Forest Fire in the Republic of Korea. Geomat. Nat. Hazards Risk 2019, 10, 719–739. [Google Scholar] [CrossRef]
- Piao, Y.; Lee, D.; Park, S.; Kim, H.G.; Jin, Y. Forest Fire Susceptibility Assessment Using Google Earth Engine in Gangwon-Do, Republic of Korea. Geomat. Nat. Hazards Risk 2022, 13, 432–450. [Google Scholar] [CrossRef]
- Won, M.; Jang, K.; Yoon, S.; Lee, H. Change Detection of Damageds Area and Burn Severity Due to Heat Damage from Gangwon Large Fire Area in 2019. Korean J. Remote Sens. 2019, 35, 1083–1093. [Google Scholar]
- Jang, E.; Kang, Y.; Im, J.; Lee, D.-W.; Yoon, J.; Kim, S.-K. Detection and Monitoring of Forest Fires Using Himawari-8 Geostationary Satellite Data in South Korea. Remote Sens. 2019, 11, 271. [Google Scholar] [CrossRef]
- Lutes, D.C.; Keane, R.E.; Caratti, J.F.; Key, C.H.; Benson, N.C.; Sutherland, S.; Gangi, L.J. FIREMON: Fire Effects Monitoring and Inventory System; General Technical Report RMRS-GTR-164; US Department of Agriculture, Forest Service, Rocky Mountain Research Station, 1 CD: Fort Collins, CO, USA, 2006; p. 164. [Google Scholar]
- Lee, J.G.; In, S.-R. A Numerical Sensitivity Experiment of the Downslope Windstorm over the Yeongdong Region in Relation to the Inversion Layer of Temperature. Atmosphere 2009, 19, 331–344. [Google Scholar]
- Ryu, S.-R.; Choi, H.-T.; Lim, J.-H.; Lee, I.-K.; Ahn, Y.-S. Post-Fire Restoration Plan for Sustainable Forest Management in South Korea. Forests 2017, 8, 188. [Google Scholar] [CrossRef]
- Forest Fire Occurrence Status in 10 Years. Available online: https://www.forest.go.kr/kfsweb/kfi/kfs/frfr/selectFrfrStats.do (accessed on 20 October 2022).
- Main-Knorn, M.; Pflug, B.; Louis, J.; Debaecker, V.; Müller-Wilm, U.; Gascon, F. Sen2Cor for Sentinel-2. In Image and Signal Processing for Remote Sensing XXIII; SPIE: Bellingham, WA, USA, 2017; Volume 10427, pp. 37–48. [Google Scholar]
- Soenen, S.A.; Peddle, D.R.; Coburn, C.A. SCS+ C: A Modified Sun-Canopy-Sensor Topographic Correction in Forested Terrain. IEEE Trans. Geosci. Remote Sens. 2005, 43, 2148–2159. [Google Scholar] [CrossRef]
- Miller, J.D.; Thode, A.E. Quantifying Burn Severity in a Heterogeneous Landscape with a Relative Version of the Delta Normalized Burn Ratio (DNBR). Remote Sens. Environ. 2007, 109, 66–80. [Google Scholar] [CrossRef]
- Service, U.N.P. Fire Monitoring Handbook; Fire Management Program Center, National Interagency Fire Center: Boise, ID, USA, 2003; pp. 109–110.
- Keeley, J.E. Fire Intensity, Fire Severity and Burn Severity: A Brief Review and Suggested Usage. Int. J. Wildland Fire 2009, 18, 116–126. [Google Scholar] [CrossRef]
- White, J.D.; Ryan, K.C.; Key, C.C.; Running, S.W. Remote Sensing of Forest Fire Severity and Vegetation Recovery. Int. J. Wildland Fire 1996, 6, 125–136. [Google Scholar] [CrossRef]
- Ryu, G.-S.; Lee, B.-D.; Won, M.-S.; Kim, K.-H. Development of Crown Fire Propagation Probability Equation Using Logistic Regression Model. J. Korean Assoc. Geogr. Inf. Stud. 2014, 17, 1–12. [Google Scholar] [CrossRef][Green Version]
- Kim, S.-Y.; Lee, Y.-J.; Seo, Y.-O.; Park, S.-M.; Jang, M.-N.; Lee, B.-D.; Gu, G.-S.; Lee, M.-B. Crown Fuel Characteristics and Estimation of Burning Rate of Pinus Densiflora Stands in Youngju Forest Fire. In Proceedings of the Korean Society of Environment and Ecology Conference; Korean Society of Environment: Sejong, Republic of Korea, 2010; pp. 127–130. [Google Scholar]
- Kim, S.; Jang, M.; Lee, S.; Lee, Y.; Lee, B. Comparison of Fuel Characteristics between Coastal and Inland Type of Pinus thunbergii Stands. J. Korean Soc. Hazard Mitig. 2018, 18, 175–183. [Google Scholar] [CrossRef][Green Version]
- Kim, J.-H.; Kim, E.-S.; Kim, D.-H.; Kim, J.-W. The Study on Surface Fire Spread in Fuel Bed. Fire Sci. Eng. 2014, 28, 22–27. [Google Scholar] [CrossRef]
Publisher’s Note: MDPI stays neutral with regard to jurisdictional claims in published maps and institutional affiliations. |
© 2022 by the authors. Licensee MDPI, Basel, Switzerland. This article is an open access article distributed under the terms and conditions of the Creative Commons Attribution (CC BY) license (https://creativecommons.org/licenses/by/4.0/).