Abstract
Land use change is closely related to the terrestrial ecosystem. Studying the relationship between land use and ecosystem service carbon storage under future climate change can optimize the regional ecosystem service function and formulate sustainable social and economic development policies, which is of great significance for regional carbon emission management and climate change response. In this paper, the coupled model of SSP-RCP-PLUS-InVEST was constructed to simulate land use change under different scenarios, analyze the influence degree of driving factors on different regions, and explore the spatio-temporal evolution and spatial correlation of carbon storage, taking Central Yunnan City agglomeration as an example. The results showed that: (1) from the perspective of land use change, the overall changes in SSP126 and SSP245 scenarios were similar, and the change rates of different types were slightly different. Under the SSP585 scenario, the forest area decreased, and the urban land and cropland land expanded. (2) Under the three scenarios in the future, the decrease in total carbon storage is the most serious under the SSP245 scenario, and the decrease is the most serious under the SSP585 scenario. (3) Comparative spatial correlation: the carbon storage in the Central Yunnan urban agglomeration is generally correlated among counties, and there is no significant difference under the future scenarios, showing a high accumulation pattern in the east and low accumulation pattern in the middle. In general, reasonable planning of land spatial patterns and increasing the proportion of forest is conducive to the proportion of regional carbon sequestration capacity. The research methods can provide references for addressing climate change and territorial spatial planning.
1. Introduction
Land use/land cover change (LUCC) is affected by multiple driving factors such as global and regional climate change, which changes ecosystem service functions [1]. LUCC caused by human activities is the dominant factor affecting global climate change through surface biogeophysical processes [2], while the continuous increase in CO2 greenhouse gas is one of the main reasons affecting global climate warming, threatening human survival and development [3]. LUCC is an important factor driving the carbon cycle process of terrestrial ecosystem [4]. Different land use types have different carbon sequestration abilities. Therefore, the change in land use type has a great impact on the change in carbon storage [5]. Terrestrial ecosystem carbon storage plays a key role in global carbon storage. Improving the carbon storage of terrestrial ecosystems can effectively reduce carbon emissions, which is considered to be an economically feasible and environmentally friendly way to mitigate the greenhouse effect and climate change [6]. Therefore, quantitative evaluation of carbon storage under future climate change can provide scientific decision-making for regional land resource allocation and economic development.
With global warming, about 60% of ecological services are affected, resulting in decline [7]. All regions are gradually paying attention to the impact of future climate change. Therefore, the issue of energy conservation and emission reduction has become a social hot spot. Recently, studies on the effects of land use change on terrestrial ecosystem carbon have been carried out from many aspects. In terms of research methods, most scholars combine the land simulation model and ecological model and use multiple models to conduct quantitative research on carbon storage. In terms of research scale, many experiments are based on the global or national, etc., and there are many studies on the large scale. For example, Imranul Islam used the InVEST model to detect carbon storage in eastern Bangladesh [8], and Shujiang Xiang combined the FLUS model and InVEST model to evaluate the regional carbon storage in Chongqing [9]. However, the existing prediction studies only simulate the future based on the current development, and the impact of climate change is not clear. In addition, many scholars cannot provide an effective evaluation of the city-level scale under large-scale research.
At present, there are various models for the quantitative change in carbon storage, such as InVEST, ARIES, and ESM. Among them, the InVEST model has simple data, convenient operation, and accurate simulation, which can simulate the spatial and temporal distribution of carbon storage at a large scale. This model has been widely used by foreign scholars in many countries and important regions and has shown strong applicability in the research of China [10,11,12,13]. The scholars combined the model with land simulation models such as CA-Markov [14], Markov-CLUE-S [15], FLUS [16], and PLUS [17] to explore the future distribution of carbon storage. PLUS has a high precision in land simulation, which can add future factors to limit the prediction of land change, so as to explore the impact of climate change.
The construction of ecological civilization and environmental protection are important contents of the high-quality coordinated development of urban agglomeration in Central Yunnan. The overall ecological environment level of the city cluster in Central Yunnan Province remains good, with the forest coverage rate of about 50%. Coupled with favorable climatic conditions, it is a region with a strong ecological environment carrying capacity in Yunnan Province, which is conducive to the growth of plants and animals and the restoration of the ecological environment. In recent years, the study area has witnessed rapid population growth, continuous urbanization, and rapid expansion of urban space. With the increase in food demand, the conversion of forests to seasonal crops leads to regional ecological degradation and the decline of carbon sequestration capacity. Since carbon storage involves economic society and the ecosystem is complex and changeable, it is difficult for a single model to reveal the process of the impact of climate change on regional carbon storage. Therefore, based on the three scenarios (SSP126, SSP245, and SSP585) provided by the Coupled Model Intercomparison Project Phase 6 (CMIP6) [18], this paper tries to establish the integrated model of the Shared Socioeconomic Pathway and Representative Concentration Pathway (SSP-RCP), the patch-generating land use simulation (PLUS) and the integrated valuation of ecosystem services and tradeoffs (InVEST), and applies it in the analysis of carbon storage of land use change to explore the spatial correlation of future carbon storage under the influence of climate change, and the importance of various class drivers. This is completed in order to provide a scientific basis and theoretical support for the construction of ecological civilization and guide the low-carbon development of urban agglomeration in Central Yunnan.
2. Materials and Methods
2.1. Study Area Overview
The Central Yunnan City cluster consists of 49 counties (districts and cities), including Kunming City, Qujing City, Yuxi City, Chuxiong Yi Autonomous Prefecture, and Mengzi City, Gejiu City, Jianshui County, Kaiyuan City, Mirek City, Luxi County and Shiping County in the northern part of Honghe Hani and Yi Autonomous Prefecture (Figure 1). It is located at 100°43′~104°49′ east longitude. At 24°58′~25°09′ north latitude, it is one of the 19 urban agglomerations under the state key cultivation. It is an important part of the national strategic pattern of “two horizontal and three vertical” urbanization, and also an important growth pole of China’s new economic support belt based on the Yangtze River. As the most economically developed region in Yunnan Province, its GDP in 2020 will reach more than CNY 1.5 trillion, accounting for more than 60% of the province [19]. Its land area will account for 29% of the province (114,600.00 km2) [20]. Its permanent resident population is 21,953,810, accounting for 46.5% of the province’s permanent resident population [21].
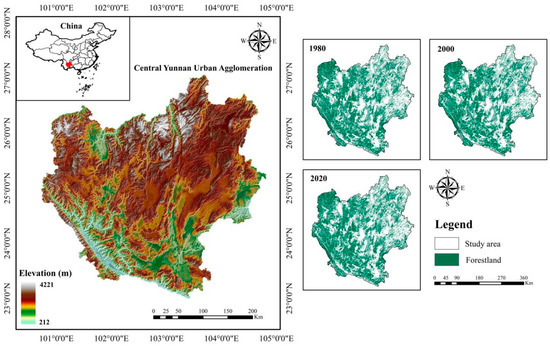
Figure 1.
Profile of the Study Area.
2.2. Data Source and Processing
The basic data involved in this paper are as follows: (1) the land use data were obtained from Data Center for Resources and Environment, Chinese Academy of Sciences (https://www.resdc.cn/, accessed on 7 July 2022) with a spatial resolution of 30 m. The original secondary land was combined into six categories: cropland, forestland, grassland, water, urban and barren; (2) the natural factor data included elevation, slope, NDVI, precipitation, temperature, soil erosion, and soil type. The precipitation and temperature data were obtained from Data Center for Resources and Environmental Sciences, Chinese Academy of Sciences (https://www.resdc.cn/, accessed on 19 July 2022) with a spatial resolution of 1 km. DEM data are derived from the Geospatial Data Cloud (http://www.gscloud.cn, accessed on 15 July 2022) ASTER GDEM, 30 m spatial resolution; slope is obtained from DEM analysis. NDVI is calculated by Landsat satellite images on GEE platform [22]. Soil data were obtained from the International Soil Reference and Information Center (https://data.isric.org, accessed on 21 July 2022), with a spatial resolution of 1km. (3) Social factors include population, GDP, distance from railway, distance from water, and distance from road. The data of population and GDP were downloaded from Data Center for Resources and Environmental, Sciences, Chinese Academy of Sciences (https://www.resdc.cn/, accessed on 23 July 2022), and distance from railway, water, and road was obtained by distance analysis in ArcGIS software. (4) This research under the hypothesis that the carbon density of static, carbon density data contains carbon density of aboveground vegetation (Cabove), carbon density of subsurface vegetation (Cbelow), the density of soil carbon (Csoil), death, organic carbon density (Cdead) four parts, on the basis of the existing research literature, according to combining the situation of the urban agglomeration in the Central Yunnan carbon density data obtained (Table 1) [23,24,25,26]. In addition, future climate data under different scenarios can be downloaded and obtained from the required scenarios through IPCC (https://esgf-node.llnl.gov, accessed on 9 August 2022) for downscaling [27]. According to the input requirements of the model, the data involved in this paper were preprocessed in ArcGIS 10.2, resampled, and transformed into projections to make its spatial resolution consistent with the coordinate system.

Table 1.
Carbon density of land use types in Central Yunnan urban agglomeration (unit: t/hm2).
2.3. Research Ideas and Methods
In this study, based on different scenarios of SSP-RCP, PLUS model and InVEST model are integrated to simulate carbon storage under the influence of climate change. First of all, according to the selected 12 land driving factors (temperature, precipitation, soil erosion, soil type, DEM, slope, population density, GDP, NDVI, distance from water, railways and roads) (Figure 2), based on the data of land use in 2000, simulation of land use situation in 2020, and in real data comparison, the verification accuracy. Then, taking 2020 as the starting data, the future population, GDP, temperature and precipitation data under different scenarios of SSP-RCP were added to simulate the land use situation in 2040, 2060, and 2080 [28,29]. Finally, the simulation results are put into the carbon module of InVEST model to obtain the carbon storage of the study area.
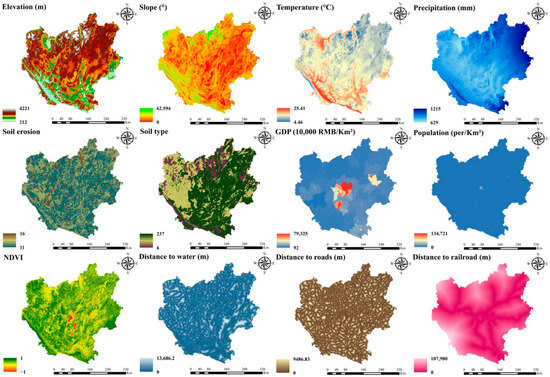
Figure 2.
Land driving factors.
2.3.1. Land Use Modeling under Climate Change
CMIP6 is the sixth Assessment Report of the IPCC (Intergovernmental Panel on Climate Change). Compared to the RCP scenario of CMIP5 [30], which only considers the goal of achieving stable CO2 concentration and corresponding radiative forcing over the next 100 years, The new shared socio-economic pathway in CMIP6 takes this into account and provides a more diverse set of emission scenarios that can provide more reasonable simulations for mitigation adaptation studies and regional climate projections [31,32,33]. So, this study selected the typical three kinds of situation assessment, (1) SSP126 scenario: ecological priority protection, the low level of economic and population growth, technological innovation is slow, fossil energy use slow, advocate green energy use, realize sustainable development, green advocates the forest restoration, land use is strictly controlled; (2) SSP245 scenario: according to the historical development of evolution, social development and ecological environment at the same time, middle path follow the social economy and technology, and has a medium level of greenhouse gas emissions, sustainable economic, social and environmental development, low-carbon energy technology fast development, the land use change is not completely control, namely the woodland could still be destroyed; (3) SSP585 scenario: population agglomeration growth, technological innovation, slow energy improvement, large use of fossil energy, resulting in rapid growth of high-temperature gas emissions, lack of climate change policies.
The PLUS model is a plate generation land use change simulation model developed by Liang Xun et al. [34], which integrates Markov Chain, land expansion analysis strategy (LEAS), and cellular automata model (CARS) of multiple random patch seeds. The advantage of the PLUS model compared to other models is that drivers of land expansion and landscape dynamics can be identified to predict patch evolution under different land use type scenarios [35]. Firstly, the data of land use types in two periods were selected to extract the spatial situation of the changes in local classes within the period, and then the driving factors were put in. Based on the random forest algorithm, the relationship between local classes and the driving factors was mined, and the conversion probability of local classes in the space was finally obtained (Figure 3). The formula is as follows [34]:
where the is the expansion probability of Earth class k at pixel i; d is whether there is a transformation from other earth classes to Earth class k, 0 or 1 is taken; X is the vector composed of driving factors; hn(X) is the land type calculated when the decision tree is n; M is the total number of decision trees; I is the decision tree indicator function.
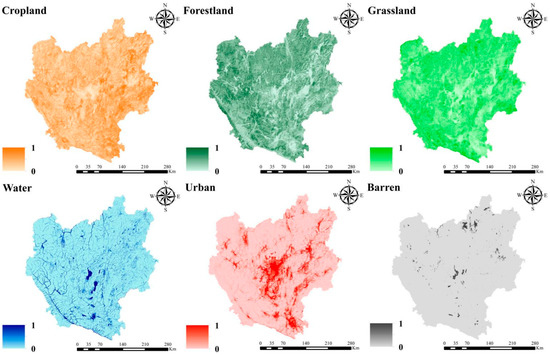
Figure 3.
Different kinds of spread distribution.
Markov Chain simulates the number of local classes [36]. This model is a random model used to predict the change in land use quantity, and it cannot calculate the change in spatial pattern. Based on the current state, the land use state and the trend of change at two random times were randomly calculated to calculate the future possibility, obtain the transfer probability between different regions, and obtain the land change probability matrix, so as to calculate the land change quantity of different regions in the future time.
The CARS model combines the traditional CA model with the mechanism of plaque generation and threshold decline and conducts spatial simulation with reference to the spatial development potential of local classes. When the neighborhood effect of a single ground class equals zero, the PLUS model can automatically generate the “seeds” of each local class and gradually form a new patch group. The formula is as follows [34]:
is the domain weight of class k in pixel i at time t, and wk is the domain weight parameter. is the comprehensive probability of pixel i’s transition to Earth class k at time t, is the suitability probability of pixel i’s expansion to Earth class k, is the adaptive driving coefficient, r is a random value between 0 and 1, and μk is the threshold of newly generated patches.
The accuracy of the simulation results of the PLUS model was verified by Kappa coefficient and overall accuracy [37]. Based on the existing land use data, the land use data of the target year was simulated starting from a time point, and the results were compared with the land use data of the corresponding year. The overall accuracy and kappa coefficient range from 0 to 1, and the closer the value is to 1, the higher the simulation accuracy will be. When the kappa coefficient is greater than 0.8, it indicates that the simulation results of this model reach a good state.
2.3.2. Modeling Carbon Storage under Climate Change
The InVEST model carbon module divides carbon storage into four parts [38,39,40]. Carbon storage of aboveground vegetation, underground vegetation, soil, and dead organic carbon comprises the carbon storage of the study area. The data of land use type and carbon pool in the study area were used for calculation. The calculation formula is [38]:
where Ctotal is the total carbon storage of the study area, and the unit is t; Ak is the area of the k type of land, k is 1 to n, n is the number of land types, carbon density of above-ground vegetation (Cabove), and carbon density of underground vegetation (Cbelow). Soil carbon density (Csoil) and dead organic matter carbon density (Cdead) constitute the carbon pool in the study area, and the unit is t/hm2.
3. Results
3.1. Land Simulation under Different Scenarios of SSP-RCP
The selected land driving factors are put into the PLUS model. According to the land use data from 1980 to 2000, Markov Chain is used to predict the number of local classes in 2020. As the input parameter of the CARS module, the land use status of 2020 is simulated with the starting date of 2000, and compared with the actual data. Simulation evaluation showed that the Kappa coefficient was 0.8868 and the overall accuracy reached 0.9269, which was high. The model established a reliable dynamic simulation and could be used to predict future land use.
Based on the changing trend from 2000 to 2020 and taking 20 years as a time interval, Markov Chain is used to estimate the number of local classes under different climate change scenarios from 2040–2080 (Figure 4), and CARS is used as the input parameter of the model for spatial simulation. According to the selected SSP-RCP scenario, the future temperature, precipitation, population, and GDP factors were added for control. Different factor combinations and expansion probabilities were selected for different scenarios to finally simulate the spatial-temporal changes in land use in different scenarios under climate change (Figure 5).
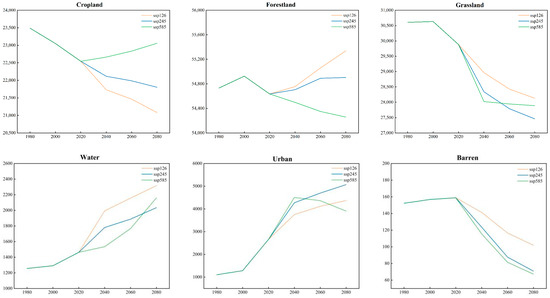
Figure 4.
The number of local classes under different historical and future scenarios (unit: km2).
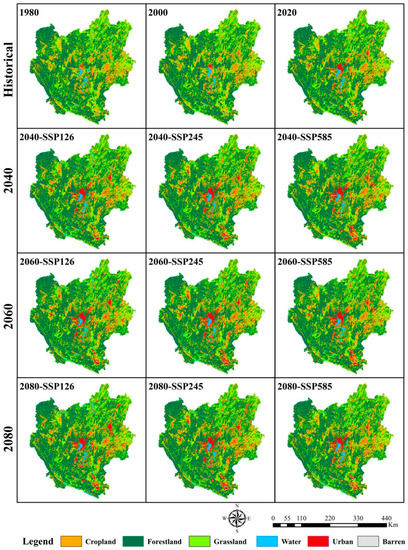
Figure 5.
Spatio-temporal evolution of land use.
During the period from 1980 to 2020, forestland as the largest land type in the Central Yunnan urban agglomeration accounts for about 49%. Grassland and cropland reached 27% and 20%, respectively. With the rapid development of urbanization, urban land expanded rapidly, from 1102.75 km2 in 1980 to 2659.5 km2, with a growth rate as high as 141.17%. According to the land flow graph (Figure 6), it can be seen that the main flow of a large number of croplands into urban land, grassland, and forestland, grassland mainly into forestland and cropland, forestland conversion mainly to grassland, almost did not turn out to use construction land, a large number of land into construction land increase, water is improved, area increase, barren have not changed much, a situation that is basically in balance.
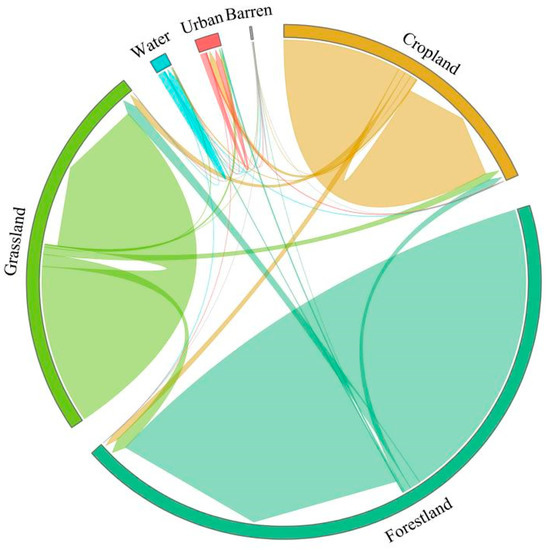
Figure 6.
Map of land transfer flow from 1980 to 2020.
In the future, three different scenarios of SSP-RCP showed different trends. From the perspective of cropland, the loss of cultivated land is more serious under SSP126 and SSP126 scenarios, while the cropland area increases under SSP585 scenarios. The change in forestland was contrary to that of cropland. The forestland area decreased under SSP585 but improved under the other two scenarios. The grassland loss in the three scenarios was different degrees. Due to the increase in precipitation in the future, the water area under the three scenarios will increase significantly, with increases of 36.27%–58.33% (SSP126), 21.7%–39.09% (SSP245), and 4.93%–47.65% (SSP585), respectively. With the development of the economy, the urban area of the three scenarios all increases, among which the SSP585 scenario has a sharp rise over a period of time and then a slow decline. The increases in the three scenarios were 41.12%–64.41% (SSP126), 60.74%–90.65% (SSP245), and 69.44%–46.91% (SSP585), respectively. Under each scenario, the barren was fully utilized, and the area decreased.
3.2. Carbon Storage under Climate Change
3.2.1. Temporal and Spatial Evolution of Carbon Storage
From 1980 to 2020, the carbon reserves of the Central Yunnan urban agglomeration (Figure 7) showed a downward trend. In 1980, the carbon reserves of the study area were 2758.0857 × 106 t, and in 2020, the carbon reserves were 2718.4274 × 106 t. Compared with 1980, it has decreased by 39.6583 × 10⁶ t over the past 40 years. From the perspective of spatial distribution (Figure 8), the carbon storage in the Central Yunnan urban agglomeration is higher in the western region and gradually decreases in the eastern region. The carbon storage in the central region is extremely low, and the carbon storage in Southwest Yunnan is significantly higher than that in Northeast Yunnan. The areas with high carbon storage are mainly Chuxiong City, Yuxi City, Shiping County, Jianshui County, and Gejiu City. The main reason is that this area is mostly woodland and grassland with high vegetation coverage. The regions with low carbon storage are concentrated in the southern part of Kunming, Qujing City, and Luxi County because this region is the political and economic center of Central Yunnan. With rapid urban development, high-intensity human activities have damaged the ecological environment, resulting in the transfer of land species with strong carbon sequestration capacity to land species with weak carbon sequestration capacity.
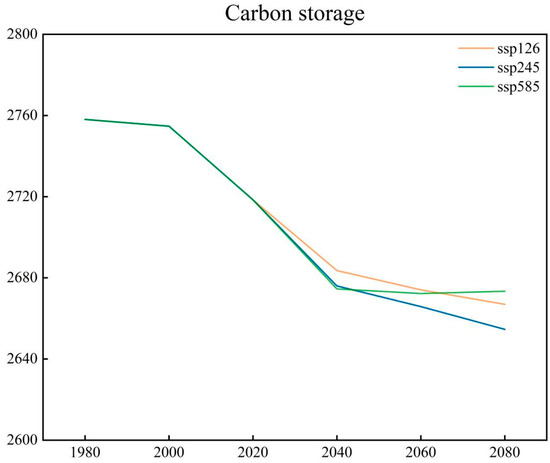
Figure 7.
Trend of carbon storage (unit: 106 t).
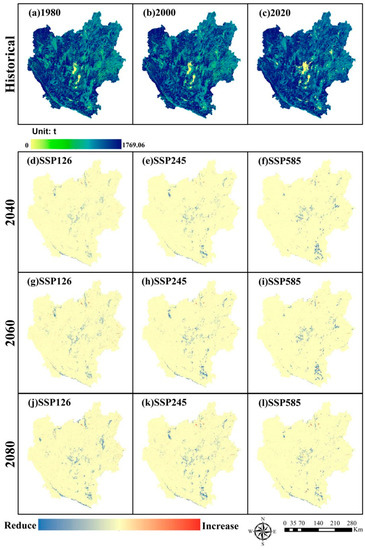
Figure 8.
Spatial distribution of carbon storage in the (a–c) historical period, and spatial changes in the (d–l) future period relative to 2020.
In the future, under the influence of climate change, the carbon storage of the three scenarios will change to different degrees compared with that of 2020. In 2040, the carbon storage of the SSP585 scenario will decrease by 43.91 × 10⁶ t compared with that of 2020, followed by the SSP245 scenario, and the SSP126 scenario will decrease slowly. In 2060 and 2080, the SSP245 scenario will continue to decline rapidly, and carbon storage will decrease the most seriously, by 52.592 × 10⁶ t and 63.787 × 10⁶ t compared with 2020, respectively. In the SSP126 scenario, due to the slow urban development and ecological protection, the decline rate gradually slows down. Under the SSP245 scenario, the urban development is uniform, which will continuously destroy the surrounding ecological land and lead to the continuous decline of carbon storage in the future. In the future scenario of SSP585, with the continuous increase in CO2 concentration in the air, the temperature will rise and rainfall will increase, providing favorable growth conditions for vegetation recovery. Compared with 2020 in space (Figure 8), under the three scenarios, construction land will expand to different degrees, and carbon storage will continue to decline in the main urban area of Kunming in the middle of the study area and in the southern part of the study area. In the SSP126 scenario, there was an increase, because the land classes with low carbon sequestration capacity gradually transferred to the land classes with high carbon sequestration capacity. The growth area was relatively fragmented and distributed in the whole study area, without forming a large area of aggregation. Under the SSP585 scenario, the regions with reduced carbon storage gradually decrease, while the regions with increased carbon storage gradually increase.
3.2.2. Spatial Correlation of Carbon Storage
From the perspective of spatial correlation, the Moran’I index of carbon storage in the three future scenarios is all greater than 0, indicating that carbon storage in the Central Yunnan urban agglomeration presents regional accumulation in space. Through the Getis-Ord Gi* hot spot analysis (Figure 9), a different scenario, there were no large differences in low carbon at high aggregate distribution, and hot spots are mainly distributed in the west of the study area. Due to the high altitude, and limited human activities, forest vegetation protection is good, and with the effects of climate change, Vegetation is gradually recovering in the area. Cold spots mainly gathered in the construction land economy of more developed regions, such as the central part of the study area. The high intensity of human activities causes area damage to the surrounding ecological land. Land type is given priority to cultivated land, and the multiple lakes, due to increased precipitation, expand the area of lake water and the water area rises, the water type of carbon density are small. The increase in a water area will cover other terrestrial species with high carbon sequestration capacity, resulting in a decrease in regional carbon sequestration capacity and the aggregation of cold spots. The inconspicuous areas are mainly caused by ecological land fragmentation.
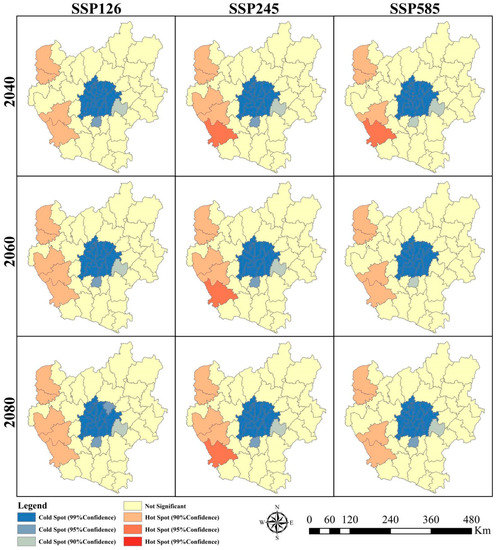
Figure 9.
Distribution of hot and cold spots under different scenarios under climate change.
3.3. Assessment of Forest Carbon Storage
The forest area of the Central Yunnan urban agglomeration accounts for about 50% of the total area. As the land type with the strongest carbon sequestration capacity, forest carbon reserves account for about 58% of the total. Therefore, the changing pattern of forest carbon reserves has an important impact on the change in terrestrial ecosystem carbon storage. In this study, changes in forest carbon storage were separately assessed and analyzed. The results show that (Table 2), from 1980 to 2020, the forest carbon storage in the study area first increased and then decreased. With the development of the social economy after 2000, the rise of tourism, the large population flow, and the rapid expansion of cities, the forest carbon storage decreased by 8.218 × 10⁶ t while pursuing rapid economic development. Under climate change, compared with 2020, the forest carbon storage of SSP126 and SSP245 showed an increasing trend in the next three periods. With the different development degrees of each scenario, the CO2 concentration in the air promoted forest growth, increasing by 19.914 × 10⁶ t and 7.591 × 10⁶ t, respectively. In the SSP585 scenario, forest carbon storage continued to decline. In this scenario, urban development and farmland expansion led to a decrease in the forest area. With the passing of time, the decrease rate gradually slowed down, with a total decrease of 10.648 × 10⁶ t.
Table 2.
Changes in forest carbon storage (unit: 106 t).
In space, forests are mainly distributed in Northwestern and Southern Yunnan, showing a pattern of high in the west and low in the east. This distribution is mainly influenced by the geological environment and human disturbance. The northwest part of the study area is located at the southern end of the Yunling Mountains, with high altitude and low population density, and weak activity intensity. The forest is not developed and preserved, and the southwest part is dominated by the Yuanjiang River Valley, where sufficient water nourishes the growth of vegetation. The low forest cover in the east is mainly due to the relatively developed economy in the region and the destruction of the original forest by a large number of people. Secondly, the degree of rocky desertification in the region is relatively serious and the forest is difficult to recover. Therefore, the forest carbon storage in the east is much lower than that in the east.
4. Discussion
4.1. Land Use Driven Analysis
The change in land use type not only changes the regional ecological structure but also affects its carbon sequestration ability. Therefore, this paper explores the importance of the driving factors in different regions. The research results show (Figure 10) that population and economic factors are important factors affecting the cropland, which is similar to the previous research results [41,42]. The increase and decrease in population will affect the demand for food, and economic growth will change the existing agricultural model and thus change the cropland. The forestland is greatly affected by precipitation and altitude, and abundant precipitation provides favorable conditions for forest growth [43,44]. The high-altitude area has low intensity of human activities and weak interference in the forest, so it is suitable for forest expansion. The findings that grassland is sensitive to climatic effects, and that precipitation and temperature provide the environment for grassland development, are supported by previous results [45,46]. In the process of spatial expansion, urban land is comprehensively affected by a variety of factors, of which slope is the main factor. Areas with large slopes hinder urban development, and too large a slope will lead to construction difficulties and high costs. Secondly, the spatial distribution of the population increases and the existing urban space cannot meet the current demand. Therefore, it will promote the outward expansion of the city. These influences are consistent with the results of BAI et al. [47,48]. The development of water areas in space is promoted by temperature, crustal fluctuation, and artificial construction. The unused land is mostly distributed in areas with extremely sparse, high altitude, and low population density [49,50].
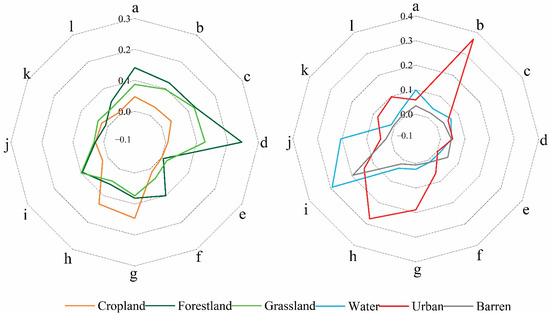
Figure 10.
Importance of driving factors. (a. Elevation b. Slope c. Temperature d. Precipitation e. Soil erosion f. Soil type g. GDP h. Population i. NDVI j. Distance to water k. Distance to roads l. Distance to railroad).
4.2. Experimental Advantages and Limitations
With the publication of CMIP6, researchers have been provided with a variety of data to provide a future reference when forecasting [51,52]. In the land simulation model, PLUS has high precision, and in the factor selection, future factors can be added to the limit. Among various ecosystem service models, InVEST model is widely used for its advantages of convenience, simplicity, and efficiency, and can directly express research results. Therefore, the CMIP6, PLUS, and InVEST models were coupled to simulate the impact of land use change on carbon storage under different scenarios under future climate change, combining their respective advantages, and providing an effective detection method for the sustainable development of urban agglomeration in Central Yunnan. The result of the carbon is mainly affected by the land-type carbon density data. Reasonable selection of local carbon density data is the key to simulation, the carbon density is different in different land classes, and affected by the climate, geographical position, and hydrological factors. This article refers to the existing research results, combined with the characteristics of the study area, and the survey data on carbon density correction. The carbon density data of land type adopted in this study are static, which may lead to inaccurate results. The carbon density data will change dynamically with the changes in precipitation, temperature, biomass, and the alternations of seasons. In future studies, in order to improve the estimation accuracy, observation of carbon density data can be strengthened to obtain long-term dynamic data.
4.3. Proposed Measures
The change in land use type directly affects the carbon storage of terrestrial ecosystems, among which the carbon sequestration capacity of forestland is higher than that of other land types. Therefore, the restoration and control of forest resources are helpful to improve the regional carbon sequestration capacity. With the intensification of human activities, ecological damage is caused. Therefore, combined with different development scenarios, the city cluster in Central Yunnan should strengthen the protection of ecological resources, promote green development, improve the detection of changes in woodland and grassland, and strictly implement the policy red line, so as to improve carbon storage in the future. At the same time, the city should develop green energy, take the road of sustainable development, and consolidate the achievements of ecological construction. According to this experiment, some suggestions can be provided for the future development of the city cluster in Central Yunnan. Forest resource control should be strengthened in the areas with carbon storage cold spots. As the main part of the forest, the natural forest should be continuously monitored, natural forest reserves should be established, afforestation should be scientifically promoted, and the policy of returning farmland to the forest should be implemented on the premise that the bottom line of cultivated land can meet the food production. We should make a reasonable distribution of land development plan, maintain the important position of ecology while developing the economy, and take the green road of sustainable development. In the hot spots of carbon storage, the restoration of degraded forests should be strengthened, the area of forest land should be maintained, and the capacity of carbon sequestration should be continuously strengthened while maintaining good carbon sequestration areas. The future climate pattern is changeable, so the government should make relevant plans to cope with the impact of different climate changes, choose the development direction reasonably, and improve the carbon sequestration capacity of the terrestrial ecosystem.
5. Conclusions
This paper builds a framework based on CMIP6 climate data, simulates future land use data through the PLUS model, and predicts carbon storage in the study area coupled with InVEST model. The experiment reveals the spatial distribution and spatial correlation of carbon storage in the Central Yunnan urban agglomeration under different climate change scenarios in the future. The research conclusions are as follows:
- (1)
- In the future, SSP126 scenario changes are similar to SSP245 scenario changes. SSP126 scenario changes in cropland, forest, water, and grassland are fast, while the SSP245 scenario expansion of urban land is faster. Under the SSP585 scenario, the area of cultivated land and water area increased, while the forest and grassland gradually decreased, and the rate of decline gradually slowed down. The construction land increased first and then decreased, and the unused land was fully utilized.
- (2)
- The total carbon storage in the future three scenarios will continue to decline, with SSP245 having the most serious decline compared with 2020, followed by the SSP126 scenario. Compared with SSP126 and SSP245 scenarios in 2020, forest carbon storage increased, while the SSP585 scenarios decreased.
- (3)
- From the perspective of spatial correlation, Moran’s index is all greater than 0 under different scenarios in the future, and there is no significant difference in carbon storage aggregation, and the spatial distribution of cold and hot spots in the three scenarios is similar. The hot spots are mainly distributed in the western part of the study area. The cold spots are mainly concentrated in the Central Yunnan region.
In addition, the results of this study provide scientific insights for the future territorial spatial planning of Central Yunnan urban agglomeration. In the future, a mechanism for continuous monitoring of land use change and scientific assessment of carbon storage should be established to form a balanced and coordinated land pattern and achieve sustainable and low-carbon development.
Author Contributions
Conceptualization, R.W.; methodology, R.W. and J.Z.; data curation, R.W.; validation, R.W.; formal analysis, R.W., Y.L. and Q.C.; writing—original draft, R.W. and Y.F.; writing—review and editing, J.Z., G.C. and Y.L.; supervision, J.Z., G.C. and Y.L. All authors have read and agreed to the published version of the manuscript.
Funding
This research was funded by the National Natural Science Foundation of China (41761081), Basic Research Program of Yunnan Province (202201AU070112), Kunming University of Science and Technology Talent Introduction Research Initiation Fund Project (KKZ3202021055), and Yunnan Philosophy and Social Sciences Planning Project (PY202129).
Data Availability Statement
Not applicable.
Conflicts of Interest
The authors declare no conflict of interest.
References
- Clerici, N.; Cote-Navarro, F.; Escobedo, F.J.; Rubiano, K.; Villegas, J.C. Spatio-temporal and cumulative effects of land use-land cover and climate change on two ecosystem services in the Colombian Andes. Sci. Total Environ. 2019, 685, 1181–1192. [Google Scholar] [CrossRef] [PubMed]
- Deng, X.; Zhao, C.; Yan, H. Systematic modeling of impacts of land use and land cover changes on regional climate: A review. Adv. Meteorol. 2013, 2013, 317678. [Google Scholar] [CrossRef]
- Piao, S.; He, Y.; Wang, X.; Chen, F. Estimation of China’s terrestrial ecosystem carbon sink: Methods, progress and prospects. Sci. China Earth Sci. 2022, 65, 641–651. [Google Scholar] [CrossRef]
- Chang, X.; Xing, Y.; Wang, J.; Yang, H.; Gong, W. Effects of land use and cover change (LUCC) on terrestrial carbon stocks in China between 2000 and 2018. Resour. Conserv. Recycl. 2022, 182, 106333. [Google Scholar] [CrossRef]
- Pugh, T.A.; Lindeskog, M.; Smith, B.; Poulter, B.; Arneth, A.; Haverd, V.; Calle, L. Role of forest regrowth in global carbon sink dynamics. Proc. Natl. Acad. Sci. USA 2019, 116, 4382–4387. [Google Scholar] [CrossRef] [PubMed]
- Raihan, A.; Begum, R.A.; Nizam, M.; Said, M.; Pereira, J.J. Dynamic impacts of energy use, agricultural land expansion, and deforestation on CO2 emissions in Malaysia. Environ. Ecol. Stat. 2022, 29, 477–507. [Google Scholar] [CrossRef]
- Forzieri, G.; Dakos, V.; McDowell, N.G.; Ramdane, A.; Cescatti, A. Emerging signals of declining forest resilience under climate change. Nature 2022, 608, 534–539. [Google Scholar] [CrossRef] [PubMed]
- Islam, I.; Cui, S.; Hoque, M.Z.; Abdullah, H.M.; Tonny, K.F.; Ahmed, M.; Ferdush, J.; Xu, L.; Ding, S. Dynamics of Tree outside Forest Land Cover Development and Ecosystem Carbon Storage Change in Eastern Coastal Zone, Bangladesh. Land 2022, 11, 76. [Google Scholar] [CrossRef]
- Xiang, S.; Wang, Y.; Deng, H.; Yang, C.; Wang, Z.; Gao, M. Response and multi-scenario prediction of carbon storage to land use/cover change in the main urban area of Chongqing, China. Ecol. Indic. 2022, 142, 109205. [Google Scholar] [CrossRef]
- Babbar, D.; Areendran, G.; Sahana, M.; Sarma, K.; Raj, K.; Sivadas, A. Assessment and prediction of carbon sequestration using Markov chain and InVEST model in Sariska Tiger Reserve, India. J. Clean. Prod. 2021, 278, 123333. [Google Scholar] [CrossRef]
- Li, Y.; Liu, Z.; Li, S.; Li, X. Multi-Scenario Simulation Analysis of Land Use and Carbon Storage Changes in Changchun City Based on FLUS and InVEST Model. Land 2022, 11, 647. [Google Scholar] [CrossRef]
- Xie, L.; Bai, Z.; Yang, B.; Fu, S. Simulation Analysis of Land-Use Pattern Evolution and Valuation of Terrestrial Ecosystem Carbon Storage of Changzhi City, China. Land 2022, 11, 1270. [Google Scholar] [CrossRef]
- Lahiji, R.N.; Dinan, N.M.; Liaghati, H.; Ghaffarzadeh, H.; Vafaeinejad, A. Scenario-based estimation of catchment carbon storage: Linking multi-objective land allocation with InVEST model in a mixed agriculture-forest landscape. Front. Earth Sci. 2020, 14, 637–646. [Google Scholar] [CrossRef]
- Zhao, M.; He, Z.; Du, J.; Chen, L.; Lin, P.; Fang, S. Assessing the effects of ecological engineering on carbon storage by linking the CA-Markov and InVEST models. Ecol. Indic. 2019, 98, 29–38. [Google Scholar] [CrossRef]
- Zhu, W.; Zhang, J.; Cui, Y.; Zhu, L. Ecosystem carbon storage under different scenarios of land use change in Qihe catchment, China. J. Geogr. Sci. 2020, 30, 1507–1522. [Google Scholar] [CrossRef]
- Li, Z.; Cheng, X.; Han, H. Future impacts of land use change on ecosystem services under different scenarios in the ecological conservation area, Beijing, China. Forests 2020, 11, 584. [Google Scholar] [CrossRef]
- Liu, Q.; Yang, D.; Cao, L.; Anderson, B. Assessment and Prediction of Carbon Storage Based on Land Use/Land Cover Dynamics in the Tropics: A Case Study of Hainan Island, China. Land 2022, 11, 244. [Google Scholar] [CrossRef]
- Zelinka, M.D.; Myers, T.A.; McCoy, D.T.; Po-Chedley, S.; Caldwell, P.M.; Ceppi, P.; Klein, S.A.; Taylor, K.E. Causes of higher climate sensitivity in CMIP6 models. Geophys. Res. Lett. 2020, 47, e2019GL085782. [Google Scholar] [CrossRef]
- National Bureau of Statistics of China. Gross Domestic Product; Official Website of National Bureau of Statistics of China: Beijing, China, 2020.
- National Bureau of Statistics of China. National Data; Official Website of National Bureau of Statistics of China: Beijing, China, 2020.
- National Bureau of Statistics of China. Chinese Statistical Yearbook; Official Website of National Bureau of Statistics of China: Beijing, China, 2020.
- Huang, C.; Yang, Q.; Huang, W. Analysis of the Spatial and Temporal Changes of NDVI and Its Driving Factors in the Wei and Jing River Basins. Int. J. Environ. Res. Public Health 2021, 18, 11863. [Google Scholar] [CrossRef] [PubMed]
- Tang, X.; Zhao, X.; Bai, Y.; Tang, Z.; Wang, W.; Zhao, Y.; Wan, H.; Xie, Z.; Shi, X.; Wu, B. Carbon pools in China’s terrestrial ecosystems: New estimates based on an intensive field survey. Proc. Natl. Acad. Sci. USA 2018, 115, 4021–4026. [Google Scholar] [CrossRef]
- Alam, S.A.; Starr, M.; Clark, B.J. Tree biomass and soil organic carbon densities across the Sudanese woodland savannah: A regional carbon sequestration study. J. Arid. Environ. 2013, 89, 67–76. [Google Scholar] [CrossRef]
- Xu, L.; Yu, G.; He, N. Increased soil organic carbon storage in Chinese terrestrial ecosystems from the 1980s to the 2010s. J. Geogr. Sci. 2019, 29, 49–66. [Google Scholar] [CrossRef]
- Chu, X.; Zhan, J.; Li, Z.; Zhang, F.; Qi, W. Assessment on forest carbon sequestration in the Three-North Shelterbelt Program region, China. J. Clean. Prod. 2019, 215, 382–389. [Google Scholar] [CrossRef]
- Yukimoto, S.; Koshiro, T.; Kawai, H.; Oshima, N.; Yoshida, K.; Urakawa, S.; Tsujino, H.; Deushi, M.; Tanaka, T.; Hosaka, M. MRI MRI-ESM2. 0 model output prepared for CMIP6 CMIP. MRI MRI-ESM2. 0 model output prepared for CMIP6 CMIP. Earth Syst. Grid Fed 2019, 10. [Google Scholar] [CrossRef]
- Chen, Y.; Guo, F.; Wang, J.; Cai, W.; Wang, C.; Wang, K. Provincial and gridded population projection for China under shared socioeconomic pathways from 2010 to 2100. Sci. Data 2020, 7, 83. [Google Scholar] [CrossRef]
- Murakami, D.; Yoshida, T.; Yamagata, Y. Gridded GDP Projections Compatible with the Five SSPs (Shared Socioeconomic Pathways). Front. Built Environ. 2021, 7, 760306. [Google Scholar] [CrossRef]
- Chaturvedi, R.K.; Joshi, J.; Jayaraman, M.; Bala, G.; Ravindranath, N. Multi-model climate change projections for India under representative concentration pathways. Curr. Sci. 2012, 103, 791–802. [Google Scholar]
- Borrelli, P.; Robinson, D.A.; Panagos, P.; Lugato, E.; Yang, J.E.; Alewell, C.; Wuepper, D.; Montanarella, L.; Ballabio, C. Land use and climate change impacts on global soil erosion by water (2015-2070). Proc. Natl. Acad. Sci. USA 2020, 117, 21994–22001. [Google Scholar] [CrossRef]
- Meehl, G.A.; Senior, C.A.; Eyring, V.; Flato, G.; Lamarque, J.-F.; Stouffer, R.J.; Taylor, K.E.; Schlund, M. Context for interpreting equilibrium climate sensitivity and transient climate response from the CMIP6 Earth system models. Sci. Adv. 2020, 6, eaba1981. [Google Scholar] [CrossRef]
- Almazroui, M.; Saeed, S.; Saeed, F.; Islam, M.N.; Ismail, M. Projections of precipitation and temperature over the South Asian countries in CMIP6. Earth Syst. Environ. 2020, 4, 297–320. [Google Scholar] [CrossRef]
- Liang, X.; Guan, Q.; Clarke, K.C.; Liu, S.; Wang, B.; Yao, Y. Understanding the drivers of sustainable land expansion using a patch-generating land use simulation (PLUS) model: A case study in Wuhan, China. Comput. Environ. Urban Syst. 2021, 85, 101569. [Google Scholar] [CrossRef]
- Zhang, S.; Zhong, Q.; Cheng, D.; Xu, C.; Chang, Y.; Lin, Y.; Li, B. Landscape ecological risk projection based on the PLUS model under the localized shared socioeconomic pathways in the Fujian Delta region. Ecol. Indic. 2022, 136, 108642. [Google Scholar] [CrossRef]
- Wu, H.; Li, Z.; Clarke, K.C.; Shi, W.; Fang, L.; Lin, A.; Zhou, J. Examining the sensitivity of spatial scale in cellular automata Markov chain simulation of land use change. Int. J. Geogr. Inf. Sci. 2019, 33, 1040–1061. [Google Scholar] [CrossRef]
- Gao, L.; Tao, F.; Liu, R.; Wang, Z.; Leng, H.; Zhou, T. Multi-scenario simulation and ecological risk analysis of land use based on the PLUS model: A case study of Nanjing. Sustain. Cities Soc. 2022, 85, 104055. [Google Scholar] [CrossRef]
- Sharp, R.; Tallis, H.; Ricketts, T.; Guerry, A.; Wood, S.A.; Chaplin-Kramer, R.; Nelson, E.; Ennaanay, D.; Wolny, S.; Olwero, N. InVEST User’s Guide; The Natural Capital Project: Stanford, CA, USA, 2014. [Google Scholar]
- Wei, J.; Hu, A.; Gan, X.; Zhao, X.; Huang, Y. Spatial and Temporal Characteristics of Ecosystem Service Trade-Off and Synergy Relationships in the Western Sichuan Plateau, China. Forests 2022, 13, 1845. [Google Scholar] [CrossRef]
- Jia, P.; Huang, W.; Zhang, Z.; Cheng, J.; Xiao, Y. The Carbon Sink of Mangrove Ecological Restoration between 1988–2020 in Qinglan Bay, Hainan Island, China. Forests 2022, 13, 1547. [Google Scholar] [CrossRef]
- Huang, D.; Jin, H.; Zhao, X.; Liu, S. Factors influencing the conversion of arable land to urban use and policy implications in Beijing, China. Sustainability 2014, 7, 180–194. [Google Scholar] [CrossRef]
- Tan, M.; Li, X.; Xie, H.; Lu, C. Urban land expansion and arable land loss in China—A case study of Beijing–Tianjin–Hebei region. Land Use Policy 2005, 22, 187–196. [Google Scholar] [CrossRef]
- Erick, G.; Irma, T. Tree and shrub recruitment under environmental disturbances in temperate forests in the south of Mexico. Bot. Stud. 2022, 63, 11. [Google Scholar] [CrossRef]
- Sun, H.; Wang, J.; Xiong, J.; Bian, J.; Jin, H.; Cheng, W.; Li, A. Vegetation change and its response to climate change in Yunnan Province, China. Adv. Meteorol. 2021, 2021, 8857589. [Google Scholar] [CrossRef]
- Fang, Y.-P.; Zhu, F.-B.; Yi, S.-H.; Qiu, X.-P.; Ding, Y.-J. Ecological carrying capacity of alpine grassland in the Qinghai–Tibet Plateau based on the structural dynamics method. Environ. Dev. Sustain. 2021, 23, 12550–12578. [Google Scholar] [CrossRef]
- Fu, G.; Sun, W. Temperature sensitivities of vegetation indices and aboveground biomass are primarily linked with warming magnitude in high-cold grasslands. Sci. Total Environ. 2022, 843, 157002. [Google Scholar] [CrossRef]
- Bai, H.; Li, Z.; Guo, H.; Chen, H.; Luo, P. Urban Green Space Planning Based on Remote Sensing and Geographic Information Systems. Remote Sens. 2022, 14, 4213. [Google Scholar] [CrossRef]
- Ouyang, X.; Xu, J.; Li, J.; Wei, X.; Li, Y. Land space optimization of urban-agriculture-ecological functions in the Changsha-Zhuzhou-Xiangtan Urban Agglomeration, China. Land Use Policy 2022, 117, 106112. [Google Scholar] [CrossRef]
- Li, Y.; Hu, L.; Zhao, Y.; Wang, H.; Huang, X.; Chen, G.; Leppänen, J.J.; Fontana, L.; Ren, L.; Shi, Z. Meltwater-driven water-level fluctuations of Bosten Lake in arid China over the past 2000 years. Geophys. Res. Lett. 2021, 48, e2020GL090988. [Google Scholar] [CrossRef]
- Long, H.; Zhang, Y.; Ma, L.; Tu, S. Land use transitions: Progress, challenges and prospects. Land 2021, 10, 903. [Google Scholar] [CrossRef]
- Chen, L.; Wang, G.; Miao, L.; Gnyawali, K.R.; Li, S.; Amankwah, S.O.Y.; Huang, J.; Lu, J.; Zhan, M. Future drought in CMIP6 projections and the socioeconomic impacts in China. Int. J. Climatol. 2021, 41, 4151–4170. [Google Scholar] [CrossRef]
- Olén, N.B.; Lehsten, V. High-resolution global population projections dataset developed with CMIP6 RCP and SSP scenarios for year 2010–2100. Data Brief 2022, 40, 107804. [Google Scholar] [CrossRef] [PubMed]


Publisher’s Note: MDPI stays neutral with regard to jurisdictional claims in published maps and institutional affiliations. |
© 2022 by the authors. Licensee MDPI, Basel, Switzerland. This article is an open access article distributed under the terms and conditions of the Creative Commons Attribution (CC BY) license (https://creativecommons.org/licenses/by/4.0/).