Abstract
The chestnut is widely cultivated fruit tree enriched with nutrients and has pleasant tasting fruit. The starch properties of kernels greatly influence the nutritional quality of chestnuts. Although various studies have examined the production and accumulation of starch in chestnuts, the transcription alteration linked with starch properties in the kernels has not yet been fully assessed. The present study was conducted to compare transcriptomic variation and starch profiling of three chestnut cultivars: “Garrone rosso” (eur), Castanea sativa Mill., native to Europe; “Dahongpao” (dhp) and “Jiandingyouli” (jdy), and Castanea mollissima Bl., native to China. The results revealed that “dhp” and “jdy” had higher amylose, amylopectin and total starch content than “eur”. Based on transcriptome data, we screened 63.17G clean bases, and detected numerous differentially expressed genes (DEGs) that were associated with starch and sucrose metabolism. Through the combined transcriptomic and starch profiling analysis showed that DEGs in “the starch and sucrose metabolism”, “bZIP transcriptional factors”, and “zinc finger protein” pathways were positively correlated with starch accumulation, genes encoding sucrose synthase (CMHBY215664 and CMHBY203813), USPase (CMHBY206855), and PGI (CMHBY200699) were found to participate in the biosynthesis, transport, and regulation of starch according to their expression patterns in chestnut kernels. Furthermore, genes encoding different transcription factors (ERF, bZIP, MYB, and WRKY) that potentially regulate the expression of genes involved in starch and sucrose metabolism were selected by coexpression analysis, which highlighted that most MYB and WRKY TF members were positively correlated with starch synthase (SS). qRT-PCR assay results of nine selected DEGs confirmed the accuracy of the RNA-Seq data. Our results provide insights into genetic resources for deciphering the molecular mechanisms of chestnut starch accumulation.
1. Introduction
Chestnut is a widely consumed fruit crop across the world due to its high nutritional and commercial value [1]. According to geographical distribution, chestnut cultivars are mainly found in three areas: Castanea mollissima Bl. in Asia, Castanea sativa Mill. in Europe and Castanea dentata Borkh. in North America [2]. The chestnut cultivars “Garrone rosso” (eur) and Castanea sativa Mill. are native to Europe, and “Dahongpao” (dhp) and “Jiandingyouli” (jdy), and Castanea mollissima Bl. are native to China. Kernels of chestnuts are considered beneficial food due to their distinctive nutritional value and availability of more than 50% starch (dry weight basis) in the mature chestnut kernel [3]. Waxy properties are important characteristics of starch, and high-amylose and waxy chestnut starches are now popular for value addition [4]. The waxy properties and starch content of European and Asian chestnut cultivars are significantly different [5]; thus, the present study aimed to characterize high-amylose chestnut starches (“jdy” and “dhp”) in comparison with normal chestnut starch (“eur”), to delineate how starch is produced in chestnut kernels.
Starch comprises amylopectin, amylose, and two polymers, which are then bifurcated by different isoforms of starch branching enzyme (SBE), resulting in water-insoluble and semicrystalline starch granules [6]. It is commonly recognized that starch is predominately formalized from the sucrose, which is produced by source leaves, then moved toward heterotrophic sink organs by sucrose synthase (SuSy) [7,8]. SuSy catalyzes the rescindable transformation of uridinediphosphate (UDP) and sucrose to fructose and uridinediphosphate glucose (UDPG) [9,10]. The most direct intermediate for producing starch is adenosine diphosphate glucose (ADPG), and enzymes such as pyrophosphate (PPi), phosphoglucomutase (PGM), UDPG pyrophosphorylase (UGPase), fructokinase (FK), and phosphoglucose isomerase (PGI) are involved in the carbohydrate metabolism of the storage organs that catalyze sucrose to ADPG [7,8]. As a major component of the granules, amylopectin is responsible for the starch granule structure [11] that is formalized via soluble starch synthase (SS) and SBE, while granule-bound starch synthase (GBSS) is solely involved in converting amylose to starch granules [12].
Among the main cereal crops, such as wheat [13], rice [14], and maize [15], the enzymes and genes of the starch biosynthesis pathway have been highly conserved and functionally tested. To date, majority of key enzymes and genes, including ADPG pyrophosphorylase (OsAGPL1-4 [14], ZmAGPS2a/b [15], TaAGPL1/2 [13]), granule-bound starch synthase (OsGBSSI/II [14], ZmGBSSI [15], TaGBSSI/II [13]), soluble starch synthase (OsSSI/II/III [14], ZmSSIIa/b/c [15], TaSSIIa/b/c [13]), and starch branching enzyme (OeSBEI/IIa/b [14], ZmBEIIa/b [15], TaBEI/II/III [13]), have been identified in various cereals as playing an important role in starch synthesis. Apart from cereal crops, starch and sucrose metabolism has also been largely reported in other plants, such as potato [16], Arabidopsis [17], and kiwifruit [18]. However, there has been less emphasis on the study of the genetic factors underlying chestnut starch synthesis [19,20,21,22,23], especially comparing Chinese chestnuts to European. Previous studies on chestnut starch biosynthesis mainly focused on the physical and chemical properties, such as physicochemical characteristics [24], particles and hydrolytic properties, and its metabolism and production [25].
Apart from the various functional enzymes and genes, the upstream regulatory network of transcription factors (TFs) and other proteins also play a significant role in starch biosynthesis. At the transcription level, TFs of bZIP (OsbZIP58 [26]/ZmbZIP22 [27]/TabZIP28 [28]), NAC (OsNAC20 [29]/ZmNAC36 [30]), MADS-box (OsMADS7 [31], ZmMADS1a [32]) and MYB (ZmMYB14 [33]) were described as activating the expression of starch synthase enzyme-related genes that regulate starch development. Among the TFs, bZIPs are the main TFs that regulate starch biosynthesis [34], and have been characterized in several crops. These TFs have shown comprehensive compatibility with distinct motifs in the regulation of starch biosynthesis [28,35]. Unlike the function in starch biosynthesis, zinc finger proteins were reported to regulate the starch degradation in kiwifruit [18]. However, the role of candidate TFs in chestnut starch biosynthesis is not well understood, and no report has yet revealed the direct transcriptional regulation mechanism of chestnut starch synthase or upstream substrate biosynthesis pathway genes.
There are hundreds of different chestnut varieties around the world, and the starch contents of their kernels are different. Thus, it is important to gain deep insight into the complex regulatory mechanism of starch synthase genes. Recent reports investigated the mechanism of starch accumulation in plants such as Triticum aestivum L. [36], Solanum tuberosum L. [37], Hordeum vulgare L. [38], and Actinidia chinensis [18] using a transcriptomic approach. In addition, comparative analysis of different cultivars is an effective technique for detecting differentially expressed genes in different pathways or structural alterations that regulate important traits [39,40,41]. With the establishment of the chestnut genome database [42], studies on the genetic regulation of chestnut starch and sucrose metabolites have been completed [23]; however, a global perspective of RNA-seq-based transcripts analysis of various chestnut cultivars is also necessary.
This study was performed to better understand the complex mechanisms that are responsible for the production and accumulation of starch in different cultivars of chestnut, as well to provide a guide for marker-assisted breeding of new cultivars with more attractive taste and nutritional qualities (starch-based). Here, RNA-seq was deployed to compare the differences in the metabolisms of starch among three chestnut cultivars—“dhp”, “jdy”, and “eur”. Scanning electron microscopy (SEM) of starch granules was also performed, and DEGs and TFs involved in the starch and sucrose metabolism pathway were identified. This data set will provide basic information about the gene expression related to starch and sucrose metabolism in chestnut and will identify candidate genes/enzymes correlated with starch biosynthesis that will ultimately contribute to a molecular breeding program of chestnut.
2. Materials and Methods
2.1. Materials
Three chestnut cultivars—“Dahongpao” (dhp), “Jiandingyouli” (jdy) and “Garrone rosso” (eur)—were used as research material in the present study. The plants were grown on Longtan forest farm, Changzhou, Jiangsu Province, China (31°16′6″ N, 119°29′12″ E), under the same and regular growth conditions (temperature, humidity, light, etc.). The phenological periods for Chinese (jdy and dhp) and European (eur) chestnuts were not exactly consistent, and the maturity time for “eur” was around 1 week earlier than “jdy” and “dhp”. The chestnut fruits were sampled at early maturity during August 2020 from three different plants of each cultivar, and each plant was used as a biological replicate. Samples used for physiological index determination were stored at 4 °C (for no more than 3 days). For RNA extraction, samples were added to liquid nitrogen and stored at −80 °C immediately. Chemicals used in this study were of analytical grade.
2.2. Determination of Total Soluble Sugar (TSS) and Starch Contents
The soluble sugar content from every chestnut sample was determined according to the anthrone colorimetric method [43]. The sampled chestnut kernels were dried and ground into a fine powder, 1 g of each sample was added to test tubes, and 10 mL ddH2O was added to disperse it. After being kept in boiling water for 30 min, the extracts were sampled and adjusted to 100 mL with ddH2O. After that, sulfuric acid and anthrone were added and absorbances of all extracts measured using a wavelength of 620 nm. TSS contents were calculated by the standard calibration curve obtained by plotting the concentrations of a series of glucose solutions with its corresponding absorbance values. The results of TSS are expressed as mg·g−1 of dry chestnut flour. The concentrations of total starch and amylose/amylopectin were quantified with a total starch assay kit (K-TSTA; Megazyme, Bray, Ireland) and amylose/amylopectin kits (K-AMYL; Megazyme, Bray, Ireland) according to the manufacturer’s instructions (www.megazyme.com, accessed on 25 October 2022). Each measurement was performed on three biological replicates.
2.3. Scanning Electron Microscopy (SEM)
Scanning electron microscopy (SEM) was used for starch granule cell morphology analysis, and kernel samples of chestnut were fixed overnight in a 2.5% glutaraldehyde solution (v/v, 0.1 M phosphate buffer solution, pH 7.0). After storing at 4 °C for 2 h, the samples were dehydrated with 90% alcohol for 20 min, then freeze-dried. Morphology of the samples was observed by SEM (JSM6701F, Japan) at an accelerating voltage of 20.0 kV with magnification of 3000 times.
2.4. RNA Preparation, Transcriptome Sequencing, and Functional Annotation
A total of 200 mg of frozen kernel samples from three chestnut cultivars were ground into fine powder with liquid nitrogen, and then used for RNA extraction with a TRIzol®-based extraction reagent (Invitrogen, Carlsbad, CA, USA). The quality of the RNA samples was evaluated using NanoDrop and Agilent Technologies 2100 bioanalyzer (Agilent, Palo Alto, CA, USA). A ratio (A260/A280) of RNA samples between 1.8 and 2.1 was considered to be of sufficient quality for further RNA-Seq/qRT-PCR analysis. Nine high-quality libraries were prepared for RNA-Seq (3 biological replicates per sample) and sequenced using the Illumina Hiseq2500 platform (BGI, Shenzhen, China). SOAPnuke v1.5.2 software was used to remove the adapters or low-quality reads. RNA-Seq data were deposited and made available at NCBI SRA accession PRJNA824658. The clean reads were mapped to the chestnut reference genome (the NCBI bioproject PRJNA527178 [42]) using HISAT2 (ver. 2.0.4). The abundance of gene expression in sequenced libraries was normalized according to the fragments per kilobase of exon per million mapped reads (FPKM). DEGs among different groups were calculated by DESeq software (ver. 1.6.3). FDR (false-discovery rate) value < 0.05 and |log2fold change| ≥ 1 were set as the thresholds to identify significant DEGs.
To gain further insight into the changes in phenotype, Gene Ontology (GO, http://www.geneontology.org/, accessed on 25 October 2022) and Kyoto Encyclopedia of Genes and Genomes (KEGG, https://www.kegg.jp/, accessed on 25 October 2022) enrichment analysis of identified DEGs were performed. The significance of GO terms and KEGG pathways was corrected through a rigorous threshold (p-value < 0.05, via the Bonferroni correction).
2.5. Candidate DEGs Validation by qRT-PCR
qRT-PCR was conducted on the 9 randomly selected DEGs from RNA-Seq to validate the accuracy of the sequencing, as described previously [44]. Complementary DNA (cDNA) of different samples was transcribed by the Takara PrimeScriptTM RT reagent kit with gDNA Eraser (Takara Bio Inc., Kusatsu, Japan) following the manufacturer’s instructions. Specific primers (Table S1) used for qRT-PCR were designed with Primer Premier 6 software (Palo Alto, Santa Clara, CA, USA). Actin was selected as internal reference. qRT-PCR assays were performed using an ABI7500 real-time PCR system according to the manufacturer’s instructions (Applied Biosystems, Foster, CA, USA). All reactions and negative controls (non-template) were conducted in triplicate. Relative mRNA expressions were calculated via the 2−ΔΔCt method [45]. Data are shown as means ± standard error (SE, n = 3).
2.6. Statistical Analysis
All the analyzed data in this study are expressed as means ± standard error (SE). SPSS 14.0 (SPSS Inc., Chicago, IL, USA) was used to perform statistical analyses. A one-way ANOVA with Duncan’s multiple-range test was used to determine the significant differences (p < 0.05). Correlation coefficients were determined by the Pearson coefficient, and the correlation network was conducted through the OmicStudio online system (https://www.omicstudio.cn/tool accessed on 25 October 2022). Heatmaps were constructed with TBtools 1.098765.
3. Results
3.1. Total Soluble Sugar (TSS) and Starch Contents
The results of basic physiological indicators, including the kernel size, total soluble sugar (TSS), amylose, and amylopectin contents, were measured (Figure 1). The appearance of kernels of different cultivars was also included. The results showed that “eur” was larger than “dhp” and “jdy”, while soluble sugar (TSS) values were found to be higher in “dhp” and “jdy” than in “eur”. The starch analysis showed that the highest amount of amylose contents was observed in “jdy” (13.35 mg·g−1), which were significantly higher than in “dhp” (12.11 mg·g−1) and “eur” (11.78 mg·g−1). The amylopectin and total starch content in the kernels of Chinese cultivar “dhp” and “jdy” were significantly higher than “eur” compared to amylose. These results suggested that total starch contents and amylopectin are the main indicators of differences between Chinese and European chestnut cultivars.
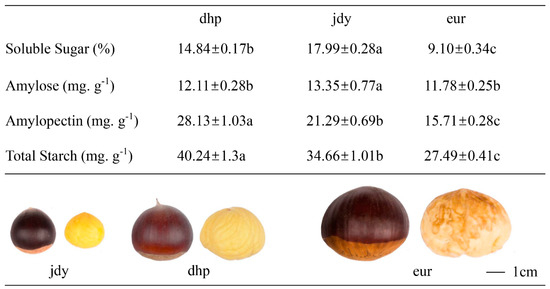
Figure 1.
The size, soluble sugar, total starch content, amylose, and amylopectin of three chestnut varieties. Means ± standard error (n = 3). Different letters mean significant differences (p < 0.05, Duncan’s multiple-range test). Scale bar = 1 cm.
3.2. Microstructure of Chestnut Starch Granules among the Three Cultivars
The microstructure of “jdy”, “dhp”, and “eur” cultivar starch granules were examined by scanning electron microscopy (SEM) (Figure 2). The overall microstructure of kernels was presented as a honeycomb-like structure (porous starch structure). The starch granule morphology in three chestnut cultivars showed a slight difference, since there were more honeycomb holes observed in “eur” than in “jdy” and “dhp” (indicated by red arrows). The shape of starch granules was oval, round, or asymmetric polygonal and the particle size of the starch granules varied from 5 to 19 μm. The particle size of starch granules may be related to the starch content.
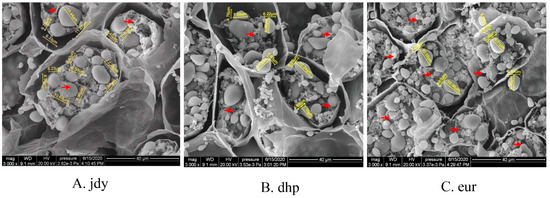
Figure 2.
SEM images of starch granules of three chestnut cultivars. Each cultivar image is 3000×. Honeycomb-like holes are marked with red arrows.
3.3. Library Construction and Sequencing
In the current study, 150 bp paired-end clean bases from each library were generated from 6.09–7.94 GB data (Table 1). A total of 63.17 GB clean data was obtained after filtering, with average Q30 of 93.59%. The chestnut reference genome (https://www.ncbi.nlm.nih.gov/bioproject/PRJNA527178, accessed on 25 October 2022) was used to map the clean reads. Among the nine libraries, the aligned ratios of the reads ranged from 83.25% to 94.1%, with >77.81% unique mapped reads. The quality and sequencing depth of data were adequate for further analysis.

Table 1.
Statistical results of the RNA-Seq data.
To determine the differences in gene expression among the three chestnut cultivars, the expression levels of all the sequenced samples were converted to FPKM data and subjected to Pearson correlation and PCA (Figure 3A). The correlation within each group was at least R2 > 0.88, and the correlation between different cultivars was at least R2 > 0.55 (eur-a vs. jdy-c). PCA and expression profiles of the 9 libraries (three biological replicates of each sample, Figure 3B) revealed that the samples from the three cultivars could be clearly distinguished, confirming that between cultivars, differences were relatively high and the three chestnut cultivars showed dissimilar global expression patterns, which were appropriate for further analysis. PCA data denote 49.15% of the transverse difference between the two dimensions. Taken together, the samples of “jdy” and “dhp” were grouped most closely together as compared to “eur”.
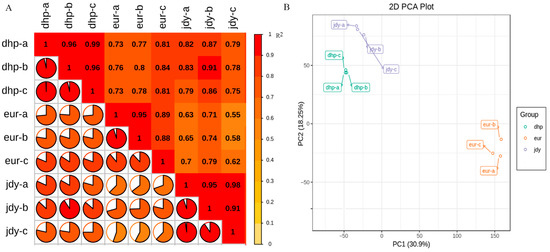
Figure 3.
Pearson correlation matrix (A) and principal-component analysis (B) of differentially expressed genes (DEGs) were performed on sequenced sample sets to assess correlations and variance between samples. “dhp”, “eur”, and “jdy” are the names of the three chestnut cultivars. a/b/c represent the 3 biological replicates.
3.4. Identification of Differentially Expressed Genes (DEGs)
In this study, DEGs with |log2 fold change| ≥ 1 and FDR < 0.05 were measured and found to be significantly different. A total of 3449, 3041, and 1766 genes were upregulated and 5690, 5302, and 2042 genes were downregulated between “eur” vs. “dhp”, “eur” vs. “jdy”, and “jdy” vs. “dhp”, respectively (Figure 4A,B). According to the results (Figure 4A,B), there were more DEGs among “eur” vs. “dhp” and “eur” vs. “jdy” than “jdy” vs. “dhp”, which revealed a closer relationship between “jdy” and “dhp”.
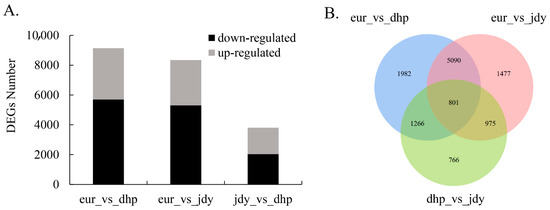
Figure 4.
DEGs among 3 chestnut cultivars. (A) The number of up- and downregulated DEGs (|log2 fold change| ≥ 1 and FDR < 0.05). (B) Venn diagrams of DEGs among the three sampling groups (|log2 fold change| ≥ 1 and FDR < 0.05).
3.5. GO and KEGG Functional Enrichment Analysis of DEGs
To further investigate the function of DEGs, Gene Ontology (GO)-based analysis was performed with a threshold p-value < 0.05 to evaluate significantly enriched GO pathways, which were distributed into three functional categories: cellular component (CC), molecular function (MF), and biological process (BP) (Figure 5). The results showed that 2018 DEGs (15.1%) were annotated as “CC”, 7203 DEGs (53.8%) were annotated as “MF”, and 4177 DEGs (31.1%) were annotated as “BP”. In GO analysis, all the significant DEGs were divided into 38 functional groups, where intrinsic component of plasma membrane (GO:0031226), heme binding (GO:0020037), and response to water (GO:0009415) contained the maximum number of DEGs among the three groups “eur” vs. “dhp”, “eur” vs. “jdy”, and “jdy” vs. “dhp”, respectively (Figure 5).
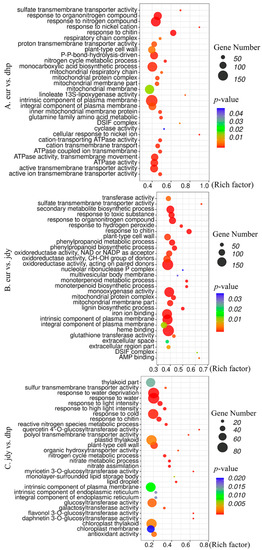
Figure 5.
GO enrichment analysis of DEGs. Advanced bubble chart depicts enrichment of DEGs in different pathways. (A) “eur” vs. “dhp’; (B) “eur” vs. “jdy’; (C) “jdy” vs. “dhp”. Sum denotes the number of DEGs and rich factors are considered to be the ratio of DEGs in each GO analysis compared with total number of DEGs.
We used KEGG pathway-based analysis to understand the biological functions of DEGs, particularly to find candidate DEGs and pathways associated with chestnut starch biosynthesis and metabolism. Based on pathway analysis, DEGs were allocated to 140 pathways (p-value < 0.05, top 10 numbers of DEGs) that were found to be the most enriched (Table 2). In the comparisons of “eur” vs. “dhp” and “eur” vs. “jdy”, biosynthesis of the secondary metabolites pathway (ko01110) was found to be most enriched and comprised the maximum number of DEGs, while the carbon metabolism (ko01200), leucine and isoleucine, valine, degradation (ko00280), protein processing in endoplasmic reticulum (ko04141), alpha-linolenic acid metabolism (ko00592), and glyoxylate and dicarboxylate metabolism (ko00630) pathways were also significantly enriched among the comparisons of the Chinese chestnut cultivars (“jdy” and “dhp”) vs. the European chestnut cultivar (“eur”). In the aforementioned comparisons, the most significant KEGG pathways between “jdy” and “dhp” were galactose metabolism (ko00052, p-value of 2.32 × 10⁻⁶) and circadian rhythm—plant (ko04712, p-value of 0.00035).
Table 2.
Significantly enriched pathways of DEGs among three chestnut cultivars.
3.6. Transcripts Associated with Starch and Sucrose Metabolism Pathway
In the current study, there were 38 DEGs (|log2 fold change| ≥ 1 and p-value < 0.05) related to the starch and sucrose metabolism pathway (Figure 6, Table S2). SuSy participated in the catabolism of sucrose and UDP to fructose and UDP-glucose, four genes annotated as SuSy were differentially expressed, whereas CMHBY215664 and CMHBY203813 displayed higher expression levels in “dhp”, and CMHBY202474 and CMHBY209941 were upregulated in “jdy” and “eur”, respectively. Other DEGs such as USPase (CMHBY206855), UGPase (CMHBY200038), FK (CMHBY207292), and PGI (CMHBY200699) were all highly expressed in “jdy” and “dhp”. Of the 38 detected DEGs, 17 exhibited lowest expression profiles in “eur”, especially genes related to amylose and amylopectin biosynthesis, such as Amylose, GBSS, SBE, ISA, and SSI-SSIV (8 out of 15). CMHBY209397 and CMHBY216710 respectively displayed at least four-fold downregulated expression levels in “dhp” and “jdy” compared to “eur”, and were candidate genes in chestnut starch biosynthesis pathways that were newly profiled in the present study.
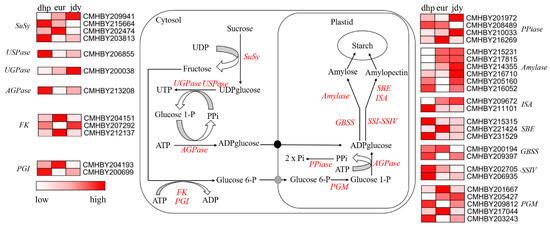
Figure 6.
Schematic model of starch biosynthesis in chestnut kernels. Sucrose synthase (SuSy), UDPG pyrophosphorylase (UGPase), UDP-sugar pyrophosphorylase (USPase), adenosine diphosphate glucose pyrophosphorylase (AGPase), fructokinase (FK), phosphoglucose isomerase (PGI), phosphoglucomutase (PGM), pyrophosphatase (PPiase), granule-bound starch synthase (GBSS), soluble starch synthase (SSI-SSIV), amylase (Amylase), starch branching enzyme (SBE), isoamylase (ISA).
3.7. Integrative Analysis of Starch and Sucrose Metabolism Pathway Gene Expression and Starch Content
Based on the transcription expression and starch content in the chestnut kernels, we configured a set of correlation networks between the starch concentrations (amylose, amylopectin, and total) and starch biosynthesis-related gene profiles (Figure 7 and Table S3). According to the results, amylopectin showed a positive correlation with five members of starch and sucrose metabolism pathway genes, and CMHBY231936 (R2 = 0.954, p < 0.01) and CMHBY204602 (R2 = 0.848, p < 0.01) were closely correlated with amylopectin content, while only three DEGs were negatively correlated with amylopectin concentrations. Most of the DEGs were negatively correlated with total starch content as compared to amylopectin. Interestingly, CMHBY231936 (R2 = 0.956, p < 0.01) also presented its highest correlation with total starch content. Only one gene was correlated with amylose contents (CMHBY218222, R2 = 0.9, p < 0.01) compared to total starch and amylopectin contents.
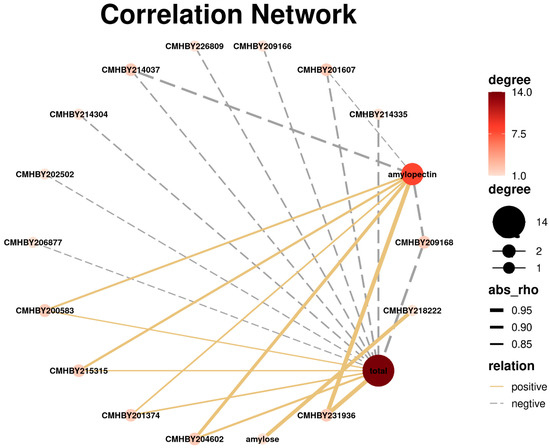
Figure 7.
Correlation networks between the starch concentrations (amylose, amylopectin, and total) and the starch biosynthesis-related gene expression profiles. Solid yellow lines represent positive and dotted gray lines represent negative correlation, whereas dot size/color denotes the quantity of correlated objects.
3.8. Transcription Factor Analyses (Correlations of TFs and SS)
In this study, by using transcriptome sequencing, a sum of 59 DEGs (|log2 fold change| ≥ 1 and p-value < 0.05) encoding TFs belonging to 21 major TF families were recognized among the three chestnut cultivars (Table S4). Among these TF families, ERF, bZIP, MYB, and WRKY symbolized the majority of TFs. In order to detect the prospective functions of TFs that were associated with starch biosynthesis, a correlation of expression profiles between the four TF families and starch biosynthesis-related genes were analyzed (Figure 8 and Table S5). Most members of the ERF TF family were positively correlated with SS gene expression, and CmERF2 (CMHBY220990), CmERF2-3 (CMHBY202468), and CmERF1b (CMHBY224417) were the top-three ERF TFs that were positively correlated with the majority of SS (Figure 8A). From the bZIP TFs (Figure 8B and Table S5), all three DEGs were significantly correlated with some SS, such as CmbZIP11 (CMHBY219231, R2 = 0.902 p < 0.01) and CmbZIP9 (CMHBY201999, R2 = 0.947, p < 0.01), and were all positively correlated with β-amylase3 (CMHBY216710), and the other members CmABI5 (CMHBY203484) were positively correlated with starch branching enzyme I (CMHBY215315, R2 = 0.902 p < 0.01). As seen in Figure 8C,D, we observed a large group of MYB and WRKY family genes that displayed a positive correlation with the expression of SS, whereas only four members (CMHBY208230, CMHBY231936, CMHBY210664, and CMHBY201585) of SS presented a negative correlation trend with CmMYB. This trend was also obvious in the correlation network of CmWRKY with SS, where only CMHBY231936, CMHBY218316, CMHBY223790, CMHBY208230, and CMHBY210664 showed negative correlation patterns with some CmWRKY members. The above results indicated that MYB and WRKY TF members were mostly positively correlated with SS.
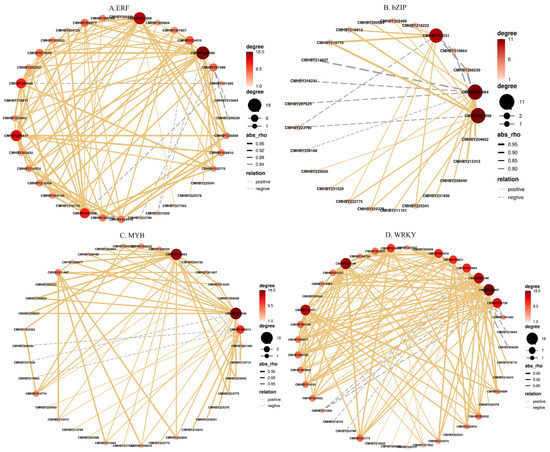
Figure 8.
Correlation of expression profiles between the four TF families ((A) ERF; (B) bZIP; (C) MYB; and (D) WRKY) and starch biosynthesis-related genes. Solid yellow lines denote positive and dotted gray lines represent negative correlation; dot size/color denotes the quantity of correlated objects.
3.9. Validation of DEGs by qRT-PCR
Nine genes were selected for qRT-PCR assays to validate the accuracy of RNA-seq data (three biological repeats per samples). The expression of CMHBY208087 in “eur” was used as a control. The qRT-PCR results overall displayed a close correlation with the RNA-seq data (Figure 9).
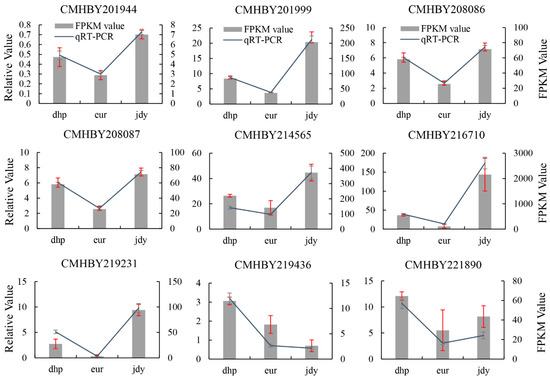
Figure 9.
Validation of DEGs by qRT-PCR in the kernels of three chestnut cultivars versus by RNA-Seq. dark blue line: qRT-PCR expression, gray bars: transcriptomics RNA-Seq analysis (FPKM).
4. Discussion
The chestnut is considered an important fruit tree due to its edible fruit and economic value. The kernels of chestnut contain plenty of nutritive compounds, including unsaturated fatty acids, fibers, polyphenols, minerals, vitamins, iron, and carbohydrates [46]. Among them, starch is the main carbohydrate, which is closely related to the physicochemical properties and quality of chestnut fruit [2,24]. The results of the current study indicated the significant difference between total starch content and amylopectin among three chestnut cultivars and potentially suggested that amylopectin is the main compound for distinguishing the starch from different chestnut varieties. Although the starch content in chestnut kernels has been widely studied [19,47], differences in starch between Chinese and European chestnut cultivars have not been reported.
The microstructure and content characteristics of chestnut starch granules were closely correlated with the taste and flavor of chestnut kernels, especially the waxy index, which was strongly affected by the microstructure of starch granules [48,49]. Usually, waxy cereals and kernels contain negligible amounts of amylose. Raeker et al. [50] established a significant negative correlation between amylose contents and the size of starch granules, demonstrating elevated amylose content in minor granules of wheat. In this study, we observed that the amylose content of “jdy” was considerably higher than that of “eur” (Figure 1), and the size of starch granules in “eur” was larger compared to “jdy” (Figure 2). These results were partially consistent with a previous study [50].
The metabolism of starch in chestnut is closely associated with the activity of corresponding enzymes, comprising starch synthase (SS), UDP-glucose-1-phosphatase (UDPase), starch branching enzyme (SBE), and granule-bound starch synthase (GBSS), although the pathway and gene of starch synthesis in some model plants have been described [51,52,53]. The molecular process for accumulation and biosynthesis of starch in chestnut kernels has also long been of interest for chestnut breeders. In the present study, the expression of numerous sugar metabolism pathway genes was observed to be positively correlated with the downstream genes related to starch formation. As a result of Pearson correlation analysis of starch and DEGs, genes related to amylose and amylopectin content were identified, such as β-amylase 3 (CMHBY216710) with amylose, isoamylase 3 (ISA, CMHBY211101) with amylopectin (Figure 7 and Table S3), beta-amylase 4 (CMHBY216052), and starch branching enzyme I (CMHBY215315) with total starch content. Starch biosynthesis in chestnut has also been reported in different studies: Li et al. [23] used different development stages of chestnut kernels as materials to show that the soluble starch synthase and α-1,4-glucan branching enzyme genes were differentially expressed and may act as key genes to regulate starch and sucrose metabolism. Shi et al. [19] carried out microscopic observation during fruit development of starch granule accumulation in developing Chinese chestnut seed kernels from 10 days after flowering (DAF) to 100 DAF, and identified some genes, including SUSY2, PGM, PGI, and GBSS1, potentially involved in the biosynthesis of starch, ADPG and G-1-P. The DEGs in the sugar metabolism pathway that were screened in our study were partially similar to those identified in previous studies.
Apart from the pathway genes, genetic evidence of transcription factors including basic leucine zipper (bZIP) [26], APETALA2/ethylene-responsive factor (AP2/ERF) [54], (NAM/ATAF/CUC (NAC) [30], and MYB [33] has also been previously reported in other plants to regulate starch production. Among them, bZIP is the first identified TF to regulate starch biosynthesis [55], and this appeared to be one of the key regulators of starch metabolism, which has been categorized in rice [56] and maize [57]. Besides bZIPs, some other TF family members, e.g., ZmNAC126, were cloned and identified in corn kernels to modulate starch accumulation by intensifying starch synthesis and hindering starch degradation [58]. Furthermore, the maize ZmMYB14 TF was also reported to bind the promoters and activate the expression of SSRGs [33]. In chestnut, the molecular mechanism underlying the biosynthesis and degradation of starch and the TFs associated with starch biosynthesis has not been experimentally elucidated. According to our results, a total of 59 DEGs (|log2 fold change| ≥ 1 and p-value < 0.05) encoding transcription factors (TFs) belonging to 21 major TF families were screened across the three chest cultivars, among which four transcription factor families—bZIP, AP2/ERF, MYB, and WRKY—were widely represented (Table S6). Specific TFs screened in the current study (CmbZIP11, CMHBY219231; CmbZIP9, CMHBY201999; CmABI5, CMHBY203484) can play a key role in a deeper understanding of the transcriptional regulatory networks and the downstream genes involved in chestnut biosynthesis. The gene coexpression networks will be helpful in the selection of key TF genes to repress or overexpress in order to develop chestnut lines with improved starch content (Table S7).
One possible molecular assistant that contributes to the starch biosynthesis or degradation of chestnut may be the zinc finger protein (ZFP). This hypothesis is supported by the DEGs annotated as zinc finger protein that were identified in this study (Table S8). In total, we observed 143 genes that showed differential expression in the three sequenced samples (|log2 fold change| ≥ 1 and p-value < 0.05). To explore the regulation network between ZFP genes and starch, a comparison between the starch concentrations (amylose, amylopectin, and total) and 143 ZFP gene expression profiles was conducted. The results demonstrated that 18, 76, and 81 ZFPs were significantly correlated with amylose, amylopectin, and total starch content, respectively (Table S9), and the number of negatively correlated genes was higher in the network of ZFPs with amylopectin (51/25) and total starch (49/32), which suggests that ZFPs likely contributed to the degradation of amylopectin and total starch. ZFPs that are related to starch biosynthesis have also been reported by Zhang et al. [18], who identified a zinc finger TF, DNA binding with one finger (AdDof3), that regulates the degradation of starch in kiwifruit. The candidate ZFPs screened from our study may also function in chestnut starch degradation.
The results of the current study identified molecular processes for the exploration of new regulatory (TFs) that differed among the three cultivars, such as starch and sucrose metabolism pathway genes (e.g., SS, BSSs) linked to starch production. Moreover, by using KEGG analysis, most of the DEGs were associated with “biosynthesis of secondary metabolites”, which is mainly involved in starch and sucrose metabolism.
5. Conclusions
In the current study, we investigated the complex molecular process of starch (amylose, amylopectin, and total sugar) accumulation in three chestnut cultivars. Higher starch content was recorded in “dhp” and “jdy” than “eur” through concentration determination and starch granule cell morphology detection of kernels from these cultivars. Synchronized action of important pathway genes are allied with starch metabolism, possibly to regulate TFs such as bZIP, MYB, ERF, and WRKY that participate in starch production. The possible molecular mechanisms of zinc finger protein that negatively control starch biosynthesis were also discussed. Overall, we detected key genes that might be the source of starch production in chestnuts. The outcomes of our study will be helpful in future chestnut breeding, and may ultimately improve the quality and quantity of chestnut starch production.
Supplementary Materials
The following supporting information can be downloaded at: https://www.mdpi.com/article/10.3390/f13122028/s1. Table S1: List of qRT-PCR primer sequences used; Table S2: Raw Ct values of key candidate and reference genes for qRT-PCR; Table S3: GO and KEGG annotations for DEGs; Table S4: DEGs of “starch and sucrose metabolism” pathway; Table S5: Correlation networks between the starch concentrations (amylose, amylopectin and total) and the related starch biosynthesis gene expression profiles; Table S6: Differentially expressed genes encoding transcription factors; Table S7: Correlation of expression profiles between the four TF families (A. ERF; B. bZIP; C. MYB and D. WRKY) and starch biosynthesis related genes; Table S8: DEGs annotated as “zinc finger protein”; Table S9: Correlations of “zinc finger protein” (ZFP)-related gene expression and starch concentrations (amylose, amylopectin and total).
Author Contributions
Data curation, W.W. and S.Z.; formal analysis, W.W.; resources, S.Z. and F.S.; supervision, C.Z.; validation, Y.Z.; visualization, W.W., Y.C. and X.B.; writing—original draft, W.W.; writing—review and editing, M.K.-U.-R. and C.Z. All authors have read and agreed to the published version of the manuscript.
Funding
This work was supported by the National Natural Science Foundation of China under grant 31500514, Jiangsu Institute of Botany Talent Fund (JIBTF202204, JSPKLB202030, and JSPKLB202043), and Special Fund of the Chestnut Germplasm Resources Repositories in Jiangsu Province, China.
Institutional Review Board Statement
Not applicable.
Informed Consent Statement
Not applicable.
Data Availability Statement
All materials are available by the corresponding author.
Conflicts of Interest
The authors declare no competing financial interest.
References
- Nishio, S.; Takada, N.; Terakami, S.; Takeuchi, Y.; Kimura, M.K.; Isoda, K.; Saito, T.; Iketani, H. Genetic structure analysis of cultivated and wild chestnut populations reveals gene flow from cultivars to natural stands. Sci. Rep. 2021, 11, 240. [Google Scholar] [CrossRef] [PubMed]
- De Vasconcelos, M.C.; Bennett, R.N.; Rosa, E.A.; Ferreira-Cardoso, J.V. Composition of European chestnut (Castanea sativa Mill.) and association with health effects: Fresh and processed products. J. Sci. Food Agric. 2010, 90, 1578–1589. [Google Scholar] [CrossRef] [PubMed]
- Zhu, F. Properties and food uses of chestnut flour and starch. Food Bioprocess Technol. 2017, 10, 1173–1191. [Google Scholar] [CrossRef]
- Hung, P.V.; Maeda, T.; Morita, N. Study on physicochemical characteristics of waxy and high-amylose wheat starches in comparison with normal wheat starch. Starch-Stärke 2007, 59, 125–131. [Google Scholar] [CrossRef]
- Pereira-Lorenzo, S.; Ballester, A.; Corredoira, E.; Vieitez, A.M.; Agnanostakis, S.; Costa, R.; Bounous, G.; Botta, R.; Beccaro, G.L.; Kubisiak, T.L. Chestnut. In Fruit Breeding; Springer: Berlin/Heidelberg, Germany, 2012; pp. 729–769. [Google Scholar]
- Sabelli, P.A.; Larkins, B.A. The development of endosperm in grasses. Plant Physiol. 2009, 149, 14–26. [Google Scholar] [CrossRef]
- Huang, L.; Tan, H.; Zhang, C.; Li, Q.; Liu, Q. Starch biosynthesis in cereal endosperms: An updated review over the last decade. Plant Commun. 2021, 2, 100237. [Google Scholar] [CrossRef]
- Comparot-Moss, S.; Denyer, K. The evolution of the starch biosynthetic pathway in cereals and other grasses. J. Exp. Bot. 2009, 60, 2481–2492. [Google Scholar] [CrossRef]
- Pontis, H.G.; Babio, J.R.; Salerno, G. Reversible unidirectional inhibition of sucrose synthase activity by disulfides. Proc. Natl. Acad. Sci. USA 1981, 78, 6667–6669. [Google Scholar] [CrossRef]
- Nakai, T.; Konishi, T.; Zhang, X.-Q.; Chollet, R.; Tonouchi, N.; Tsuchida, T.; Yoshinaga, F.; Mori, H.; Sakai, F.; Hayashi, T. An increase in apparent affinity for sucrose of mung bean sucrose synthase is caused by in vitro phosphorylation or directed mutagenesis of Ser11. Plant Cell Physiol. 1998, 39, 1337–1341. [Google Scholar] [CrossRef][Green Version]
- Zeeman, S.C.; Kossmann, J.; Smith, A.M. Starch: Its metabolism, evolution, and biotechnological modification in plants. Annu. Rev. Plant Biol. 2010, 61, 209–234. [Google Scholar] [CrossRef]
- Hanashiro, I.; Itoh, K.; Kuratomi, Y.; Yamazaki, M.; Igarashi, T.; Matsugasako, J.; Takeda, Y. Granule-bound starch synthase I is responsible for biosynthesis of extra-long unit chains of amylopectin in rice. Plant Cell Physiol. 2008, 49, 925–933. [Google Scholar] [CrossRef] [PubMed]
- Kang, G.; Li, S.; Zhang, M.; Peng, H.; Wang, C.; Zhu, Y.; Guo, T. Molecular cloning and expression analysis of the starch-branching enzyme III gene from common wheat (Triticum aestivum). Biochem. Genet. 2013, 51, 377–386. [Google Scholar] [CrossRef] [PubMed]
- Ohdan, T.; Francisco Jr, P.B.; Sawada, T.; Hirose, T.; Terao, T.; Satoh, H.; Nakamura, Y. Expression profiling of genes involved in starch synthesis in sink and source organs of rice. J. Exp. Bot. 2005, 56, 3229–3244. [Google Scholar] [CrossRef] [PubMed]
- Yan, H.; Pan, X.; Jiang, H.; Wu, G. Comparison of the starch synthesis genes between maize and rice: Copies, chromosome location and expression divergence. Theor. Appl. Genet. 2009, 119, 815–825. [Google Scholar] [CrossRef]
- Nazarian-Firouzabadi, F.; Visser, R.G. Potato starch synthases: Functions and relationships. Biochem. Biophys. Rep. 2017, 10, 7–16. [Google Scholar] [CrossRef] [PubMed]
- Fünfgeld, M.M.; Wang, W.; Ishihara, H.; Arrivault, S.; Feil, R.; Smith, A.M.; Stitt, M.; Lunn, J.E.; Niittylä, T. Sucrose synthases are not involved in starch synthesis in Arabidopsis leaves. Nat. Plants 2022, 8, 574–582. [Google Scholar] [CrossRef]
- Zhang, A.; Wang, W.; Tong, Y.; Li, M.J.; Grierson, D.; Ferguson, I.; Chen, K.; Yin, X. Transcriptome analysis identifies a zinc finger protein regulating starch degradation in kiwifruit. Plant Physiol. 2018, 178, 850–863. [Google Scholar] [CrossRef]
- Shi, L.; Wang, J.; Liu, Y.; Ma, C.; Guo, S.; Lin, S.; Wang, J. Transcriptome analysis of genes involved in starch biosynthesis in developing Chinese chestnut (Castanea mollissima Blume) seed kernels. Sci. Rep. 2021, 11, 3570. [Google Scholar] [CrossRef]
- Zhang, L.; Lin, Q.; Feng, Y.; Fan, X.; Zou, F.; Yuan, D.-Y.; Zeng, X.; Cao, H. Transcriptomic identification and expression of starch and sucrose metabolism genes in the seeds of Chinese chestnut (Castanea mollissima). J. Agric. Food Chem. 2015, 63, 929–942. [Google Scholar] [CrossRef]
- Chen, L.; Lu, D.; Wang, T.; Li, Z.; Zhao, Y.; Jiang, Y.; Zhang, Q.; Cao, Q.; Fang, K.; Xing, Y. Identification and expression analysis of starch branching enzymes involved in starch synthesis during the development of chestnut (Castanea mollissima Blume) cotyledons. PLoS ONE 2017, 12, e0177792. [Google Scholar] [CrossRef]
- Li, S.; Shi, Z.; Zhu, Q.; Tao, L.; Liang, W.; Zhao, Z. Transcriptome sequencing and differential expression analysis of seed starch accumulation in Chinese chestnut Metaxenia. BMC Genom. 2021, 22, 617. [Google Scholar] [CrossRef]
- Li, S.; Liang, H.; Tao, L.; Xiong, L.; Liang, W.; Shi, Z.; Zhao, Z. Transcriptome sequencing and differential expression analysis reveal molecular mechanisms for starch accumulation in chestnut. Forests 2020, 11, 388. [Google Scholar] [CrossRef]
- Hao, H.; Li, Q.; Bao, W.; Wu, Y.; Ouyang, J. Relationship between physicochemical characteristics and in vitro digestibility of chestnut (Castanea mollissima) starch. Food Hydrocoll. 2018, 84, 193–199. [Google Scholar] [CrossRef]
- Yu, S.; Liu, J.; Yang, Y.; Ren, J.; Zheng, X.; Kopparapu, N.K. Effects of amylose content on the physicochemical properties of Chinese chestnut starch. Starch-Stärke 2016, 68, 112–118. [Google Scholar] [CrossRef]
- Wang, J.-C.; Xu, H.; Zhu, Y.; Liu, Q.-Q.; Cai, X.-L. OsbZIP58, a basic leucine zipper transcription factor, regulates starch biosynthesis in rice endosperm. J. Exp. Bot. 2013, 64, 3453–3466. [Google Scholar] [CrossRef]
- Dong, Q.; Xu, Q.; Kong, J.; Peng, X.; Zhou, W.; Chen, L.; Wu, J.; Xiang, Y.; Jiang, H.; Cheng, B. Overexpression of ZmbZIP22 gene alters endosperm starch content and composition in maize and rice. Plant Sci. 2019, 283, 407–415. [Google Scholar] [CrossRef]
- Song, Y.; Luo, G.; Shen, L.; Yu, K.; Yang, W.; Li, X.; Sun, J.; Zhan, K.; Cui, D.; Liu, D. TubZIP28, a novel bZIP family transcription factor from Triticum urartu, and TabZIP28, its homologue from Triticum aestivum, enhance starch synthesis in wheat. New Phytol. 2020, 226, 1384–1398. [Google Scholar] [CrossRef]
- Wang, J.; Chen, Z.; Zhang, Q.; Meng, S.; Wei, C. The NAC transcription factors OsNAC20 and OsNAC26 regulate starch and storage protein synthesis. Plant Physiol. 2020, 184, 1775–1791. [Google Scholar] [CrossRef]
- Zhang, J.; Chen, J.; Yi, Q.; Hu, Y.; Liu, H.; Liu, Y.; Huang, Y. Novel role of ZmaNAC36 in co-expression of starch synthetic genes in maize endosperm. Plant Mol. Biol. 2014, 84, 359–369. [Google Scholar] [CrossRef]
- Zhang, H.; Xu, H.; Feng, M.; Zhu, Y. Suppression of OsMADS7 in rice endosperm stabilizes amylose content under high temperature stress. Plant Biotechnol. J. 2018, 16, 18–26. [Google Scholar] [CrossRef]
- Dong, Q.; Wang, F.; Kong, J.; Xu, Q.; Li, T.; Chen, L.; Chen, H.; Jiang, H.; Li, C.; Cheng, B. Functional analysis of ZmMADS1a reveals its role in regulating starch biosynthesis in maize endosperm. Sci. Rep. 2019, 9, 3253. [Google Scholar] [CrossRef] [PubMed]
- Xiao, Q.; Wang, Y.; Du, J.; Li, H.; Wei, B.; Wang, Y.; Li, Y.; Yu, G.; Liu, H.; Zhang, J. Zm MYB 14 is an important transcription factor involved in the regulation of the activity of the Zm BT 1 promoter in starch biosynthesis in maize. FEBS J. 2017, 284, 3079–3099. [Google Scholar] [CrossRef] [PubMed]
- Mertz, E.T.; Bates, L.S.; Nelson, O.E. Mutant gene that changes protein composition and increases lysine content of maize endosperm. Science 1964, 145, 279–280. [Google Scholar] [CrossRef] [PubMed]
- Schmidt, R.J.; Ketudat, M.; Aukerman, M.J.; Hoschek, G. Opaque-2 is a transcriptional activator that recognizes a specific target site in 22-kD zein genes. Plant Cell 1992, 4, 689–700. [Google Scholar]
- Gu, Y.; Han, S.; Chen, L.; Mu, J.; Duan, L.; Li, Y.; Yan, Y.; Li, X. Expression and regulation of genes involved in the reserve starch biosynthesis pathway in hexaploid wheat (Triticum aestivum L.). Crop J. 2021, 9, 440–455. [Google Scholar] [CrossRef]
- Dong, T.; Zhu, M.; Yu, J.; Han, R.; Tang, C.; Xu, T.; Liu, J.; Li, Z. RNA-Seq and iTRAQ reveal multiple pathways involved in storage root formation and development in sweet potato (Ipomoea batatas L.). BMC Plant Biol. 2019, 19, 136. [Google Scholar] [CrossRef]
- Tang, Y.; Zeng, X.; Wang, Y.; Bai, L.; Xu, Q.; Wei, Z.; Yuan, H.; Nyima, T. Transcriptomics analysis of hulless barley during grain development with a focus on starch biosynthesis. Funct. Integr. Genom. 2017, 17, 107–117. [Google Scholar] [CrossRef][Green Version]
- Gu, C.; Zhou, Y.H.; Shu, W.S.; Cheng, H.Y.; Wang, L.; Han, Y.P.; Zhang, Y.Y.; Yu, M.L.; Joldersma, D.; Zhang, S.L. RNA-Seq analysis unveils gene regulation of fruit size cooperatively determined by velocity and duration of fruit swelling in peach. Physiol. Plant. 2018, 164, 320–336. [Google Scholar] [CrossRef]
- Pomares-Viciana, T.; Río-Celestino, D.; Román, B.; Die, J.; Pico, B.; Gómez, P. First RNA-seq approach to study fruit set and parthenocarpy in zucchini (Cucurbita pepo L.). BMC Plant Biol. 2019, 19, 61. [Google Scholar] [CrossRef]
- Sharma, N.; Singh, A.K.; Singh, S.K.; Mahato, A.K.; Srivastav, M.; Singh, N.K. Comparative RNA sequencing based transcriptome profiling of regular bearing and alternate bearing mango (Mangifera indica L.) varieties reveals novel insights into the regulatory mechanisms underlying alternate bearing. Biotechnol. Lett. 2020, 42, 1035–1050. [Google Scholar] [CrossRef]
- Xing, Y.; Liu, Y.; Zhang, Q.; Nie, X.; Sun, Y.; Zhang, Z.; Li, H.; Fang, K.; Wang, G.; Huang, H. Hybrid de novo genome assembly of Chinese chestnut (Castanea mollissima). GigaScience 2019, 8, giz112. [Google Scholar] [CrossRef] [PubMed]
- Fairbairn, N. A modified anthrone reagent. Chem. Ind. 1953, 4, 86. [Google Scholar]
- Zhu, C.; Wang, W.; Chen, Y.; Zhao, Y.; Zhang, S.; Shi, F.; Khalil-Ur-Rehman, M.; Nieuwenhuizen, N.J. Transcriptomics and Antioxidant Analysis of Two Chinese Chestnut (Castanea mollissima BL.) Varieties Provides New Insights Into the Mechanisms of Resistance to Gall Wasp Dryocosmus kuriphilus Infestation. Front. Plant Sci. 2022, 13, 874434. [Google Scholar] [CrossRef] [PubMed]
- Livak, K.J.; Schmittgen, T.D. Analysis of relative gene expression data using real-time quantitative PCR and the 2−ΔΔCT method. Methods 2001, 25, 402–408. [Google Scholar] [CrossRef]
- Yang, F.; Liu, Q.; Pan, S.; Xu, C.; Xiong, Y.L. Chemical composition and quality traits of Chinese chestnuts (Castanea mollissima) produced in different ecological regions. Food Biosci. 2015, 11, 33–42. [Google Scholar] [CrossRef]
- De Vasconcelos, M.D.C.B.M.; Bennett, R.N.; Rosa, E.A.; Cardoso, J.V.F. Primary and secondary metabolite composition of kernels from three cultivars of Portuguese chestnut (Castanea sativa Mill.) at different stages of industrial transformation. J. Sci. Food Agric. 2007, 55, 3508–3516. [Google Scholar] [CrossRef]
- Svihus, B.; Uhlen, A.K.; Harstad, O.M. Effect of starch granule structure, associated components and processing on nutritive value of cereal starch: A review. Anim. Feed. Sci. Technol. 2005, 122, 303–320. [Google Scholar] [CrossRef]
- Bertolini, A.; Souza, E.; Nelson, J.; Huber, K. Composition and reactivity of A- and B-type starch granules of normal, partial waxy, and waxy wheat. Cereal Chem. 2003, 80, 544–549. [Google Scholar] [CrossRef]
- Raeker, M.; Gaines, C.; Finney, P.; Donelson, T. Granule size distribution and chemical composition of starches from 12 soft wheat cultivars. Cereal Chem. 1998, 75, 721–728. [Google Scholar] [CrossRef]
- Zeeman, S.C.; Tiessen, A.; Pilling, E.; Kato, K.L.; Donald, A.M.; Smith, A.M. Starch synthesis in Arabidopsis. Granule synthesis, composition, and structure. Plant Physiol. 2002, 129, 516–529. [Google Scholar] [CrossRef]
- James, M.G.; Denyer, K.; Myers, A.M. Starch synthesis in the cereal endosperm. Curr. Opin. Plant Biol. 2003, 6, 215–222. [Google Scholar] [CrossRef] [PubMed]
- Wang, Z.; Li, W.; Qi, J.; Shi, P.; Yin, Y. Starch accumulation, activities of key enzyme and gene expression in starch synthesis of wheat endosperm with different starch contents. J. Food Sci. Technol. 2014, 51, 419–429. [Google Scholar] [CrossRef] [PubMed]
- Zhu, Y.; Cai, X.-L.; Wang, Z.-Y.; Hong, M.-M. An interaction between a MYC protein and an EREBP protein is involved in transcriptional regulation of the rice Wx gene. J. Biol. Chem. 2003, 278, 47803–47811. [Google Scholar] [CrossRef] [PubMed]
- Lohmer, S.; Maddaloni, M.; Motto, M.; Di Fonzo, N.; Hartings, H.; Salamini, F.; Thompson, R.D. The maize regulatory locus Opaque-2 encodes a DNA-binding protein which activates the transcription of the b-32 gene. EMBO J. 1991, 10, 617–624. [Google Scholar] [CrossRef]
- Izawa, T.; Foster, R.; Nakajima, M.; Shimamoto, K.; Chua, N.-H. The rice bZIP transcriptional activator RITA-1 is highly expressed during seed development. Plant Cell 1994, 6, 1277–1287. [Google Scholar]
- Zhang, Z.; Zheng, X.; Yang, J.; Messing, J.; Wu, Y. Maize endosperm-specific transcription factors O2 and PBF network the regulation of protein and starch synthesis. Proc. Natl. Acad. Sci. USA 2016, 113, 10842–10847. [Google Scholar] [CrossRef]
- Xiao, Q.; Wang, Y.; Li, H.; Zhang, C.; Wei, B.; Wang, Y.; Huang, H.; Li, Y.; Yu, G.; Liu, H. Transcription factor ZmNAC126 plays an important role in transcriptional regulation of maize starch synthesis-related genes. Crop J. 2021, 9, 192–203. [Google Scholar] [CrossRef]


Publisher’s Note: MDPI stays neutral with regard to jurisdictional claims in published maps and institutional affiliations. |
© 2022 by the authors. Licensee MDPI, Basel, Switzerland. This article is an open access article distributed under the terms and conditions of the Creative Commons Attribution (CC BY) license (https://creativecommons.org/licenses/by/4.0/).