Abstract
Ergonomic assessment and validation are important in designing sustainable forest operations. Measurement and grading play a central role in the wood supply chain and updated solutions have started to emerge for such activities. Procuring biometric data by mobile scanning platforms has been shown to have a high potential in replacing traditional wood measurement methods, but no assessments were carried out to see if these solutions are sustainable from an ergonomics point of view. Based on more than 63 k still images, this study evaluates the working postures of three measurement options, namely, traditional measurement, scanning by a smartphone, and scanning by a commercial laser scanner. The OWAS method was used as an assessment framework to compute the postural risk indexes. A correspondence analysis was implemented to explore the association between the studied work tasks and severity of exposure, and the postural similarity of tasks was evaluated by the Canberra metric. The use of digital measurement solutions seems to be better from a postural point of view since their risk indexes were well below 200. In contrast, traditional wood measurement tasks produced postural risk indexes that were close to 250. By considering the body components, digital measurement solutions seemed to indicate a distinct postural profile. Moreover, the digital solutions stood well apart in the range of the first two action categories, indicating no urgent need for postural improvement, which was not the case for manual measurements. The main conclusion of the study is that state-of-the-art digital solutions are better from a postural point of view. For full validation, population-level studies should be carried out.
Keywords:
wood supply chain; ergonomics; digitalization; wood measurement; sorting; scanning; postural analysis; risk 1. Introduction
Wood measurement and grading are essential activities in the wood supply chain, mainly because they provide quantitative and qualitative information for commercial transactions [1,2]. In addition, they support other relevant processes such as the conformity checking and traceability of wood products [3,4], being practiced in several points along the supply chain, which include the forest, roadside, and the sawmill’s gate. Traditionally, wood measurement and grading have been conducted by manual means which require the use of forestry calipers and tapes, while the development and implementation of new wood measurement means depend on the level of available technology, standards used at the country or regional scales, and local forestry practices [5,6,7].
Still, in many regions of the world the wood is manually measured, an approach which may suppose a considerable effort in handling the required equipment, as well as poorer ergonomic conditions in terms of postures taken by the workers. Although there is no available data to characterize the postures taken in manual measurement of the wood, several studies have found that operations characterized by a low mechanization degree are challenging from this point of view [8,9,10,11,12]. In addition, wood measurement should benefit from updates in technology, whose implementation is now seen as an important component of ergonomic sustainability in forest operations [13,14]. However, the introduction of new technology itself in operations seems to be challenging [14] and needs ergonomic assessment and validation with the aim of checking whether it will provide at least a similar if not a better work environment.
A promising alternative to manual measurement is the use of platforms which operate by proximal remote sensing in collecting the data required to characterize the biometry of logs. On the one hand, this is because the use of such platforms was found to provide accurate data [4,15], while enabling other functions which are important in the wood supply chain [3,4]. On the other hand, their use was found to be comparable in terms of resources spent with that of manual measurement, while being able to provide an important economy of scale in terms of resources used [3]. Altogether, these features could contribute not only to their reliability and responsivity but also to their cost effectiveness.
There are many methods that could be used in the postural assessment, of which the observation-based assessments were described to be versatile in providing the basis needed for establishing priorities for intervention [16]. One of them is the Ovako Working posture Assessment System (OWAS) method, which holds the ability to measure deviation from normal (natural) body postures, being relatively simple to use, and having the capability of evaluating the whole body [17,18]. The method can be characterized as being flexible since the data collected by its use supports intra- and inter-task comparisons, either by implementing statistical tests [8,10] or by using similarity metrics [19]. In turn, such comparisons are helpful in understanding the changes brought by a new way of carrying out work, as compared with the way in which it is currently conducted. In addition, the method supports the calculation of a postural risk index (PRI), which is based on the frequency of observations in four action categories [20], providing the means for deciding the most appropriate actions to be taken for postural improvement. Similar to other postural assessment methods, OWAS was designed to characterize the risk of exposure to musculoskeletal disorders [16], serving as an important tool for distinguishing between the potential hazards brought by various types of tasks or ways of doing work.
The literature on forest operations is relatively abundant in ergonomic assessments by considering various types of exposure, and an important share of them are implemented as postural evaluations [21]. However, to the best of our knowledge, wood measurement was not evaluated by dedicated studies, even though such operations may expose the workers to risks, given the way in which they are implemented. For instance, when the logs are located on the ground, manual measurements could suppose a frequent bending of the back because they require a direct contact between the instruments used in measurement and the logs. In contrast, scanning by mobile, proximal-sensing platforms excludes the necessity of a direct contact; however, the use of some platforms may require uncomfortable postures to cover the logs by scanning when directing the sensing devices towards the place at which they meet the ground. Last, but not least, the exposure to potentially harmful working postures may depend to a certain extent on the behavior of the workers.
To document the efficacity of proximal-sensing platforms in wood measurement, a project [22] has been implemented since 2021. A core component of the project is the evaluation of postural conditions in such activities. Although this study documents the postural condition in wood measurement of both manual and proximal sensing methods, the main goal is to check if the latter meet the postural sustainability criteria in terms of risks. The objectives of the study are to (i) characterize the postures of the main body parts, (ii) characterize the association between the relevant measurement tasks and their postural condition, and (iii) check the postural similarity between the manual and proximal-sensing wood measurement methods.
2. Materials and Methods
2.1. Study Location and Measurement Instrumentation
The field phase of the study accounted for a total of 5 days, and it was implemented between 7 to 10, and 13 July 2021, in a wood storage facility located in Firiza (47°42′58.28″ N—23°37′05″ E, 325 m a.s.l.), which is managed by the Regional Forest Directorate of Maramureş, a branch of the National Forest Administration—RNP Romsilva. The facility is used to store the broadleaved and coniferous wood harvested from the surrounding forests until selling it to the final customers. During the field phase of the study, each log was measured three times, once manually, a second time by using a professional laser scanner, and finally by scanning by a smartphone (Figure 1). Prior to implementing the measurement activities, groups were formed from broadleaved logs placed at distances of 1 to 1.5 m from each other. The logs were selected so as to reflect the variability in length, which was between approximately 4 and 12 m.
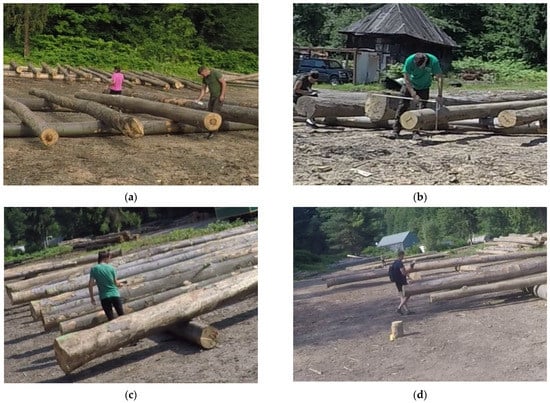
Figure 1.
Examples from the operations taken into study: (a) log marking; (b) manual measurement; (c) scanning by a smartphone; and (d) scanning by a professional platform.
Manual measurement was designed to take the diameters of the logs at a 0.5 m interval, as well as to measure their lengths and mid-diameters. It was carried out in two steps, firstly by marking the logs by spraying, which required the use of a forestry tape, and then by measuring their diameters with a caliper. Diameter and length data were noted on a field book. The choice of this marking and measurement procedure was based on the methods of the Hypercube 4.0 project [22], which aimed at comparing the results of the three measurement options in terms of accuracy; the manual measurements were taken at the log level.
A second measurement was taken by a mobile laser scanner (Zeb Revo, GeoSLAM, https://geoslam.com/; accessed on 10 September 2022) which supports the simultaneous localization and mapping (SLAM) technology. The instrument is typically carried in a backpack, and the scanning sensor is integrated in an external device which is handled by the operator during scanning. Using this instrument, the measurements were taken by a movement that started and ended at the same location, which aimed at surrounding the groups of logs by scanning. The third measurement was taken by a smartphone (Huawei P40 Pro, Huawei, Shenzhen, China) running a copy of the Forest Design (https://forestdesign.ro/index.php/ro/; accessed on 10 September 2022) Scanner application (FD Scanner) which was designed for wood scanning applications. More detailed descriptions of the platforms, as well as of the software used can be found in [3].
2.2. Data Collection
The data needed for this study were collected externally, in the form of high-resolution video files by a GoPro Hero 5 (GoPro Inc., San Mateo, CA, USA, https://gopro.com/en/us/, accessed on 10 September 2022) video camera which was successively placed at locations from where all the measurement activities were framed in its field of view. To extend its battery life, the device was connected to an external power source and it was set to collect video files of ca. 18 min each, in a continuous mode. A number of 37 video files were collected accounting for a total duration of approximately 9.5 h, and they were initially stored on a memory card, then downloaded and ordered into a computer at the end of each observation day. Three researchers of the Hypercube 4.0 project carried all the measurement tasks and were considered the subjects (S1–S3) of the study.
2.3. Data Processing
The collected video files were used to extract still images at a rate of one second using the software Free Video to JPG Converter (DVD Video Soft Ver. 5.0.101.201, Roseau, Dominica), then each image was analyzed one to three times depending on the subject identified in the field of view, resulting in a number of 66,638 still images taken into analysis. These images were analyzed at a detailed task level according to the OWAS method. This was done by tracking and recording the tasks by codes as shown in Table 1, then the codes were given to the main body parts according to the method [17,18,23]. The images that failed to provide the necessary data for evaluating the posture of all the body parts were excluded from analysis, and the force exertion was coded in all cases by 1 (Table 2, F1), given the specificity of tasks taken into study.

Table 1.
Description of the main observed tasks following the OWAS analysis.
Table 2.
The OWAS framework used to attribute postural codes to the main body parts.
After the exclusion of the non-useful images, the dataset used to achieve the objectives of the study contained a number of 63,744 images. Following their analysis, it was identified that scanning by the mobile laser scanner (MS) was done only by S1, while marking the logs by paint (LM) was done by S1 and S2. Manual measurement of the diameters (MM), moving (MV), delays (DE), and preparing the tasks (PR) were identified for all subjects, while scanning by the smartphone (PS) and writing the data (WR) were identified only for subjects S2 and S3.
The coded data were stored in a Microsoft Excel ® (Microsoft, Redmond, WA, USA, 2013 version) sheet by considering the dates of field observation, name of the subjects, image number (assimilated to the second of extraction from the movie files), task codes (Table 1), codes attributed to body parts (Table 2), as well as codes of the action categories as described by the used method. The codes given to action categories were computed automatically by running a procedure developed in Visual Basic for Applications ® (Microsoft, Redmond, WA, USA). More detailed descriptions of the OWAS method, as well as information on its implementation, may be found in [17,18,20,23,24].
To support the statistical analysis, the data were sorted on the main tasks, then two contingency tables were developed to characterize the frequency of data at the task level by considering the codes given for the postures of the body parts, as well as the codes computed for the action categories. Data sorted on tasks served for estimating the relative frequencies of the body parts postures, relative frequencies on action categories, and for the computation of postural risk indexes as described in [20]. Contingency tables served as inputs for the correspondence analysis, and for checking inter-task similarity.
2.4. Data Analysis and Software Used
Data analysis was implemented in four steps. A first step was that of estimating the relative frequency distributions on body part postural codes, which was based on their absolute frequencies and the number of valid observations used for each task. The relative frequency distributions were developed to characterize the differences in terms of body part postures between the observed tasks. A similar approach was taken to compute the relative frequencies on action categories which were then used to compute the postural risk indexes (PRIs) of the observed tasks, standing for the second analytical step.
Dependencies in postural, action category data, and observed tasks were mapped in a dimensionality reduction approach by implementing a correspondence analysis (CA), which was the third analytical step of this study. Correspondence analysis is similar in function to principal component analysis (PCA) but fits better to categorical data. Mapping the variability in a lower number of dimensions by CA is helpful in understanding the trends in data and in observing the associations of the data profiles, which is typically evaluated by a χ2 test for independence. The worked example given in [25] as well as the explanations given in [26,27] were used to run the correspondence analysis in Microsoft Excel ® under the Real Statistics add-in in the software [28]. Frequency data on postures of the body parts (14, column profiles) mapped against the observed tasks (8, row profiles) formed a contingency table with a dimensionality of 14 × 8, while the frequency of data on action categories (4, column profiles) coupled with that of the observed tasks (8, row profiles) formed a contingency table with a dimensionality of 4 × 8. The aim of CA was to understand which body part postures and which action categories associate more frequently with the observed tasks, hence to characterize the tasks in terms of body postures and action categories, assuming that there would be a difference between them, by lowering the number of dimensions and still preserving a high proportion in variability explained. In CA, choosing the number of dimensions is usually based on the inertia and explained variance.
The last analytical step of the study was that of pairwise checking the similarity of tasks, which was implemented by considering the absolute frequencies of action categories on the observed tasks. For this step, the Canberra metric was used as a measure of dissimilarity (1 − CM stands for the similarity metric). The procedural steps, advantages, and limitations of using similarity metrics in comparing the body postures in the framework of the OWAS method are given elsewhere [19], from where the main methods used for similarity checking were adapted. Definition and mathematical formulation of the Canberra metric may be found, for instance, in [29,30].
3. Results
3.1. Statistics of the Postural Data
Table 3 shows the relative frequencies in terms of postures of the body parts by considering the 8 observed tasks. For example, MV and DE tasks were characterized by the highest shares of the back kept straight. PS, MM, LM, and MS, had the worst condition in terms of back posture, with a dominance of B4 code, meaning that the back was bent and twisted, or bent forward and sideways. In terms of arm postures, the worst condition was that of tasks MM and PR (both arms above the shoulder level), while the L7 code (walking or moving) characterized mainly the MS (96.5%) which involved moving around the logs, MV, where the difference of up to 100% was due to small stops which were not accounted separately, and PS, which was a task supposing an important share of walking.
Table 3.
Share of body postures on tasks.
By the design of the manual measurement tasks, LM and MM accounted for shares of leg movement of approximately 58% and 44%, respectively, characterizing different paces of carrying them on. Obviously, MM was done at a lower moving pace than LM, which explains the shares in data on code L7. Although some of the data on postural shares indicate rather concerning results for the use of mobile platforms, it is a fact that action categories, which characterize the urgency of interventions, may take completely different proportions based on key associations between the postures of the body parts.
3.2. Action Categories and Postural Risk Indexes
Having in mind the shares of body part postures on tasks, Figure 2 shows the relative shares of action categories at the task level, as well as the estimated postural risk indexes. As shown, LM and MM stand apart by the frequency of action categories, having a dominance in the second action category, as well as an important presence in the fourth action category.
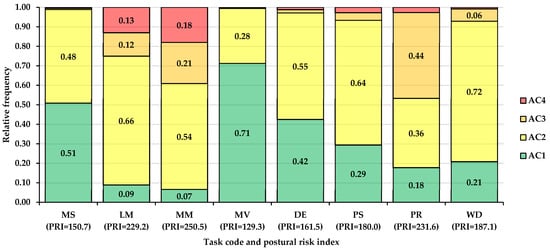
Figure 2.
Share of action categories on tasks and postural risk indexes. Legend: MS—scanning by the mobile laser scanner; LM—marking the logs by paint; MM—measuring manually the diameters; MV—moving; DE—delays; PS—scanning by the smartphone; PR—preparing the tasks; WD—writing data on a field book; AC1—first action category, no corrective actions needed; AC2—second action category, corrective actions needed in the near future; AC3—third action category, corrective actions needed as soon as possible; and AC4—fourth action category, corrective actions needed immediately. Sources: [17,18,23].
Movement was the task which yielded the best postural condition, where the share of the first action category dominated (71%). From this point of view, second in line was MS (51%), followed by DE (42%) and PS (29%). Presence of an important share of the third action category in PR (44%) was due to movements which involved some degree of back bending associated with standing or squatting with the knees bent. MS returned a better postural condition as compared with PS, which was expected since the latter required a higher degree of back bending associated with the knees bent to reach during scanning of the bottom parts of the logs.
The postural risk indexes calculated for the main tasks indicate the trends described above, placing the manual measurement in the worst condition (PRI = 250.5), followed by log marking (PRI = 229.2), phone scanning (PRI = 180.0), and scanning by the mobile laser scanner (PRI = 150.7). By action categories, these would mean that log measurement would require corrective actions as soon as possible, phone scanning would require corrective measures in the near future, while scanning by the mobile laser scanner was at the border of the first and second action category.
3.3. Association between Body Segments’ Postures, Action Categories, and Tasks
The main results of the correspondence analysis are shown in Figure 3, including the developed biplots, variation in eigen values, and in the explained variance as a function of the number of dimensions. As a rule of thumb, the number of dimensions explaining at least 50% of variance can be accepted to characterize the data dependencies in a lower dimensional space [26]. The association between the postures of the body parts and the observed tasks is described in Figure 3a. As shown, by accepting a bidimensional representation, the proportion of the explained variance was close to 80% (Figure 3b, bottom panel); therefore, the representation from Figure 3a preserves most of the variance in the sample. Interpretation of dependencies among the data may be carried out by projecting perpendiculars from the data points on a line crossing the center of origin from a given observed task, in which the location of a data point (i.e., posture) to the same part relative to the origin indicates its frequency in a task relative to the sample’s average, whereas the distance from the plot’s origin to a given intersection characterizes the size of the posture’s frequency [28]. As an example, MM was characterized by higher frequencies of the A3 (both arms at or above the shoulder level) and A2 (one arm at or above the shoulder level) than on the average at the sample level. Conversely, A1 (both arms below shoulder level) was less frequent in MM than on the average in the sample. Similar interpretations apply to the postures of the back. In MM, B4 (back bent or twisted or bent forward and sideways) and B3 (back twisted or bent sideways) were more frequent than B2 (back bent forward or backward) and B1 (back straight) in comparison with the sample’s average. Excepting L1 (sitting), all the postures of the legs were more frequent in MM than on average.
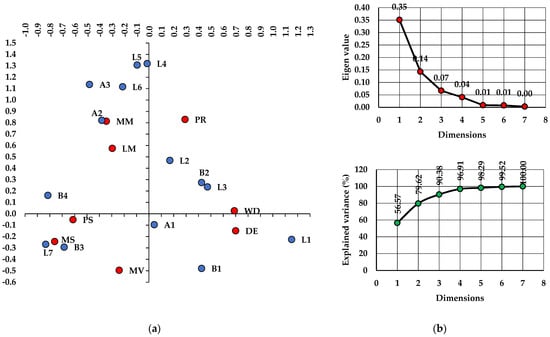
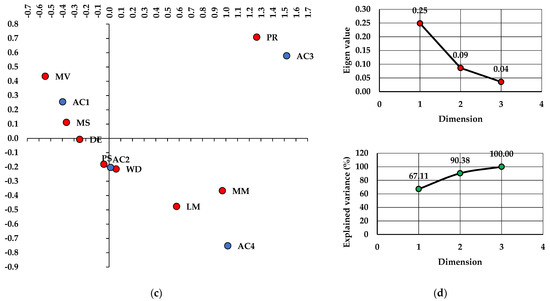
Figure 3.
Results of the correspondence analysis showing the trends in data dependencies: (a) biplot of body postures and tasks; (b) eigen values and the proportion of explained variance as a function of the number of dimensions characterizing the data from (a); (c) biplot of action categories and tasks; (d) eigen values and the proportion of explained variance as a function of the number of dimensions characterizing the data from (c). Legend: B1—back straight; B2—back bent forward or backward; B3—back twisted or bent sideways; B4—back bent and twisted or back bent forward and sideways; A1—both arms below shoulder level; A2—one arm is at or above the shoulder level; A3—both arms are at or above the shoulder level; L1—sitting; L2—standing with both legs straight; L3—standing with the weight on one straight leg; L4—standing or squatting with both knees bent; L5—standing or squatting with one knee bent; L6—kneeling on one or both knees; L7—walking or moving; MS—scanning by the mobile laser scanner; LM—marking the logs by paint; MM—measuring manually the diameters; MV—moving; DE—delays; PS—scanning by the smartphone; PR—preparing the tasks; WD—writing data on a field book; AC1—first action category, no corrective actions needed; AC2—second action category, corrective actions needed in the near future; AC3—third action category, corrective actions needed as soon as possible; and AC4—fourth action category, corrective actions needed immediately. Sources: [17,18,23].
In the MS task, the most frequent postures of the arms were A1 (both arms below the shoulder level), and the least frequent were A2 (one arm at or above the shoulder level) and A3 (both arms at or above the shoulder level), in that order. For the same task (MS), the order of the frequency in back postures was B3 (back twisted or bent sideways), B4 (back bent or twisted or bent forward and sideways), B1 (back straight), and B2 (back bent forward or backward), and the order of the frequency in leg postures was L7 (walking or moving), L6 (kneeling on one or both knees), L2 (standing with both legs straight), L5 (standing or squatting with one knee bent), L3 (standing with the weight on one straight leg), and L1 (sitting). On the other hand, the PS task was characterized by frequencies higher than on the average of the sample for the arm postures A3 (both arms at or above the shoulder level) and A2 (one arm at or above the shoulder level), back postures B4 (back bent or twisted or bent forward and sideways) and B3 (back twisted or bent sideways), and leg postures L7 (walking or moving) and L6 (kneeling on one or both knees).
Considering the biplot of tasks and action categories (Figure 3c) and the explained variance (Figure 3d), the solution of representing the data in two dimensions accounted for a similar amount of explained variance (90%, Figure 3d, bottom panel). MM (Figure 3c) was characterized by a higher frequency of AC4 (corrective measures immediately), AC3 (corrective measures as soon as possible), and AC2 (corrective measures in the near future), while MS stood at the opposite side, being characterized by higher frequencies in AC1 (no corrective measures). PS seemed to be closer to the average profile of the sample (closeness to the origin) and it was characterized by a higher frequency in AC2 (corrective measures in the near future) and AC1 (no corrective measures).
3.4. Similarity of Tasks
Similarity of the observed tasks was calculated by considering their frequency in action categories based on the Canberra metric; the results are shown in Figure 4. As shown, MS was more similar (1 − CM = 0.716) to MV, which was expected since the scanning task involved movement around the groups of logs. MM was more similar (1 − CM = 0.656) to LM, which was also expected given the common specificity of the two tasks. Moreover, PS was more similar (0.761) to DE, which was not expected, but was reasonable given that the postural behavior of the observed subjects during delays was at their free will.
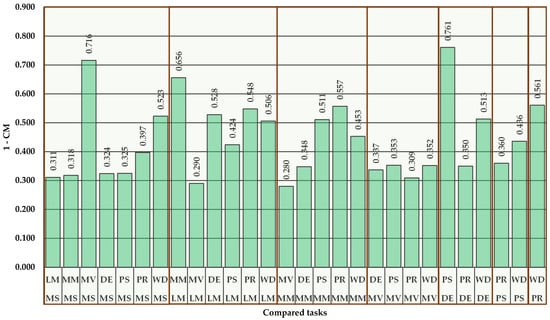
Figure 4.
Similarity of tasks by the frequency of action categories.
Last, but not least, MS was rather dissimilar to MM (1 − CM = 0.318) and PS (1 − CM = 0.325), while PS was more similar to MM (1 − CM = 0.511) but not to the same extent as the similarity between MM and LM. Form this point of view, at least scanning by a mobile scanner stood well apart from manual measurement tasks in terms of similarity. Moreover, it is worth to note that writing data on the field book following manual measurement of diameters was more similar to the preparation task (1 − CM = 0.561), as well as, in general, the tasks not supported by mobile platforms tended to be more similar among each other.
4. Discussion
Implementing effective ways of doing work in forest operations is important for both industry’s competitiveness and for the creation of safer work environments in terms of exposure to harmful factors. In wood measurement applications, the use of state-of-the-art data collectors does not bring important burdens from an ergonomic–postural point of view, as proved by the results of this study. In fact, by the use of OWAS method, conventional measurements yielded a worse postural condition as compared with the tasks of scanning by a mobile laser scanner and a smartphone, respectively. This outcome was associated to the specific postural combinations of the body parts in the analyzed tasks, which ultimately reflect the urgency of measures to be taken. As such, log marking and manual measurement could require measures to be taken as soon as possible; however, these tasks yielded results which were associated to the design of the study aiming to compare the efficacity by several key performance indicators, including the time consumption and accuracy of mobile platforms [3,22]. In a real-world scenario, it would be less likely for the measurements by a caliper to repeat at the same frequency, since the measurements are typically based on sampling diameters at the middle or at the ends of the logs [31]. Therefore, the postural condition of manual measurements, as found in this study, are only indicative and stand for a close to maximal exposure in terms of postural risks. Still, compared with scanning, manual measurements will require a more frequent bending of the back which could be associated with uncomfortable postures of the legs and of the arms, resulting in important shares of the fourth action category.
A differentiation of the tasks specific to mobile scanning was found as compared with the manual measurement tasks by the use of correspondence analysis and of the Canberra metric. For instance, scanning by the mobile laser scanning was more similar to regular movement and more frequent in the first action category, requiring no corrective measures. In fact, manual measurement had less in common with both scanning by a mobile laser scanning and by a smartphone, which indicates that the latter tasks are distinctly configured in terms of biomechanical exposure as compared with conventional measurement. Largely, these differences came from the frequency of movement events which was higher in mobile-based wood measurement tasks.
Postural risk indexes are aggregated metrics which were commonly used to characterize a given type of job or work task, as well as to compare among jobs and tasks [8,9,10,11,12,20,24,32], reflecting the weighted share that action categories hold in a sample taken into study. Scanning by a mobile laser scanner and by a smartphone, respectively, yielded postural risk indexes that indicate general postural conditions located in between no corrective measures and corrective measures needed in the near future, respectively; therefore, the postural condition of these tasks does not indicate high risks of exposure to musculoskeletal disorders. For instance, other traditional forestry and wood processing jobs were characterized by similar to higher postural risk indexes [8,9,10,12,20,24,32]; ultimately, the postural risk indexes are related to the specificity of jobs which, in turn, are characterized by the inter-relation between the worker, work object (its mass characteristics and locations taken in the work environment), and the technology used in the work. Therefore, the manual jobs that require handling of work objects or of tools which make a direct contact with the work objects, may be more prone to higher risks as opposed to those using mechanization or automation. This was the case of this study because the platforms used did not require a direct contact for measurement.
Postural diversity and posture changes have been identified to be important challenges in characterizing the biomechanical exposure [33] and in getting postural profiles to characterize the diversity in biomechanical exposure of different jobs [19]. Ideally, the OWAS method should use very fine, systematically obtained samples, to arrive at results which are close to reality [34], although random sampling may perform similarly when a sufficient sample size is considered [35], an approach that has been taken by similar studies [8,10]. Although this study attempted to build the sample at a rate of one second, due to some occlusions, some data were lost; therefore, the real sequence of events may have been interrupted in some cases. However, the study builds on a high number of observations which, in our opinion, adjusts the outcomes to the real sequence of events. In addition, it characterizes the dependencies in postural exposure at task level and maps the similarity of tasks based on the identified levels of exposure.
Characterizing the biomechanical exposure based on population-level data is essential to getting a broader picture which also reflects the variability in anthropometry, work habits, and personal techniques of carrying out a job. Unfortunately, the scanning tasks taken into study are in their infantile stage in the industry; therefore, getting population-level data would be possible once they replace or complement the conventional measurement operations. Still, prototyping is among the first steps taken to develop or study new technologies, products, or work methods, which can provide important information before full scale deployment, which was the case of this study. As there is some body of knowledge which indicates less association between the exposure and development of musculoskeletal disorders, i.e., [36], the results of postural analysis may be interpreted as mapping the biomechanical exposure in terms of risks. Still, there is a big chance for a given individual to develop musculoskeletal disorders as a consequence of improper postures [23], a reason for which the postural risk assessment may provide important information for prevention.
There are several other approaches to the problem of postural condition in forest or related industries [11,37,38] workers. Acknowledging that there might be several studies on the topic, the main aim of postural analysis in forestry work was to check the postural condition in different jobs and tasks or to compare between alternatives. These main goals are supported by the studies referenced so far in this paper [8,9,10,12,20,24,32], as well as by other studies on the topic [39,40,41,42]. Few forestry-related studies have been published on the concepts, methods, and sampling approaches in postural assessment [18,19,20,35,43], although there are examples adapting state-of-the-art technology to existing postural assessment methods [44]. This study could complement the procedural approach by using new statistical techniques able to detect association or dependencies in categorical data, which is typical to some postural assessment methods.
Limitations of this study are important to understand the applicability of its results. First of all, due to the infancy of the studied tasks, it was not possible to use a greater pool of subjects. Largely, this comes from the fact that a given subject should have some experience in scanning tasks so as to replicate the movements and body postures required to complete the job. As an example, the phone-based scanning requires eye interaction with the display to check the scanning quality in real time. If the application would indicate that some log parts were unsuitably covered by scanning, the subject would have to adjust their movements to correct such an issue. Therefore, using subjects with no experience just to mimic the scanning operations, without concerns on data coverage and quality, would have deformed the postural profile of the job, probably indicating a better condition. A second limitation may be that of the postural method used for evaluation. Largely, this method is used for the evaluation of static work [16], being less sensitive to magnitudes in movement (i.e., it uses categories). This is a limitation brought by its observational character which, for instance, makes no difference between a back bent at 20° or 40°; obviously, the burden posed by the two postures will differ. Somehow, this limitation may be compensated by the variation in posture magnitudes as observed in this study, in which back bending covered a wide range of angles at least in manual measurement of diameters, log marking, and scanning by phone. This was possible due to a relatively systematic sampling approach taken in this study at a rate of one second. On the other hand, the approach taken in this study was that of evaluating static instances extracted systematically from the real sequence of tasks. From this point of view, the results also characterize the dynamics of postures in the studied tasks.
5. Conclusions
Updated technology is required in many forestry applications, including wood measurement. Although such technology is already available, its use in wood measurement activities is still in an infantile stage, being implemented mostly as occasional tests to prove its effectiveness. For these reasons, ergonomic assessments are required to validate its sustainability in use, assuming a full or complementary scale deployment. When used in wood measurement applications, mobile scanning platforms do not bring significant risks in terms of biomechanical exposure. In fact, such measurement tasks seem to be characterized by a different postural profile, which balances the share of difficult postures by adding a higher degree of movement; in turn, it eases these tasks from a postural exposure point of view. Further studies could validate the results reported herein by considering a population-level approach with which to include the potential variability brought by other factors.
Author Contributions
Conceptualization, S.A.B.; methodology, S.A.B.; software, S.A.B. and M.V.M.; validation, S.A.B. and M.V.M.; formal analysis, M.V.M.; investigation, S.A.B. and M.V.M.; resources, S.A.B., M.V.M. and A.R.P.; data curation, S.A.B.; writing—original draft preparation, S.A.B., M.V.M. and J.B.; writing—review and editing, S.A.B. and S.F.P.; visualization, S.A.B., M.V.M. and A.R.P.; supervision, S.A.B. and A.R.P.; project administration, S.A.B., J.B. and A.R.P.; and funding acquisition, S.A.B. and S.F.P. All authors have read and agreed to the published version of the manuscript.
Funding
This work was supported by a grant of the Romanian Ministry of Education and Research, CNCS-UEFISCDI, project number PN-III-P4-ID-PCE-2020-0401, within PNCDI III. An objective of the Hypercube 4.0 project is to carry out ergonomic postural evaluations of the wood measurement activities by traditional methods and sensor-based platforms. Some activities of this study were funded by the inter-institutional agreement between Transilvania University of Braşov (Romania) and the Mediterranean University of Reggio Calabria (Italy).
Institutional Review Board Statement
Not applicable.
Informed Consent Statement
Not applicable.
Acknowledgments
The authors would like to thank to the Department of Forest Engineering, Forest Management Planning and Terrestrial Measurements, Faculty of Silviculture and Forest Engineering, Transilvania University of Brasov, for providing some of the infrastructure used in this work. Moreover, the authors would like to thank to the National Forest Administration and the Regional Forest Directorate of Maramureş for logistically supporting this work. We are grateful to eng. Jenny Magaly Morocho Toaza for her help in data analysis.
Conflicts of Interest
The authors declare no conflict of interest.
References
- Oprea, I. Tehnologia Exploatării Lemnului; Transilvania University Press: Braşov, Romania, 2008; pp. 244–246. [Google Scholar]
- Oprea, I.; Borz, S.A. Organizarea Şantierului de Exploatare; Transilvania University Press: Brasov, Romania, 2007; pp. 11–13. [Google Scholar]
- Borz, S.A.; Proto, A.R. Application and accuracy of smart technologies for measurements of roundwood: Evaluation of time consumption and efficiency. Comput. Electron. Agric. 2022, 197, 106990. [Google Scholar] [CrossRef]
- de Miguel-Díez, F.; Reder, S.; Wallor, E.; Bahr, H.; Blasko, L.; Mund, J.-P.; Cremer, T. Further application of using a personal laser scanner and simultaneous localization and mapping technology to estimate log’s volume and its comparison with traditional methods. Int. J. Appl. Earth Obs. Geoinf. 2022, 109, 102779. [Google Scholar] [CrossRef]
- Müller, F.; Jaeger, D.; Hanewinkel, M. Digitization in wood supply—A review of how Industry 4.0 will change the forest value chain. Comput. Electron. Agric. 2019, 162, 206–218. [Google Scholar] [CrossRef]
- Kemmerer, J.; Labelle, E.R. Using harvester data from on-board computers: A review of key findings, opportunities and challenges. Eur. J. For. Res. 2021, 140, 206–218. [Google Scholar] [CrossRef]
- Hartsch, F.; Kemmerer, J.; Labelle, E.R.; Jaeger, D.; Wagner, T. Integration of harvester production data in German wood supply chains: Legal, social and economic requirements. Forests 2021, 12, 460. [Google Scholar] [CrossRef]
- Spinelli, R.; Aminti, G.; de Francesco, F. Postural risk assessment of mechanised firewood processing. Ergonomics 2017, 60, 375–383. [Google Scholar] [CrossRef]
- Cheţa, M.; Marcu, M.V.; Borz, S.A. Workload, exposure to noise, and risk of musculoskeletal disorders: A case study of motor-manual tree felling and processing in poplar clear cuts. Forests 2018, 9, 300. [Google Scholar] [CrossRef]
- Spinelli, R.; Aminti, G.; Magagnotti, N.; De Francesco, F. Postural risk assessment of small-scale debarkers for wooden post production. Forests 2018, 9, 111. [Google Scholar] [CrossRef]
- Borz, S.A.; Talagai, N.; Cheţa, M.; Chiriloiu, D.; Gavilanes Montoya, A.V.; Castillo Vizuete, D.D.; Marcu, M.V. Physical strain, exposure to noise and postural assessment in motor-manual felling of willow short rotation coppice: Results of a preliminary study. Croat. J. For. Eng. 2019, 40, 377–388. [Google Scholar] [CrossRef]
- Marogel-Popa, T.; Marcu, M.V.; Borz, S.A. Postural risk in manual planting operations of poplar: Two options compared. Sustainability 2020, 12, 5531. [Google Scholar] [CrossRef]
- Marchi, E.; Chung, W.; Visser, R.; Abbas, D.; Nordfjell, T.; Mederski, P.S.; McEwan, A.; Brink, M.; Laschi, A. Sustainable forest operations (SFO): A new paradigm in a changing world and climate. Sci. Total Environ. 2018, 634, 1385–1397. [Google Scholar] [CrossRef] [PubMed]
- Heinimann, H.R. Forest operations engineering and management—The ways behind and ahead of a scientific discipline. Croat. J. For. Eng. 2007, 28, 107–121. [Google Scholar]
- Borz, S.A.; Morocho Toaza, J.M.; Osei Forkuo, G.; Marcu, M.V. Potential of Measure app in estimating log biometrics: A comparison with conventional log measurement. Forests 2022, 13, 1028. [Google Scholar] [CrossRef]
- David, G.C. Ergonomic methods for assessing exposure to risk of factors for work-related musculoskeletal disorders. Occup. Med. C 2005, 55, 190–199. [Google Scholar] [CrossRef]
- Karhu, O.; Kansi, P.; Kuorinka, I. Correcting working postures in industry: A practical method for analysis. Appl. Ergon. 1977, 8, 199–201. [Google Scholar] [CrossRef] [PubMed]
- Corella Justavino, F.; Jimenez Ramirez, R.; Meza Perez, N.; Borz, S.A. The use of OWAS in forest operations postural assessment: Advantages and limitations. Bull. Tranislvania Univ. Braşov 2015, 8, 7–16. [Google Scholar]
- Borz, S.A.; Iordache, E.; Marcu, M.V. Enhancing working posture comparability in forest operations by the use of similarity metrics. Forests 2021, 12, 926. [Google Scholar] [CrossRef]
- Louhevaara, V.; Suurnäkki, T. OWAS: A Method for the Evaluation of Postural Load during Work; Institute of Occupational Health Centre for Occupational Safety: Helsinki, Finland, 1992; p. 23. [Google Scholar]
- Potočnik, I.; Poje, A. Forestry ergonomics and occupational safety in high ranking scientific journals from 2005–2016. Croat. J. For. Eng. 2017, 38, 291–310. [Google Scholar]
- Hypercube 4.0. Hypercube 4.0 Project: Moving Wood Measurement towards a New Dimension. 2021. Available online: https://sites.google.com/view/hypercube40/pagina-de-pornire (accessed on 8 September 2022).
- Helander, M. A Guide to Human Factors and Ergonomics, 2nd ed.; CRC Press: Boca Raton, FL, USA, 2006; pp. 224–255. [Google Scholar]
- Calvo, A. Musculoskeletal disorders (MSD) risks in forestry: A case study to propose an analysis method. Agric. Eng. Int. 2009, 11, 1–9. [Google Scholar]
- Bendixen, M. A practical guide to the use of correspondence analysis in marketing research. Mark. Bull. 2003, 14, 16–38. Available online: http://marketing-bulletin.massey.ac.nz/V14/MB_V14_T2_Bendixen.pdf (accessed on 9 September 2022).
- Yelland, P.M. An introduction to correspondence analysis. Math. J. 2010, 12, 1–23. [Google Scholar] [CrossRef]
- Correspondence Analysis Basic Concepts. Available online: https://www.real-statistics.com/multivariate-statistics/correspondence-analysis/correspondence-analysis-basic-concepts/ (accessed on 9 September 2022).
- Real Statistics Using Excel. Available online: https://www.real-statistics.com/ (accessed on 9 September 2022).
- Boesch, D.F. Application of Numerical Classification in Ecological Investigations of Water Pollution; EPA-600/3-77-033; Ecological Research Series; Environmental Protection Agency: Corvallis, OR, USA, 1977; p. 126.
- Huhta, V. Evaluation of different similarity indices as measures of succession in arthropod communities of the forest floor after clear-cutting. Oecologia 1979, 41, 11–23. [Google Scholar] [CrossRef] [PubMed]
- Leahu, I. Dendrometrie; Editura Didactică şi Pedagogică R.A. Press: Bucharest, Romania, 1994; 374p. [Google Scholar]
- Borz, S.A.; Oghnoum, M.; Marcu, M.V.; Lorincz, A.; Proto, A.R. Performance of small-scale sawmilling operations: A case study on time consumption, productivity and main ergonomics for a manually driven bandsaw. Forests 2021, 12, 810. [Google Scholar] [CrossRef]
- Mathiassen, S.E. Diversity and variation in biomechanical exposure: What is it, and what would we like to know? Appl. Ergon. 2006, 37, 419–427. [Google Scholar] [CrossRef] [PubMed]
- Brandl, C.; Mertens, A.; Schlick, C.M. Effect of sampling interval on the reliability of ergonomic analysis using the Ovako working posture analysis system. Int. J. Ind. Ergon. 2017, 57, 68–73. [Google Scholar] [CrossRef]
- Borz, S.A.; Castro Perez, S.N. Effect of the sampling strategy on the accuracy of postural classification: An example from motor-manual tree felling and processing. Rev. Pădurilor 2020, 135, 19–41. [Google Scholar]
- Da Costa, B.R.; Vieira, E.R. Risk factors for work-related musculoskeletal disorders: A systematic review of recent longitudinal studies. Am. J. Ind. Med. 2010, 53, 285–353. [Google Scholar] [CrossRef]
- Proto, A.R.; Zimbalatti, G. Risk Assessment of Repetitive Movements in Olive Growing: Analysis of annual exposure level assessment models with the OCRA Checklist. J. Agric. Saf. Health 2015, 21, 241–253. [Google Scholar]
- Proto, A.R.; Zimbalatti, G. Risk Assessment of Repetitive Movements in the Citrus Fruit industry. J. Agric. Saf. Health 2015, 16, 219–228. [Google Scholar] [CrossRef]
- Zanuttini, R.; Cielo, P.; Poncino, D. The OWAS method. Preliminary results for the evaluation of the risk of work-related musculo-skeletal disorders (WMSD) in the forestry sector in Italy. For. Riv. Di Selvic. Ed. Ecol. For. 2005, 2, 242–255. [Google Scholar]
- Gallo, R.; Mazzetto, R. Ergonomic analysis for the assessment of the risk of work-related musculoskeletal disorder in forestry operations. J. Agric. Eng. 2013, 44. [Google Scholar] [CrossRef]
- Tsioras, P.A.; Khooshdohbat, M.; Nikooy, M.; Naghdi, R.; Heidari, M. The Impact of Body Posture on Heart Rate Strain during Tree Felling. Int. J. Environ. Res. Public Health 2022, 19, 11198. [Google Scholar] [CrossRef] [PubMed]
- Arman, Z.; Nikkoy, M.; Tsioras, P.A.; Heidari, M.J.; Majnounian, B. Mental Workload, Occupational Fatigue and Musculoskeletal Disorders of Forestry Professionals: The Case of a Loblolly Plantation in Northern Iran. Croat. J. For. Eng. 2022, 43, 403–424. [Google Scholar] [CrossRef]
- Tsioras, P.A. Organisational Aspects of a Forest Workers’ Training System for Greece. Bulletin of the Transilvania University of Brasov. For. Wood Ind. Agric. Food Eng. 2015, 8, 57. [Google Scholar]
- Michelleti Cremasco, M.; Giustetto, A.; Caffaro, F.; Colantoni, A.; Cavallo, E.; Grigolato, S. Risk assessment for musculoskeletal disorders in forestry: A comparison between RULA and REBA in the manual feeding of a wood-chipper. Int. J. Environ. Res. Public Health 2019, 16, 793. [Google Scholar] [CrossRef] [PubMed]


Publisher’s Note: MDPI stays neutral with regard to jurisdictional claims in published maps and institutional affiliations. |
© 2022 by the authors. Licensee MDPI, Basel, Switzerland. This article is an open access article distributed under the terms and conditions of the Creative Commons Attribution (CC BY) license (https://creativecommons.org/licenses/by/4.0/).