Article

Quantitatively Computing the Influence of Vegetation Changes on Surface Discharge in the Middle-Upper Reaches of the Huaihe River, China

1
College of Resources and Environmental Sciences, Henan Agricultural University, Zhengzhou 450046, China
2
Zhengzhou Architecture Design Institute, Zhengzhou 450052, China
*
Author to whom correspondence should be addressed.
Forests 2022, 13(12), 2000; https://doi.org/10.3390/f13122000
Submission received: 20 October 2022 / Revised: 8 November 2022 / Accepted: 22 November 2022 / Published: 25 November 2022
(This article belongs to the Special Issue Modeling and Remote Sensing of Forests Ecosystem)

Abstract

:
Changes in meteorology, hydrology, and vegetation will have significant impacts on the ecological environment of a basin, and the middle-upper reach of Huaihe River (MUHR) is one of the key regions for vegetation restoration in China. However, less studies have quantitatively accounted for the contribution of vegetation changes to land surface discharge in the MUHR. To quantitatively evaluate the influence of vegetation changes on land surface discharge in the MUHR, the Bernaola–Galavan (B–G) segmentation algorithm was utilized to recognize the mutation year of the Normalized Difference Vegetation Index (NDVI) time sequence data. Next, the functional relationship between the underlying surface parameter and the NDVI was quantitatively analyzed, and an adjusted Budyko formula was constructed. Finally, the effects of vegetation changes, climate factors, and mankind activities on the surface discharge in the MUHR were computed using the adjusted Budyko formula and elastic coefficient method. The results showed the following: (1) the surface runoff and precipitation from 1982 to 2015 in the MUHR presented a falling trend, yet the NDVI and potential evaporation presented an upward trend; (2) 2004 was the mutation year of the NDVI time series data, and the underlying surface parameter showed a significant linear regression relationship with the NDVI (p < 0.05); (3) the vegetation variation played a major role in the runoff variation during the changing period (2005–2015) in the MUHR. Precipitation, potential evaporation, and human activities accounted for −0.32%, −15.11%, and 18.24% of the surface runoff variation, respectively.

1. Introduction

The formation and changes of surface discharge are mainly influenced by the underlying surface, climate factors, and mankind activities [1,2]. As a momentous component of the underlying surface, vegetation plays a role in water storage and water conservation and has significant effects on surface runoff in the basin [3,4,5,6]. Vegetation affects the changes in surface runoff through hydrological processes such as transpiration, interception, and water storage. In the past few decades, China’s vegetation coverage has shown a fluctuating upward trend driven by the joint effects of multiple elements such as climate change and human activities [7,8]. It has been found by analyzing the remote sensing vegetation index that China has become the largest contributor to global vegetation greening, with a net change in leaf area index values of 1.35 million km2 from 2000 to 2017, with a change rate of 17.8% [9].This result has a great practical meaning for agricultural irrigation and basin water resource allocation and administration processes in quantitatively estimating the impacts of vegetation change on surface discharge changes.
The middle-upper reaches of the Huaihe River (MUHR) are situated in the eastern part of China, and are key regions for vegetation restoration in China. In recent years, the vegetation coverage in the Huaihe River has shown an increasing trend [10,11,12], and the Normalized Difference Vegetation Index (NDVI) in the Huaihe River has generally shown a steady upward trend from 1999 to 2018 [13]. Under the comprehensive consequences of climate change, vegetation variation, and human activities, the discharge in the MUHR has decreased in recent decades [14,15]. Therefore, in the immediately following years, many researchers quantitatively analyzed the influence of different factors on the runoff changes in the MUHR [16,17,18,19]. Zhang et al. [13] found that the increase in NDVI of 10% resulted in an average decrease of 8.3% for the runoff in the Huang-Huai-Hai Basin. Through an SWIM (soil and water integrated model), distributed hydrological model, and statistical method, Gao et al. [20] quantitatively analyzed the coefficient of sensitivity of discharge to climate elements and computed the contribution proportion of climate elements to runoff, and concluded that the influence of climate change on the upstream discharge is mostly due to the impact of precipitation. Liu et al. [21] computed the elasticity coefficients of the runoff depth with the precipitation, potential evaporation, and underlying surface parameters based on the Budyko water and heat balance theory. They quantitatively analyzed the contributions of climate variation and human activities to the discharge changes in the MUHR and concluded that the underlying surface parameter variation is the key element leading to discharge reductions. Based on the Budyko hypothesis and differentiation formula, Ye et al. [22] explored the impacts of climate variation and human activities on the discharge characteristics at multiple timescales in the MUHR. The results proved that human activities were the main factors causing the decreased discharge. Sun et al. [23] utilized the simultaneous solution technique for multiple control factors based on a sensitivity test and the Budyko equation to separate the contributions of climate and human activities to the annual discharge changes in the Huaihe River Basin, and found that the physical mechanisms controlling the ET and discharge changes in the Huaihe River Basin have distinct spatial differences and interdecadal variations. Shi et al. [24] explored the spatial and temporal evolution of the vegetation cover in a tributary of the Huai River (Yihe) and its relationship with the surface runoff, and found that the relationship between the NDVI and surface discharge in the basin was dominated by a non-significant positive correlation. However, few studies have quantitatively analyzed the contribution rates of vegetation changes to the surface runoff changes in the MUHR.
Therefore, the aim of this research is to quantitatively calculate the impact of vegetation changes on discharge changes in the MUHR through the following four steps: (1) the change trends of the meteorological and hydrological data and NDVI data are analyzed. (2) the B–G segmentation algorithm is utilized to recognize the mutation year of the NDVI time sequence data; (3) the functional equation between the underlying surface parameter (w) and NDVI is quantified, and the modified Budyko formula is constructed; (4) the contribution ratio of the vegetation variation on the discharge variation in the MUHR is computed using the modified Budyko formula. This study contributes to further understanding the influence of vegetation variations on hydrology processes, and has a guiding significance for economic development and ecological environment governance in the MUHR.

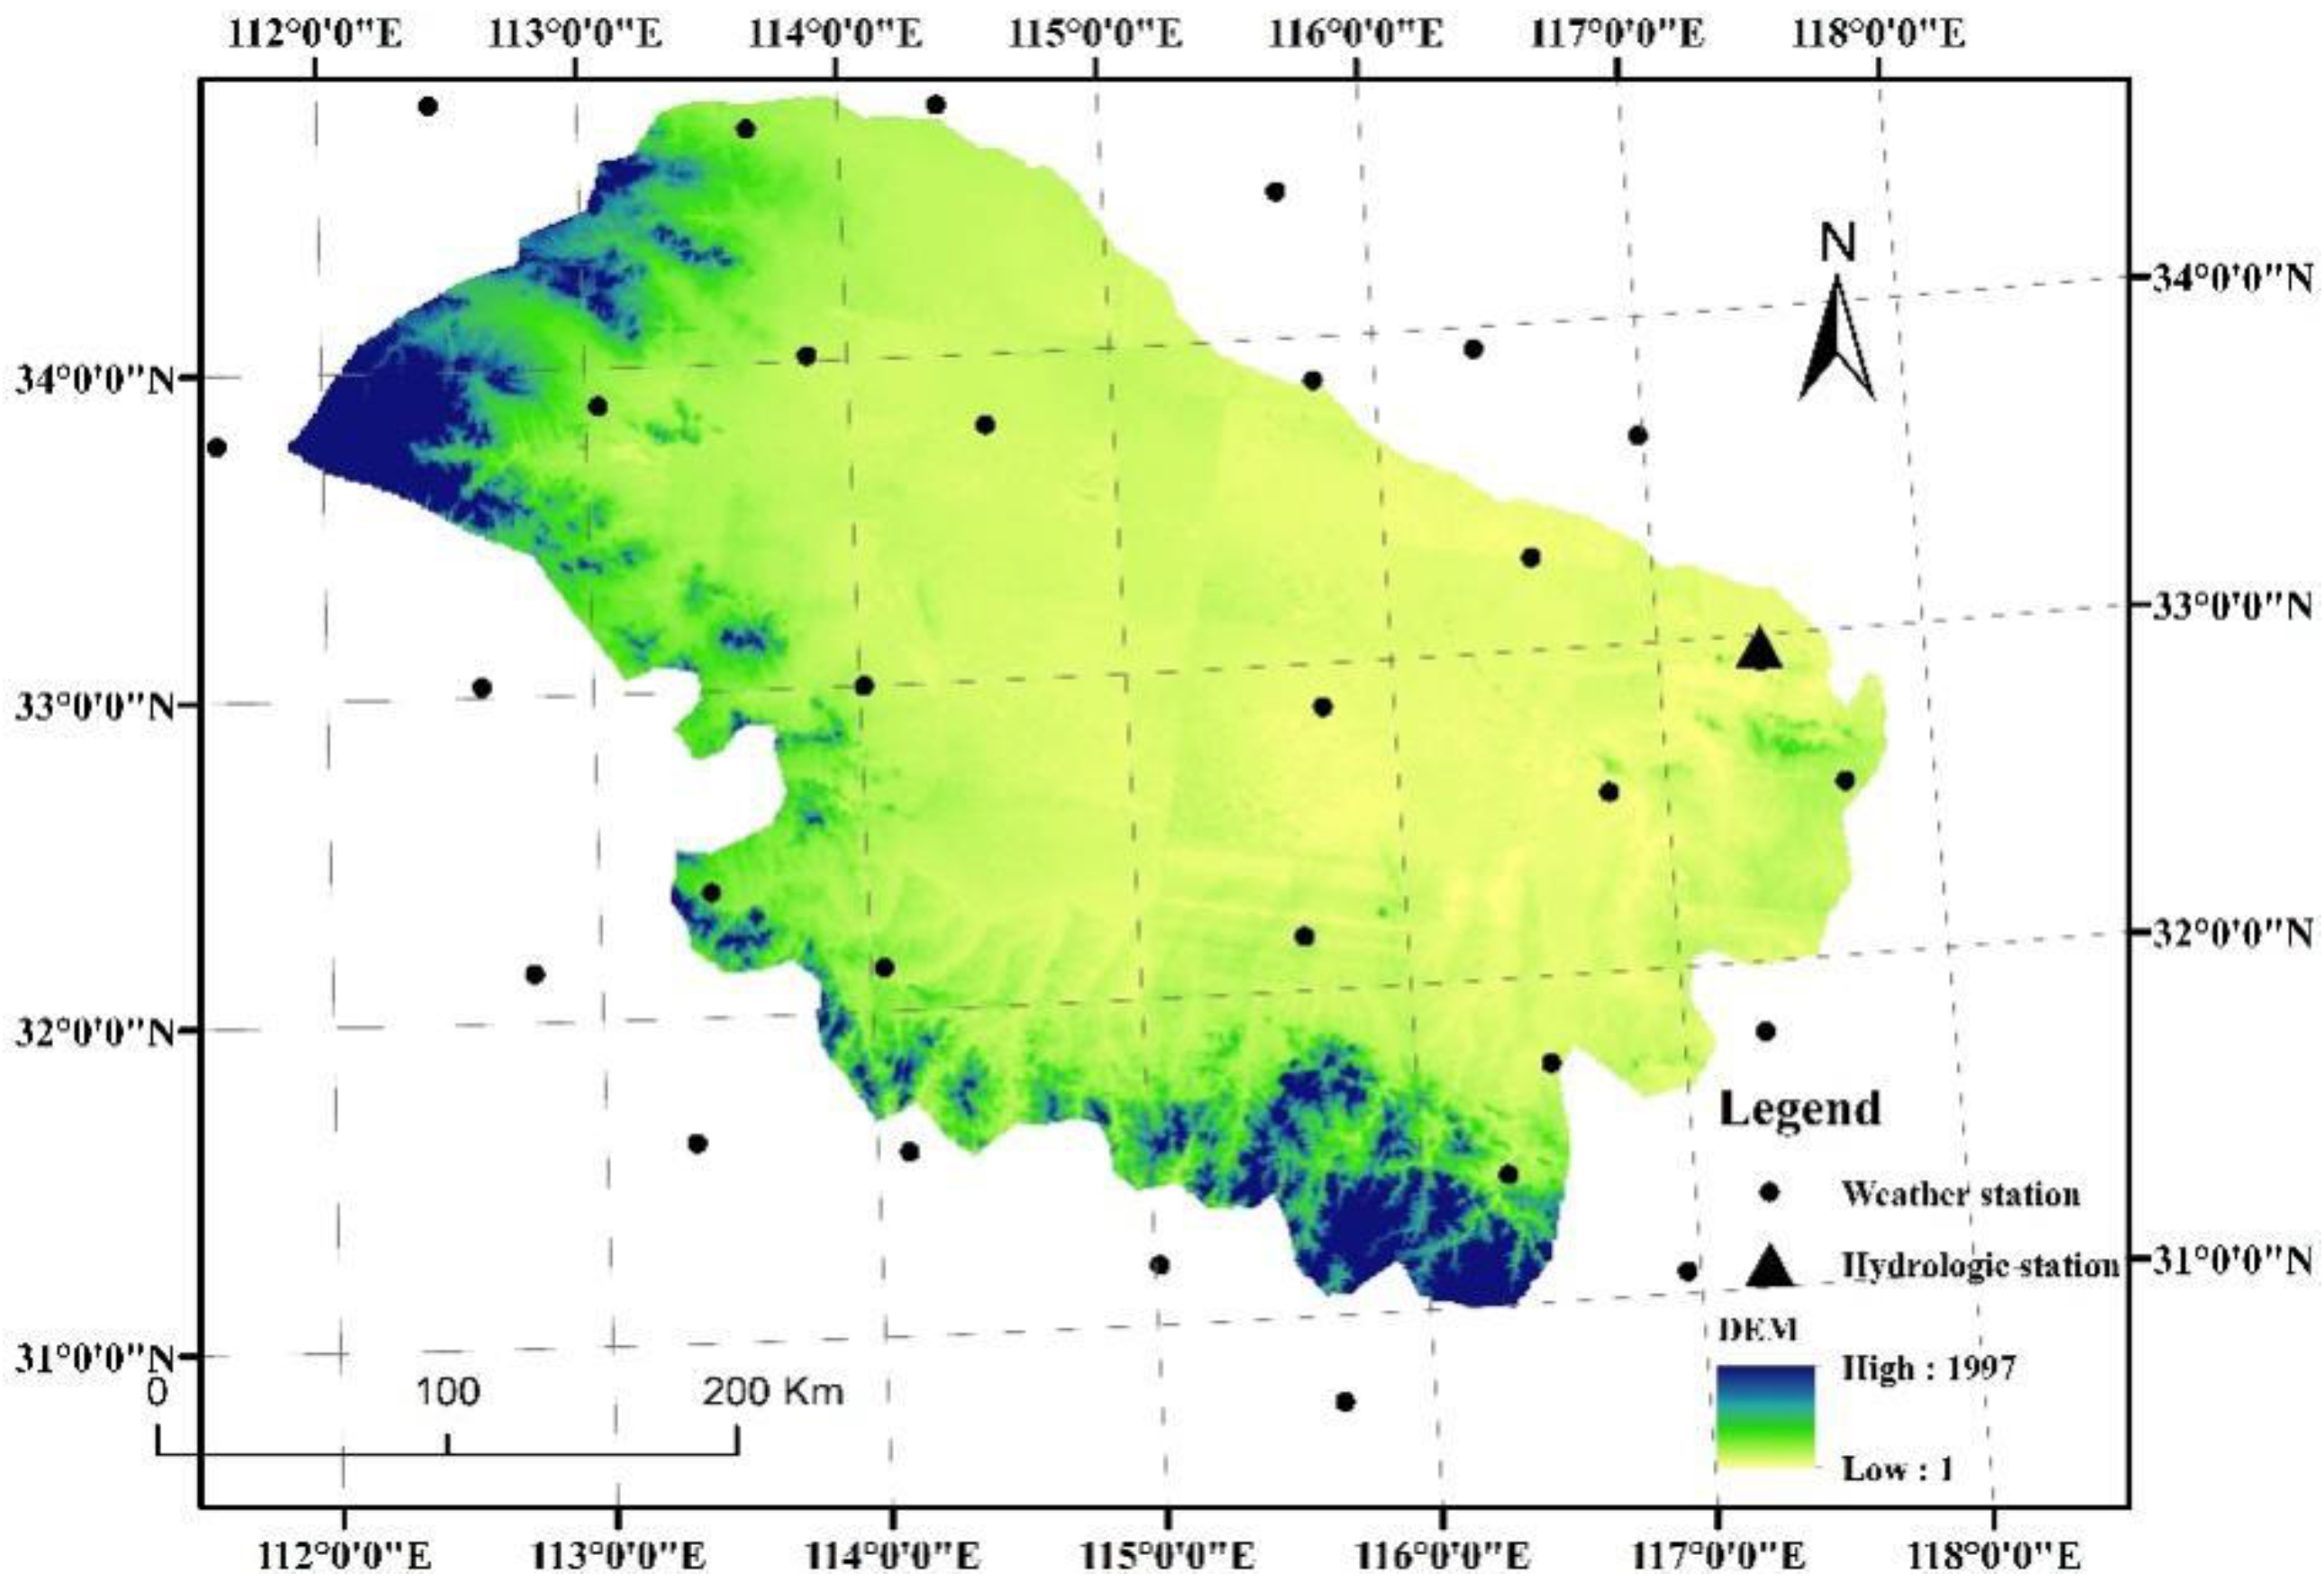
2. Study Area and Data

The middle-upper reaches of the Huaihe River (MUHR, above Wujiadu Station) are located in the natural climate boundary zone between north and south China (Figure 1), with a longitude of 111°55’–118°4’ east and a latitude of 30°55’–34°55’ north. The middle reaches contain mountains, while the upstream reaches contain hills, with most of the vegetation being deciduous broad-leaved trees. The drainage area covers 121,300 km2, occupying 40.1% of the Huaihe River Basin. The annual discharge rate from 1958 to 2016 was 266 × 108 m3, comprising 58.7% of the discharge in Huaihe River Basin, making it is a momentous runoff-producing region for the basin. Influenced by anthropic factors and climatic variation, it is very easy for flood and drought disasters to form, affecting many cities along the line.
The NDVI information for the period of 1982–2015 were obtained from the NASA NDVI dataset (https://ecocast.arc.nasa.gov/data/pub/gimms/3g.v1/) (accessed on 1 January 2021). The runoff information for the Wujiadu Hydrological Station (1982–2015) were obtained from the Huaihe River Water Conservancy Commission (http://www.hrc.gov.cn/) (accessed on 1 January 2022). The meteorological station data for the areas in and around the MUHR (1982–2015) were acquired from the National Meteorological Service (http://www.cma.gov.cn/) (accessed on 1 January 2020).

3. Methods

3.1. Bernaola–Galavan (B–G) Segmentation Algorithm

Given a segmentation point i, the time sequence dataset (X) with a number N is divided into two subsequences, X1 and X2, respectively. The mean, standard deviation, and length values of X1 and X2 are U1 and U2, S1 and S2, and N1 and N2, respectively. Therefore, the formula for calculating the combined deviation SD [25] is:
S D = S 1 2 + S 2 2 ) / ( N 1 + N 2 2 ) 1 / 2 1 / N 1 + 1 / N 2 1 / 2
A t-test was applied to measure the variability of the mean values of X1 and X2, and the calculation formula for statistic T(i) is:
T ( i ) = U 1 U 2 / S D
When the variability of the mean values of X1 and X2 reaches the maximum, the t-test statistic also reaches the maximum (Tmax), and the formula for calculating the significance probability P(Tmax) corresponding to Tmax [26] is:
P T max = P r o b T T max    
P T max 1 I v / V + T max 2 δ v , δ γ
In the formula, γ = 4.19InN − 11.54, δ = 0.40, N is the sample of the time series x(t), and v = N − 2, I x (a,b) is the incomplete β function. If P(Tmax)P0, the sequence will be segmented; If P(Tmax) < P0, it cannot be divided. The range of P0 is generally [0.5,0.95], and P0 was set to 0.84 in this study [27].
If P(Tmax)P0, one needs to calculate P(Tmax) the two new subsequences to detect all mutation points. In addition, in order to ensure the effectiveness of the statistics, if the length of the subsequence ≤ l0, the subsequence will not be segmented; l0 was set to 25 in this study [27].

3.2. Budyko Hypothesis

The Budyko hypothesis was founded based on the water balance equation:
R = P E T Δ S
In the formula, R, P, and ET represent the runoff depth, precipitation, and actual evaporation in the watershed; ΔS is the change in water storage. When analyzing long time scales, the ΔS is negligible.
On the watershed scale, the precipitation can be directly obtained through the spatial interpolation of the rainfall station observation data, and the actual evaporation rates were computed using the Choudhury–Yang equation [28,29].
E T = P × E T 0 P w + E T 0 w 1 / w
Here, w reflects the characteristic parameters of the underlying surface; its value is dependent on the soil type, terrain condition, and landcover type, and it is applied to characterize the influence of human factors. ET0 is the potential evaporation (mm), which can be computed using the Penman–Monteith formula:
E T 0 = 0.408 Δ R n G + γ 900 T + 273 U 2 e a e d Δ + γ 1 + 0.34 U 2
Combined with Formulas (5) and (6), Formula (5) can be converted:
R = P P × E T 0 P w + E T 0 w 1 / w
Li et al. [30] analyzed the functional relation between the NDVI and Budyko parameter (w) values of 26 major river basins around the world and discovered that there was a good linear functional equation between them:
w = a∗NDVI + b
Combined with Formulas (8) and (9), Formula (5) can be changed into Equation (10):
R = P P × E T 0 P a N D V I + b + E T 0 a N D V I + b 1 / ( a N D V I + b )
The elasticity coefficients of runoff to the PP), ET0ET0), ww), and NDVI (εNDVI) can be computed using Formulas (11)–(14) [31,32].
ε P = 1 + E T 0 P w 1 / w + 1 E T 0 P w + 1 1 + E T 0 P w 1 + E T 0 P w 1 / w E T 0 P
ε ET 0 = 1 1 + E T 0 P w 1 1 + E T 0 P w 1 / w
ε w = ln 1 + E T 0 P w + E T 0 P w ln 1 + E T 0 P w w 1 + E T 0 P w 1 1 + E T 0 P w 1 / w
ε N D V I = ε w a N D V I a N D V I + b
The time sequence data are assigned into two stages: the base period (T1) and the changing period (T2). Thus, the change values of the P ( Δ P ), ET0 ( Δ E T 0 ), w ( Δ w ), and NDVI ( Δ N D V I ) from T1 to T2 can be computed as follows:
Δ P = P 2 P 1
Δ E T 0 = E T 02 E T 01
Δ w = w 2 w 1
Δ N D V I = N D V I 2 N D V I 1
In the formula, P1 and P2 represent the mean precipitation in the T1 and T2 periods; ET01 and ET02 represent the mean potential evaporation in the T1 and T2 periods; w1 and w2 represent the characteristic parameters of the underlying surface in the T1 and T2 periods; and NDVI1 and NDVI2 represent the vegetation coverage in the T1 and T2 periods, respectively.
Δ R P = ε P R P × Δ P  
Δ R ET 0 = ε E T 0 R E T 0 × Δ E T 0
Δ R w = ε w R w × Δ w  
Δ R N D V I = ε N D V I R N D V I × Δ N D V I  
In the formulas, Δ R P , Δ R E T 0 , Δ R w , and Δ R N D V I respectively represent the surface runoff variation values caused by P, ET0, w, and NDVI variations from T1 to T2.
Except for climate and vegetation changes, other factors affecting runoff changes, such as water conservancy projects, domestic water use for urban residents, and agricultural irrigation water, are classified as human activities in this study. Therefore, the amount of runoff change caused by the human activities from T1 period to T2 period can be expressed as:
Δ R h u m = Δ R w Δ R N D V I
Therefore, the aggregate of the runoff variation induced by various factors is:
Δ R = Δ R P + Δ R E T 0 + Δ R N V D I + Δ R h u m
Therefore, the contribution proportion of the P ( η R p ), ET0 ( η R E T 0 ), human activities ( η R H ), and vegetation changes ( η R N D V I ) to the runoff variation in the MUHR can be computed using the following formulas:
η R P = Δ R P / Δ R × 100 %
η R E T 0 = Δ R E T 0 / Δ R × 100 %
η R N D V I = Δ R N D V I / Δ R × 100 %
η R H = Δ R h u m / Δ R × 100 %

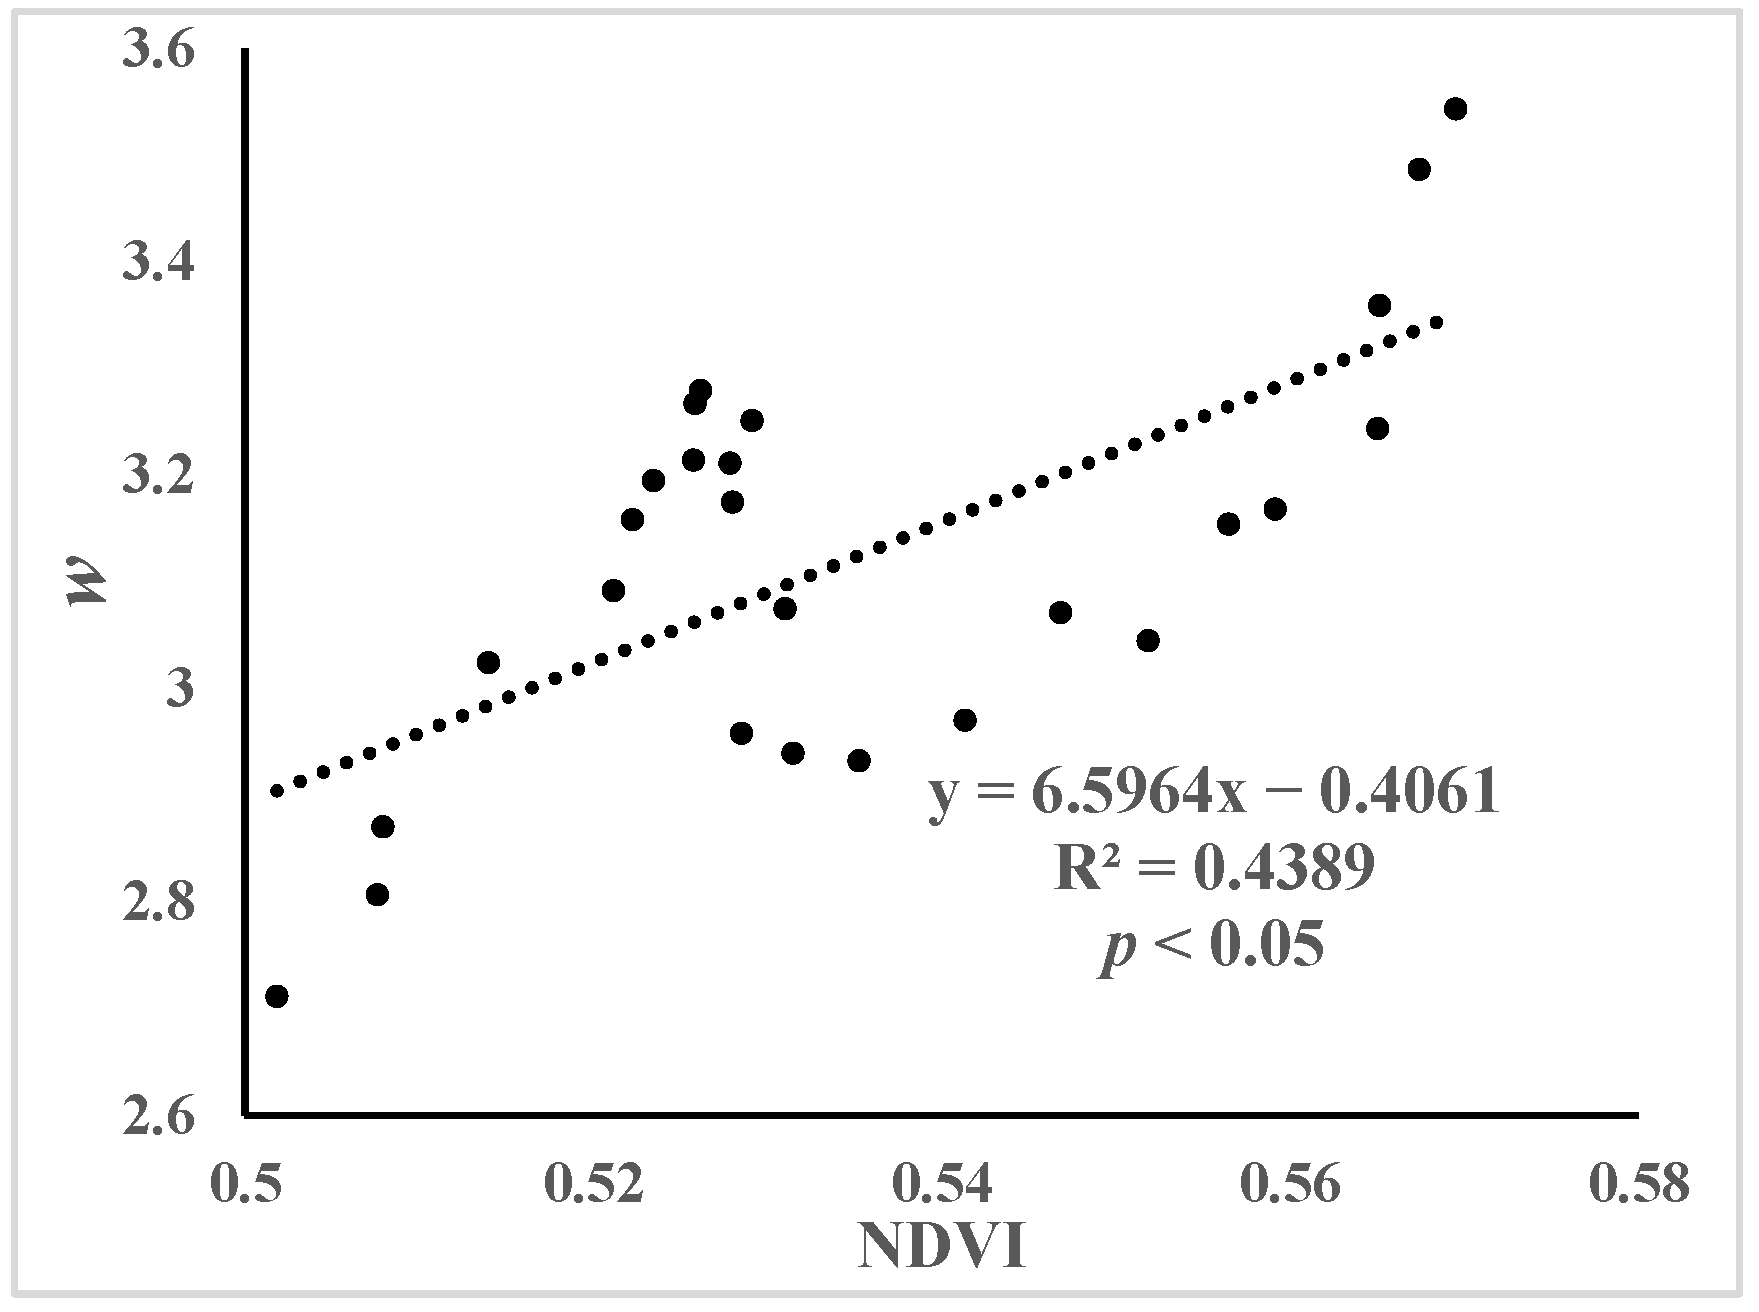
4. Results and Analysis
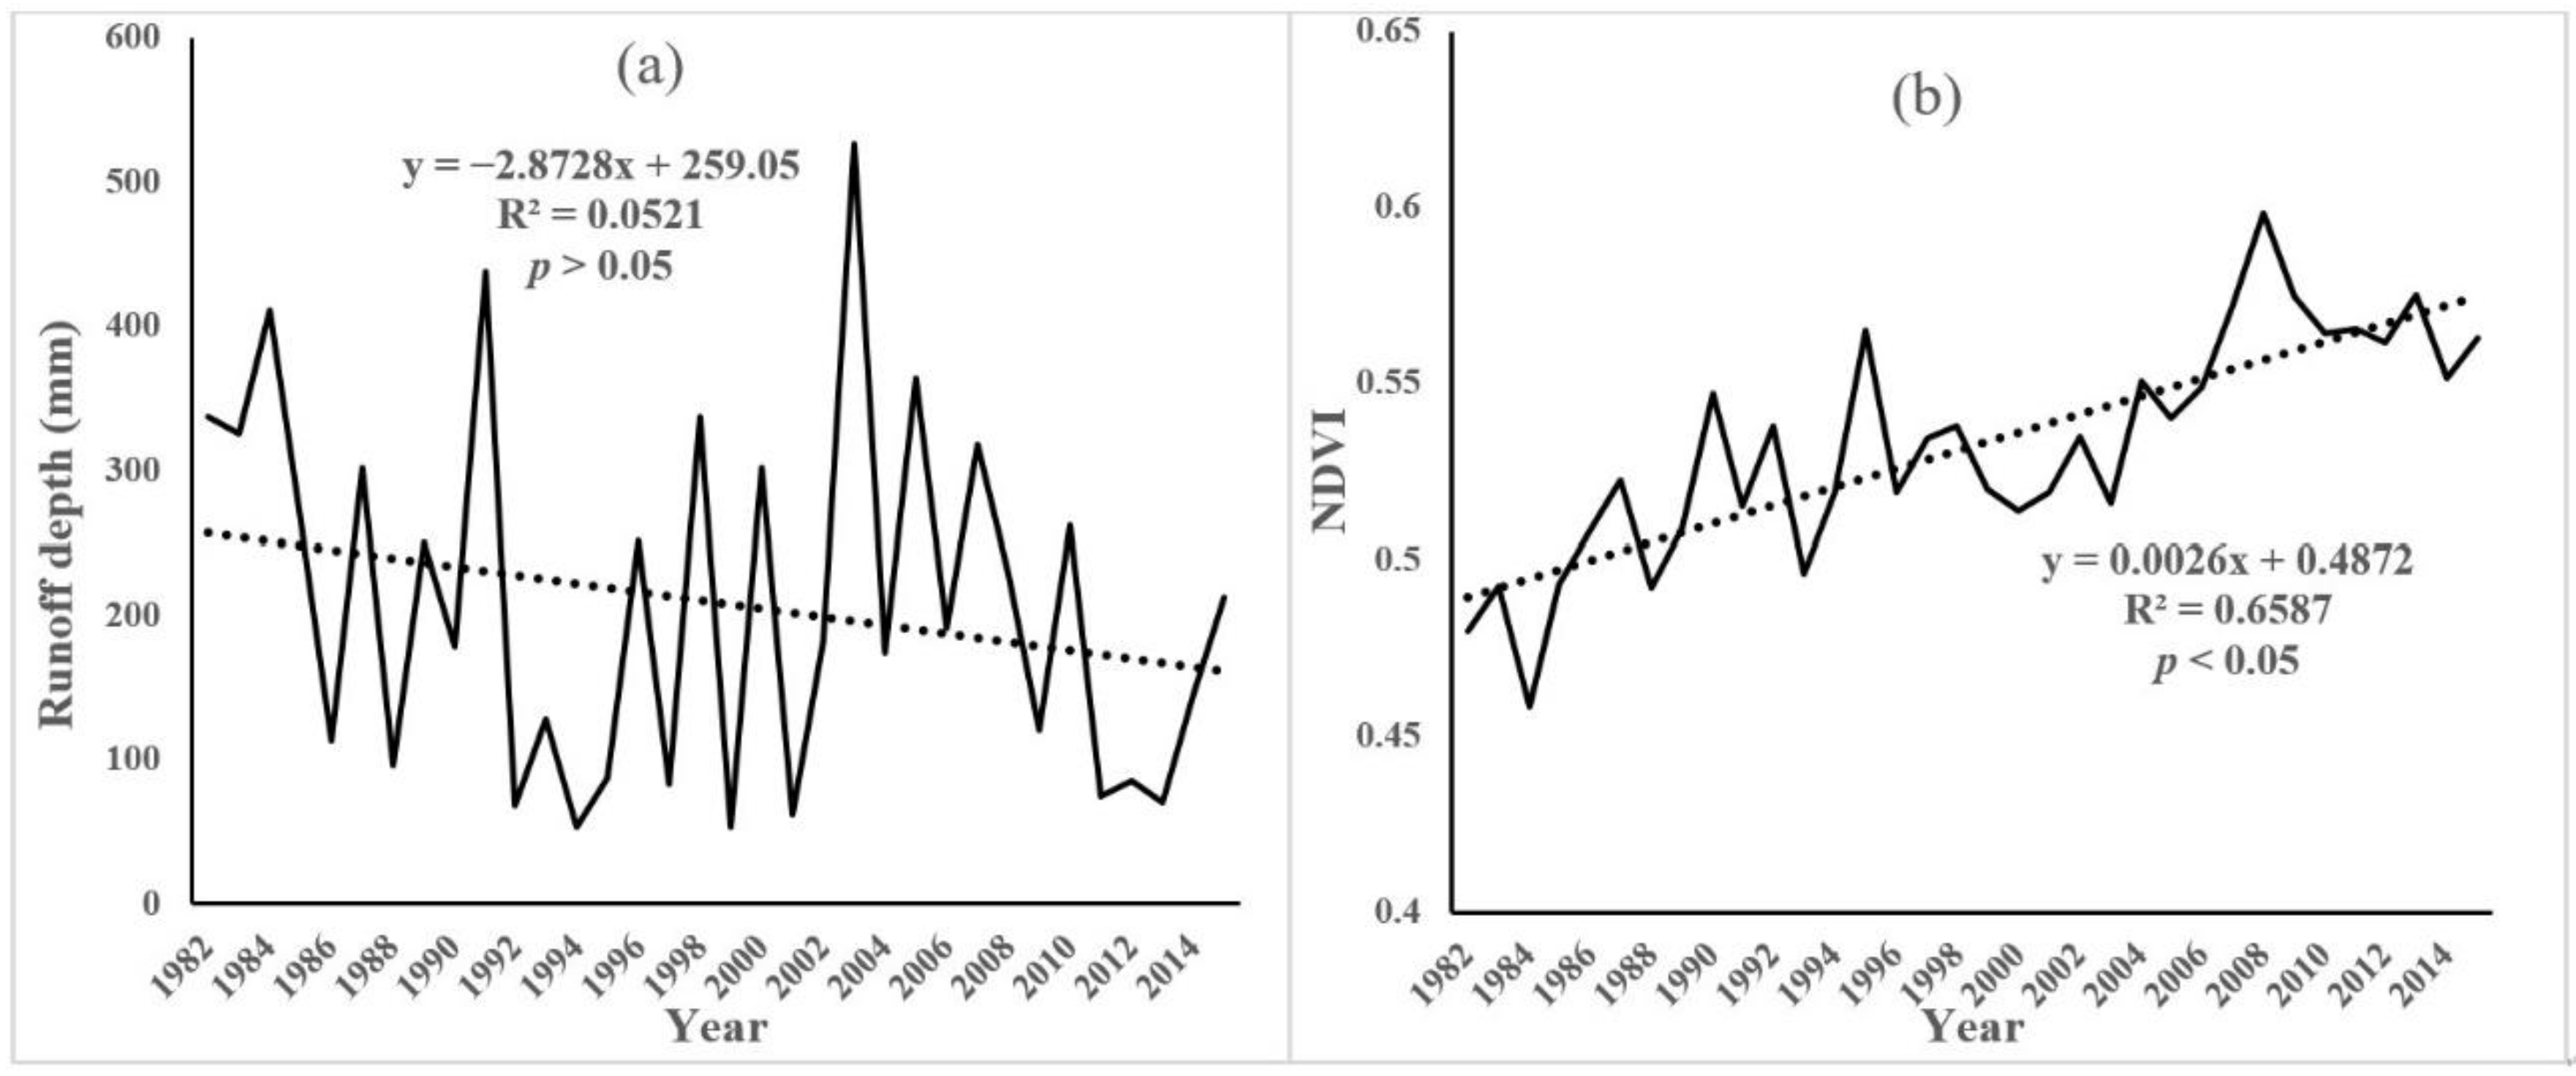
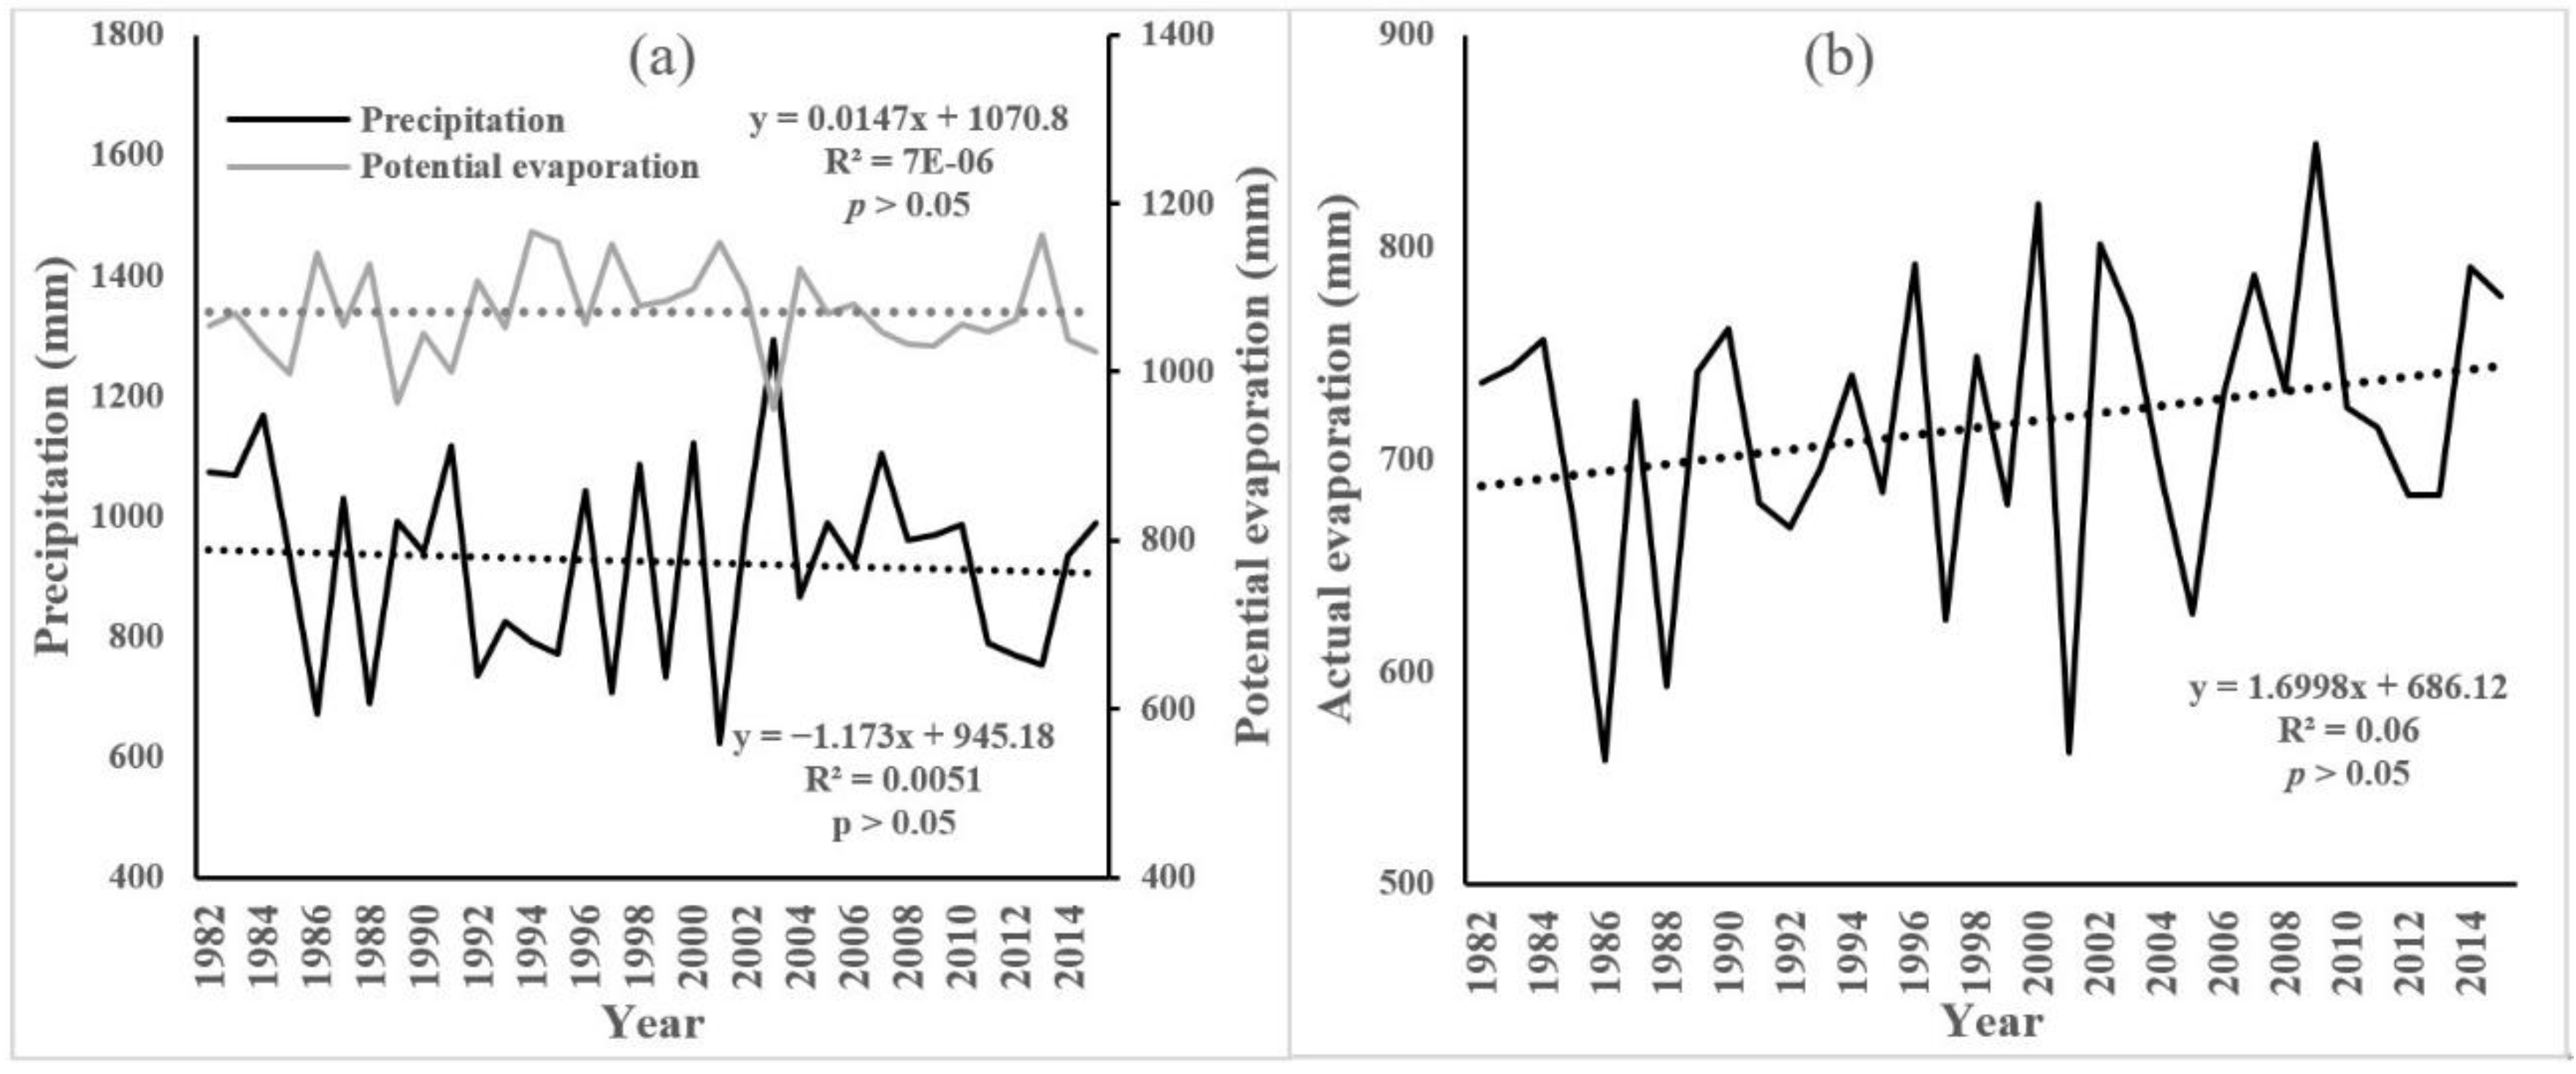
4.1. Trend Analysis

Figure 2a displays the annual variation tendency of the mean annual runoff depth values in the MUHR from 1982 to 2015. It can be recognized from Figure 2a that the average annual runoff depth displays a non-significant downward trend (p > 0.05). During the research period, the range of yearly runoff depths in the MUHR was 50–520 mm, and the maximum was reached in 2003. Figure 2b displays the yearly variation tendencies for the average annual NDVI changes in the MUHR. As we can see from Figure 2b, the NDVI was increasing. The range of the mean annual NDVI values of the MUHR was 0.46 to 0.60. In general, the gradient of the NDVI was 0.0026/a (p < 0.05), indicating that the vegetation recovery in the MUHR was significant.
Figure 3a reveals the change tendencies for annual precipitation and potential evaporation from 1982 to 2015 in the MUHR. The annual rainfall shows a fluctuating and non-significant downward trend and its interannual change is dramatic, with a gradient of −1.173 mm/a (p > 0.05). During the study period, the annual average precipitation in the MUHR ranged from 600 to 1300 mm. The average annual potential evaporation in the MUHR were in the ranges of 950–1750, with a non-significant upward trend (p > 0.05) and a gradient of 0.0147 mm/a. Figure 3b reveals the change tendencies for actual evaporation from 1982 to 2015 in the MUHR. The actual evaporation show a non-significant upward trend (p > 0.05), with gradients of 1.6998 mm/a. During the study period, the average actual evaporation in the MUHR were in the ranges of 550–850 mm.

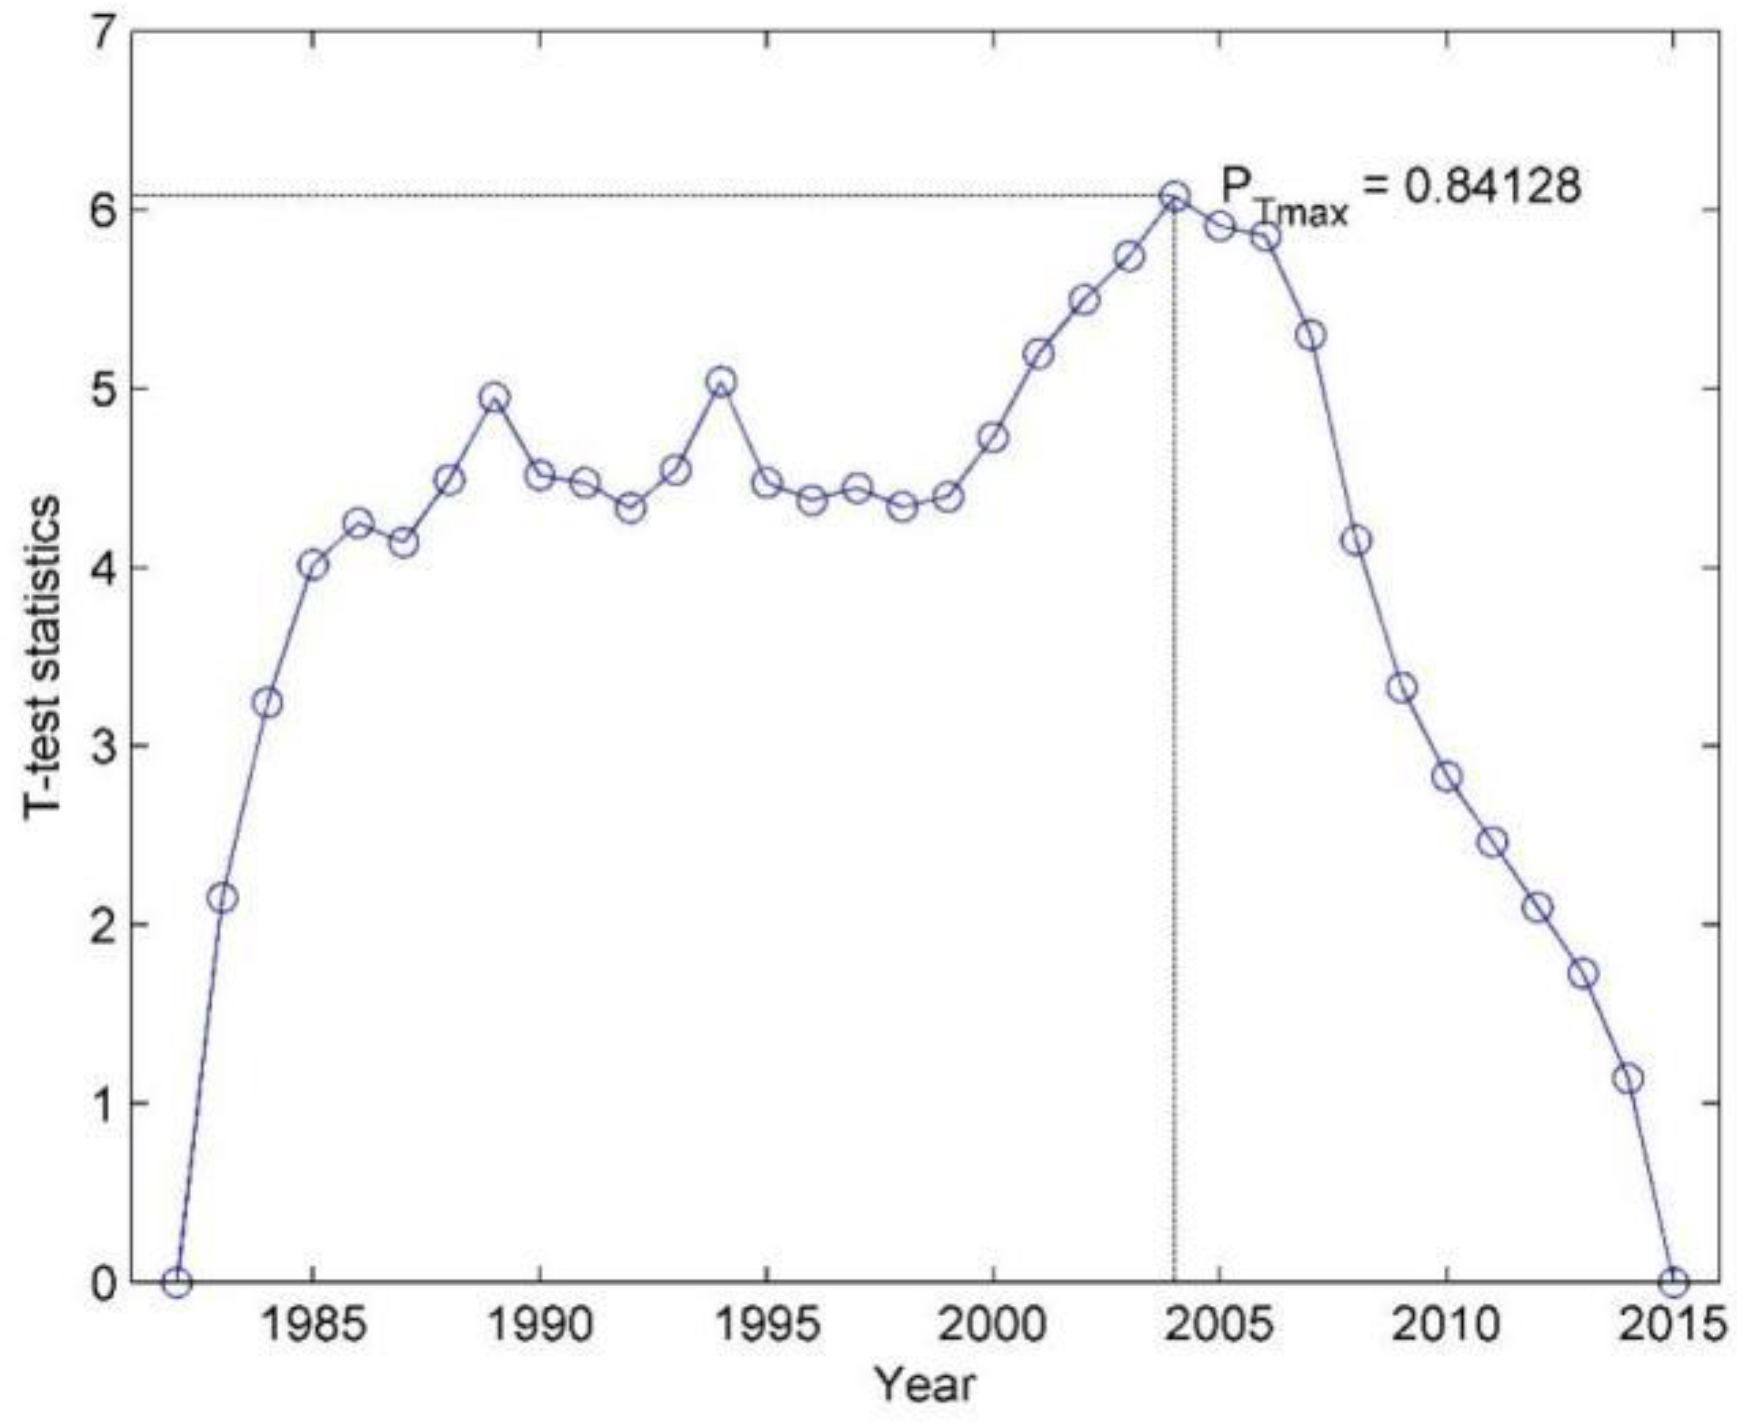
4.2. Mutation Analysis of the NDVI

The B–G algorithm was used to distinguish the abrupt year of the NDVI time sequence data (Figure 4). It is worth noting that P0 is a set threshold, and its value range is [0.5–0.95]. In this study, the value of P0 is set to 0.84, and for the purpose of assuring the validity of the statistics, this research defines the value of subseries not less than 25, i.e., l0 ≥ 25. If the length of the subsequence is too short and the amount of data is too small, there is too much error in testing the mutation points. The result of the B–G algorithm revealed that the abrupt year of the NDVI time series data was around 2004. According to Formula (4), the probability at the maximum value of the t-test statistics P(Tmax) was calculated. If P(Tmax)> P0, the mutation is considered to be significant. The calculation results show that the probability range of originality at the maximum value of the t-test statistics (2004) is 0.84128 > 0.84, proving the reliability of the result that the NDVI time series data mutated in 2004.

4.3. Quantitative Analysis of Vegetation Variation Based on Streamflow Variation

To quantify the relationship between the NDVI and w, the w values in the MUHR from 1982 to 2015 were calculated using Equation (8). Next, the 10-year moving averages of w and NDVI were obtained in this study. Finally, the relationship between the NDVI and w in the MUHR was obtained (Figure 5). Figure 5 shows that the 10-year running average w has a linear function relationship with the 10-year running average NDVI.
In accordance with consequences of the B–G algorithm mutation analysis, the research phase was assigned to the base period (T1: 1982–2004) and changing period (T2: 2005–2015). In accordance with the mean potential evaporation, mean precipitation, and mean runoff depth values in the T1 and T2 periods, the characteristic parameters of the underlying surface (w) in the T1 and T2 periods were computed. The elasticity coefficients of the runoff to the P (εP), ET0 (εET0), ww), and NDVI (εNDVI) can be computed using Formulas (11)–(14). The consequences are presented in Table 1 and Table 2.
It can be seen from Table 1 that the ET0 of the MUHR in the T2 period has decreased to 17.30 mm, contrasting with the T1 period. The precipitation of the T2 period has slightly increased by 0.18 mm, contrasting with the T1 period. The runoff depth in the T2 period has reduced by 30.04 mm, contrasting with the T1 period, but the NDVI value in the changing period presents an increasing trend, with an increase of 0.05.
It can be recognized from Table 2 that the elasticity coefficients of the runoff depths based on the ET0, w, and NDVI are 2.43, −1.43, −1.45, and −1.64, respectively. The variation in the runoff depth caused by the precipitation, potential evaporation, human activities, and vegetation changes can be computed using Formulas (11)–(14), and equal 0.10 mm, 4.84 mm, −31.09 mm, and −5.84 mm, respectively. The variation in runoff depths caused by the significant growth of vegetation is the largest, accounting for 97.19%; that is, the vegetation variation is the major factor resulting in discharge changes in the MUHR. The precipitation, potential evaporation, and human activities account for −0.32%, −15.11%, and 18.24% of the surface runoff variation in the MUHR, respectively.
The findings of this paper are similar to those by scholars such as Zhang et al. [13] and Shi et al. [24], all of whom indicated that improved vegetation cover conditions in the watershed domain have a weakening effect on the runoff, but there are still some differences in the calculated contribution values, which may be due to several factors, including (1) the use of data from different time scales and (2) the use of different hydrological models and Budyko’s assumption formula.
Many studies have confirmed that the vegetation changes caused by large-scale afforestation activities in the watershed can significantly affect the runoff [33,34,35]. Vegetation changes can affect runoff changes in many ways. (1) The higher the vegetation coverage rate, the stronger the ability to conserve water, and the surface runoff will be reduced. (2) The increase in vegetation leaf area can increase the evapotranspiration of plant leaves, and as water is discharged into the atmosphere through the respiration of leaf stomata, the soil water content will also decrease, affecting the surface runoff. (3) The improvement of the vegetation coverage degree efficiently improves the interception of rainfall, reducing the precipitation reaching the ground and affecting the change in runoff.

5. Conclusions

In this study, we first explored the change trends of meteorological and hydrological data and NDVI data and identified the mutation year of the NDVI time series data using the B–G segmentation algorithm. Next, the functional equation between the underlying surface characteristic parameter (w) and the NDVI was quantified, and the modified Budyko formula was structured. Finally, the impact degree of the vegetation change on the discharge change in the MUHR was computed using the modified Budyko formula.
The following conclusions were drawn. There is a significant linear functional relation between the NDVI and underlying surface parameters (w). The vegetation variation played a major role in the runoff variation during the changing period (2005–2015) in the MUHR, with a contribution rate of 97.19%. The precipitation, potential evaporation, and human activities accounted for −0.32%, −15.11%, and 18.24% of the surface runoff variation, respectively.

6. Discussions

The implementation of a series of soil and water conservation measures in the MUHR (especially the reforestation and grass restoration project in 1999) has significantly changed the rainfall–runoff relationship in the area. The underlying surface parameters (w) in the Budyko equation reflect the combined effect of the soil properties, topographic factors, and vegetation cover. The soil properties and topography are relatively stable parameters, while the vegetation factors become the main factors affecting w. The NDVI and w showed a strong synergistic trend, indicating that the vegetation restoration had a significant impact on w (Figure 5). The contribution analysis of the vegetation restoration to the runoff changes further verified that the increase in vegetation cover caused runoff attenuation in the MUHR.
There were several deficiencies in the attribution of different factors to discharge changes based on Budyko’s theoretical assumptions. (1) Meteorological data for the individual dates were missing due to the limitation of the observation conditions. (2) This study assumed that each factor was relatively independent. This assumption ignores the interactions and connections between each factor [36,37,38], which will have an uncertain impact on the research results. (3) In addition to vegetation restoration, various soil and water conservation engineering measures such as the construction of terraces and sand dams also cause changes in w, and the effects of various water conservation measures on w cannot be quantitatively analyzed at present. (4) The change in water storage in the water balance equation based on Budyko’s assumption is 0 on the multi-year average scale, which obviously ignores the interception for runoff by various soil and water conservation engineering measures and water conservancy projects.
In the future, we will consider building a distributed hydrological hydrothermal coupling model combined with higher-resolution remote sensing vegetation index data to analyze how vegetation affects the hydrological process in the MUHR [39,40,41]. This is an effective way to clarify the influence mechanism of vegetation variations on the water–heat relation. In addition, in this study, we did not distinguish the impact of reservoir construction projects on the discharge change, which will be further discussed in the subsequent study.

Author Contributions

Author Contributions: Conceptualization, G.J.; methodology, Y.W. and G.J.; software, Z.H.; validation, G.J.; formal analysis, Y.W., Z.L. and B.Q.; data curation, Y.W. and G.J.; writing—original draft preparation, Y.W., Z.L. and B.Q.; writing—review and editing, Y.W. and G.J.; visualization, Z.H.; project administration, G.J.; funding acquisition, G.J. All authors have read and agreed to the published version of the manuscript.

Funding

This research was funded by the National Key R&D Program of China (2021YFD1700900), the Think Tanks Key Research Projects of the Colleges and Universities of Henan Province (2022ZKYJ07), and the Special Fund for Top Talents of Henan Agricultural University (30501031).

Institutional Review Board Statement

Not applicable.

Informed Consent Statement

Not applicable.

Data Availability Statement

Not applicable.

Conflicts of Interest

The authors declare no conflict of interest.

References

  1. Ji, G.; Lai, Z.; Xia, H.; Liu, H.; Wang, Z. Future Runoff Variation and Flood Disaster Prediction of the Yellow River Basin Based on CA-Markov and SWAT. Land 2021, 10, 421. [Google Scholar] [CrossRef]
  2. Ji, G.; Wu, L.; Wang, L.; Yan, D.; Lai, Z. Attribution Analysis of Seasonal Runoff in the Source Region of the Yellow River Using Seasonal Budyko Hypothesis. Land 2021, 10, 542. [Google Scholar] [CrossRef]
  3. Piao, S.L.; Wang, X.H.; Ciais, P.; Zhu, B.; Liu, J. Changes in satellite-derived vegetation growth trend in temperate and boreal Eurasia from 1982 to 2006. Glob. Chang. Biol. 2011, 17, 3228–3239. [Google Scholar] [CrossRef]
  4. Jackson, R.B.; Jobbágy, E.G.; Avissar, R.; Roy, S.; Barrett, D.; Cook, C.; Farley, K.; Maitre, D.; Mccarl, B.; Cook, C. Trading water for carbon with biological carbon sequestration. Science 2005, 310, 1944–1947. [Google Scholar] [CrossRef] [Green Version]
  5. Ji, G.; Song, H.; Wei, H.; Wu, L. Attribution Analysis of Climate and Anthropic Factors on Runoff and Vegetation Changes in the Source Area of the Yangtze River from 1982 to 2016. Land 2021, 10, 612. [Google Scholar] [CrossRef]
  6. Yan, D.; Lai, Z.; Ji, G. Using Budyko-Type Equations for Separating the Impacts of Climate and Vegetation Change on Runoff in the Source Area of the Yellow River. Water 2020, 12, 3418. [Google Scholar] [CrossRef]
  7. Wei, X.; Sun, G.; Liu, S.; Jiang, H.; Zhou, G.; Dai, L. The forest-streamflow relationship in China: A 40-year retrospect. J. Am. Water Resour. Assoc. 2008, 44, 1076–1085. [Google Scholar] [CrossRef] [Green Version]
  8. Lü, Y.; Zhang, L.; Feng, X.; Zeng, Y.; Fu, B.; Yao, X.; Li, J.; Wu, B. Recent ecological transitions in China: Greening, browning, and influential factors. Sci. Rep. 2015, 5, 8732. [Google Scholar] [CrossRef] [PubMed] [Green Version]
  9. Chen, C.; Park, T.J.; Wang, X.; Piao, S.; Xu, B.; Chaturvedi, R.; Fuchs, R.; Brovkin, V.; Ciais, P.; Fensholt, R.; et al. China and India lead in greening of the world through land-use management. Nat. Sustain. 2019, 2, 122–129. [Google Scholar] [CrossRef]
  10. Liu, Z.; Wang, H.; Li, N.; Zhu, J.; Pan, Z.; Qin, F. Spatial and Temporal Characteristics and Driving Forces of Vegetation Changes in the Huaihe River Basin from 2003 to 2018. Sustainability 2020, 12, 2198. [Google Scholar] [CrossRef]
  11. Liu, F.; Qin, T.; Girma, A.; Wang, H.; Weng, B.; Yu, Z.; Wang, Z. Dynamics of Land-Use and Vegetation Change Using NDVI and Transfer Matrix: A Case Study of the Huaihe River Basin. Pol. J. Environ. Stud. 2018, 28, 213–223. [Google Scholar] [CrossRef] [PubMed]
  12. Gao, Z.; Liu, S.; Qin, X.; Xu, L. Spatial-temporal evolution of the Normalized Vegetation Index (NDVI) in the Huai River Basin from 1999 to 2018. Pearl River 2022, 43, 1–9. (In Chinese) [Google Scholar]
  13. Zhang, J.; Zhang, C.; Bao, Z.; Li, M.; Wang, G.; Guan, X.; Liu, C. Effects of vegetation cover change on runoff in Huang-Huai-Hai River Basin. Adv. Water Sci. 2021, 32, 813–823. (In Chinese) [Google Scholar]
  14. An, G.; Hao, Z. Variation of Precipitation and Streamflow in the Upper and Middle Huaihe River Basin, China, from 1959–2009. J. Coast. Res. 2017, 80, 69–79. [Google Scholar] [CrossRef]
  15. Zhu, Y.; Wang, W.; Liu, Y.; Wang, H. Runoff changes and their potential links with climate variability and anthropogenic activities: A case study in the upper Huaihe River Basin, China. Hydrol. Res. 2015, 46, 1019–1036. [Google Scholar] [CrossRef] [Green Version]
  16. Yang, C.; Chen, H.; Gu, Z.; Wang, W.; Ju, J.; Chen, L.; Zhu, H. Analysis on Influencing Factors of Runoff Evolution in Typical Watershed of Upper Huaihe River—A Case Study of Bailianya Watershed. Sci. Soil Water Conserv. 2020, 18, 110–116. (In Chinese) [Google Scholar]
  17. Zhang, S.; Yang, D.; Jayawardena, A.W.; Xu, X.; Yang, H. Hydrological change driven by human activities and climate variation and its spatial variability in Huaihe Basin, China. Hydrol. Sci. J. 2016, 61, 1370–1382. [Google Scholar] [CrossRef] [Green Version]
  18. Ma, F.; Ye, A.; Gong, W.; Mao, Y.; Miao, C.; Di, Z. An Estimate of Human and Natural Contributions to Flood Changes of the Huai River. Glob. Planet. Change 2014, 119, 39–50. [Google Scholar] [CrossRef]
  19. Gao, C.; Ruan, T. The influence of climate change and human activities on runoff in the middle reaches of the Huaihe River Basin, China. J. Geogr. Sci. 2018, 28, 79–92. [Google Scholar] [CrossRef] [Green Version]
  20. Gao, C.; Lu, M.; Zhang, X.; Li, P. Response analysis of runoff to climate change in the upper reaches of Huaihe River Basin. J. North China Univ. Water Resour. Electr. Power (Nat. Sci. Ed.) 2016, 37, 28–32. (In Chinese) [Google Scholar]
  21. Liu, X.; Chen, M.; Wang, Z.; Zhu, S.; Cui, C.; Zhou, T. Analysis of the attribution of runoff changes in the middle and upper reaches of the Huaihe River basin. Yellow River 2020, 42, 16–22. (In Chinese) [Google Scholar]
  22. Ye, T.; Shi, P.; Zhong, H.; Qu, S.; Wu, H.; Shen, L. Attribution analysis of runoff change in the upper and middle reaches of Huaihe River based on Budyko hypothesis and differential equation. J. Hohai Univ. (Nat. Sci.) 2022, 50, 25–32. (In Chinese) [Google Scholar]
  23. Sun, S.; Wang, J.; Zhou, S.; Wang, J.; Yan, G.; Wang, H.; Bi, Z. Effects of climate and watershed characteristics on surface hydrological processes in the Huaihe River Basin. Acta Ecol. Sin. 2022, 42, 3933–3946. (In Chinese) [Google Scholar]
  24. Shi, Z.; Zhao, Q.; Wang, Y.; Zhang, L. Temporal and Spatial Evolution of Vegetation Cover and Its Relationship with Runoff in Yihe River Basin. Res. Soil Water Conserv. 2023, 30, 1–8. [Google Scholar]
  25. Gong, Z.; Feng, G.; Wan, S.; Li, J. Detection of North China and Global Climate Change Based on Heuristic Segmentation Algorithm. Acta Phys. Sin. 2006, 55, 477–484. (In Chinese) [Google Scholar] [CrossRef]
  26. Huang, C.; Du, M.; Li, P.; Guo, Y.; Wang, L. Study on Variation and Driving Force of Rainfall Concentration under Changing Environment. Adv. Water Sci. 2019, 30, 496–506. (In Chinese) [Google Scholar]
  27. Feng, G.; Gong, Z.; Dong, W.; Li, J. Research on climate mutation detection based on heuristic segmentation algorithm. Acta Phys. Sin. 2005, 54, 5494–5499. (In Chinese) [Google Scholar] [CrossRef]
  28. Choudhury, B. Evaluation of an empirical equation for annual evaporation using field observations and results from a biophysical model. J. Hydrol. 1999, 216, 99–110. [Google Scholar] [CrossRef]
  29. Yang, H.; Yang, D.; Lei, Z.; Sun, F. New analytical derivation of the mean annual water- energy balance equation. Water Resour. Res. 2008, 44, W03410. [Google Scholar] [CrossRef]
  30. Li, D.; Pan, M.; Cong, Z.; Zhang, L.; Wood, E. Vegetation control on water and energy balance within the Budyko framework. Water Resour. Res. 2013, 49, 969–976. [Google Scholar] [CrossRef]
  31. Ji, G.; Huang, J.; Guo, Y.; Yan, D. Quantitatively Calculating the Contribution of Vegetation Variation to Runoff in the Middle Reaches of Yellow River Using an Adjusted Budyko Formula. Land 2022, 11, 535. [Google Scholar] [CrossRef]
  32. Xu, X.; Yang, D.; Yang, H.; Lei, H. Attribution analysis based on the Budyko hypothesis for detecting the dominant cause of runoff decline in Haihe basin. J. Hydrol. 2014, 510, 530–540. [Google Scholar] [CrossRef]
  33. Yang, D.; Zhang, S.; Xu, X. Attribution Analysis of Runoff Change in the Yellow River Basin Based on Hydrothermal Coupling Equilibrium Equation. Sci. Sin. (Technol.) 2015, 45, 10241034. (In Chinese) [Google Scholar]
  34. Zhao, F.; Zhang, L.; Xu, Z.; Scott, D.F. Evaluation of methods for estimating the effects of vegetation change and climate variability on streamflow. Water Resour. Res. 2010, 46, 742–750. [Google Scholar] [CrossRef]
  35. Yang, Y.; Zeng, P. Effects of forest vegetation change on river runoff and sediment in China. J. Beijing For. Univ. 1994, 16, 3541. (In Chinese) [Google Scholar]
  36. Wu, J.; Miao, C.; Wang, Y.; Duan, Q.; Zhang, X. Contribution analysis of the long-term changes in seasonal runoff on the Loess Plateau, China, using eight Budyko-based methods. J. Hydrol. 2017, 545, 263–275. [Google Scholar] [CrossRef]
  37. Al-Safi, H.I.J.; Kazemi, H.; Sarukkalige, P.R. Comparative study of conceptual versus distributed hydrologic modelling to evaluate the impact of climate change on future runoff in unregulated catchments. J. Water. Clim. Chang. 2020, 11, 341–366. [Google Scholar] [CrossRef]
  38. Jiang, C.; Xiong, L.; Wang, D.; Liu, P.; Guo, S.; Xu, C. Separating the impacts of climate change and human activities on runoff using the Budyko-type equations with time-varying parameters. J. Hydrol. 2015, 522, 326–338. [Google Scholar] [CrossRef]
  39. Leuning, R.; Zhang, Y.Q.; Rajaud, A.; Cleugh, H.; Tu, K. A simple surface conductance model to estimate regional evaporation using MODIS leaf area index and the Penman-Monteith equation. Water Resour. Res. 2008, 44, 1–17. [Google Scholar] [CrossRef]
  40. Liu, C.M.; Wang, Z.G.; Yang, S.T.; Sang, Y.; Liu, X.; Li, J. Hydro-informatic modeling system: Aiming at water cycle in land surface material and energy exchange processes. Acta Geogr. Sin. 2014, 69, 579–587. (In Chinese) [Google Scholar]
  41. Zhang, D.; Liu, X.M.; Bai, P. Different influences of vegetation greening on regional water-energy balance under different climatic conditions. Forests 2018, 9, 412. [Google Scholar] [CrossRef]
Figure 1. Location of the study area.
Forests 13 02000 g001
Figure 2. Annual variation tendencies of the runoff depth (a) and NDVI (b) values in in MUHR.
Forests 13 02000 g002
Figure 3. Change tendencies of the precipitation, potential evaporation, and actual evaporation in the MUHR.
Forests 13 02000 g003
Figure 4. The B–G segmentation algorithm results for the NDVI data in the MUHR from 1982 to 2015.
Forests 13 02000 g004
Figure 5. The relationship between the 10-year running average w and NDVI values.
Forests 13 02000 g005
Table 1. The eigenvalues of the climate, hydrology, and NDVI variables in the MUHR.
PeriodsET0/mmP/mmR/mmwNDVI
T11076.66924.59218.492.740.52
T21059.36924.77188.453.090.57
Δ−17.300.18−30.040.350.05
Table 2. Contribution rate analysis of the discharge variation in the MUHR.
εPεE0εwεNDVI Δ R P Δ R E T 0 Δ R N D V I Δ R h u m η R P η R E T 0 η R N D V I η R h u m
2.43−1.43−1.45−1.640.104.84−31.09−5.84−0.32%−15.11%97.19%18.24%
Publisher’s Note: MDPI stays neutral with regard to jurisdictional claims in published maps and institutional affiliations.

