Article

Multifactorial Analysis of the Axle Load of Truck Sets during the Transport of Sawmill By-Products

by
Grzegorz Trzciński
1,* and
Łukasz Tymendorf
2
1
Department of Forest Utilization, Institute of Forest Sciences, Warsaw University of Life Sciences-SGGW, 159 Nowoursynowska St., 02-776 Warsaw, Poland
2
Independent Researcher, 12-100 Szczytno, Poland
*
Author to whom correspondence should be addressed.
Forests 2022, 13(12), 1992; https://doi.org/10.3390/f13121992
Submission received: 28 October 2022 / Revised: 19 November 2022 / Accepted: 23 November 2022 / Published: 25 November 2022

Abstract

:
The aim of the study was to investigate the actual axle loads of vehicles used for the transport of sawmill by-products, resulting from the total weight of the transport set (GVW) at different times of the year and depending on the type of sets and transported assortment. Sawmill by-product loads were divided into groups: wood chips, sawdust, slabs and recycled wood. The research was carried out at the recipient of the sawmill by-products as well as at the producer. The GVW was determined on the basis of weighing the entire set on a stationary scale at the premises of the companies. The load on the individual axles of high tonnage truck units was measured using Model DINI ARGEO WWSD portable truck scales with a 3590M309 weighing terminal. Almost 230 transports were analyzed. It was shown that the average GVW is 39.25 t for transport sets with a load of 22.44 t of sawmill by-products with the usage of the semi-trailer capacity of 0.85. For all transport sets, the average load on the individual axles range from 6.72 t (axle 5 in a six-axle truck and trailer-TT) to 10.29 t for axle 2 in a truck and semi-trailer (TST), where the highest occurs on axle 2 of the truck (drive axle). The influence of the type of transport set (TST or TT) and the type of the assortments on the axle load is shown, and the existing correlations are at the level of 0.604–0.669 for axles 3–5 in the TST set. The static axle loads of the transport sets for the sawmill by-products and the distribution of the total weight of the set among the axles are different from those for roundwood transport.

1. Introduction

The increasing use of wood biomass (sawmill by-products) generated in the processing of roundwood for further use by the pulp and paper industry, wood-based board factories or energy sector lead to the increased transportation by heavy weight vehicles [1,2,3]. The transport of wood biomass is also one of the key cost components in the economic aspects of sawmill by-products use [4,5,6,7,8,9]. Väätäinen et al. [4] reports that transport costs can be reduced by as much as 7% to 20%, based on the publications analyzed. Stolarski et al. [9] reports that the transport of fresh wood chips, in terms of the energy contained in them (1.00 € GJ−1), in Poland, during the winter season was 20% higher than in summer and the truck transport was 12% cheaper than by train. Variability in the characteristics of wood assortments can affect the payload of the transport sets [10], and with significant variations, such as seasonal variations, can cause truck overloading [11,12,13,14]. According to Ghaffariyan et al. [11], the highest woodchip supply chain costs occurred when the mass share of moisture was between 20% to 30%. Sosa et al. [14] report that five-axle transport sets can be overloaded by more than 6 t during the winter months.
In the transport of wood, it is the legislation that regulates the permissible axle loads and the total gross vehicle weight (GVW) [15,16]. In the European Union, Directive 96/53/EC has been in effect since 1996, specifying the permissible vehicle weights of 40 t and 44 t, and single axle loads of −10.0 t and double axle loads of −16.0 t [17]. In order to improve the efficiency of the transportation by trucks, the GVW restrictions have been increased. Currently, in many countries, to improve the efficiency of round wood transportation, the permissible total gross vehicle weights (GVWs) of the transport sets have been increased to 60 t or 76 t, or even to 92 t, and 104 t sets are being tested [18,19,20,21]. In Poland, for vehicles authorized for public transport for five-axle or six-axle sets, the GVW limit is 40 t, and the axle load depends on several factors, such as whether it is a drive axle, whether it is a double/triple axle and the distance between the component axles (Table A1) [22].
It is important how the GVW is distributed to the individual axles of the transport set, most often a truck unit and a semi-trailer, for the behavior of the road infrastructure [23,24,25,26]. The estimated pavement lifetime with a 10 t axle can be tens of percent shorter than the lifetime obtained with an 8 t axle and the rutting speed can be 8–18 times higher with super single tyres than with dual tyres [23]. When the forest road surfaces are subjected to dynamic loading, damage to the surface occurs, and with excessive loading and lack of maintenance, this process intensifies [25,26].
The axle load testing of transport sets can be carried out in various ways through direct measurement on platform scales [27,28,29,30,31] or using general data from preselection measurements (WIM) on public roads [32,33], as well as on the basis of surveys (data) from forestry contractors [34]. The authors of studies [35,36,37,38] point out the shortcomings of the system of pre-selective measurements (WIMs), as well as its improvement and verification. The obtained data on axle loads for transporting wood on platform scales, from the measurements on a certain number of transport sets from 5 to 65, are used to determine the impact of the vehicle wheels on the surface of the forest roads, on the basis of the calculations of the axle load equivalence coefficients [28,39,40].
The aim of this study was to investigate the real axle loads of sawmill by-products transport vehicles, based on the GVW, depending on the type of set (truck and trailer, truck and semi-trailer) and wood load assortment (sawdust, chips). It was assumed that the main factor determining the axle load is GVW, the configuration of the wood transport units and its axles, as well as the assortment of the sawmill by-products.

2. Materials and Methods

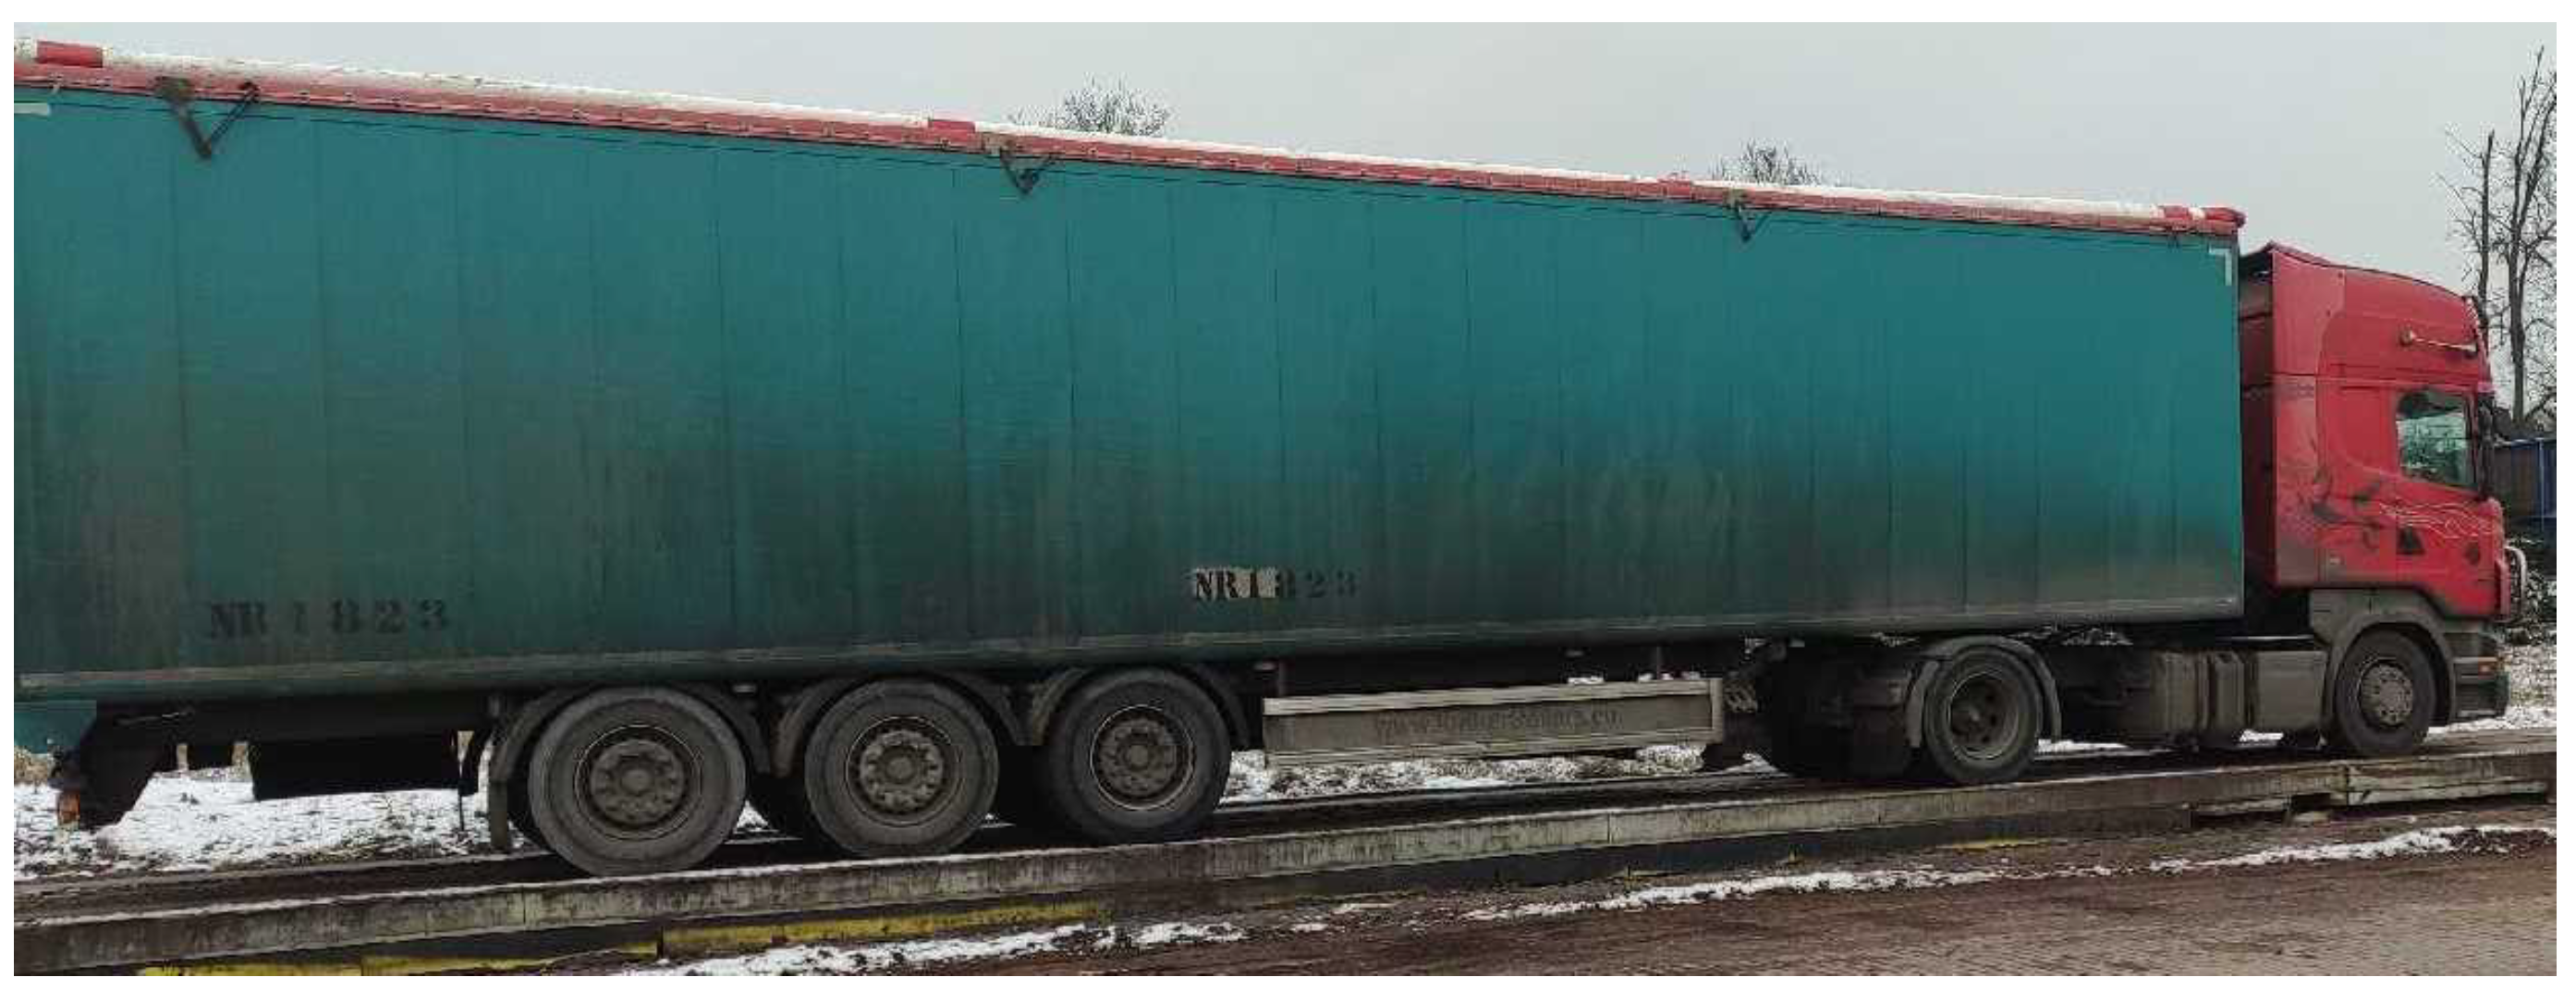
2.1. Study Location and Truck Measurements

The measurements of the parameters characterizing the transport of sawmill by-products resulting from roundwood processing (GVW, tare, load weight, axle weights, describing the load) were carried out at two large wood processing plants in Northern Poland. The first was a furniture manufacturing plant processing pine roundwood (a wood biomass producer), which sold the generated wood chips and bark-free sawdust from the sawn roundwood (GPS 53.403786, 20.952659). The second plant is a particleboard manufacturer that purchases, among other things, various sawmill by-products (GPS 53.85217475267924, 20.97192310331837).
A total of 226 transports were analyzed, including 73 with sawdust, 113 with woodchips, 19 with recycled material and 21 transports with slabs. The transports were mainly (197 deliveries) carried out by five-axle truck and semi-trailer (TST) sets, while the remaining 29 were truck and trailer (TT), where six sets were six-axle.
The research was conducted in July 2021 and June 2022.

2.2. Characterization of the Sawmill by-Product Materials and the Determination of the Load and Trailer Volume

Sawmill by-product loads were divided into groups [41,42,43]:
  • Wood chips: Material coming from the chipping of the round wood, wood residues in sawmills, other fresh wood material in storage and processing centers. Bark content is allowed if it comes from the normal processing or chipping wood with bark. Max 30%. Optimal sizes: 25–30 mm length, 15–25 mm width, 5–10 mm thickness. Green parts of the tree, branches with leaves and needles are not allowed (Figure 1a).
  • Sawdust: Fresh and clean softwood sawdust, from the sawmilling process. Fresh or dry material, as a result of sawing logs with circular saws or bandsaws. Bark content is allowed if it comes from the normal process of sawing wood with bark. Old and rotten sawdust is unacceptable. Content of stones, earth, mud, charcoal (after fires)—is not allowed (Figure 1b).
  • Recycled wood: Recycled wood fibre—Grade A and B recycled wood is sourced from both commercial wood waste and civic amenity sites (Figure 1d).
  • Slabs: slabs are pieces of unedged lumber resulted from the flanks of the log, with the interior side completed sawn, and the other side sawn on half of its length, with the length of at least 1 m and the width a maximum of 6 cm (Figure 1c).
The load volume of the transported wood was determined on the basis of the actual bulk cubic meter (bulk m3) measurements on the semi-trailer by the seller (sawmill), or the buyer, in accordance with the current rules at the companies [42], which is consistent with authors’ studies from various countries [44,45]. The driver was required to spread the load evenly on the trailer before measuring the load volume. The load volume was defined as the difference in volume between the trailer box capacity and the empty space between the top edge of the box and the delivered material surface.
The load volume of the semi-trailer was determined in cubic meters (m3), based on actual measurements of the length, width and height. With the entire (maximum) volume of the semi-trailer known, it was possible to determine the percentage of load space utilization for the individual deliveries.
For the shipments of sawmill by-products from the “recycled wood” group, the volume of the load and trailer could not be determined, as the reception of this material is achieved in tons. For shipments of the “slabs” material, it was also not possible to determine the volume of the loading space, as these were mainly sets with an unbuilt trailer or semi-trailer. Therefore, for some analyses (e.g., correlations), the results for these shipments were not taken into account.

2.3. Measurement of the Total Gross Vehicle Weight of the Transport Set, Tare and Load Weight

The gross vehicle weight of the truck unit (GVW), expressed in t is understood as the actual weight of the vehicle and trailer or truck unit and semi-trailer with all of the equipment, the driver and load. GVW (t) and tare (t) determined by weighing the transport set on the stationary scale on which the set entered (Figure 2). The load weight was obtained as the difference of the GVW and tare. At the wood biomass producer (sawmill), the empty set (tare) was weighed first, and then weighed again after loading, to determine the GVW. At a particleboard manufacturer’s site, the transport set was weighed when entering the plant and the empty set (tare) was weighed after unloading.

2.4. Measurement of the Axle Loads

The static axle load for each individual axle was measured using a model DINI ARGEO WWSD portable truck scales with a 3590M309 weighing terminal, with an accuracy of 0.01 t (Figure 3). During the measurement, the scales were placed on a flat maneuvering area of hardened concrete paving blocks, with no depressions. The scale system used is fully compliant with Polish regulations and allows vehicles in transit to be weighed. The loads on the individual wheel axles were measured successively for the whole unit: the vehicle and the trailer. The weigh station was selected in such a way so as to maintain a horizontally placed road scale, so that the measured axles were kept horizontally (Figure 3).

2.5. Statistical Analyses

In order to prove the assumption made in the objective of the study, comparative analyses were carried out to determine to what extent the type of sawmill by-products transported, the type of transport set (TST, TT) and its axle configuration, influence the load on the individual axle of the set. The correlation analyses were carried out to determine the relationship between the GVW and the individual axle load. The obtained results were analyzed statistically with the use of the STATISTICA 12 package. The significance of the differences was mainly determined using the Mann–Whitney test for two independent variables, as well as the Kruskal–Wallis test, and Dunn’s multi-sample rank mean comparison test (significance level was 0.05). To evaluate the relationship between the axle loads of a transport unit and its GVW (determined from a stationary scale), the Spearman correlation coefficient (Spearman’s rank correlation test) was used. For the statistical tests the Kruskal–Wallis, Dunn and Mann–Whitney tests were not carried out for some of the observation groups (e.g., type of vehicle, or delivery date) due to the low number of results in a specific group (less than 15).

3. Results

3.1. Analysis of the Parameters Characterizing the Transports of Sawmill By-Products

The general statistical characteristics of the basic parameters of the transport sets for all analyzed 226 deliveries of sawmill by-products, are shown in Table 1. The transport sets were characterized by the GVW from 25.82 to 49.16 t with an average of 39.25 t, and the average empty weight of the set was 16.81 t with a range of 14.1–24.6 t. In sets transporting sawdust and chips, the average trailer capacity was 90.43 m3 with SD = 2.91 and a wide range of results (75.94–94.16 m3). There is a large variation of the SD = 9.08 in the load volume (bulk·m3) with a mean of 75.25 (bulk·m3). Sets transporting sawmill by-products use 85% of the trailer capacity, on average.
There are statistically significant differences in the obtained values of the analyzed parameters, depending on the type of cargo for the GVW (p = 0.0038, Kruskal–Wallis test), mainly transports of recycled wood differ (Figure 4a). The Kruskal–Wallis test analysis also showed differences for the tare (p = 0.0004), with only similar results for the transports of chips, sawdust, slabs and recycled wood (Dunn’s multi-sample rank mean comparison test) (Figure 4b).
There are statistically significant differences (p = 0.00) for bulk cubic meter (Figure 5a) and the usage of the semi-trailer (Figure 4d), where no similarities were found. The cargo weight is similar for the transports of sawdust, woodchips, slabs and recycled wood (Figure 5b). The trailer capacities for wood chips and sawdust transports are similar at p = 0.995, based on the Kruskal–Wallis test (Figure 4c).

3.2. Static Load on the Individual Axle

For all transport sets, the average load on the individual axles ranges from 6.72 t (axle 5 in the TT six-axle) to 10.29 t for axle 2 in the TST, with a wide range of observed results from 3.84 t (axle 4 TT five-axle) to 13.87 t (axle 2 in the TST) (Table 2). Across all transport sets, the highest average of 8.73 t to 10.29 t axle load occurs on axle 2.
Comparing the loadings of all results on each axle among each other, shows statistically significant differences (Kruskal–Wallis test p = 0.0000), with further analysis using Dunn’s test showing the similarity of the loadings for axles 3, 4 and 5.

3.3. Analysis of the Axle Load of the Transport Set, Depending on the Investigated Parameter

The six results for the slabs transports made with a six-axle truck and trailer transport set were not included in the statistical analyses performed, due to the small sample of the observations (n < 15).
The type of transport set (TST, TT) is not significant on the loading of axle 1 (p = 0.2716 Mann–Whitney test) and axle 3 (p = 0.4775), there are no statistically significant differences in the results (Figure 6a). A comparative analysis using the Kruskal–Wallis test of all of the results of the individual axle loading, according to the transported wood assortment, showed statistically significant differences except for axle 1 (p = 0.2483), and Dunn’s multi-sample rank mean comparison test shows similarities (no statistically significant differences) for the transports of chips, sawdust, wood recycled and slabs on axle 4 and 5 (Figure 6b).
The statistical analysis confirmed the influence of the type of transport set (TST) on the loading of the main axles of the set (2-drive axle, 4,5-trailer axle), which prompted a detailed analysis for each type of transport set, depending on the transported assortment (Figure 7).
The type of transported sawmill by-products in the TST sets matters for the axle load of axles 3, 4, 5 (there are statistically significant differences), while for the truck axle (axle 1, 2) they do not depend (p = 0.205 and p = 0.125), which is a reasonable result since axles 3–5 are for semi-trailers (Figure 7a). The same is true for the axle loads in the TT sets (Figure 7b), but with lower statistical coefficients (p = 0.118 and p = 0.068). No analysis is presented for the six-axle TT sets, as they transported only one type of assortment-slabs.

3.4. Distribution of the Total Gross Vehicle Weight of the Transport Set Per Axle

If differences in the load on the axles of the transport set are found, then it is useful to analyze how the GVW is distributed among the axles. If comparing the average values (or medians) of the distribution of the GVW to the individual axles, the smallest share obviously falls on axle 1, with the observed range of the results being large and overlapping with other axles for the TST and TT (Figure 8).
In all transport sets, the greatest weight from the GVW occurs on axle 2, and this is at an average level ranging from 0.22 for the six-axle truck and trailer set (TT(6)) to 0.26 for the TST and TT (5 axle). The distribution of the GVW per axle 1, 2 and 3 is similar between the transport sets, where the statistical results are p = 0.8139, p = 0.4381 and 0.9420 (Kruskal–Wallis test), respectively, and axle 4 and 5 are statistically different.

3.5. Correlations between the Axle Load and the Gross Vehicle Weight

An analysis of the strength of the relationship between the load on a given axle of a transport set and its GVW was carried out. The statistically significant correlation coefficients were obtained for all axles of the truck and semi-trailer transport set, and there is no correlation for axle 1 in the truck and trailer set (Table 3).

4. Discussion

Most of the studies already presented above [28,29,30,31,32,33,34,40,46] on the axle loading, concerning the transport sets of roundwood, and our study is concerned with the sawmill by-products, which makes it difficult to directly compare results. We observed in 25% of the TST transport sets exceeding the GVW (more than 40 t), and the overloading of the vehicle’s 2nd axle (single drive axle) over the permitted value of 11.5 t, was already exceeded by only 10.7% of the vehicles. The triple semi-trailer axle load in the TST sets of more than 24 t, was observed in 32.5% of the transports, indicating that the axle load does not depend only on the GVW. Sixty-four percent of these sets do not exceed the axle load by more than 2 t, which, with the measurement rules applied by the Polish Road Transport Inspection, and taking into account a 5% error, only 12% exceeded the permissible limit. This is also confirmed by studies by other authors, where the GVW exceedance was found for only 1.46% of the transports [27], and the overloading of the truck’s tandem axle occurred in 58.1%, a similar situation is presented by Owusu-Ababio and Schmitt [28]. The observed average values of 6.72–10.29 t (Table 3) for the individual axle loads of the transport sets for the sawmill by-product deliveries are lower than for the transport of roundwood, defined at 7–12 t, where higher loads, even up to 14 t can be found [31,32,46,47].
We obtained very similar average results of 7.01–7.85 t-axis load 3, 4, 5 (no statistical difference) for the TST and TT five-axis sets but with a significant discrepancy in the results (min and max values, or SD), as also indicated in studies by other authors [28,30,31,48].
The distribution of the GVW of the five-axle TST and TT sets with the sawmill by-product transport averages 43%–44% on the axles of the truck and 56%–57% on the axles of the trailer or semi-trailer, and this is different (inversely) than in roundwood transport, where a larger share is on the truck [28,29,31,49]. This difference can be explained by the fact that roundwood trucks also operate on dirt roads and drivers plan the load arrangement in such a way as to ensure the stability and traction of the truck (drive axle), the sawmill by-product trucks operate mainly on public roads. However, this does not change the fact that the highest 8.73–10.29 t average axle loads occur on the drive axle of the truck. This is also influenced by the design of the set where the truck is two-axle and the trailer is three-axle.
We have shown that there are statistically significant differences in the trailer axle load, depending on the transported wood assortments, which may be caused by the recycled wood contractors who took deliveries, not on the basis of volume unit, where the driver was not required to level the load on the trailer (Figure A1). It should also be noted that the differences may be due to the moisture content of the material, the chips from a sawmill with an absolute moisture content of 86%–139%, and sawdust 63%–116% [48] or recycled material, which in affect greatly the bulk density [14,50,51,52].
In our study, we observed the truck and trailer 2 + 3 and truck and trailer 3 + 3 axle transport sets, and truck and semi-trailer 2 + 3 transporting sawmill by-products, which is characteristic of Poland and countries that still have a limited weight limit of the set GVW at 40–44 t [53,54]. In Finland and Sweden [55,56], sets with a 3 or 4 axle truck and a 4 or 5 axle trailer prevail, in various combinations, with five of them for transporting chips [56].

5. Conclusions

Based on the study, we can conclude that the static load on the individual axle of the transport set for the sawmill by-products depends on the total gross vehicle weight of the transport set and its type. The type of sawmill by-products transported mainly affects the axle load on the trailer, but there are other factors that have an impact. The static axle loads of the transport sets for the sawmill by-products and the distribution of the total gross vehicle weight of the set among the axles, where the majority is distributed among the axles of the semi-trailer, are different from those for the transport of roundwood. The limitations on the total gross vehicle weight of a transport set in Poland and its length determine the use of their combinations, where five-or six-axle sets are the most common.

Author Contributions

Conceptualization, G.T; methodology, G.T.; software, G.T. and Ł.T.; validation, G.T. and Ł.T; formal analysis, G.T.; data curation, G.T.; writing—original draft preparation, G.T. and Ł.T.; writing—review and editing, G.T. and Ł.T.; visualization, G.T. and Ł.T.; supervision, G.T.; project administration, G.T.; funding acquisition, G.T. All authors have read and agreed to the published version of the manuscript.

Funding

This research received no external funding.

Data Availability Statement

Not applicable.

Conflicts of Interest

The authors declare no conflict of interest.

Appendix A

Table A1. Permissible axle load for the transport unit in Poland.
Axle SetPermissible Load for the Axle or Axle Unit (t)
single no drive axle10
single drive axle11.5
Distances (d) between the component axles (m)d < 1.01.0 ≤ d < 1.31.3 ≤ d < 1.81.8 ≤ d
double axle trailers and semi-trailers11161820
double drive axle11.51618 (19)
two axles of the engine vehicles, where one
component axle is a driving axle
11.516
Distances (d) between the component axles (m)d < 1.31.3 < d ≤ 1.41.4 ≤ d < 1.8
triple axle trailers and semi-trailers212427
three axles of the engine vehicles, where one
component axle is a driving axle
212427
Based on the [22].

Appendix B

Figure A1. Different arrangement of the material on the trailer. (a) load evenly distributed but not fully filling the trailer box, (b) load unevenly distributed, (c) trailer box loaded to its maximum.
Forests 13 01992 g0a1

References

  1. Mirski, R.; Dukarska, D.; Derkowski, A.; Czarnecki, R.; Dziurka, D. By-products of sawmill industry as raw materials for manufacture of chip-sawdust boards. J. Build. Eng. 2020, 32, 101460. [Google Scholar] [CrossRef]
  2. Mahmudi, H.; Flynn, P. Rail vs truck transport of biomass. Appl. Biochem. Biotechnol. 2006, 129, 88–103. [Google Scholar] [CrossRef] [PubMed]
  3. Moskalik, T.; Gendek, A. Production of Chips from Logging Residues and Their Quality for Energy: A Review of European Literature. Forests 2015, 10, 262. [Google Scholar] [CrossRef] [Green Version]
  4. Väätäinen, K.; Anttila, P.; Eliasson, L.; Enström, J.; Laitila, J.; Prinz, R.; Routa, J. Roundwood and Biomass Logistics in Finland and Sweden. Croat. J. For. Eng. 2021, 42, 24. [Google Scholar] [CrossRef]
  5. Flisberg, P.; Frisk, M.; Ronnqvist, M. FuelOpt: A decision support system for forest fuel logistics. J. Oper. Res. Soc. 2012, 63, 1600–1612. [Google Scholar] [CrossRef]
  6. Windisch, J.; Väätäinen, K.; Anttila, P.; Nivala, M.; Laitila, J.; Asikainen, A.; Sikanen, L. Discrete-event simulation of an information-based raw material allocation process for increasing the efficiency of an energy wood supply chain. Appl. Energy 2015, 149, 315–325. [Google Scholar] [CrossRef]
  7. Eriksson, A.; Eliasson, L.; Sikanen, L.; Hansson, P.-A.; Jirjis, R. Evaluation of delivery strategies for forest fuels applying a model for Weather-driven Analysis of Forest Fuel Systems (WAFFS). Appl. Energy 2017, 188, 420–430. [Google Scholar] [CrossRef]
  8. Wolfsmayr, U.J.; Rauch, P. The primary forest fuel supply chain: A literature review. Biomass Bioenergy 2014, 60, 203–221. [Google Scholar] [CrossRef]
  9. Stolarski, M.J.; Stachowicz, P.; Sieniawski, W.; Krzyzaniak, M.; Olba-Zięty, E. Quality and Delivery Costs of Wood Chips by Railway vs. Road Transport. Energies 2021, 14, 6877. [Google Scholar] [CrossRef]
  10. Koirala, A.; Kizhal, A.R.; Roth, B.E. Perceiving Major Problems in Forest Products Transportation by Trucks and Trailers: A Cross-sectional Survey. Eur. J. Forest Eng. 2017, 3, 23–34. [Google Scholar]
  11. Ghaffariyan, M.R.; Acuna, M.; Brown, M. Analysing the effect of five operational factors on forest residue supply chain costs: A case study in Western Australia. Biomass Bioenergy 2013, 59, 486–493. [Google Scholar] [CrossRef]
  12. Tymendorf, Ł.; Trzciński, G. Multi-Factorial Load Analysis of Pine Sawlogs in Transport to Sawmill. Forests 2020, 11, 366. [Google Scholar] [CrossRef] [Green Version]
  13. Schroeder, R.; Jackson, B.; Ashton, S. Biomass Transportation and Delivery. In Sustainable Forestry for Bioenergy and Bio-Based Products: Trainers Curriculum Notebook; Hubbard, W., Biles, L., Mayfield, C., Ashton, S., Eds.; Southern Forest Research Partnership 2007. Inc.: Athens, GA, USA; pp. 145–148. Available online: http://www.forestbioenergy.net/training-materials/training-curriculum-notebook/ (accessed on 20 November 2013).
  14. Sosa, A.; Acuna, M.; McDonnell, K.; Devlin, G. Controlling moisture content and truck configurations to model and optimise biomass supply chain logistics in Ireland. Appl. Energy 2015, 137, 338–351. [Google Scholar] [CrossRef] [Green Version]
  15. Trzciński, G.; Tymendorf, Ł. Deliveries of wood after the normative calculators wood density to determine the weight of the load. Sylwan 2017, 161, 451–459. [Google Scholar]
  16. Liimatainen, H.; Nykänen, L. Impacts of Increasing Maximum Truck Weight—Case Finland; Transport Research Centre Verne, Tampere University of Technology: Tampere, Finland, 2017; Available online: http://www.tut.fi/verne/aineisto/LiimatainenNyk%C3%A4nen.pdf (accessed on 10 January 2021).
  17. Directive (EU) 2015/719 of the European Parliament and of the Council of 29 April 2015 Amending Council Directive 96/53/EC Laying Down for Certain Road Vehicles Circulating within the Community the Maximum Authorised Dimensions in National and International Traffic and the Maximum Authorised Weights in International Traffic (Text with EEA Relevance). Available online: https://publications.europa.eu/en/publication-detail/-/publication/22b313fc-f3bc-11e4-a3bf-01aa75ed71a1/language-en (accessed on 4 September 2022).
  18. Asmoarp, V.; Enström, J.; Bergqvist, M.; von Hofsten, H. Improving Transport Efficiency–Final Report of the ETT 2014–2016 Project. Skogforsk, 2018, Arbetsrapport 962–2018. Available online: https://www.skogforsk.se/contentassets/d036107f3f2c49ff8d1bfb8d9e122ba1/arbetsrapport-962-2018.pdf (accessed on 1 July 2022).
  19. Palander, T.; Haavikko, H.; Kortelainen, E.; Kärhä, K.; Borz, S.A. Improving Environmental and Energy Efficiency in Wood Transportation for a Carbon-Neutral Forest Industry. Forests 2020, 11, 1194. [Google Scholar] [CrossRef]
  20. Liimatainen, H.; Pöllänen, M.; Nykänen, L. Impacts of increasing maximum truck weight—Case Finland. Eur. Transp. Res. Rev. 2020, 12, 14. [Google Scholar] [CrossRef] [Green Version]
  21. Venäläinen, P. Puutavaran ja hakkeen LHT-kuljetusselvitys. Assessment of LHT Transport of Timber and Chips. Metsätehon Rap. 2019, 250, 31. Available online: https://metsateho.fi/wp-content/uploads/Raportti_250_Puutavaran_ja_hakkeen_LHT-kuljetusselvitys.pdf (accessed on 26 September 2022). (In Finnish).
  22. Regulation Regulation of the Minister of Infrastructure of 31 December 2002 on the Technical Conditions of Vehicles and Their Necessary Equipment. Rozporządzenie. Rozporządzenie Ministra Infrastruktury z Dnia 31 grudnia 2002 r. w Sprawie Warunków Technicznych Pojazdów Oraz Zakresu ich Niezbędnego Wyposażenia. Available online: https://isap.sejm.gov.pl/isap.nsf/download.xsp/WDU20160002022/O/D20162022.pdf (accessed on 26 September 2022). (In Polish)
  23. Varin, P.; Saarenketo, T. Effect of Axle and Tyre Configurations on Pavement Durability—A Prestudy. ROADEX 2014. Available online: https://www.roadex.org/wp-content/uploads/2014/01/ROADEX_Axle_Tyre_Prestudy_15102014-Final.pdf (accessed on 26 September 2022).
  24. Pekkala, V. Tien Rasitukset Tieverkossa HCT- ja Muiden Puunkuljetusyhdistelmien Vaikutusten Vertailu. University of Oulu 2018. Loppuraportti 15.8.2018. Available online: https://www.metsateho.fi/wp-content/uploads/Tien_rasitukset_tieverkossa_LOPPURAPORTTI_20180825_VPe.pdf (accessed on 26 September 2022). (In Finnish).
  25. özturk, T.; Şentürk, N. Analisis of Pavement Construction on a Sample Forest Road Section in Sariyer Region. İstanbul Üniversitesi Orman Fakültesi Dergisi. Seri A 2009, 59, 55–70. [Google Scholar]
  26. Judycki, J. Equivalent axle load factors for design of rigid pavements derived from fatigue criteria. Balt. J. Road Bridge Eng. 2011, 6, 219–224. [Google Scholar] [CrossRef]
  27. Baumgras, J.E. Better load-weight distribution is needed for tandem-axle logging trucks. Res. Pap. NE-342. Upper Darby, PA: U.S. Department of Agriculture, Forest Service, Northeastern Forest Experiment Station. 1976, 9p. Available online: https://www.fs.usda.gov/ne/newtown_square/publications/research_papers/pdfs/scanned/OCR/ne_rp342.pdf (accessed on 10 September 2022).
  28. Owusu−Ababio, S.; Schmitt, R. Analysis of Data on Heavier Truck Weights. Case study of logging trucks. Transp. Res. Rec. J. Transp. Res. Board 2015, 2478, 82–92. [Google Scholar] [CrossRef]
  29. Šušnjar, M.; Horvat, D.; Pandur, Z.; Zorić, M. Axle Load Determination of Truck with Trailer and Truck with Semitrailer for Wood Transportation. Croat. J. For. Eng. 2011, 32, 379–388. [Google Scholar]
  30. Näsärö, O.P.; Korpilahti, A. Puutavarayhdistelmien Akselimassat ja Luormatilan Loko. (Axle Masses and Load Space of Timber Trucks.) Metsätehon Tuloskalvosarja 2015, 9/2015, 25p. Available online: https://metsateho.fi/wp-content/uploads/Tuloskalvosarja_2015_09_Puutavarayhdistelmien_akselimassat_2015_ak.pdf (accessed on 10 September 2022). (In Finnish).
  31. Trzciński, G.; Moskalik, T.; Wojtan, R. Total weight and axle loads of truck units in the transport of timber depending on the timber cargo. Forests 2018, 9, 164. [Google Scholar] [CrossRef] [Green Version]
  32. Owusu-Ababio, S.; Schmitt, R. Evaluation of Impacts of Allowing Heavier Log Loads in Northern Wisconsin During Spring Thaw. Wiscontin DOT. Putting Reserch To Work. 2014. Available online: https://wisconsindot.gov/documents2/research/WisDOT-Policy-Research-0092-11-16-final-report.pdf (accessed on 10 September 2022).
  33. Abeney, E.A. Timber transport by road in Ghana. Ghana J. For. 2003, 11, 52–60. Available online: https://www.fornis.net/sites/default/files/documents/Timber_transport.pdf (accessed on 10 October 2022).
  34. Hamsley, A.; Greene, W.G.; Siry, J.; Mendell, B. Improving timber trucking performance by reducing variability of log truck weights. South. J. Appl. For. 2007, 31, 12–16. [Google Scholar] [CrossRef] [Green Version]
  35. Brunos, P.; Ryś, D. The Effect of Flexible Pavement Mechanics on the Accuracy of Axle Load Sensors in Vehicle Weigh-in-Motion Systems. Sensors 2017, 17, 2053. [Google Scholar] [CrossRef] [PubMed] [Green Version]
  36. Burnos, P.; Gajda, J.; Sroka, R.; Wasilewska, M.; Dolega, C. High Accuracy Weigh-In-Motion Systems for Direct Enforcement. Sensors 2021, 21, 8046. [Google Scholar] [CrossRef]
  37. NIK. Wykonywanie Wybranych Zadań Przez Inspekcję Transportu Drogowego z Uwzględnieniem Funkcjonowania Centralnej Ewidencji Naruszeń (Performing Selected Tasks by the Road Transport Inspection, Taking into Account the Functioning of the Central Register of Violations). KAP-4101-003-00/2014. Najwyższa Izba Kontroli. 2014. Warsaw, Poland. Available online: https://www.nik.gov.pl/kontrole/wyniki-kontroli-nik/pobierz,kap~p_14_006_201407010932241404207144~01,typ,k.pdf (accessed on 10 October 2022). (In Polish)
  38. Gajda, J.; Sroka, R.; Burno, P. Sensor Data Fusion in Multi-Sensor Weigh-In-Motion Systems. Sensors 2020, 20, 3357. [Google Scholar] [CrossRef]
  39. Martin, A.M.; Owende, P.M.O.; O’Mahony, M.J.; Ward, S.M. Estimation of the Serviceability of Forest Access Roads. Int. J. For. Eng. 1999, 10, 55–61. [Google Scholar]
  40. Šušnjar, M.; Horvat, D.; Zorić, M.; Pandur, Z.; Vusić, D.; Tomašić, Ž. Comparison of Real Axle Loads and Wheel Pressure of Truck Units for Wood Transportation with Legal Restrictions. Pushing the Boundaries with Research and Innovation in Forest Engineering. FORMEC 2011, 9–13 October 2011, Graz, Austria. Available online: https://www.formec.org/images/proceedings/2011/formec2011_paper_susnjar_etal.pdf (accessed on 10 October 2022).
  41. Egger Wood Purchasing. A Partnership Approach to Wood Supply. Available online: https://www.egger.com/shop/en_GB/wood-purchasing/downloads (accessed on 26 September 2022).
  42. EMS—EGGER Management System. Responsible Editor Valid until Revision Classification Page. Raw Wood Material for ProDuction and Biomass. PW-ZDBIS007—RL—EN. Available online: https://www.egger.com/shop/pl_PL/support/downloads (accessed on 26 September 2022).
  43. Mikołajczak, E. The Profitability of Converting Sawmill by-Products into Energy. Drewno. Pract. Nauk. Donies. Komunik. 2012, 55, 188. Available online: http://drewno-wood.pl/archiwum/nr-188-2012 (accessed on 26 September 2022).
  44. FAO, ITTO and United Nations. Forest Product Conversion Factors. Rome. 2020. [CrossRef]
  45. Francescato, V.; Antonini, E.; Beromi, L.Z.; Metschina, C.; Chamber, S.; Schnedl, C.; Krajnc, N.; Gradziuk, P.; Koscik, K.; Nocentini, G.; et al. Wood Fuels Handbook. Production, Quality Requirements, Tradin. Biomass Trade Cetres. 2008. Available online: https://forestry.msuextension.org/wood-burning/pellets/WOOD_FUELS_HANDBOOK_BTC_EN.pdf (accessed on 10 September 2022).
  46. Trziński, G.; Tymendorf, Ł. Axle Load of Round Wood Transport Vehicles in Relation to Wood Assortment. The 3rd International Electronic Conference on Forests. Exploring New Discoveries and New Directions in Forests. 15–31 October 2022. Available online: https://sciforum.net/manuscripts/13043/slides.pdf (accessed on 10 November 2022).
  47. Trzciński, G.; Sieniawski, W. The Impact of Timber Haulage on Loading of Forest Roads. In Raport 12/2010; Norwegian Forest and Landscape Institute: Honne, Norway, 2010; pp. 21–23. Available online: https://nibio.brage.unit.no/nibio-xmlui/bitstream/handle/11250/2469357/SoL-Rapport-2010-12.pdf?sequence=2&isAllowed=y (accessed on 10 November 2022).
  48. Mackenzie, C.J.T. The Use of Low Ground Pressure Vehicles for Timber Extraction on Forest and Weak Public Roads. Highland Timber Transport Group. Timber Transport Forum. Edinburgh. 2008.
  49. Šušnjar, M.; Pandur, Z.; Bačić, M.; Zorić, M. Raspodjela mase tovara i osovinskoga opterećenja šumskih kamionskih skupova pri prijevozu jelova celuloznoga drva. (Distribution of Load Masses and Axle Loads on Forest Truck Units during Transport of Fir Pulpwood). Nova Meh. Sumar. 2016, 37, 256568. Available online: https://hrcak.srce.hr/file/256568 (accessed on 10 November 2022).
  50. Trzciński, G.; Tymendorf, Ł.; Kozakiewicz, P. Parameters of Trucks and Loads in the Transport of Scots Pine Wood Biomass Depending on the Season and Moisture Content of the Load. Forests 2021, 12, 223. [Google Scholar] [CrossRef]
  51. Johansson, J.; Liss, J.-E.; Gullberg, T.; Björheden, R. Transport and handling of forest energy bundles—Advantages and problems. Biomass Bioenergy 2006, 30, 334–341. [Google Scholar] [CrossRef]
  52. Laitila, J.; Routa, J. Performance of a small and a medium sized professional chippers and the impact of storage time on Scots pine (Pinus sylvestris) stem wood chips characteristics. Silva Fenn. 2015, 49, 1382. [Google Scholar] [CrossRef]
  53. Kärhä, K.; Seuri, M.; Donagh, P.M.; Acuna, M.; Kanzian, C.; Petković, V.; Costa, L.H.S.; Krumov, T.; Bradley, A.; Röser, D.; et al. Global overview of industrial roundwood road transport. In Proceedings of the International Conference of Forest Engineering COFE-FORMEC-IUFRO 2022—One Big Family: Shaping Our Future, Oregon State University, Corvallis, OR, USA, 4–7 October 2022. [Google Scholar]
  54. ITF. Permissible Maximum Weights of Lorries in Europe. ITF 2019. Available online: https://www.itf-oecd.org/sites/default/files/docs/weights-2019.pdf (accessed on 10 October 2022).
  55. Strandström, M. Metsähakkeen Tuotantoketjut Suomessa Vuonna 2017. (Production Chains of Forest Chips in Finland in 2017). Metsätehon Tuloskalvosarja 2018, 11, 20. Available online: https://www.metsateho.fi/wp-content/uploads/Tuloskalvosarja_2018_11_Metsahakkeen_tuotantoketjut_2017.pdf (accessed on 10 November 2022). (In Finnish).
  56. Venäläinen, P.; Poikela, A. Puutavara- ja Hakeajoneuvojen Massojen Noston Vaikutukset. Metsäteho Oy. 2020, 258, 1–78. Available online: https://www.metsateho.fi/wp-content/uploads/Raportti-258-Puutavara-ja-hakeajoneuvojen-massojen.pdf (accessed on 10 October 2022). (In Finnish).
Figure 1. Transported sawmill by-product assortments: (a) wood chips, (b) sawdust, (c) slabs, (d) recycled wood.
Forests 13 01992 g001
Figure 2. Weighing the truck to determine the GVW and tare.
Forests 13 01992 g002
Figure 3. Measurement of the load of the individual axles of the transport set made by the platform scales model DINI ARGEO WWSD.
Forests 13 01992 g003
Figure 4. Characteristics of the transport sets depending on the sawmill by-product assortment: (a) GVW, (b) tare, (c) semi-trailer capacity, (d) usage of the semi-trailer capacity. Groups with dissimilar lower-case letters (a, b, over the x-axis) indicate significant differences, according to a Kruskal–the Wallis test or Dunn’s multi-sample rank mean comparison test.
Forests 13 01992 g004
Figure 5. Characteristics of the deliveries depending on the sawmill by-product assortment: (a) bulk cubic meter, (b) weight of load. Groups with dissimilar lower-case letters (a, b, c, over the x-axis) indicate significant differences, according to a Kruskal–Wallis test or Dunn’s multi-sample rank mean comparison test.
Forests 13 01992 g005
Figure 6. Distribution of the axle loads in the transport sets, according to: (a) transport set (TT(6)-six-axle set), (b) sawmill by-products assortment load. Groups with similar lower-case letters (a, b, c, d, under the box plots) indicate significant similarities, according to a Mann–Whitney test, Kruskal–Wallis test or Dunn’s multi-sample rank mean comparison test.
Forests 13 01992 g006
Figure 7. Axle load in five-axle sets, depending on the sawmill by-product assortments: (a) track and semi-trailer, (b) truck and trailer. Groups with similar lower-case letters (a, b, c, d, under the box plots) indicate significant similarities, according to a Kruskal–Wallis test or Dunn’s multi-sample rank mean comparison test.
Forests 13 01992 g007
Figure 8. Distribution of the total gross vehicle weight of the transport set on its axles. Groups with similar lower-case letters (a, b, c, under the box plots) indicate significant similarities, according to a Kruskal–Wallis test or Dunn’s multi-sample rank mean comparison test.
Forests 13 01992 g008
Table 1. Characteristics of the parameters of the transport sets with sawmill by-products.
MeasureMeanSDMinMaxQ1MedianQ3
Gross vehicle weight (t)39.253.4125.8249.1638.3039.5440.08
Tare (t)16.812.1414.124.615.0616.0216.78
Semi-trailer capacity (m3)90.432.9175.9494.1690.0391.3092.00
Bulk cubic meter
(bulk m3)
75.259.0849.3995.1669.5574.3282.56
Weight of load (t)22.444.033.1332.9221.7423.2624.00
Usage of the semi-trailer capacity0.850.090.611.030.780.840.91
Notes: SD—standard deviation, Q1—first quartile, Q3—third quartile.
Table 2. Statistical characteristics of the load on individual axles in the transport sets.
Truck Unit
Measurements
Number of AxlesAxle Load Values (t)
AxleMeanSDMinMaxQ1Median Q3
197 Truck and semi-trailer (TST)five-axle16.850.485.458.096.506.887.22
210.290.987.0413.879.7210.1210.70
37.700.814.899.847.227.808.20
47.830.824.369.967.237.708.18
57.650.844.579.967.207.708.14
23 and 6 Truck and trailer (TT)five-axle16.790.855.458.786.096.607.28
29.631.357.0312.498.879.6810.52
37.591.764.1810.286.507.309.09
47.011.133.879.306.657.387.60
57.041.394.6310.456.216.857.95
six-axle16.781.175.328.656.066.417.64
28.731.317.0010.427.828.5410.08
37.330.746.128.296.957.487.68
46.750.446.187.186.226.927.08
56.720.975.288.236.326.717.08
66.940.576.347.966.616.767.21
Notes: SD—standard deviation, Q1—first quartile, Q3—third quartile, axle 1–3 truck, axle 1–2 truck.
Table 3. Spearman correlation coefficients between the axle load and the GVW.
Transport Set
TTTST
axle 1-0.3229
axle 20.68590.6046
axle 30.44040.6102
axle 40.80150.6069
axle 50.68150.6692
No statistically significant correlation.
Publisher’s Note: MDPI stays neutral with regard to jurisdictional claims in published maps and institutional affiliations.

