

CO2 Emissions Accounting and Carbon Peak Prediction of China’s Papermaking Industry

Abstract
:1. Introduction
2. Materials and Methods
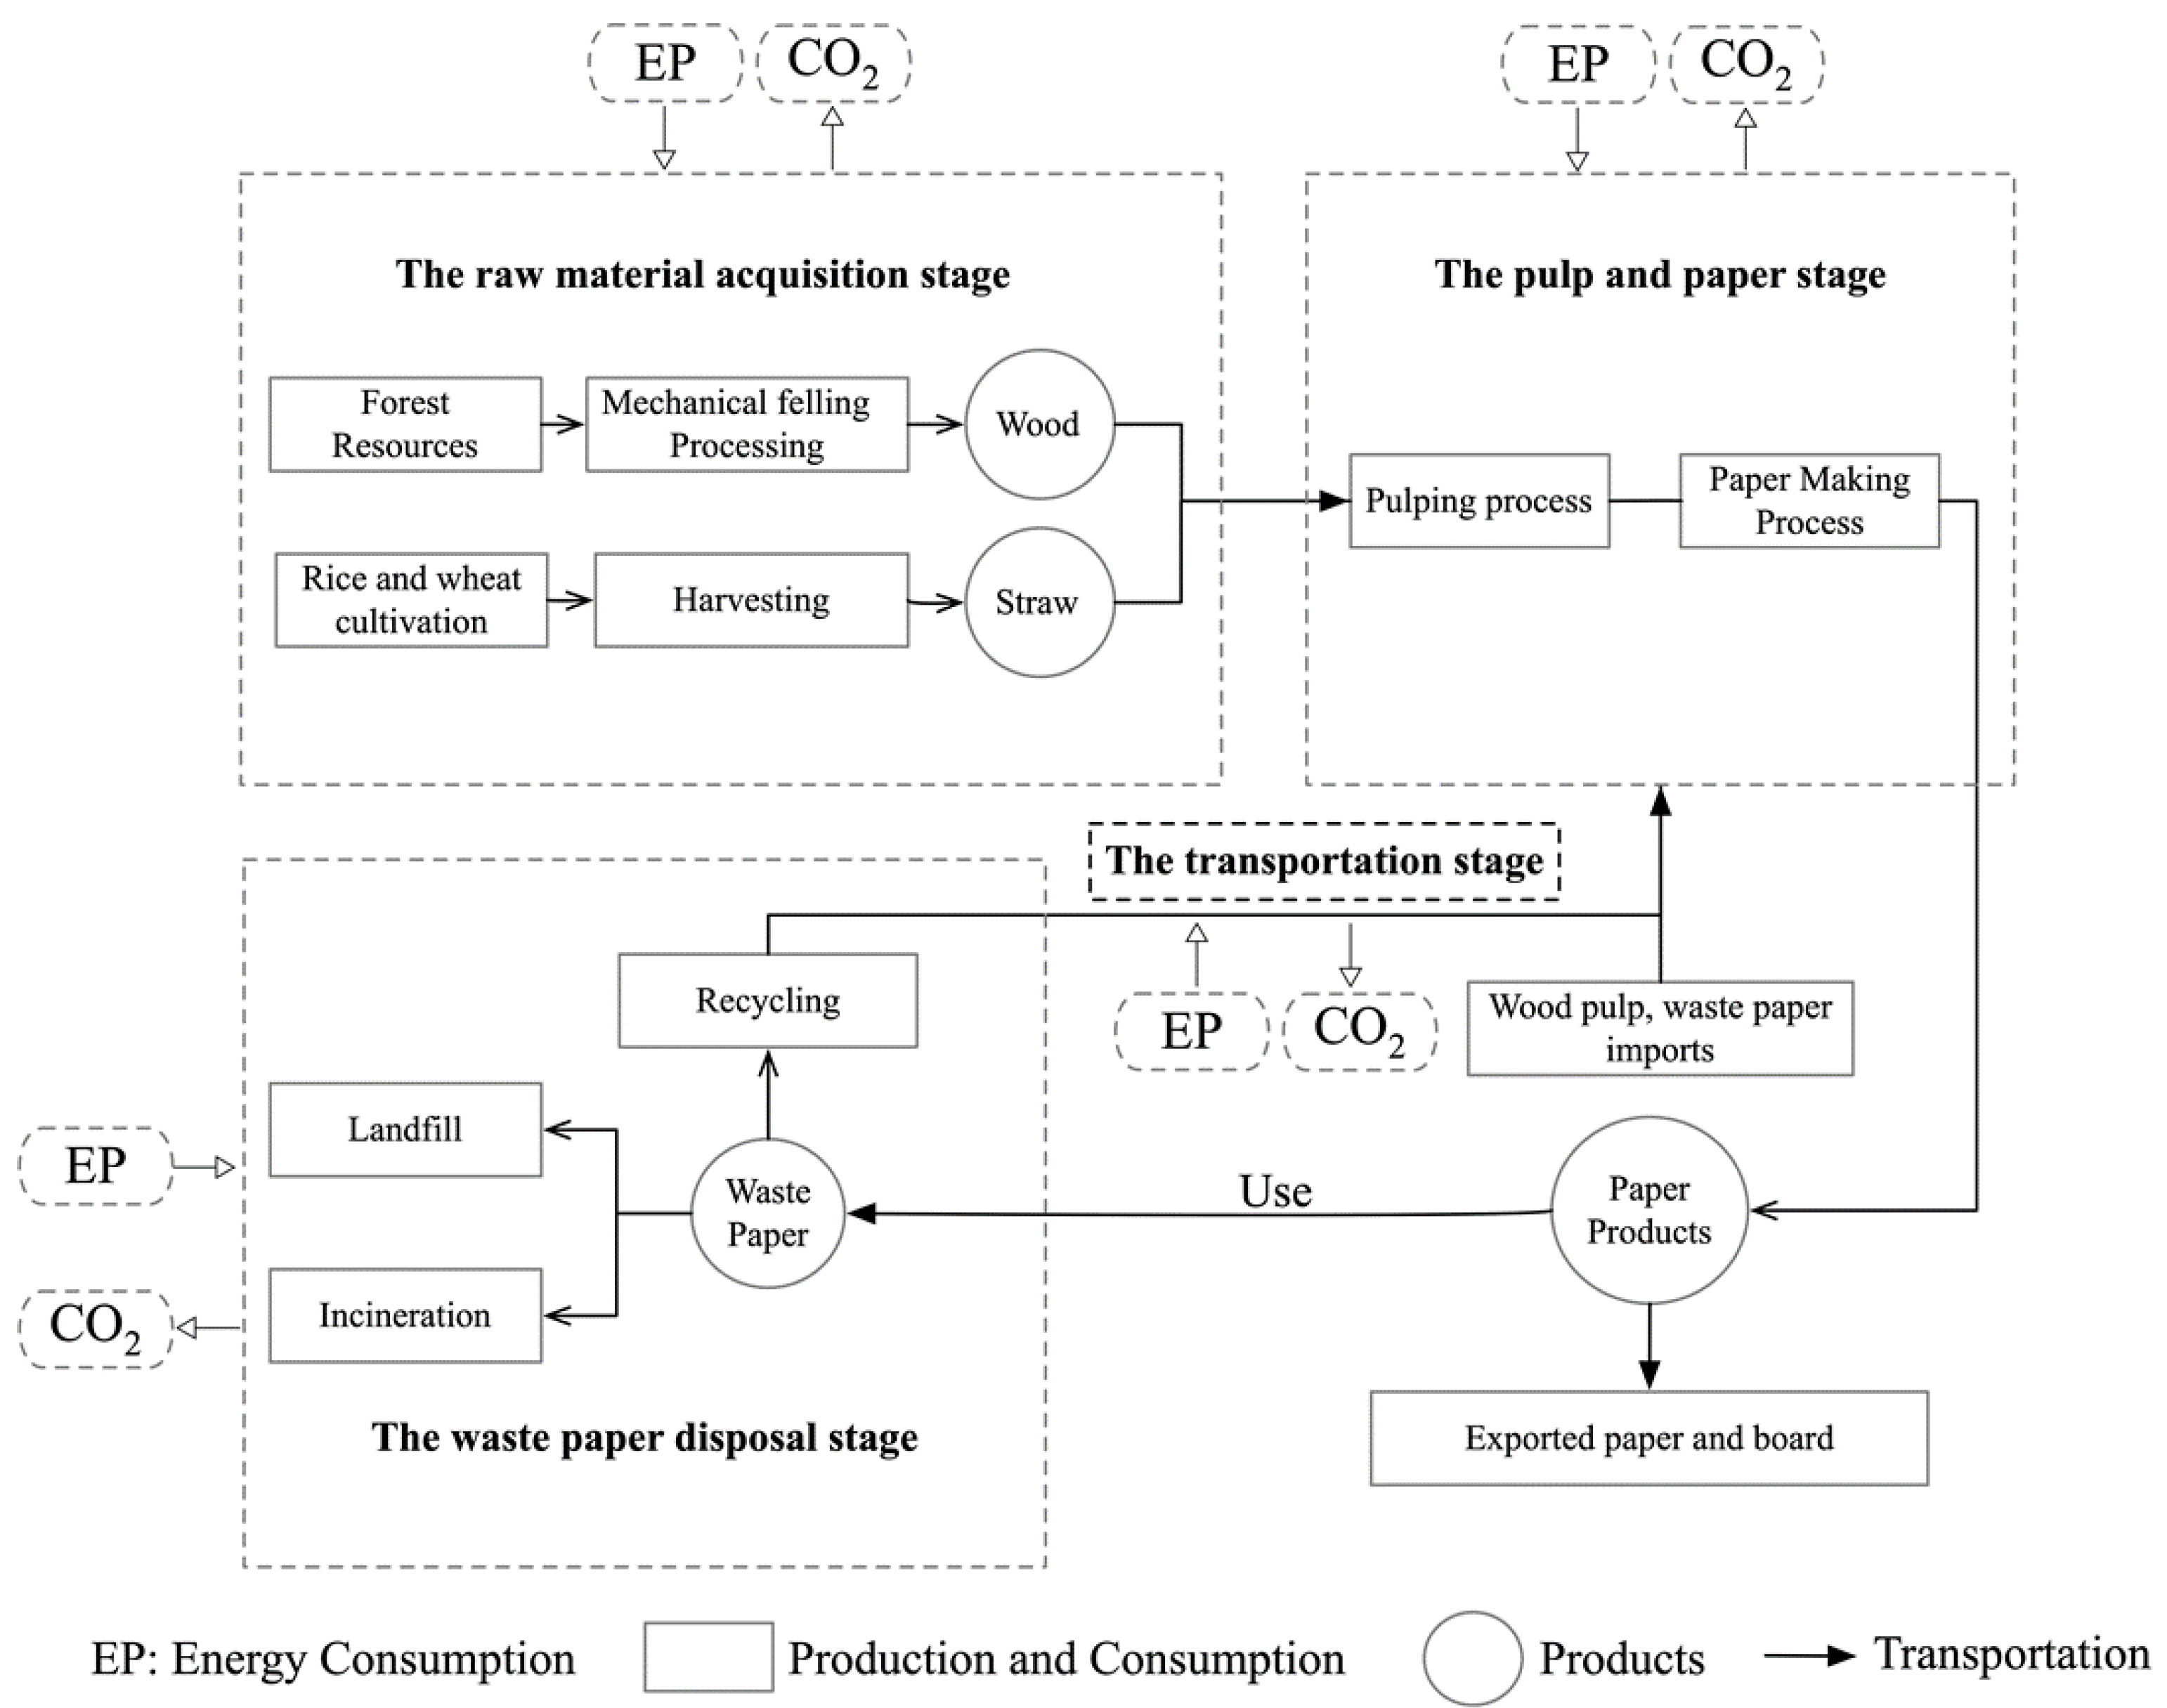
2.1. System Boundary and CO2 Emission Source Determination
2.1.1. System Boundary
2.1.2. CO2 Emission Source Determination
- (1)
- The raw material acquisition stage. China’s paper raw materials are currently dominated by waste pulp followed by wood pulp, with non-wood pulp consuming the lowest percentage. Non-wood pulp originates from domestic production, while waste pulp and wood pulp originate from domestic production and imports. The CO2 emissions from the production or import of the three raw materials are defined in Table 1 below.
- (2)
- The pulp and paper stage. This stage is the process of pulp processing to produce paper and paperboard, which involves CO2 emissions including fuel combustion emissions, chemical decomposition emissions, and electricity and heat consumption emissions. The research boundary of the pulp and paper stage is based on the accounting standards for greenhouse gas emissions from the papermaking industry defined in the “Greenhouse Gas Emissions Accounting Methodology and Reporting Guidelines for Paper and Paper Products Producers in China (for Trial Implementation)”. Additionally, the amount of CO2 emissions due to fuel combustion was accounted for according to Zhang et al. [9], and Peng et al. [27].
- (3)
- The waste paper disposal stage. Drawing on the research results of Gonzalez-Garcia et al., Ghose et al., and Geme chu [22,28,29], the core aspects of raw material input, production, and product output in the transportation phase of paper products are included in the accounting boundary. Among them, raw material input transportation includes pulp raw materials from domestic origin or foreign imports transported to the pulp and paper enterprises and after the use of waste paper recycling transported to the pulp and paper enterprises recycling; product output transportation includes finished paper and paperboard from the production enterprises transported to the paper products suppliers, distributors, individual consumers or export transported to other countries. Under the consumer responsibility principle, CO2 emissions from the export transportation of paper and paperboard should be borne by the importing country of paper and paperboard, and this part of CO2 emissions is not included in the transportation phase of paper products. Due to the availability of data, CO2 emissions from the export transportation of the product to the consumer are difficult to calculate, and the part of the production process that involves transportation from the workshop is neglected.
- (4)
- The transportation stage. China’s waste paper disposal mainly has three ways: landfill, incineration, and recycling [23]. Waste paper recycling and utilization is an important part of the closed-loop material flow of “resource consumption-products-renewable resources” in the papermaking industry, and the CO2 generated from recycling is included in the transportation stage. For the convenience of estimation, it is assumed that the waste paper is landfilled or incinerated in the open air without fixed concentration points, and methane recovery is not considered in the landfilling process, so the CO2 released in the landfilling or incineration process is mainly accounted for in the waste paper disposal stage.

| Raw Materials | Origins | Notes |
|---|---|---|
| Wood pulp | Domestic timber harvesting and transportation | The proportion of foreign imported wood used for furniture manufacturing is high, and only a small portion of it is used for pulp and paper making, so the CO2 generated from the transportation of this part of imported wood is negligible. The CO2 generated in the process of forest plantation can be absorbed by its own photosynthesis, so we do not calculate CO2 emissions from forest plantation, but only calculate CO2 emissions from domestic harvesting of wood for pulp and paper production. |
| Foreign wood pulp import | Wood pulp imported from abroad is mainly involved in transportation distance and transportation volume, so CO2 generated from imported wood pulp is included in the transportation phase for calculation. | |
| Non-wood pulp | Domestic production | Among non-wood pulp, rice-wheat straw pulp has always accounted for the highest percentage [6], so we mainly calculate the CO2 emissions from the rice-wheat straw pulp feedstock acquisition process, and then estimate the CO2 emissions from the non-wood pulp feedstock acquisition process based on the percentage of rice-wheat straw pulp. |
| Waste paper pulp | Domestic recycling and foreign import of waste paper | Both domestic waste paper recycling and foreign waste paper import mainly involve transportation, so this portion of CO2 emissions are included in the transportation phase. |
2.2. Calculation Method
2.2.1. Accounting for CO2 Emissions in the Raw Material Acquisition Stage
Timber Harvesting Process
- ①
- Logging and timbering operations:
- ②
- Mechanical ropeway skidding operations:
- ③
- Material transport operations:
The Process of Obtaining Raw Materials for Rice and Wheat Straw Pulp
2.2.2. Accounting for CO2 Emissions in the Pulp and Paper Stage
2.2.3. Accounting for CO2 Emissions in the Waste Paper Disposal Stage
- (1)
- CO2 emission accounting method for the transportation process of imported paper raw materials
- (2)
- CO2 emission accounting method for domestic waste paper recycling and transportation process
2.2.4. Accounting for CO2 Emissions in the Transportation Stage
- (1)
- Open landfill
- (2)
- Open burning
2.2.5. Accounting Methods for Export Paper and Paperboard CO2 Emissions
2.3. List of Data and Sources
- (1)
- The raw material acquisition stage. The amount of wood used in the process of acquiring wood pulp is equivalent to the amount of timber used for paper making, data of which is taken from the “China Forestry Statistical Yearbook 2000–2020” (national production of major timber and bamboo). The average fuel consumption for logging for timber, skidding, and transporting timber was referred to the data in the research results of Yuan Zhou et al. [37], and the cableway length and distance for transporting timber were adopted from the field research conducted by Zhang et al. [38] on southern plantation forests. As for the non-wood pulp acquisition process, non-wood pulp and rice-wheat straw pulp production data were drawn from the “China Papermaking Industry Annual Report (2001–2020). The parameters of the amount of straw resources consumed per unit of rice-wheat straw pulp output were referred to the data of Zhang [39] who investigated the non-wood pulp production lines of Yongfengyu enterprises. Paper straw availability coefficient and straw collectability coefficient were adopted from the research results of Sun et al. and Li Zhongzheng [40,41]. The straw-to-grain ratio (straw coefficient) was selected as the average of the straw coefficient of rice in China by Wang [42]; data on total rice production and total planted area in China during the study period were obtained from the China Rural Statistical Yearbook (2000–2020) [43] (planted and farmed area and production of major agricultural products). Statistics on various agricultural inputs during rice cultivation and cultivation up to harvesting were taken from the National Compilation of Information on Costs and Returns of Agricultural Products (2001–2020) [44]. The CO2 emission factors of agricultural inputs such as fertilizers, pesticides, agricultural films, and seeds were obtained from the data of Huang et al., Wang et al., and Xue et al. [30,45,46], respectively.
- (2)
- The pulp and paper stage. Energy consumption data for the study period was obtained from the China Statistical Yearbook (2000–2020) [3]. Energy types were classified into nine categories according to the China Energy Yearbook: coal, coke, crude oil, gasoline, kerosene, diesel, fuel oil, natural gas, and electricity, and the CO2 emission coefficients of various energy sources were adopted from the Guide to Provincial Greenhouse Gas Inventory Preparation (for Trial Implementation) [47]. The electricity CO2 emission factor is the average value of CO2 emissions per unit of electricity supply in the six regions of China and Hainan Province in the reference list.
- (3)
- The transportation stage. Data on pulp and waste paper imports and country of import for the study period were obtained from the UN Trade Database https://comtrade.un.org/data (accessed on 25 December 2021). China needs to import large amounts of paper raw materials from abroad. The pulp or paper scrap exporting countries with the highest export volumes and the sum of their export volumes accounting for more than 90% of China’s total pulp or paper scrap imports were selected as the main importers of paper raw materials into China. The distance between the largest port of the importing country and the Chinese port of Shanghai was referred to as the water transport distance as indicated on the website of the International Cargo Exchange https://www.searates.com (accessed on 25 December 2021). For the main paper and paperboard-producing provinces, we referred to the “China Papermaking Industry 2000–2020 Annual Report” [6] and selected 16 provinces and cities such as Shandong, Zhejiang, Guangdong, and Jiangsu, whose combined production of paper and paperboard accounted for more than 95% of the total paper and paperboard production in China during the study period. The actual distance data between the main importing ports to the provincial capitals of the main paper and paperboard production areas and to the provincial capitals of main waste paper recycling sites were based on the Baidu map, and ArcGIS was used to calculate the spherical distance between points. The data on waste paper recycling volume were obtained from the China Paper Yearbook (2000–2020) [48], and the CO2 emission factors of each transportation mode were referred to the “European Communities Trade Mark Association’s Guidelines for Measuring and Managing CO2 Emission from Freight Transport Operations” [31].
- (4)
- The waste paper disposal stage. There is relatively less literature available about the percentage of waste paper recycling, landfill, and incineration. In our paper, the proportion of landfill and incineration of domestic waste to the total domestic waste disposal in China from 2000 to 2020, respectively, was used as the landfill rate and incineration rate of waste paper, from which the amount of landfill and incineration of waste paper was derived [23]. Data on domestic waste disposal in China during the study period were obtained from the China Statistical Yearbook of Urban Construction (2000–2020) [49] (information on the national urban sanitation subgroup). The data parameters such as utilized in the accounting process were referred to as the National Greenhouse Gas Emission Inventory Guidelines and the Provincial Greenhouse Gas Inventory Preparation Guidelines (for Trial Implementation) [47].
3. Results
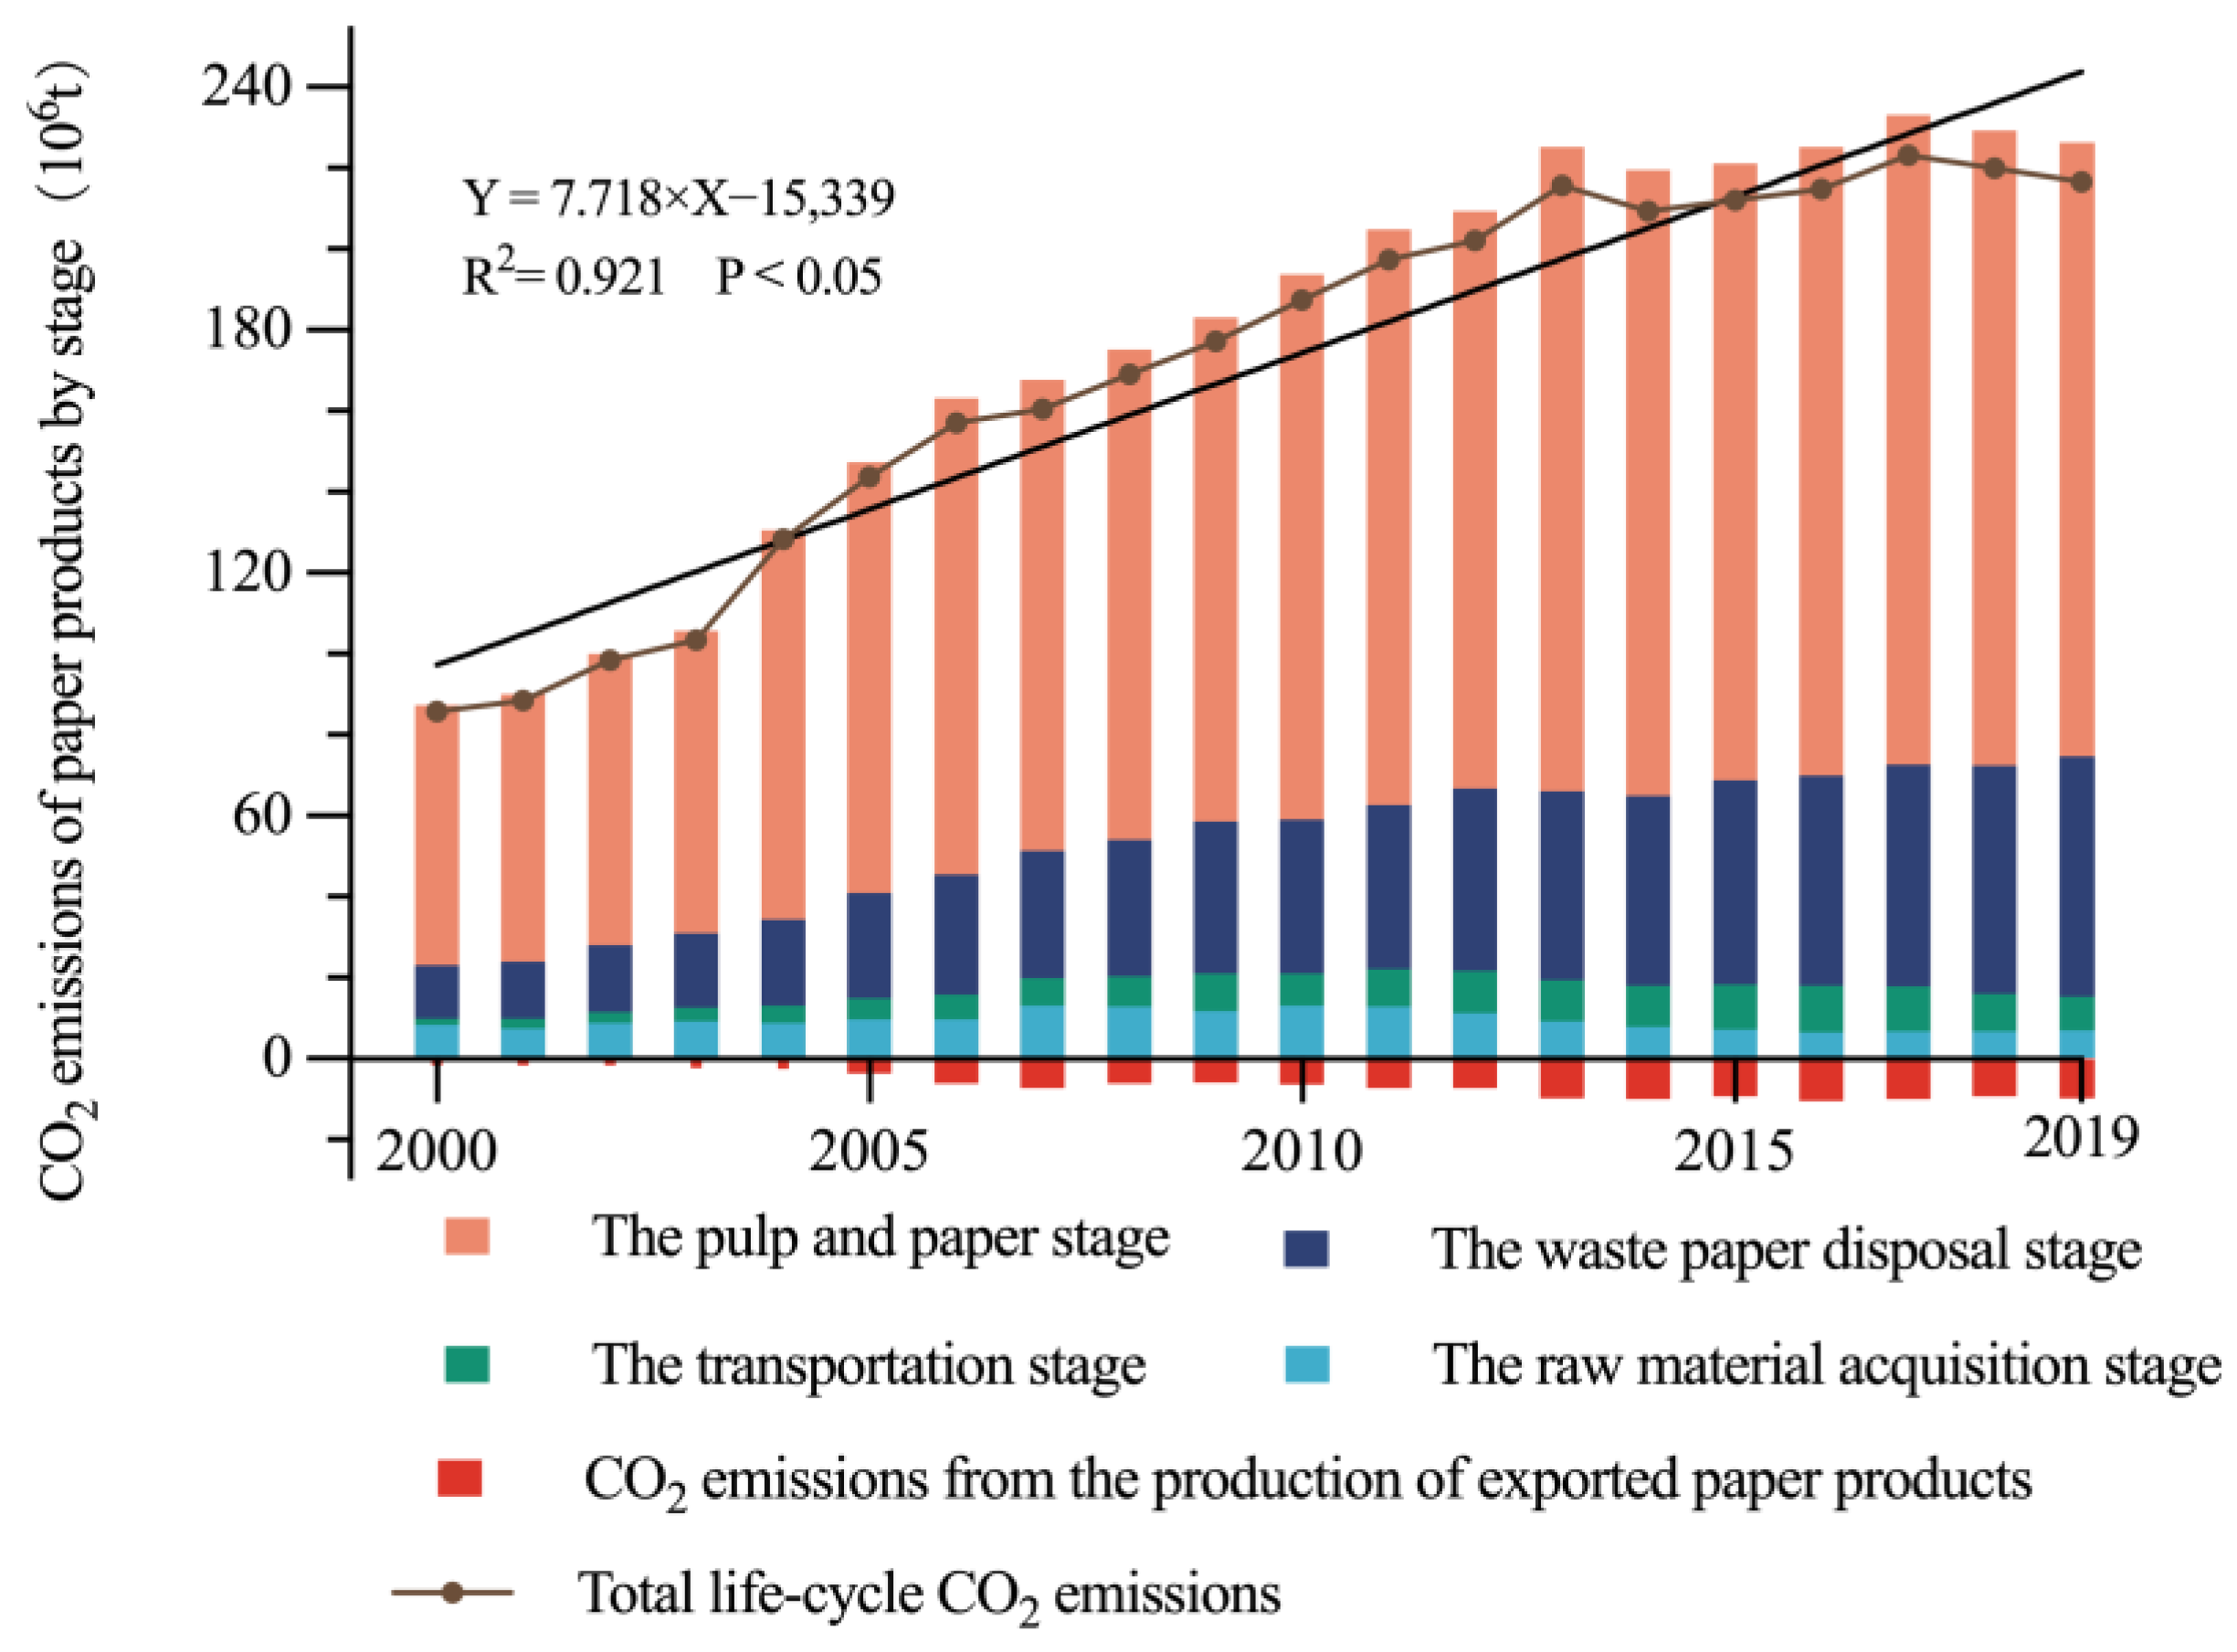
3.1. Overall CO2 Emission Status
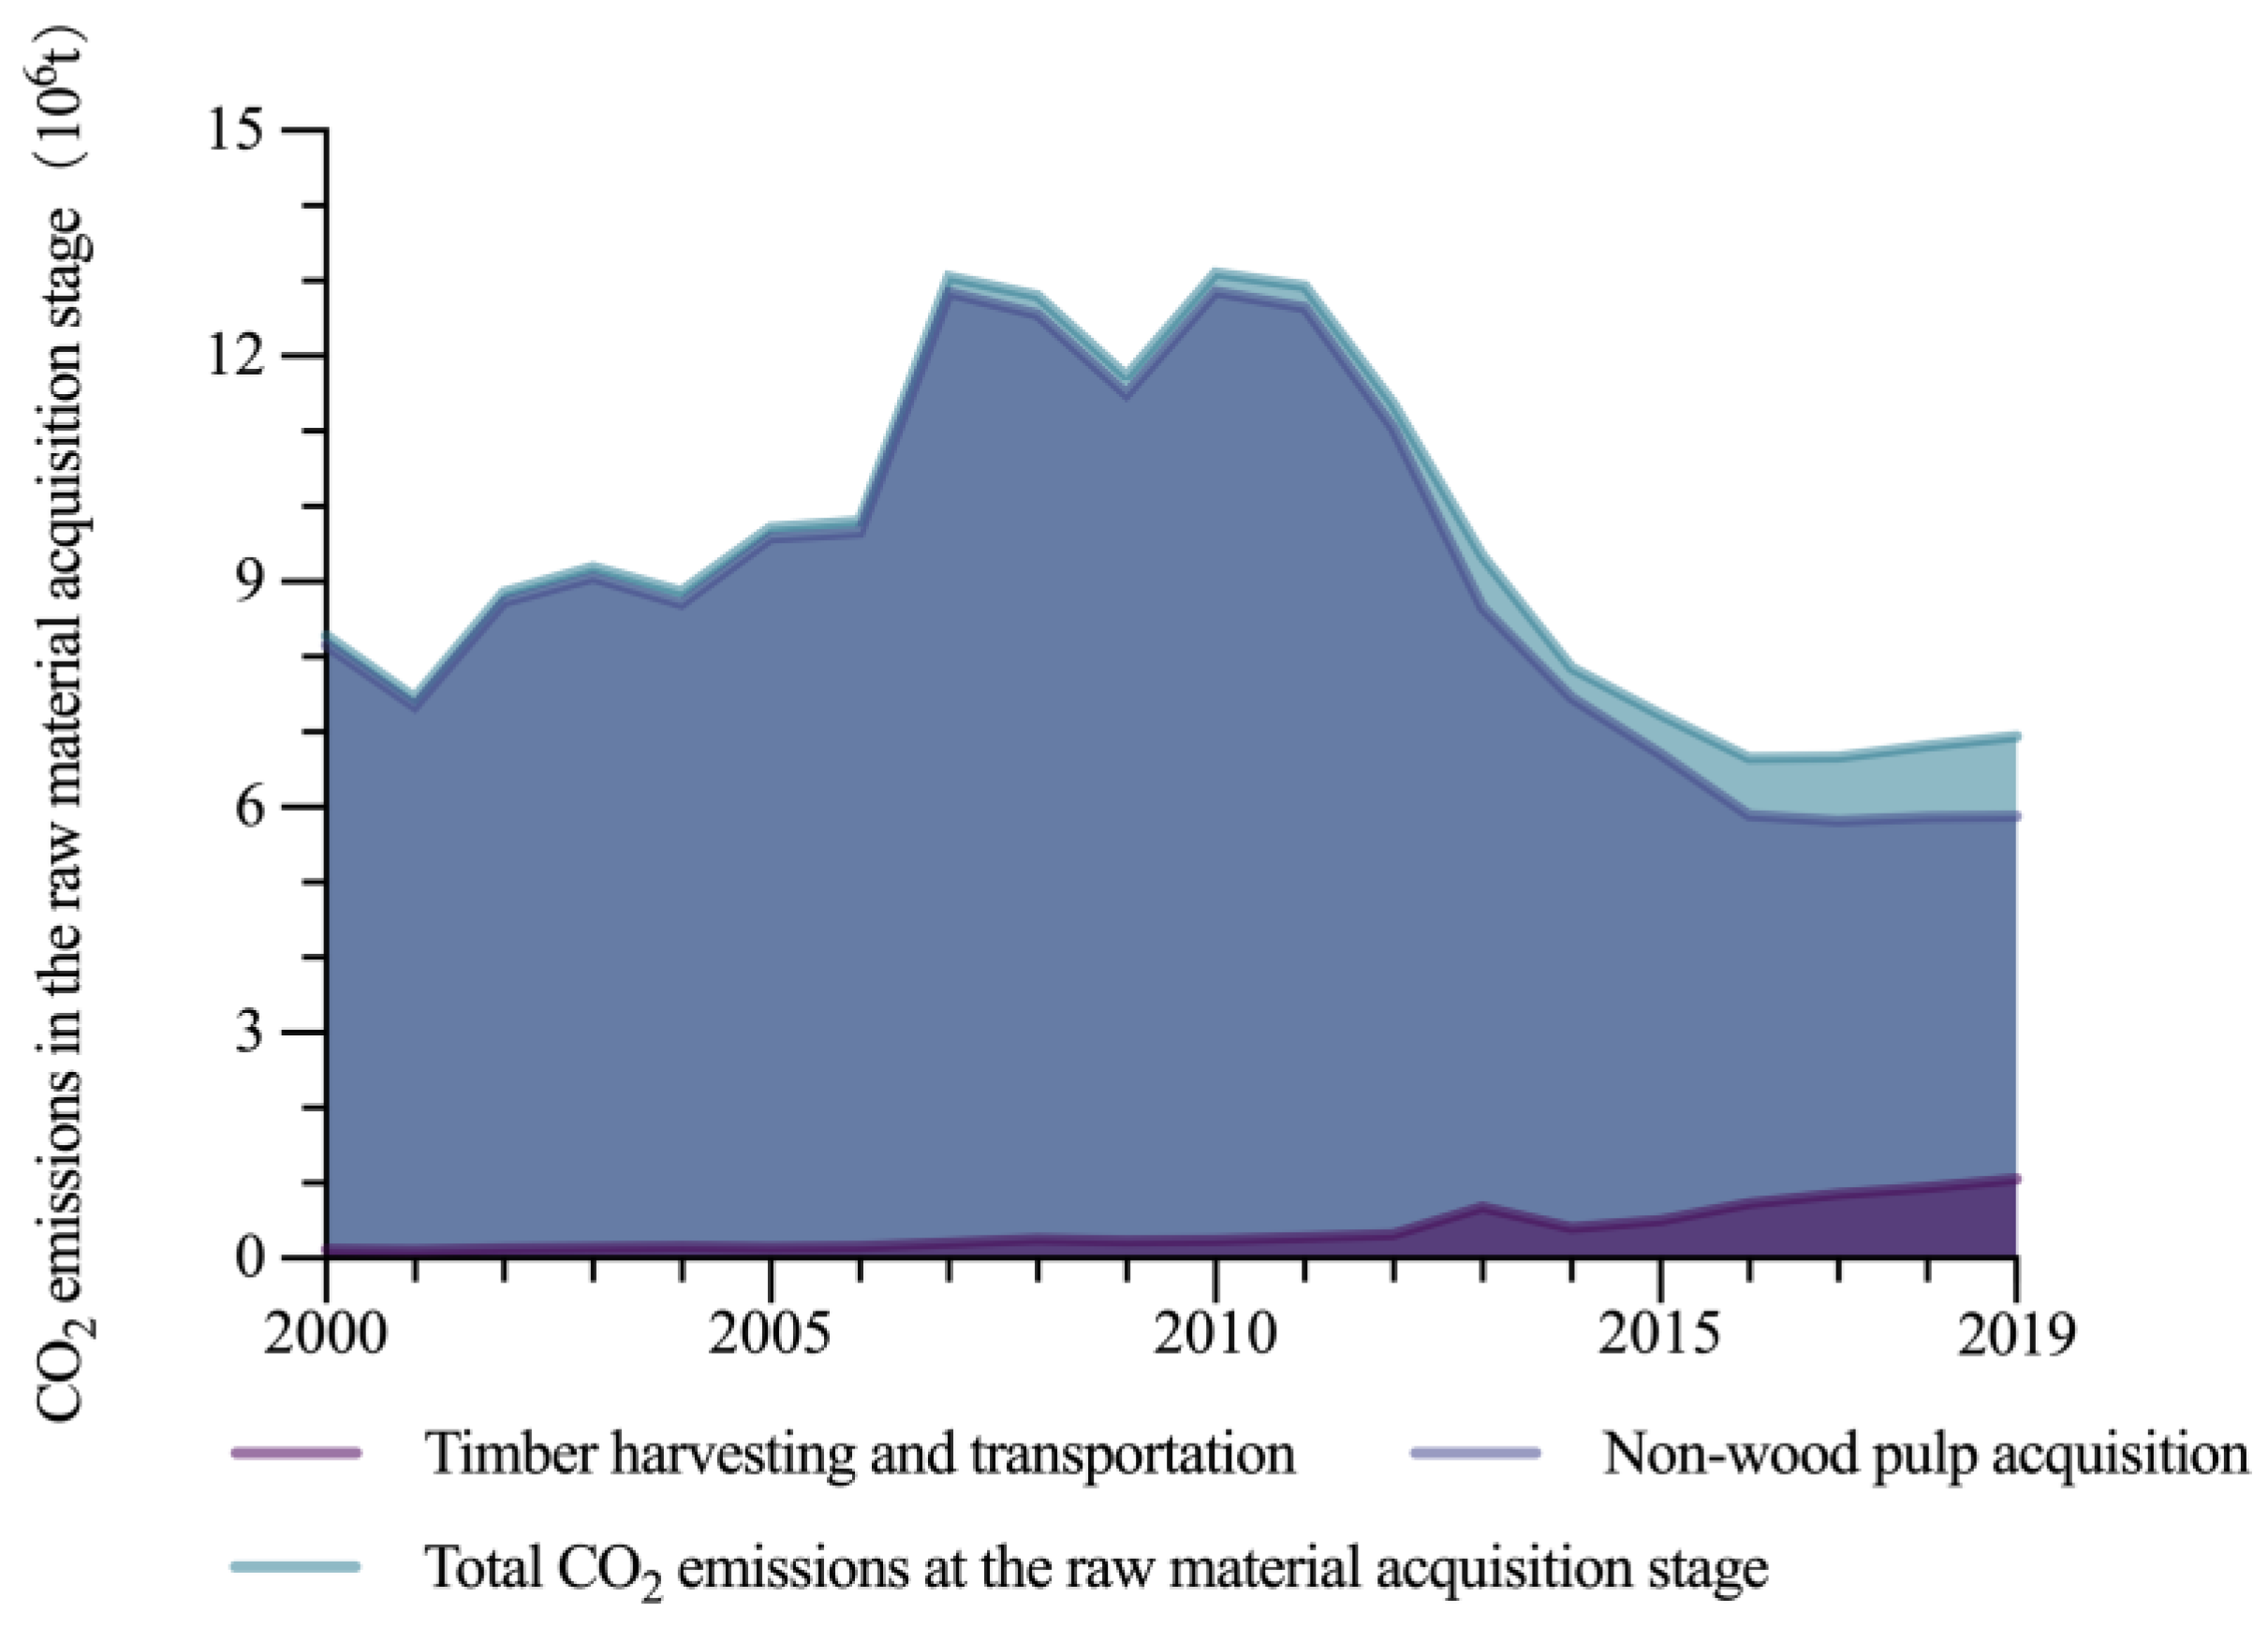
3.2. CO2 Emission Status of the Raw Material Acquisition Stage
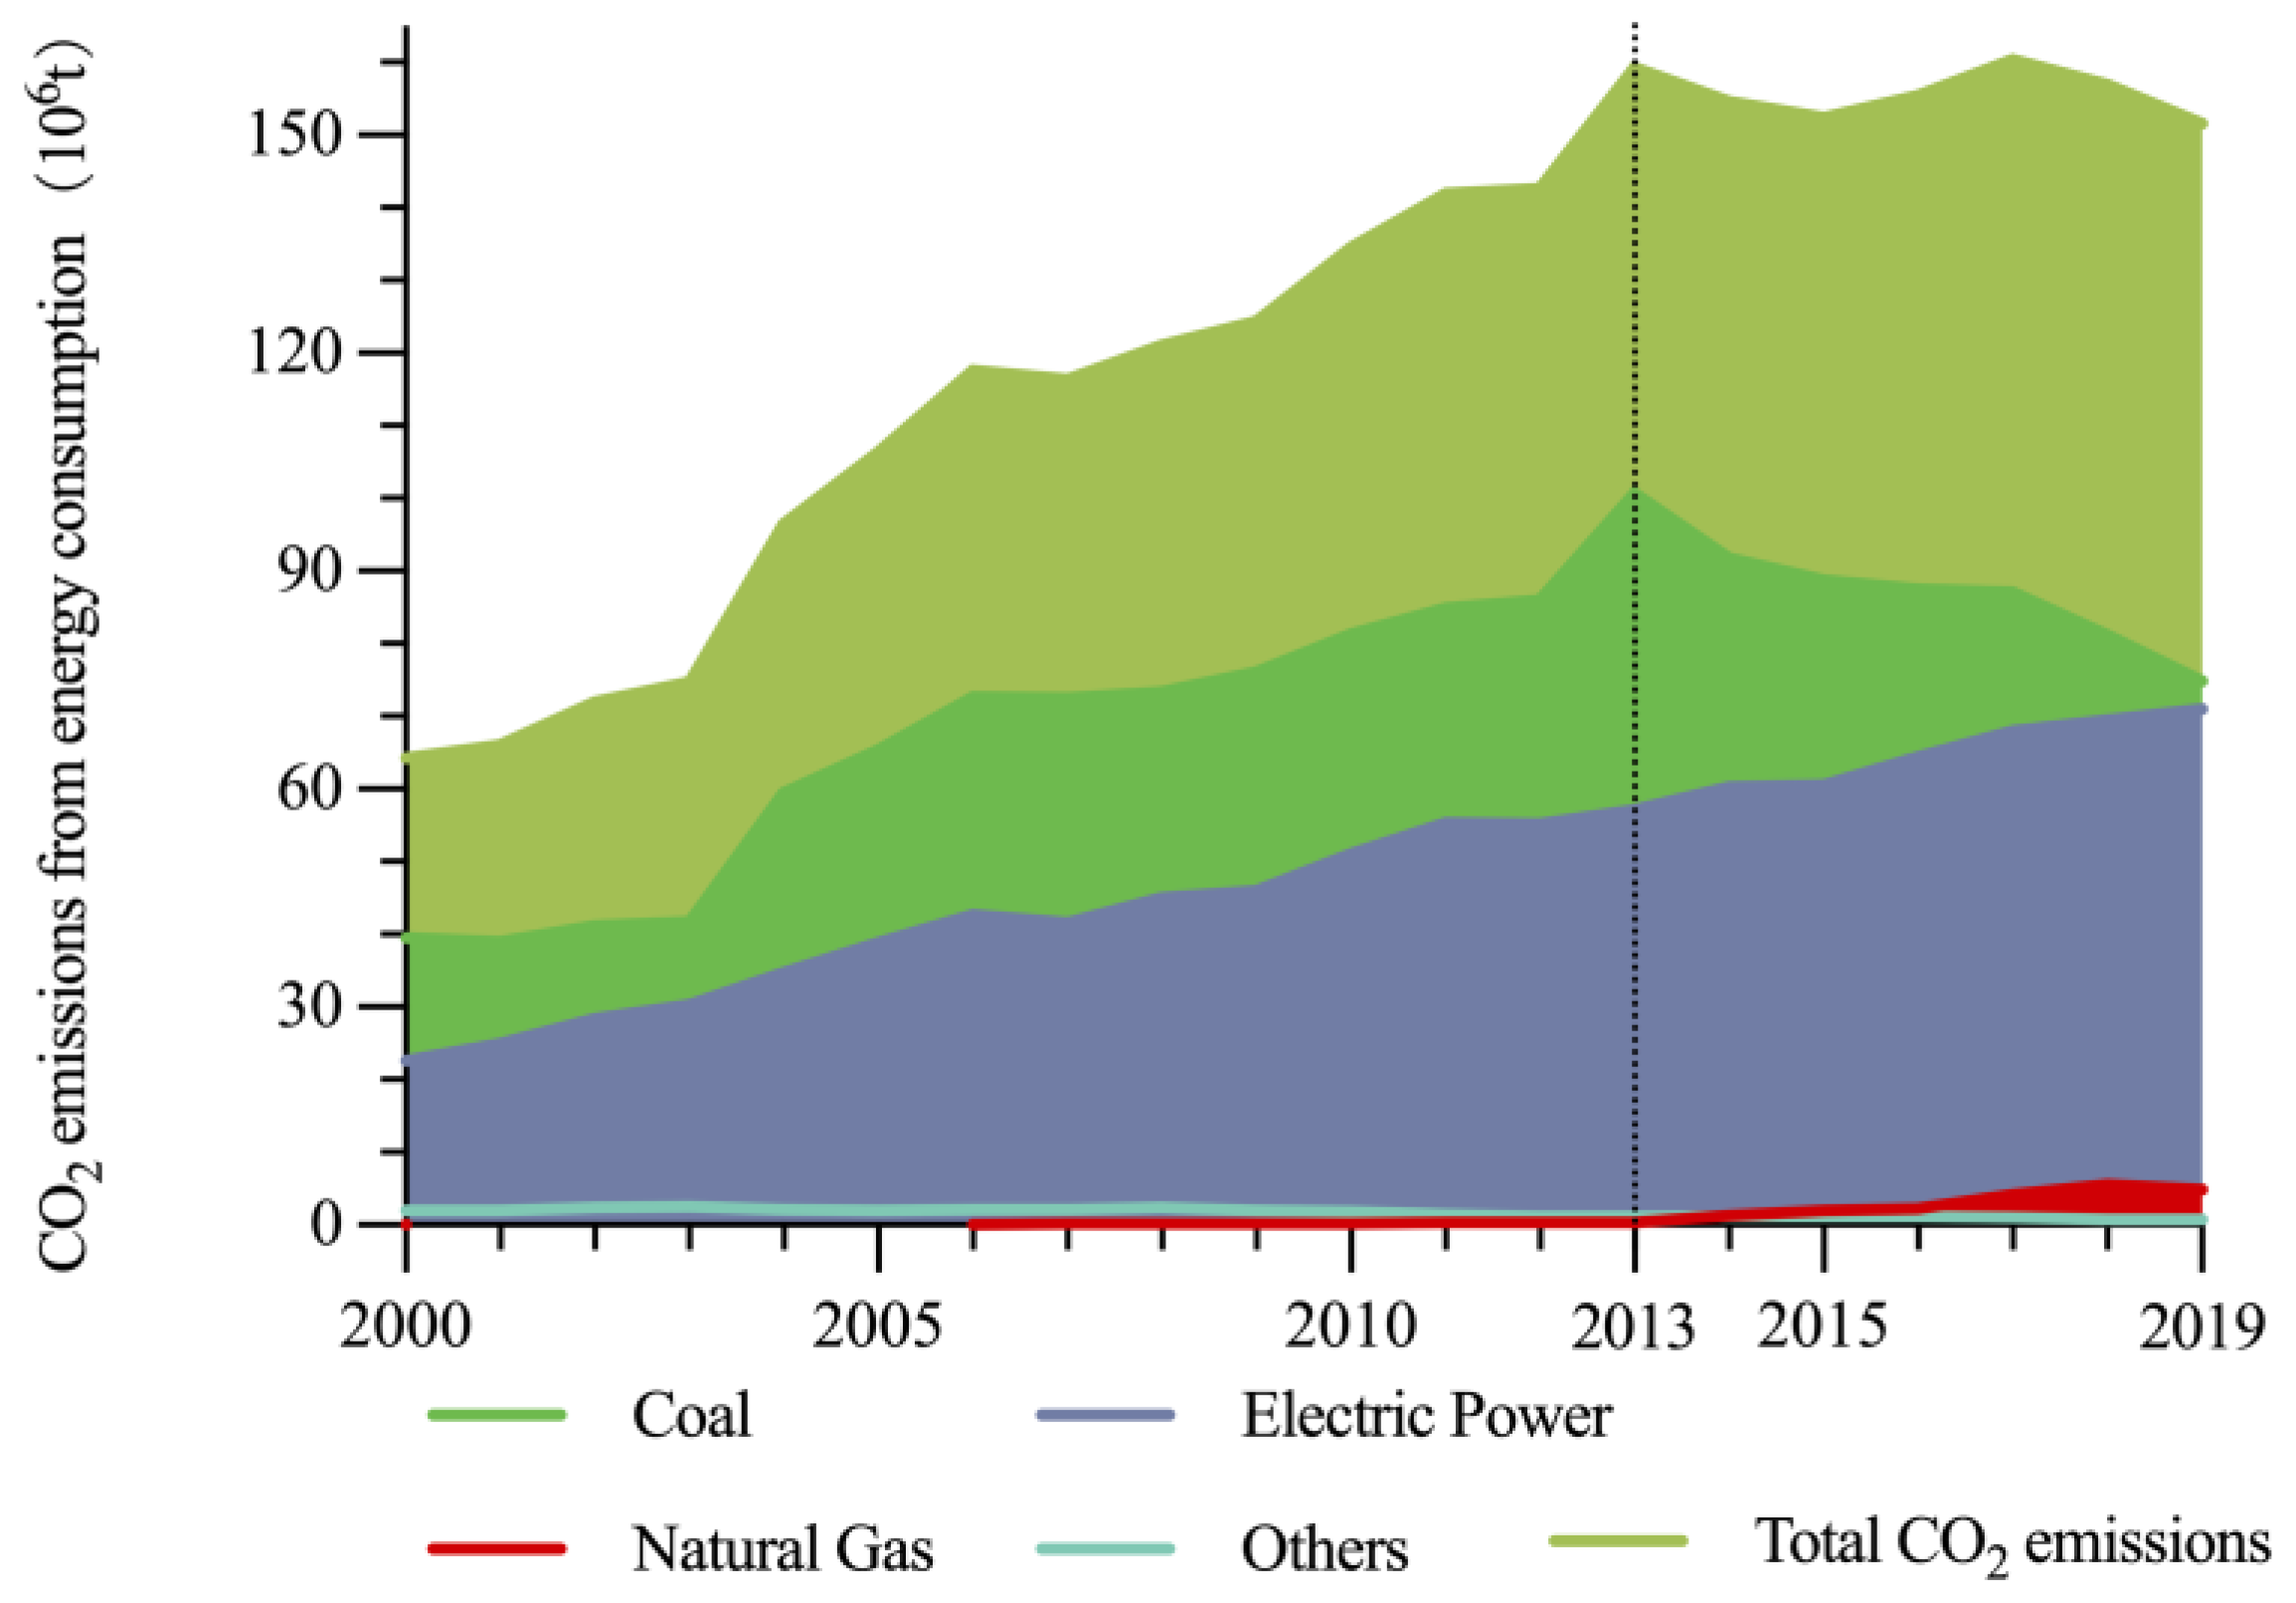
3.3. CO2 Emissions Status of Pulp and Paper Stage
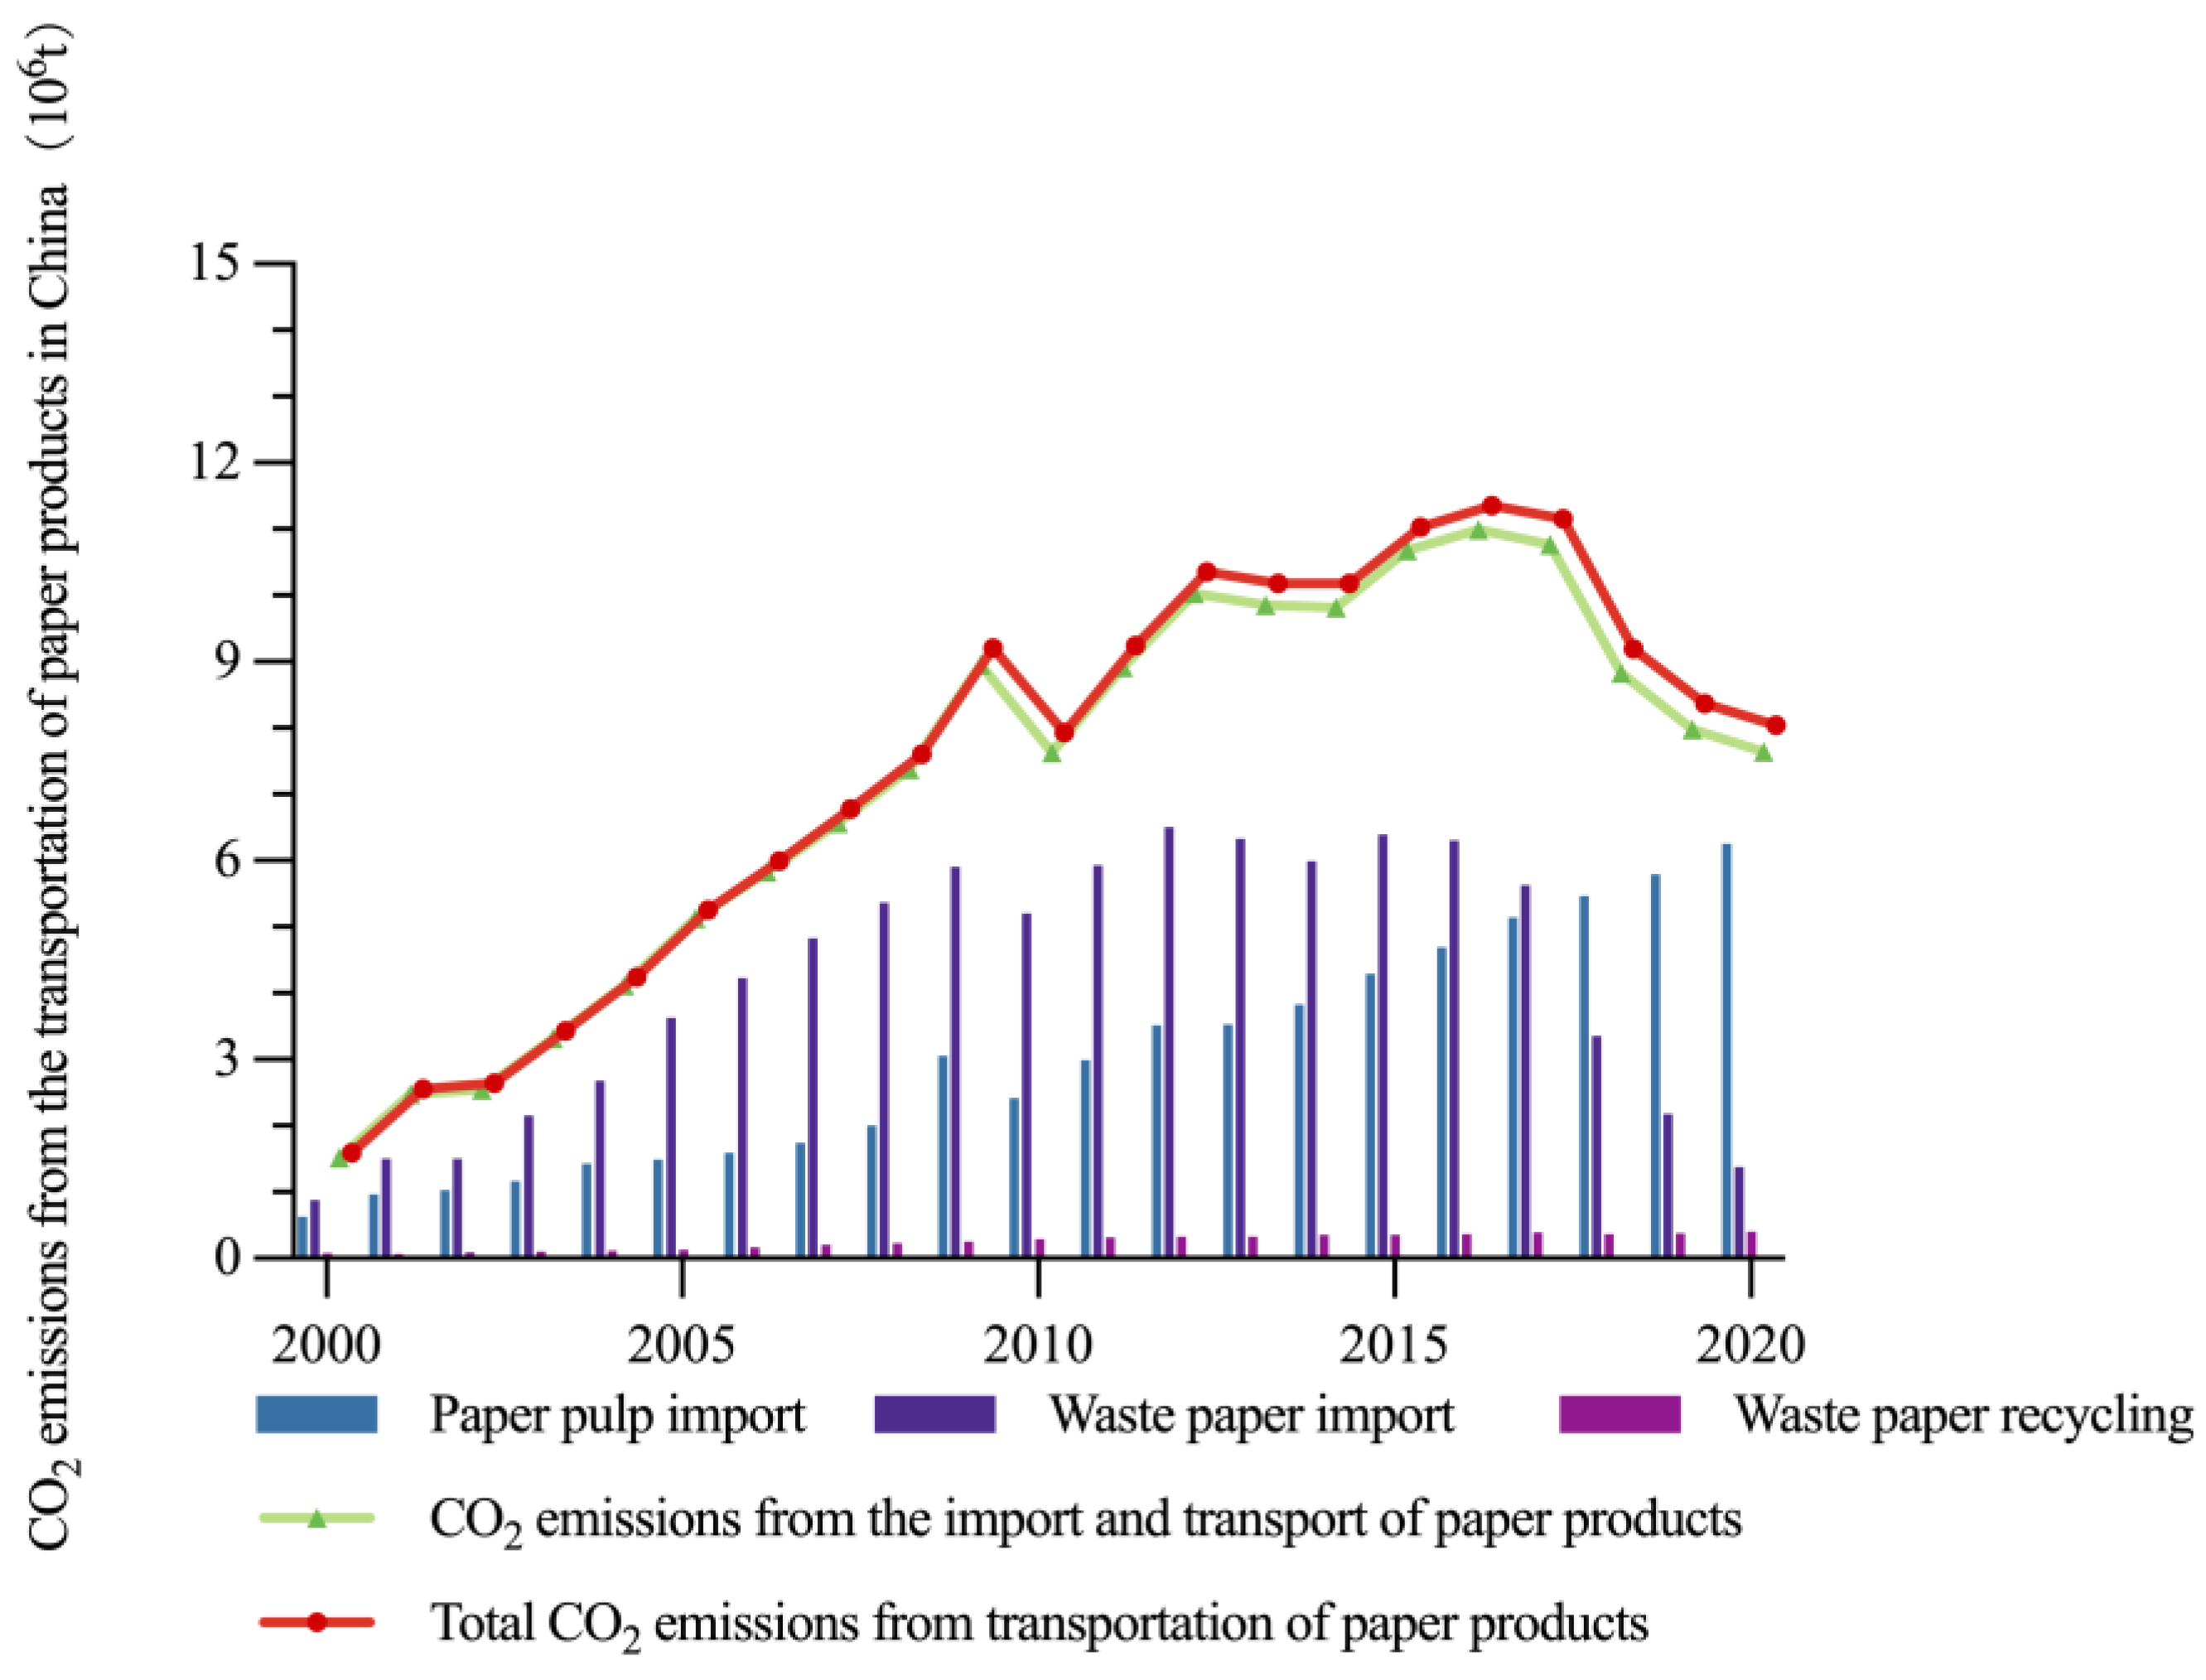
3.4. CO2 Emissions Status of the Transportation Stage
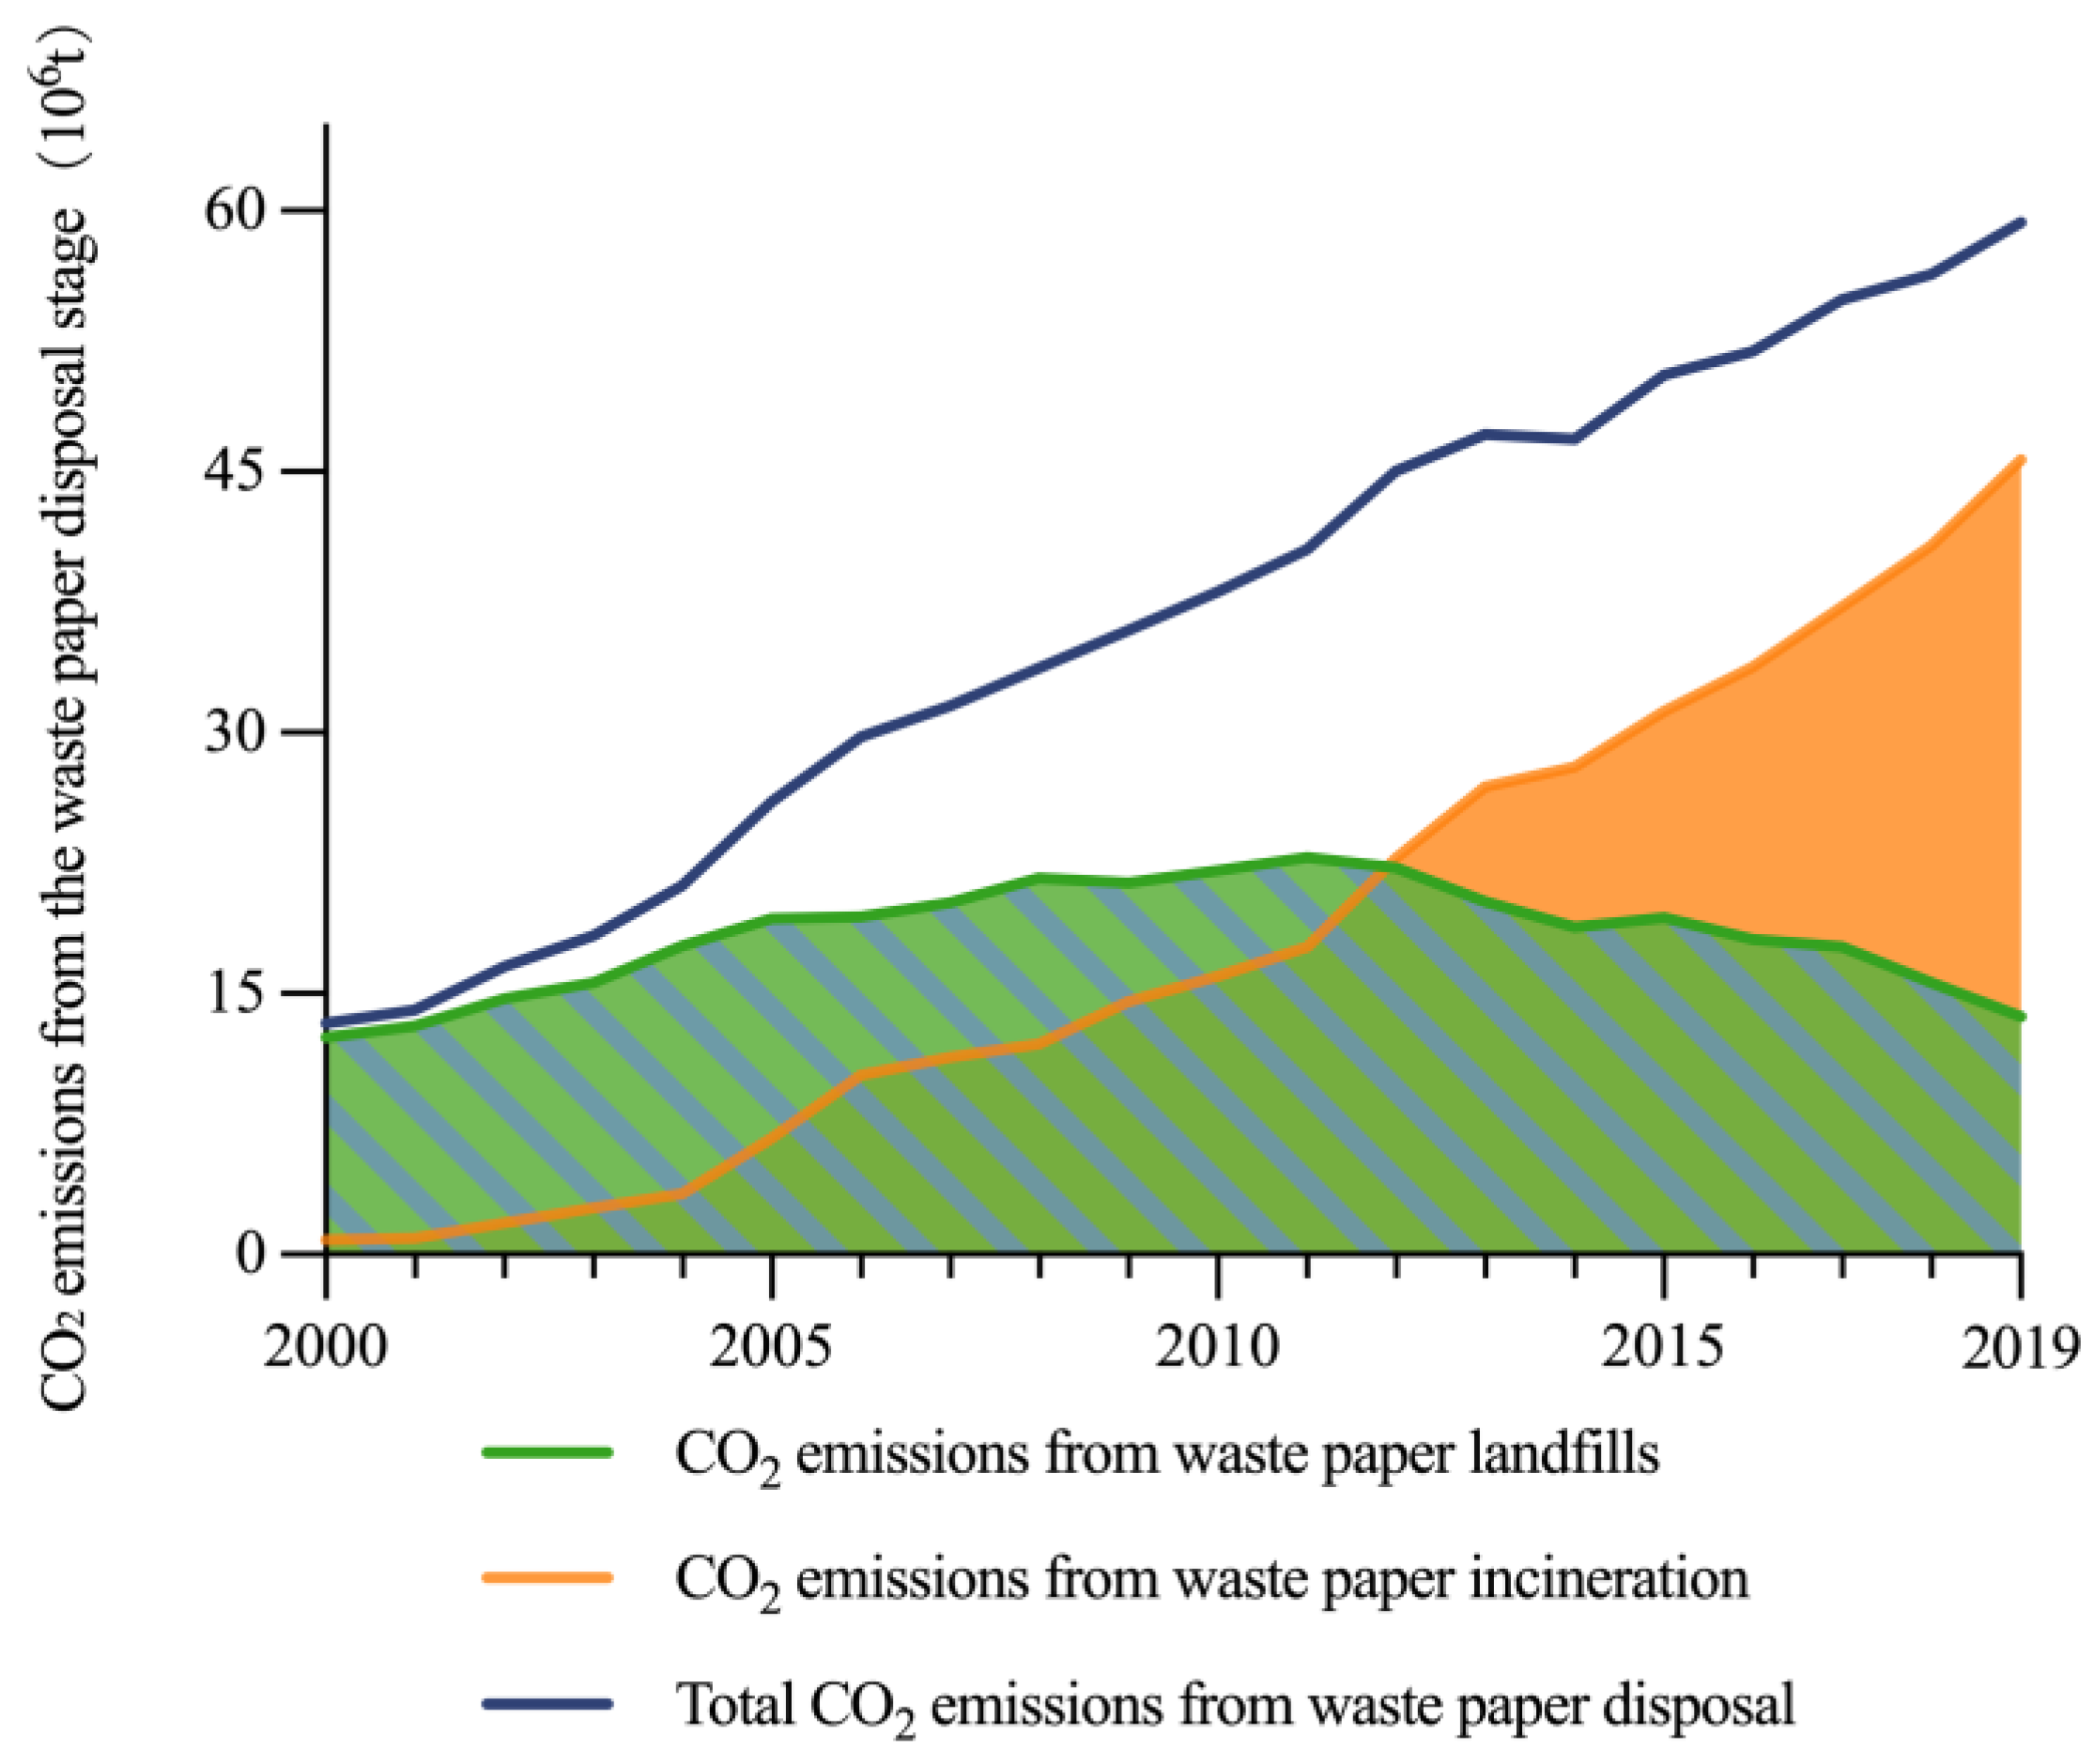
3.5. CO2 Emissions Status of Waste Paper Disposal Stage
3.6. Export Paper and Paperboard CO2 Emissions Status
3.7. Discussion of the Limitations of Our Analytical Results
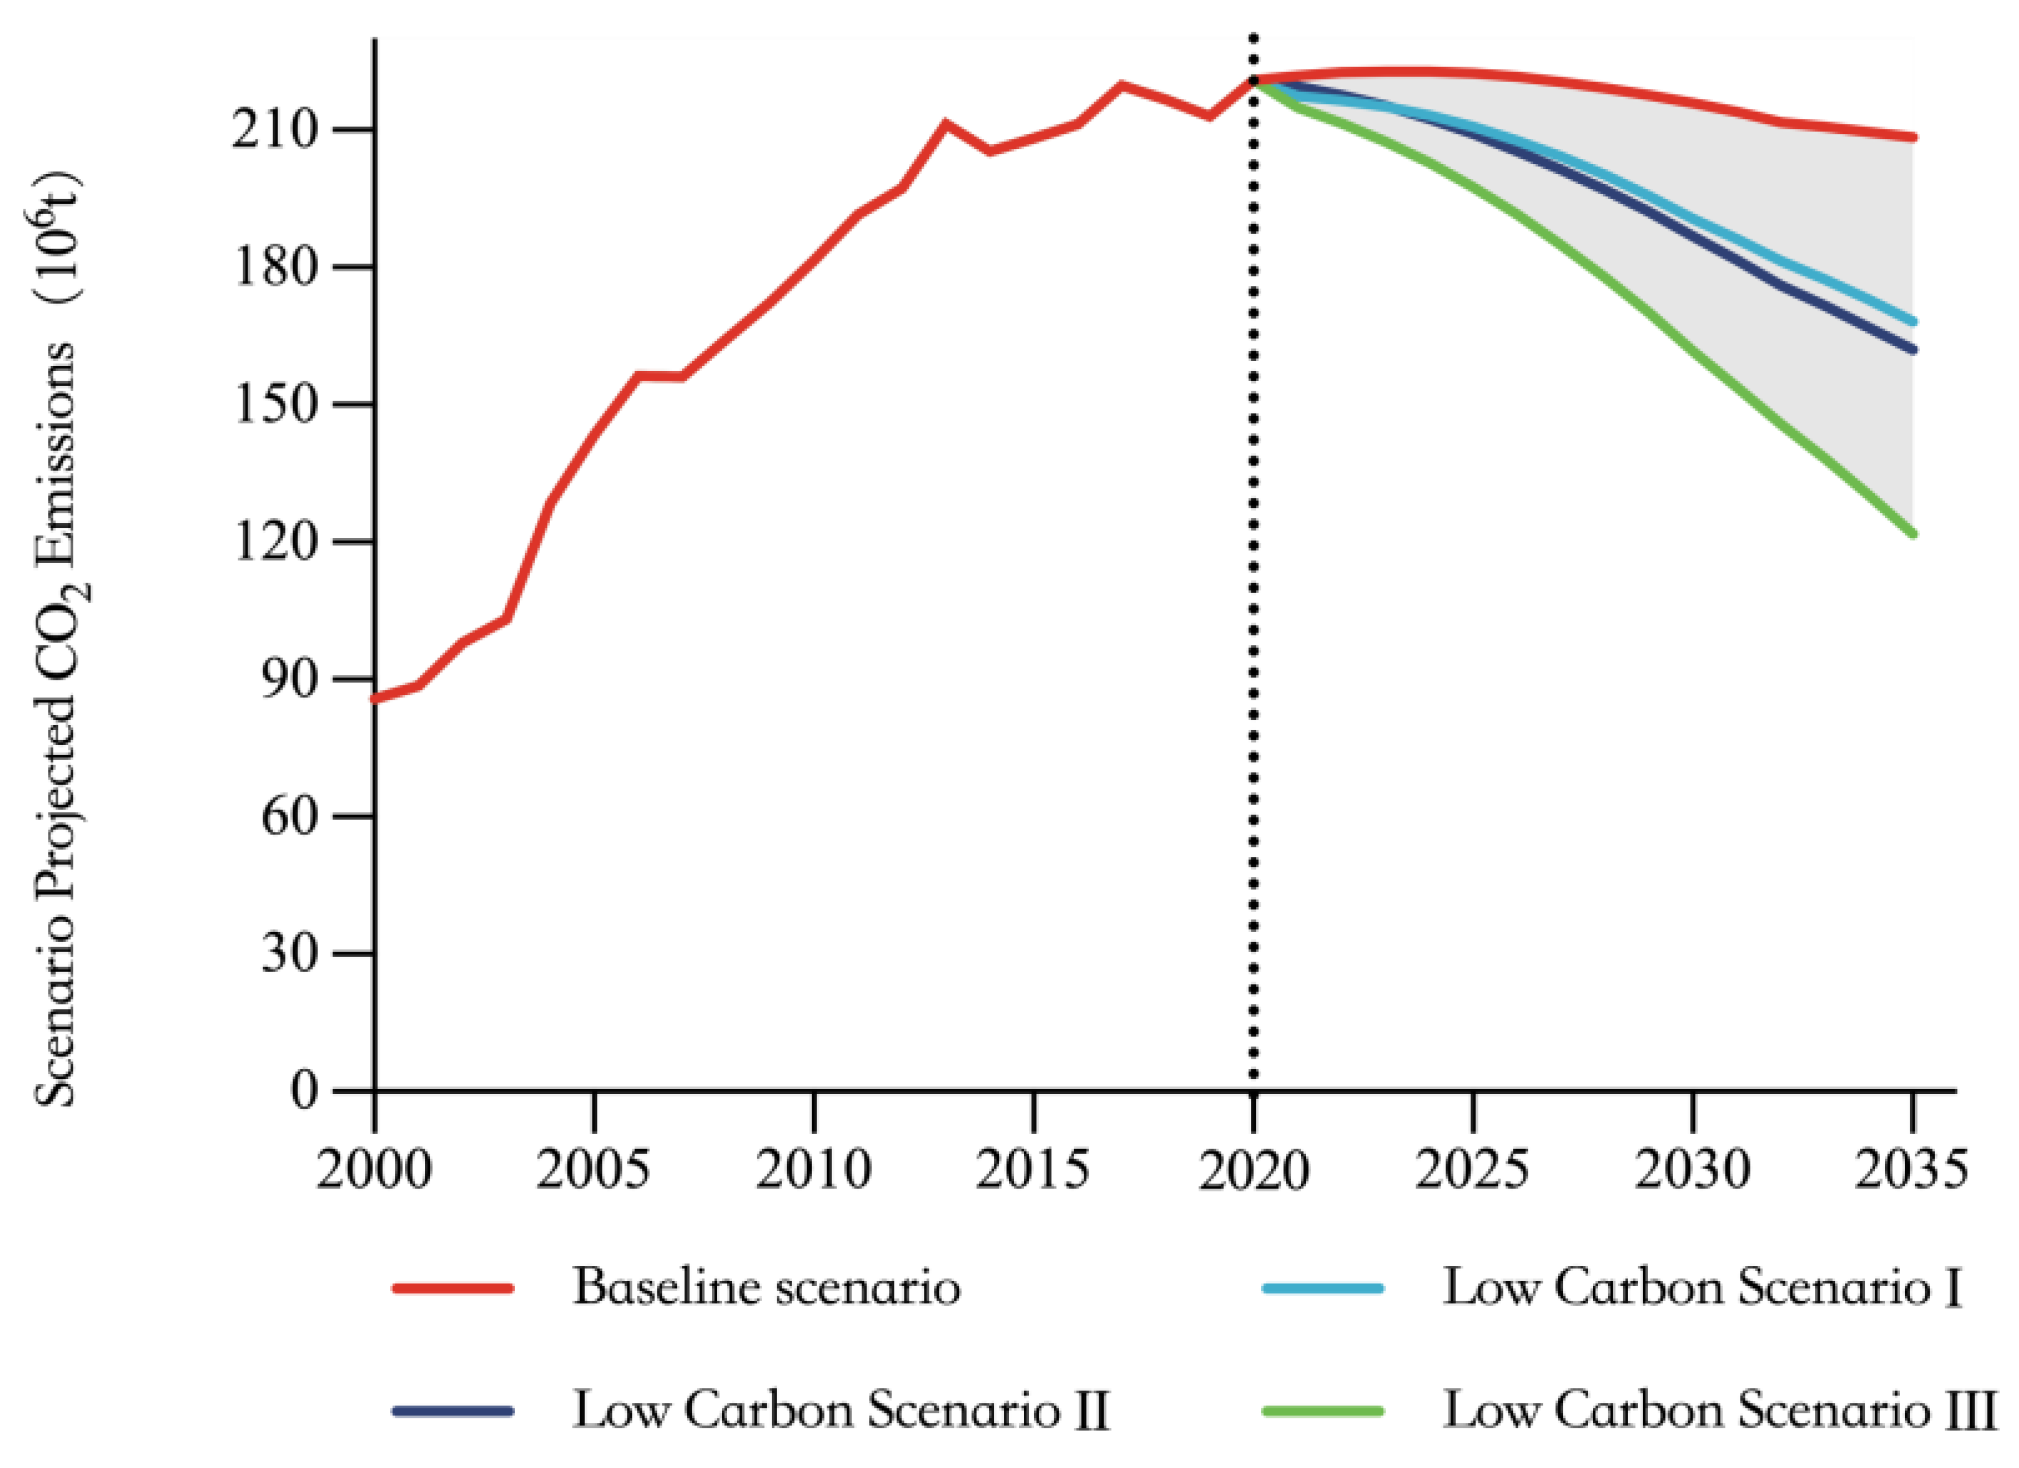
4. Forecast of LCA CO2 Emissions Scenarios for Paper Products in China
5. Conclusions
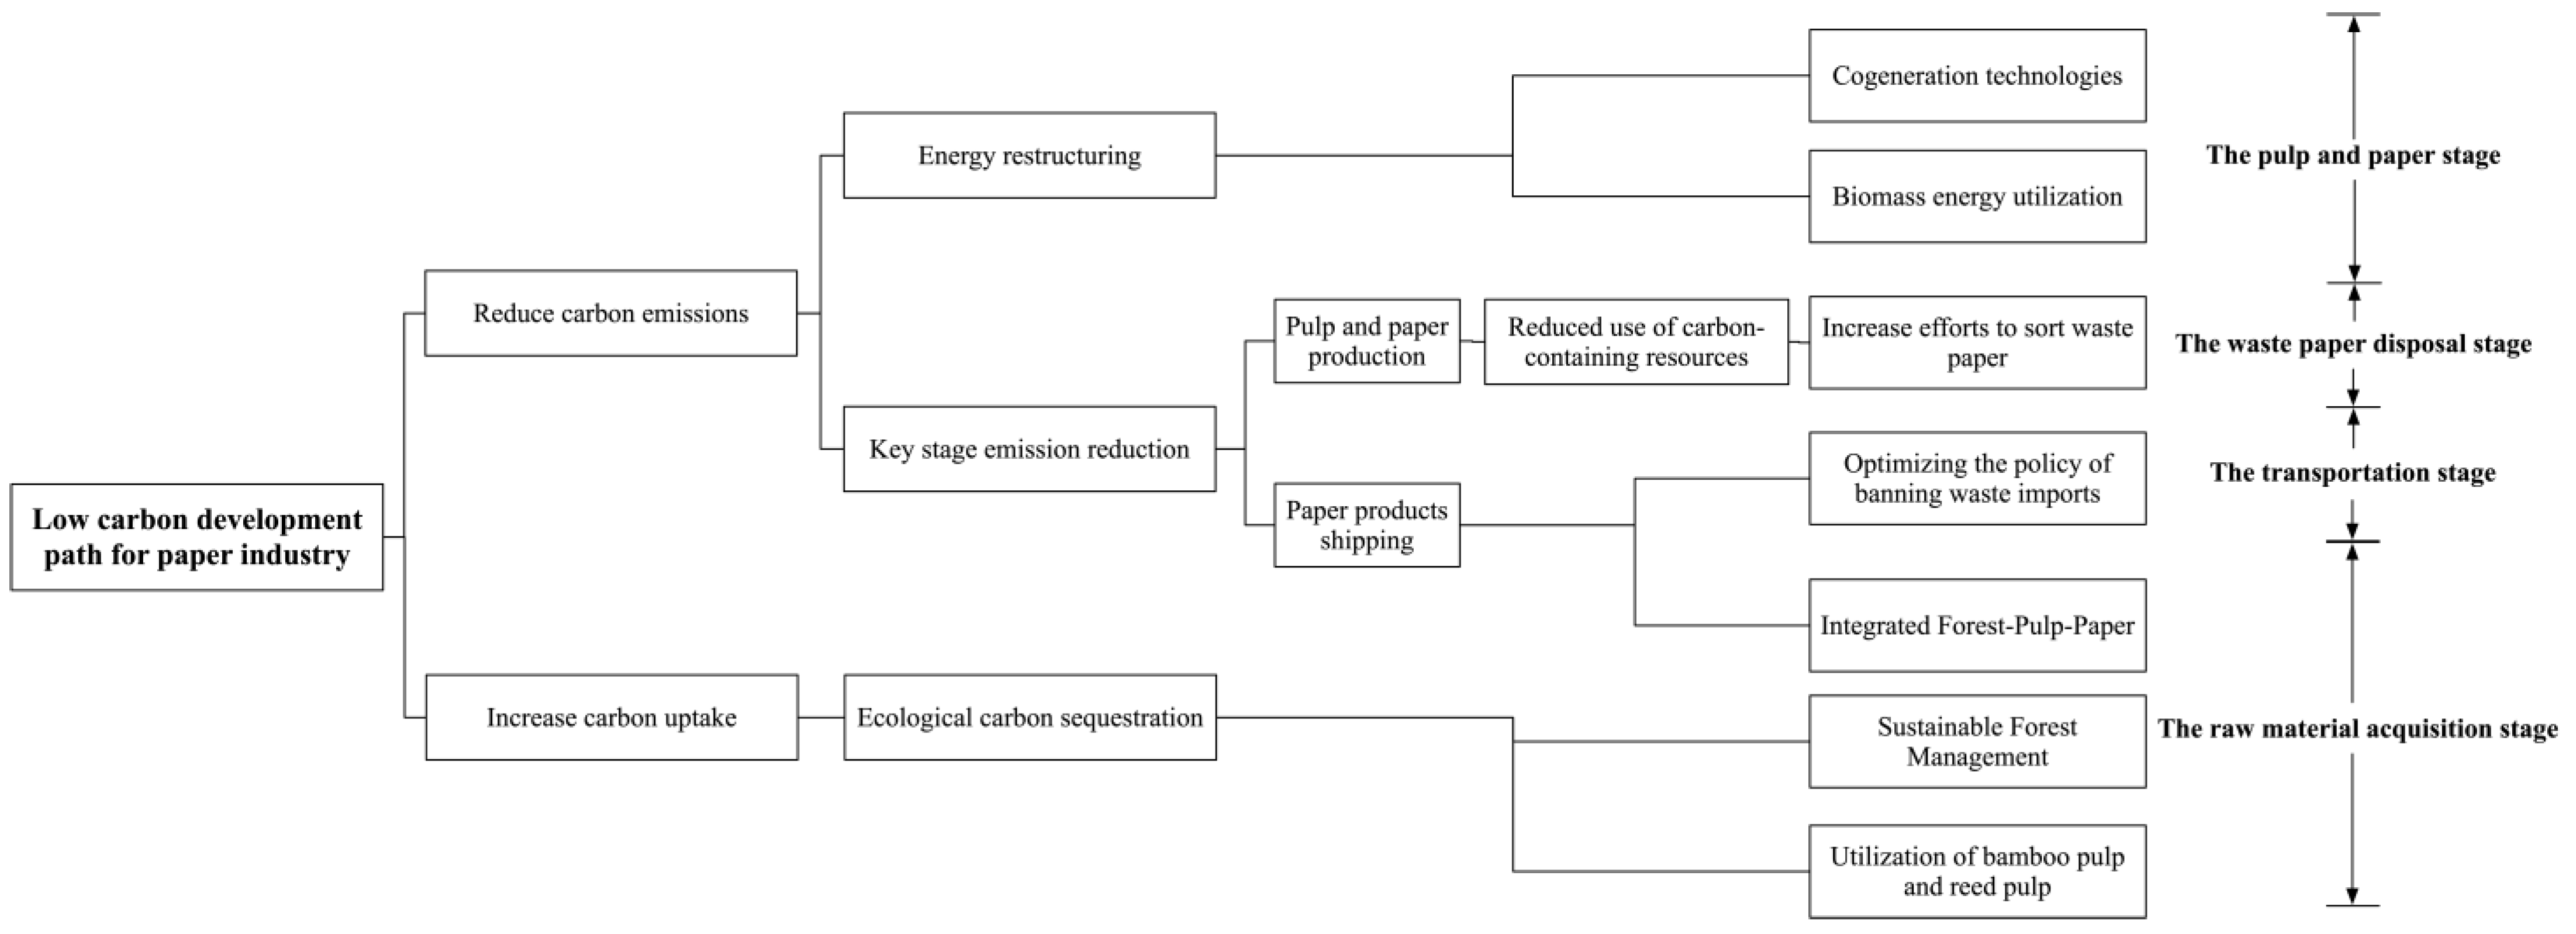
- (1)
- The raw material acquisition stage. Combined with the CO2 emissions accounting and scenario prediction results in this paper, the pulp and paper stage is the stage with the largest share of emissions in the papermaking industry (over 70%). Its energy structure adjustment is the top priority for the low-carbon development of the papermaking industry. Specifically, we propose the following: Firstly, increase the application of cogeneration technology in the papermaking industry. Through cogeneration technology, paper companies can use the steam generated for power generation in pulp and paper production through temperature and pressure reduction, which can significantly improve the utilization rate of energy and reduce the production costs of paper companies. In this regard, in the European papermaking industry cogeneration power accounted for 96% of the total electricity consumption, China’s corresponding proportion on this is less than 50%, hence, the development potential is enormous. Secondly, increase the application of biomass energy. The raw material of the papermaking industry mainly comes from plants. After extracting fiber from plants, in the pulping process by converting the remaining organic matter into biomass energy efficiently, it can significantly reduce the consumption of fossil energy and reduce the emissions of CO2. In Europe, paper mills have been able to achieve a non-fossil energy consumption ratio of more than 57% by efficiently converting organic matter from paper residues into biomass energy. For example, biodiesel produced by UPM in Finland from the by-products of pulp production can reduce CO2 emissions by 80% [57]. Some Japanese paper companies make full use of their own biomass resources, while purchasing waste rubber and wood from society and treating municipal waste, so that 100% of their energy consumption is biomass energy, thereby reducing the CO2 generated by energy consumption.
- (2)
- The pulp and paper stage. This stage requires greater efforts to sort waste in recycling. For example, the three types of waste paper—old newspapers, books, and cardboard boxes—contain different varieties of pulp, and the mechanical and chemical pulp obtained from their recycling has different properties. If a large amount of chemical pulp is mixed into the mechanical pulp, the corrugated boxes produced will become soft and lose their original load-bearing and pressure-resistant capacity. So, the stronger and more detailed the classification of all types of waste paper, the higher the value it will produce. With China’s waste paper nearing the limit of recyclable volume, greater recycling and sorting efforts can provide new ideas for reducing CO2 emissions.
- (3)
- The waste paper disposal stage. Although “the policy of banning waste imports” has led to a significant reduction in CO2 emissions from imports, the imbalance between supply and demand has led to high prices of waste paper raw materials and serious adulteration, so many paper companies have had to revise their waste paper acquisition quality standards, which has had a series of adverse effects on the papermaking industry. In response to the problem, it is recommended “the policy of banning waste imports” to refine the import of solid waste to avoid “one-size-fits-all”. From the perspective of circular economy and environmental protection, China’s own exports take away the packaging and instructions and other paper products through the import of the way to recycle is a more scientific and more environmentally friendly choice.
- (4)
- The transportation stage. First, increasing sustainable management of forests. With the certification of forest certification organizations, we can effectively reduce CO2 emissions by supervising and managing the entire value chain from forest management to paper product production then to consumer recycling. Second, promote the “forest-pulp-paper integration” model, effectively reducing CO2 emissions from the raw material acquisition stage of the aggregation and transportation operations. Third, promote the optimal rotation period system for forests, choose suitable tree species according to local conditions and maintain a reasonable forest age structure so that the forest can absorb the maximum amount of CO2. Fourth, to reduce the use of non-wood pulp in the proportion of rice-wheat straw pulp. The use of rice-wheat straw pulp is an important reason for the relatively large proportion of CO2 emissions in the pulp and paper stage. Promoting the clean production of reed raw materials and other pulp and paper can effectively reduce CO2 emissions. In addition, the use of bamboo pulp and paper is also an effective path to reduce CO2 emissions.
Author Contributions
Funding
Data Availability Statement
Conflicts of Interest
References
- IEA. World Energy Outlook 2009; OECD Publishing: Paris, France, 2009. [Google Scholar]
- IEA. CO2 Emissions from Fuel Combustion [EB/OL](2021-05-09). Available online: https://www.iea.org/data-and-statistics (accessed on 9 December 2021).
- National Bureau of Statistics. China Statistical Yearbook (2000–2021); China Statistics Press: Beijing, China, 2021. (In Chinese)
- Wang, Q.C. 2019 global paper development report 2019 Global Paper Development Report. China Pulp Pap. Ind. 2020, 41, 22–25. (In Chinese) [Google Scholar]
- Liu, Y.; Shen, W.; Man, Y.; Liu, Z.; Seferlis, P. Optimal scheduling ratio of recycling waste paper with NSGAII based on deinked-pulp properties prediction. Comput. Ind. Eng. 2019, 132, 74–83. [Google Scholar] [CrossRef]
- China Paper Association. China’s Paper Industry 2000–2020 Annual Report; China Paper Association: Beijing, China, 2021. (In Chinese) [Google Scholar]
- Man, Y.; Li, J.; Hong, M.; Han, Y. Energy transition for the low-carbon pulp and paper industry in China. Renew. Sustain. Energy Rev. 2020, 131, 109998. [Google Scholar] [CrossRef]
- Fleiter, T.; Fehrenbach, D.; Worrell, E.; Eichhammer, W. Energy efficiency in the German pulp and paper industry–A model-based assessment of saving potentials. Energy 2012, 40, 84–99. [Google Scholar] [CrossRef]
- Zhang, X.; Zhang, F.; Cai, H.; Zhang, H. A Representative Study of CO2 Emissions and Carbon Intensity Based on a Case of a Pulp and Paper Mill in China: Calculation and Analysis. BioResources 2017, 12, 6157–6172. [Google Scholar] [CrossRef]
- Wang, S.; Li, Q.; Fang, C.; Zhou, C. The relationship between economic growth, energy consumption, and CO2 emissions: Empirical evidence from China. Sci. Total Environ. 2016, 542, 360–371. [Google Scholar] [CrossRef]
- Wang, X.F.; Cui, Z.J.; Yu, F. Analysis of greenhouse effect carbon emission equivalent of different raw material pulping systems. Pap. Pap. Mak. 2013, 32, 1–5. (In Chinese) [Google Scholar]
- Chen, C.; Qiu, R.Z. Estimation of energy consumption and carbon emission of pulp and paper industry in China. China Pulp Pap. 2014, 33, 50–55. (In Chinese) [Google Scholar]
- Zhao, Q.J.; Wen, Z.M.; Zhang, M.X.; Anne, T. Research on implicit carbon flow and carbon emission measurement based on Forest Pulp and paper supply chain. China Popul. Resour. Environ. 2018, 28, 39–46. (In Chinese) [Google Scholar]
- Furszyfer Del Rio, D.D.; Sovacool, B.K.; Griffiths, S.; Bazilian, M.; Kim, J.; Foley, A.M.; Rooney, D. Decarbonizing the pulp and paper industry: A critical and systematic review of sociotechnical developments and policy options. Renew. Sustain. Energy Rev. 2022, 167, 112706. [Google Scholar] [CrossRef]
- Li, D.F.; Cao, Z.L.; Lu, B.R.; Chen, X. Life cycle assessment and its application in paper industry. China Pulp Pap. 2009, 28, 62–65. (In Chinese) [Google Scholar]
- Liu, H.B.; Li, J.G.; Tao, J.S. Some thoughts on developing low carbon paper industry. China Pulp Pap. 2011, 30, 51–56. (In Chinese) [Google Scholar]
- Ma, Q.Q.; Lu, B.R.; Zhang, Q.W. Carbon footprint evaluation method of paper products based on life cycle assessment (LCA). China Pulp Pap. 2012, 31, 57–62. (In Chinese) [Google Scholar]
- Tang, Y.H. On the life cycle of China’s paper industry and the strategic measures that enterprises should take at this stage. China Pulp Pap. Ind. 2002, 03, 38–40. (In Chinese) [Google Scholar]
- Zheng, B.C. Research on product life cycle and strategy of China’s paper industry. China Pulp Pap. Ind. 2014, 35, 42–47. (In Chinese) [Google Scholar]
- Lopes, E.; Dias, A.; Arroja, L.; Capela, I.; Pereira, F. Application of life cycle assessment to the Portuguese pulp and paper industry. J. Clean. Prod. 2003, 11, 51–59. [Google Scholar] [CrossRef]
- Dias, A.C.; Louro, M.; Arroja, L.; Capela, I. Evalution of the Environmental Performance of Printing and Writing Paper Using Life Cycle Assessment. World Pulp Pap. 2011, 15, 1–12. [Google Scholar]
- Gemechu, E.D.; Butnar, I.; Gomà-Camps, J.; Pons, A.; Castells, F. A comparison of the GHG emissions caused by manufacturing tissue paper from virgin pulp or recycled waste paper. Int. J. Life Cycle Assess. 2013, 18, 1618–1628. [Google Scholar] [CrossRef]
- Chen, S.; Yang, X.G.; Li, Y.P.; Cao, L.; Yue, W.Z. Analysis of GHG emission in the whole life cycle of Chinese paper products. J. Beijing Univ. Technol. 2014, 40, 944–949. (In Chinese) [Google Scholar]
- Peters, G.P.; Hertwich, E.G. Post-Kyoto greenhouse gas inventories: Production versus consumption. Clim. Change 2008, 86, 51–66. [Google Scholar] [CrossRef]
- Ma, C.M.; Xu, H.Q.; Su, M.S. Research progress of greenhouse gas inventory preparation method. Prog. Geogr. 2013, 32, 400–407. (In Chinese) [Google Scholar]
- Han, Z.; Chen, Y.H.; Shi, Y. Calculation and decomposition of consumption carbon emissions from the perspective of international final demand. J. Quant. Tech. Econ. 2018, 35, 114–129. (In Chinese) [Google Scholar]
- Peng, L.; Zeng, X.; Wang, Y.; Hong, G.-B. Analysis of energy efficiency and carbon dioxide reduction in the Chinese pulp and paper industry. Energy Policy 2015, 80, 65–75. [Google Scholar] [CrossRef]
- González-García, S.; Hospido, A.; Feijoo, G.; Moreira, M.T. Life cycle assessment of raw materials for non-wood pulp mills: Hemp and flax. Resour. Conserv. Recycl. 2010, 54, 923–930. [Google Scholar] [CrossRef]
- Ghose, A.; Chinga-Carrasco, G. Environmental aspects of Norwegian production of pulp fibres and printing paper. J. Clean. Prod. 2013, 57, 293–301. [Google Scholar] [CrossRef]
- Wang, X.; Zhao, X.; Wang, Y.Q.; Xue, J.F.; Zhang, H.L. Carbon footprint analysis of rice production in China. Resour. Sci. 2017, 39, 713–722. (In Chinese) [Google Scholar]
- European Chemical Industry Council; European Communities Trade Mark Association. Guidelines for Measuring and Managing CO2 Emission from Freight Transport Operations; Cefic: Brussels, Belgium, 2011. [Google Scholar]
- Ji, J.Y.; Kong, J.J. A study on carbon emission prediction of marine transportation industry based on STIRFDT model. Sci. Technol. Manag. Res. 2012, 32, 79–81. (In Chinese) [Google Scholar]
- Li, Q.; Tian, X.Y. Export and import effects of ASEAN “10+3”: A study based on a three-dimensional gravity model. Int. Trade Issues 2010, 06, 47–53. (In Chinese) [Google Scholar]
- Lei, L.; Liu, J.L.; Yang, K.J. Study on the factors influencing China’s import and export trade and its development potential in the context of “One Belt, One Road”-Analysis based on the gravitational model including carbon productivity. Financ. Econ. 2018, 02, 55–60. (In Chinese) [Google Scholar]
- Lu, J.; Shi, B.Z. How far inland China is from the sea: A study based on the difference of foreign trade scale among provinces. World Econ. 2014, 37, 32–55. (In Chinese) [Google Scholar]
- Guo, C.Y. Overview of domestic and international waste paper market in 2016. Pap. Inf. 2017, 10, 71–80. (In Chinese) [Google Scholar]
- Zhou, Y.; Li, D.; Wu, Z.L.; Zhou, C.J.; Zhen, L.F. Analysis of carbon emission during forest mining and transportation. For. Eng. 2014, 30, 1–5. (In Chinese) [Google Scholar]
- Zhang, Z.X.; Zhou, X.N.; Zhao, C.; Chen, Y.F. Optimization of ecological mining and transportation operation mode of plantation in southern forest area. Scientia Silvae Sinicae 2008, 05, 128–134. (In Chinese) [Google Scholar]
- Zhang, K.Y. Scientific Research Evaluation on Comprehensive Utilization Technology of Crop Straw in Jiangsu Province. Master’s Thesis, Nanjing Agricultural University, Nanjing, China, 2016. (In Chinese). [Google Scholar]
- Sun, S.R.; Guo, Y.; Yue, J.Q. Overview of rice straw resources for pulping and papermaking in China. Tianjin Pap. Mak. 2015, 37, 2–7. (In Chinese) [Google Scholar]
- Li, Z.Z. Current situation of agricultural straw resources for papermaking in China. China Pulp Pap. 2014, 33, 56–60. (In Chinese) [Google Scholar]
- Wang, X.Y. Study on the amount and Temporal and Spatial Distribution of Field Crop Straw Resources Focusing on East China, Central South and Southwest China. Ph.D. Thesis, China Agricultural University, Beijing, China, 2014. (In Chinese). [Google Scholar]
- National Bureau of Statistics. China Rural Statistical Yearbook (2000–2020); China Statistics Press: Beijing, China, 2020. (In Chinese)
- Price department of national development and Reform Commission. Compilation of Cost-Benefit Data of National Agricultural Products (20012020); China Statistics Press: Beijing, China, 2001. (In Chinese)
- Huang, X.M.; Chen, C.Q.; Chen, M.Z.; Song, Z.W.; Demg, A.X.; Zhang, J.; Zhen, C.Y.; Zhang, W.J. Carbon footprint of major grain crop production in the three northeastern provinces from 2004 to 2013. Chin. J. Appl. Ecol. 2016, 27, 3307–3315. (In Chinese) [Google Scholar]
- Xue, J.; Liu, S.; Chen, Z.; Chen, F.; Lal, R.; Tang, H.-M.; Zhang, H.-L. Assessment of carbon sustainability under different tillage systems in a double rice cropping system in Southern China. Int. J. Life Cycle Assess. 2014, 19, 1581–1592. [Google Scholar] [CrossRef]
- National Development and Reform Commission. Guidelines for the Preparation of Provincial Greenhouse Gas Inventories (Trial); National Development and Reform Commission: Beijing, China, 2011. (In Chinese)
- China Paper Society China Paper Yearbook (2000–2020); China Light Industry Press: Beijing, China, 2021.
- National Bureau of Statistics. China Urban Construction Statistical Yearbook (2000–2020); China Statistics Press: Beijing, China, 2020. (In Chinese)
- Lv, G.F. UK paper industry continues to reduce carbon dioxide emissions. China Pap. Newsl. 2015, 09, 76. (In Chinese) [Google Scholar]
- China Coal Industry Association China coal price index [EB/OL] (2021). Available online: http://www.coalchina.org.cn/page/newsmore.jsp?typeid=3240 (accessed on 5 December 2021). (In Chinese).
- Confederation of European Paper Industries. Key Statistics 2017—European Pulp & Paper Industry; CEPI: Brussels, Belgium, 2017. (In Chinese) [Google Scholar]
- Laurijssen, J.; Faaij, A.; Worrell, E. Energy conversion strategies in the European paper industry—A case study in three countries. Appl. Energy 2012, 98, 102–113. [Google Scholar] [CrossRef]
- Shao, S.; Zhang, X.; Zhao, X.R. Empirical decomposition and peak paths of carbon emissions in China’s manufacturing industry--generalized Dixie index decomposition and dynamic scenario analysis. China Ind. Econ. 2017, 3, 44–63. (In Chinese) [Google Scholar]
- National Development and Reform Commission. The 14th Five Year Plan for National Economic and Social Development of the People’s Republic of China and the Outline of Long-Term Objectives for 2035; People’s Publishing House: Beijing, China, 2021. (In Chinese)
- Hao, Y.; Zhang, Z.Y.; Liao, H. China’s energy “new normal”: The 13th five-year plan and the energy economy outlook in 2030. J. Beijing Inst. Technol. Soc. Sci. Ed. 2016, 18, 1–7. (In Chinese) [Google Scholar]
- UPM China. Climate Positive Forestry and Biodiversity Improvement [EB/OL] (2021). Available online: https://www.upm.com/responsibility/forests/ (accessed on 6 May 2022).


| Data Parameters | Value | Data Parameters | Value |
|---|---|---|---|
| Paper straw availability coefficient (t/t) | 0.4500 | Coal CO2 emission factors (tCO2/t) | 1.9003 |
| Straw collectability coefficient (t/t) | 0.8300 | Coke CO2 emission factor (tCO2/t) | 2.8604 |
| Grain/straw ratio (t/t) | 1.0400 | Crude oil CO2 emission factor (tCO2/t) | 3.0202 |
| Agricultural film CO2 emission factor (tCO2/t) | 22.7200 | Gasoline CO2 emission factor (tCO2/t) | 2.9251 |
| Rice seed CO2 emission factor (tCO2/t) | 1.8400 | Kerosene CO2 emission factor (tCO2/t) | 3.0179 |
| Nitrogen fertilizer CO2 emission factor (tCO2/t) | 1.5300 | Diesel CO2 emission factors (tCO2/t) | 3.0959 |
| Phosphate fertilizer CO2 emission factor (tCO2/t) | 1.6300 | Fuel oil CO2 emission factor (tCO2/t) | 3.1705 |
| Potash CO2 emission factors (tCO2/t) | 0.6500 | Natural gas CO2 emission factor (tCO2/m3) | 0.0022 |
| Compost CO2 emission factor (tCO2/t) | 1.7700 | Electricity CO2 Emission Factor (tCO2/kW-h) | 0.0010 |
| Herbicide CO2 emission factor (tCO2/t) | 10.1500 | Rail transport CO2 emission factors (t/t.km) | 0.0220 |
| Pesticide CO2 emission factor (tCO2/t) | 16.6100 | waterway transport CO2 emission factors (t/t.km) | 0.0140 |
| Fungicide CO2 emission factor (tCO2/t) | 10.5700 | 50% | |
| 40% | 50% | ||
| 50% | 90% | ||
| 50% | 100% |
| Year | Paper and Paperboard Export Volume (106 t) | CO2 Emissions per Unit of Paper and Board Produced (tCO2/t) | Emissions from the Production of Paper and Paperboard for Export (106 t) |
|---|---|---|---|
| 2000 | 0.72 | 2.11 | 1.52 |
| 2001 | 0.76 | 2.06 | 1.57 |
| 2002 | 0.85 | 1.90 | 1.62 |
| 2003 | 1.29 | 1.74 | 2.24 |
| 2004 | 1.25 | 1.95 | 2.43 |
| 2005 | 1.94 | 1.90 | 3.69 |
| 2006 | 3.41 | 1.81 | 6.17 |
| 2007 | 4.61 | 1.58 | 7.30 |
| 2008 | 4.03 | 1.52 | 6.11 |
| 2009 | 4.05 | 1.44 | 5.83 |
| 2010 | 4.33 | 1.45 | 6.29 |
| 2011 | 5.09 | 1.43 | 7.28 |
| 2012 | 5.13 | 1.39 | 7.14 |
| 2013 | 6.11 | 1.58 | 9.63 |
| 2014 | 6.81 | 1.48 | 10.05 |
| 2015 | 6.45 | 1.42 | 9.18 |
| 2016 | 7.33 | 1.43 | 10.50 |
| 2017 | 6.99 | 1.44 | 10.07 |
| 2018 | 6.18 | 1.50 | 9.30 |
| 2019 | 6.86 | 1.41 | 9.66 |
Publisher’s Note: MDPI stays neutral with regard to jurisdictional claims in published maps and institutional affiliations. |
© 2022 by the authors. Licensee MDPI, Basel, Switzerland. This article is an open access article distributed under the terms and conditions of the Creative Commons Attribution (CC BY) license (https://creativecommons.org/licenses/by/4.0/).
Share and Cite
Yang, J.; Hua, Y.; Ye, J.; Xu, S.; Liu, Z. CO2 Emissions Accounting and Carbon Peak Prediction of China’s Papermaking Industry. Forests 2022, 13, 1856. https://doi.org/10.3390/f13111856
Yang J, Hua Y, Ye J, Xu S, Liu Z. CO2 Emissions Accounting and Carbon Peak Prediction of China’s Papermaking Industry. Forests. 2022; 13(11):1856. https://doi.org/10.3390/f13111856
Chicago/Turabian StyleYang, Jiameng, Yuchen Hua, Jiarong Ye, Shiying Xu, and Zhiyong (John) Liu. 2022. "CO2 Emissions Accounting and Carbon Peak Prediction of China’s Papermaking Industry" Forests 13, no. 11: 1856. https://doi.org/10.3390/f13111856
APA StyleYang, J., Hua, Y., Ye, J., Xu, S., & Liu, Z. (2022). CO2 Emissions Accounting and Carbon Peak Prediction of China’s Papermaking Industry. Forests, 13(11), 1856. https://doi.org/10.3390/f13111856