Article

Detecting the Spatial Matching Relationship between Supply-Side and Demand-Side of Recreation Ecosystem Services (RES) from the Perspectives of Resource, Management, and Beneficiary: A Case Study in Yangmingshan National Park

Department of Horticulture and Landscape Architecture, National Taiwan University, Taipei 10647, Taiwan
*
Author to whom correspondence should be addressed.
Forests 2022, 13(11), 1849; https://doi.org/10.3390/f13111849
Submission received: 13 September 2022 / Revised: 27 October 2022 / Accepted: 2 November 2022 / Published: 4 November 2022

Abstract

:
Recreation ecosystem services (RES) link closely to human well-being and might mutually benefit biodiversity conservation while well managed. However, assessing and detecting the spatial matching of RES remains challenging. This study considered the nature of RES supply-side and demand-side in assessing and detecting the spatial matching relationship from the resource, management, and beneficiary perspectives. The proposed method consisted of assessment and overlay analysis parts. RES Supply Potential and Recreation Accessibility were assessed from the resource and management perspectives. RES Demand Potential, RES Flow, and RES Match/Mismatch were assessed from the beneficiary perspective. An overlay analysis was then conducted to examine the spatial relationship between the RES Match/Mismatch and the resource supply and management status to provide specific management information for protected areas. For the Yangmingshan National Park (YNP) in Taiwan, as a case study, this study revealed four RES Match/Mismatch levels in YNP, including MM+2 (RES Demand Potential ≫ RES Flow), MM+1 (RES Demand Potential > RES Flow), M (RES Demand Potential ≈ RES Flow), and MM−1 (RES demand Potential < RES flow). Only 5.51% of YNP belonged to M, where the areas’ RES Demand Potential were close to RES Flow and mainly located in Zone SA (Scenic Area). MM−1, where the areas were over-visited, accounted for 7.12% and were mainly located in Zones SA and EUA (Existing Use Area). As a protected area, most areas of YNP were with high RES Supply Potential; and were mainly located in MM+2 (70.87%) and MM+1 (16.50%), where the areas’ RES Demand Potential much greater or greater than RES Flow and the Recreation Accessibility were low. MM−1 were the areas where the managers should first launch actions to avoid or minimize over-visited impacts. The proposed method could detect RES Match/Mismatch rationally and directly and obtain multiple spatial datasets to support decision-making.

1. Introduction

Ecosystem services (ES) are the links between the multiple benefits of the ecosystem and the well-being of people [1], a strategy for promoting biodiversity conservation through the linkage of interests. According to the Common International Classification of Ecosystem Goods and Services (CICES) (v5.1), ES divides into (1) provisioning ES that provides material and energy needs, (2) regulation and maintenance ES that can moderate the environment for humans, and (3) cultural ES that are non-material characteristics of ecosystems affecting people’s physical and mental states [2]. Introducing the cascade model [3], the CICES framework defines the final services and is sufficiently flexible for application in different contexts [4]. Due to each ecosystem providing multiple ES [2,5], through the CICES framework, a more comprehensive and dedicated land-use policy and decision-making are possible to be achieved. Recently, protected area managers are gradually adopting the ES framework to comprehensively formulate management policies [6] to achieve sustainable development goals (SDGs), especially to eight SDGs: Goal 2—Zero Hunger, Goal 4—Quality Education, Goal 8—Decent Work and Economic Growth, Goal 9—Industry, Innovation and Infrastructure, Goal 11—Sustainable Cities and Communities, Goal 12—Responsible Consumption and Production, Goal 13—Climate Action, and Goal 15—Life on Land [7]. Therefore, the robust quantification and spatially explicit mapping of the ES supply-side and demand-side are essential for managers to integrate the ES concept into policy and decision-making.
The assessment and mapping of ES supply-side, demand-side, and spatial match have increased recently (e.g., [8,9,10]). González-García et al. [10], for example, quantitatively mapped the supply-side and demand-side of eight ES to reveal their spatial distribution along an urban–rural gradient for searching potential conflicts between urban and protected area planning aims. Among the eight ES, water provision, forage provision for livestock (provisioning ES), carbon sequestration, aquifer recharge, and erosion control (regulation and maintenance ES) are the ES with a tangible entity and obvious need. They used three widely used models (InVEST, APLIS, and RUSLE) to assess and map the physical quantities of the five ES supply-side and demand-side; and the three cultural ES (aesthetic value, cultural identity, and outdoor recreation) supply-side and demand-side were assessed from subjective ratings.
Cultural ES is intangible and non-material; therefore, assessing its value remains challenging [11]. Recreation ecosystem services (RES) is one of the critical cultural ES that benefits people through improved physical health and psychological and emotional well-being [12]. Through direct experience and appreciation of the natural environment, people can improve their understanding of environmental benefits [13]. As the demand for RES continues to grow, intelligent and precise natural resource management has become increasingly important. High recreation demand and visitation have led to resource and social impact issues. Although several management actions (e.g., limit use, redistribute use, and education) could be used to avoid or minimize those impacts [14], the spatial distribution of match/mismatch of recreation demand and visitation is still unclear.
Though several studies have assessed and mapped the supply-side and demand-side of RES and detected the spatial matching between them [7,15,16,17,18,19], these studies did not entirely aim at assessing the supply-side and demand-side of RES in protected areas. These studies used the indicator assessment method implemented by experts to assess the RES supply-side. The most commonly used indicators include naturalness, presence of water, existence of protected area, relief and presence of summit, landscape diversity, and other indicators related to biophysical features. The literature demonstrates the indicators as proxies for people’s preferences for recreation: the objective characteristics of natural capitals with higher recreational attractiveness. Therefore, the RES supply-side assessed by the indicator assessment method might be considered theoretical RES provided by natural capital. The indicators have various units; therefore, these studies used normalization to compress data to 0–1 for further comparisons without changing the original numerical ordering relationship. For intangible and non-material RES, the indicator assessment method provides a quantitative measurement of the RES supply-side of natural capital.
For the RES demand-side, these studies used population density and accessibility to assess the demand level, which assumed that every person had the same recreation preference. However, individuals are not identical; assuming a population with the same recreation preference is incorrect. According to Driver & Brown [20], recreation demand is generally equivalent to personal preferences or desires, which is at the preference–aspiration–desire level. Recreation preference is affected by the individual’s specific characteristics, such as social and economic characteristics, past recreation experience, and other personal characteristics [21,22,23]. While recreational opportunities or access to recreation sites meet personal preferences or desires, people will participate in recreation [21,22]. Therefore, assessing RES demand from population density and accessibility would lead to great assessment bias. Specifically, individual recreation preference and whether the recreation demand is realized would only be assessed from individual perspectives but not from demographic statistics.
According to Fisher et al. [24], RES is an in situ ES flow. People have to reach the recreation site to realize the RES demand. Therefore, people with RES demand would not transfer into RES flow if not being there. Recreational sites with higher accessibility would increase the possibility of an individual participating in recreation. On the other hand, managers can manipulate facilities to adjust the access level to protect natural capital from overutilization. For protected areas, accessibility is not only a term affecting whether RES demand is realized but, more importantly, as a means to protect natural capital; therefore, accessibility should be assessed independently from the RES demand-side. A RES mapping method proposed by Kulczyk et al. [9] assessed RES supply potential, recreational infrastructure, and recreational usage separately. Using water-based recreation as a case study, they combined three levels of RES supply potential, recreational infrastructure, and recreational usage to identify and mapped 27 types of RES and calculated their monetary value. For protected areas, separately assessing RES supply potential, accessibility, RES demand, and RES flow might be especially important for balancing recreational use and conservation.
This study aimed to propose a method for detecting the spatial matching relationship between the supply-side and demand-side of RES to provide operational and meaningful information for policy and decision-making for protected areas. The proposed method assessed the RES supply-side from the resource and management perspectives and the RES demand-side from the beneficiary perspective. Overlaying the status of supply-side and demand-side of RES could rationally and directly detect the spatial matching relationship to provide managers with directive information. This study used Yangmingshan National Park (YNP) in Taiwan as a case study. The proposed method could be used as a reference for protected areas to detect the match/mismatch of RES, and the results of this study could serve as a support for policy and decision-making.

2. Method

2.1. Study Site

YNP is located in the north of the Taipei Metropolitan Area, Taiwan, and covers approximately 11,338 hectares (Supplementary Materials Figure S1). It is the only active volcano group in Taiwan, which has shaped unique geological landscapes and developed cultural landscapes such as mining, sulfur mining, and the hot spring industry (Figure S2). YNP dedicates itself to conservation and provides RES as one of its ES. According to the Tourism Bureau of Taiwan [25], YNP has more than 3 million visitors annually. It is a major destination for people to engage in recreational activities such as trail hiking, environmental education, sightseeing, and hot spring bathing. High recreation demand and visitation lead to managers facing the pressure of decision-making on resource conservation and recreation supply.
Land cover types of YNP include forest, grassland, volcanic bare land, wetland, stream, irrigation ditches, agricultural land, parks and artificial surfaces. Among these, forest (80.85%) occupies the highest proportion, followed by grassland (9.93%) and agricultural land (4.56%). The land use zones of YNP include the Ecological Protected Area (EPA, 18.66%), Scenic Area (SA, 47.43%), Culture/Historic Area (CHA, 0.20%), Recreation Area (RA, 2.38%), and Existing Use Area (EUA, 31.33%). Among these, Zones EPA, SA, and CHA are the core protected areas. Zone EPA serves for the preservation of biodiversity and research use purposes only, not for recreational use. Without permission, Zone EPA is not accessible. Zone RA allows for limited recreational use (low-impact developments and activities, such as environmentally friendly accommodation and sightseeing). Zone EUA allows for the existing land use by the residents (Figure 1).

2.2. Methods and Procedure

This study considered “RES Supply Potential” as the theoretical level that the natural capital can provide, which was assessed from the resource perspective by using the indicator assessment method. “Recreation Accessibility” was a management term that could be altered to adjust the accessibility of the natural capital to the public, which was assessed from the management perspective. RES Supply Potential and RES Accessibility were both the supply-side of RES. “RES Demand Potential” was the beneficiaries’ recreational preference toward the natural capital, affected by an individual’s specific characteristics. “RES Flow” was the realized RES demand, affected by individual recreation preference, recreation opportunity, and Recreation Accessibility. “RES Match/Mismatch” was the matching relationship between RES Demand Potential and RES Flow. RES Demand Potential, RES Flow, and RES Match/Mismatch were the demand-side of RES, which were assessed from the beneficiary perspective.
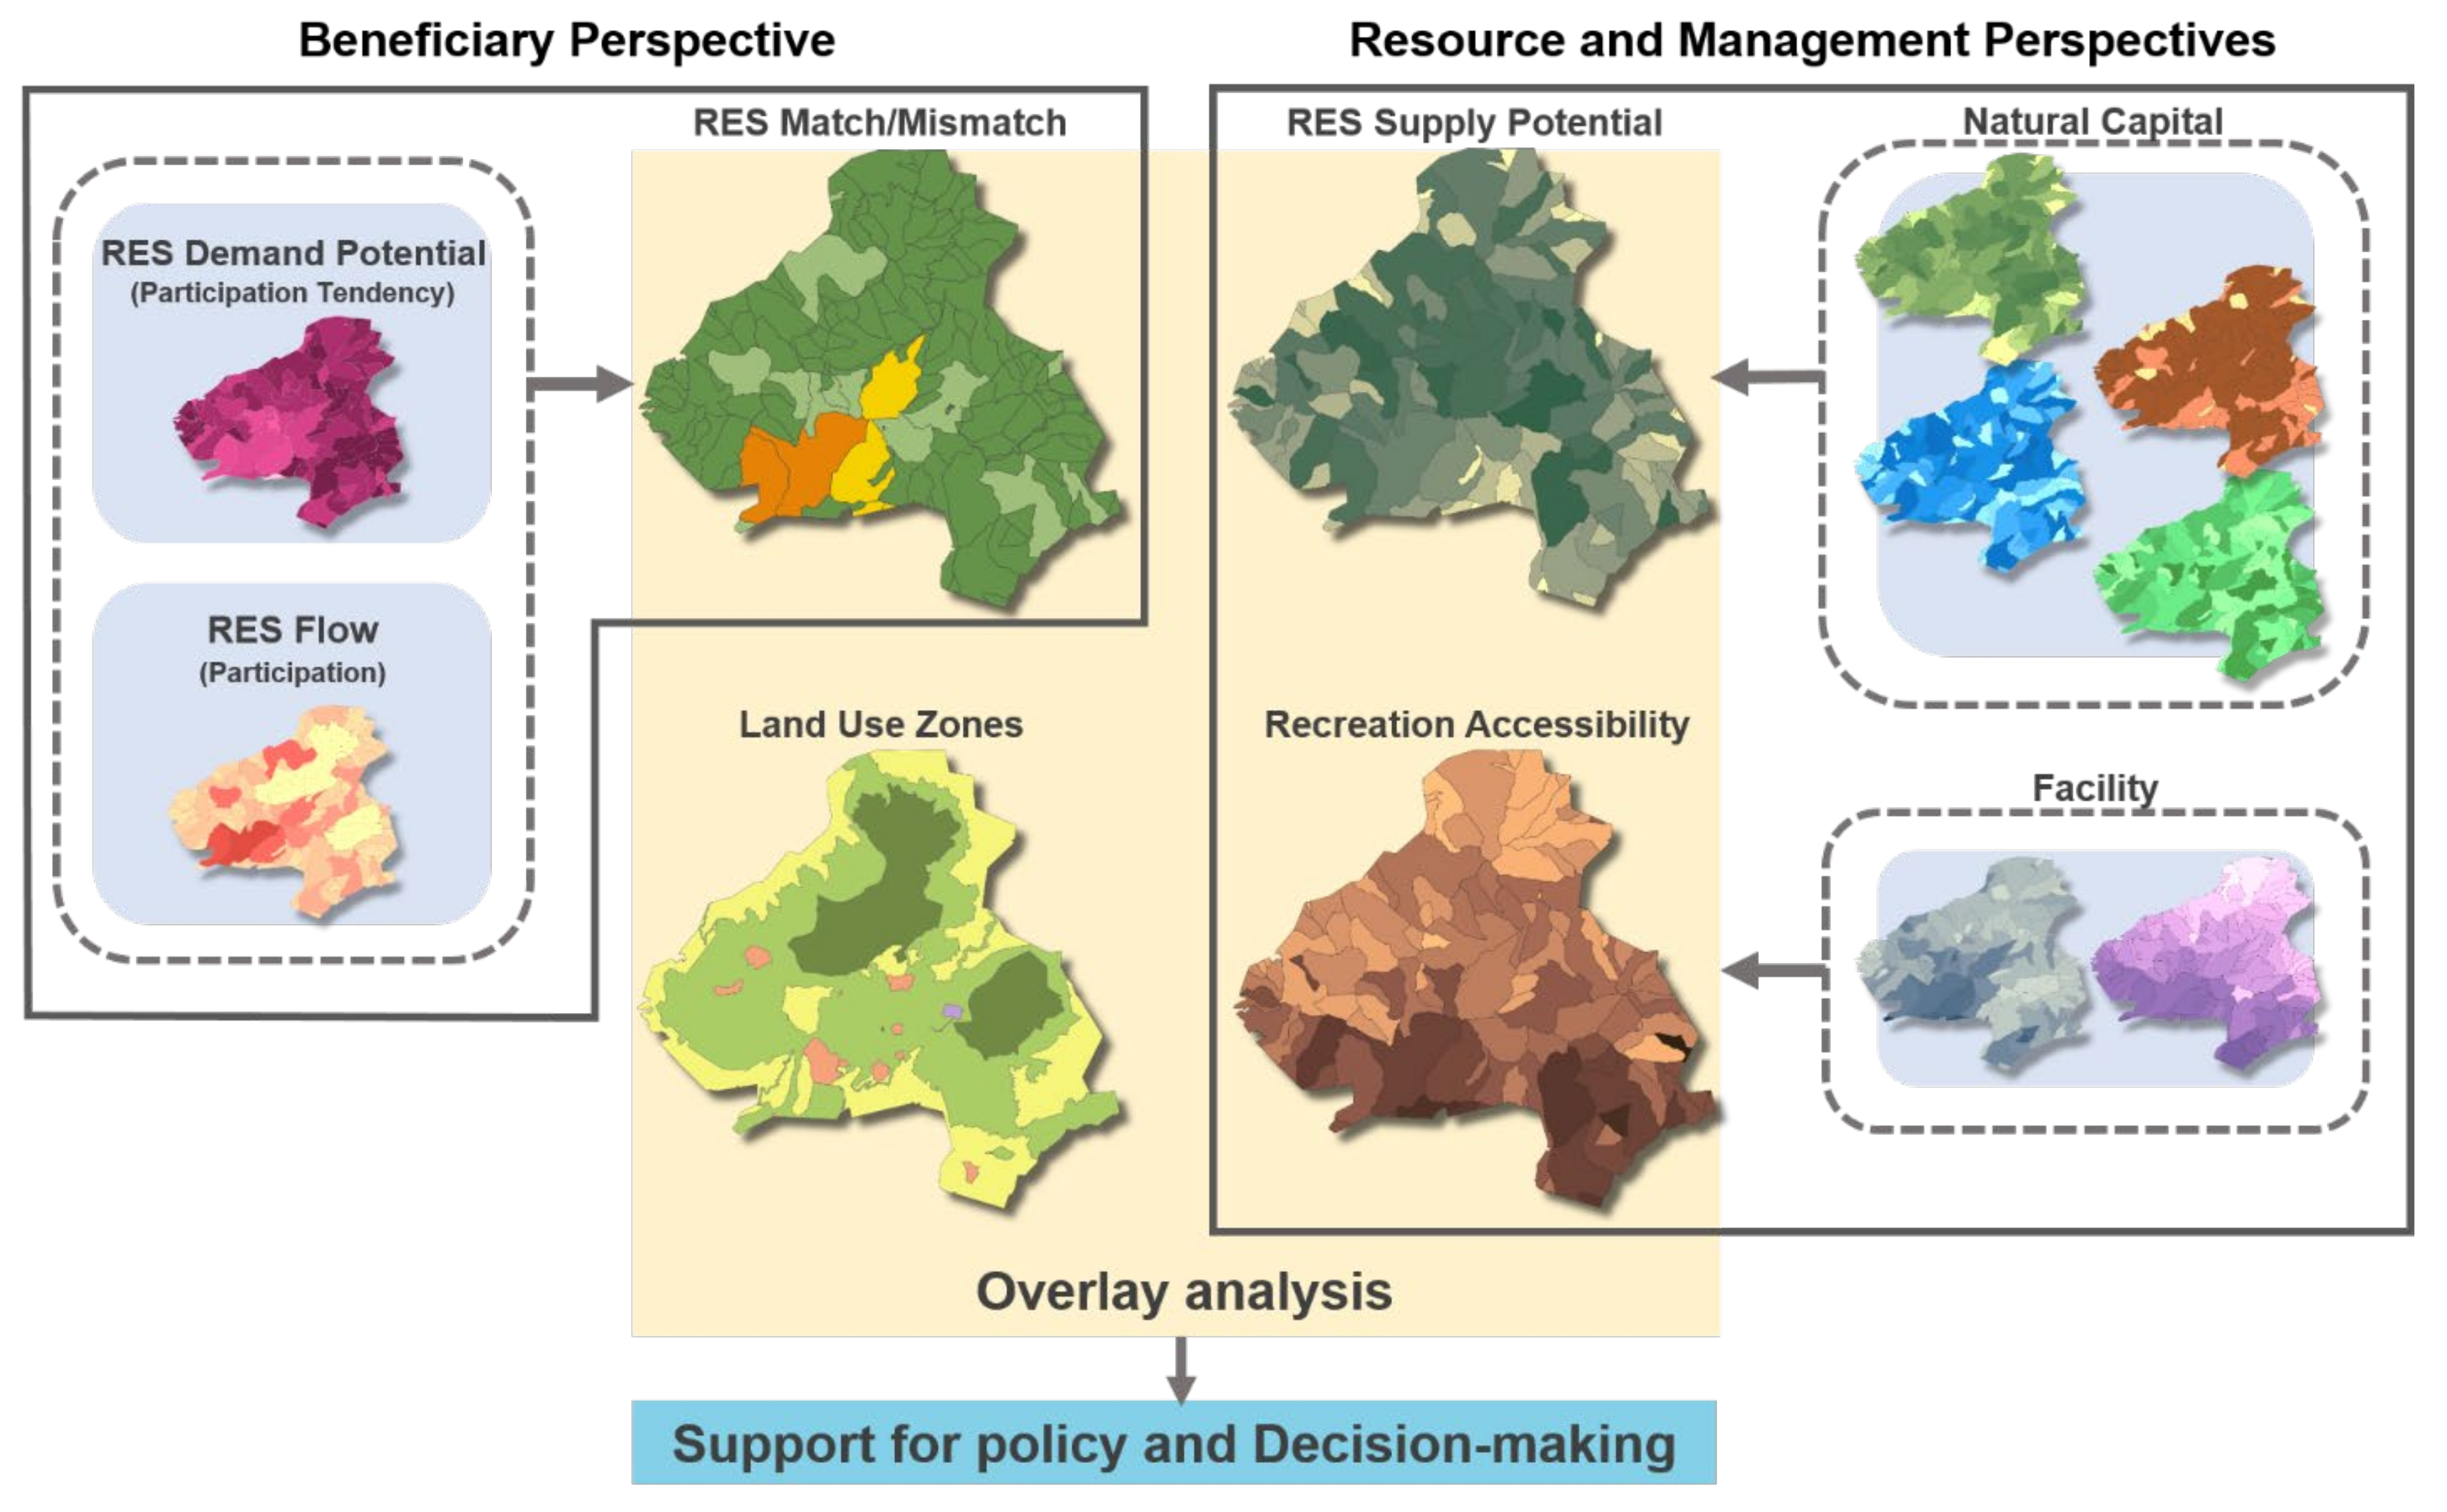
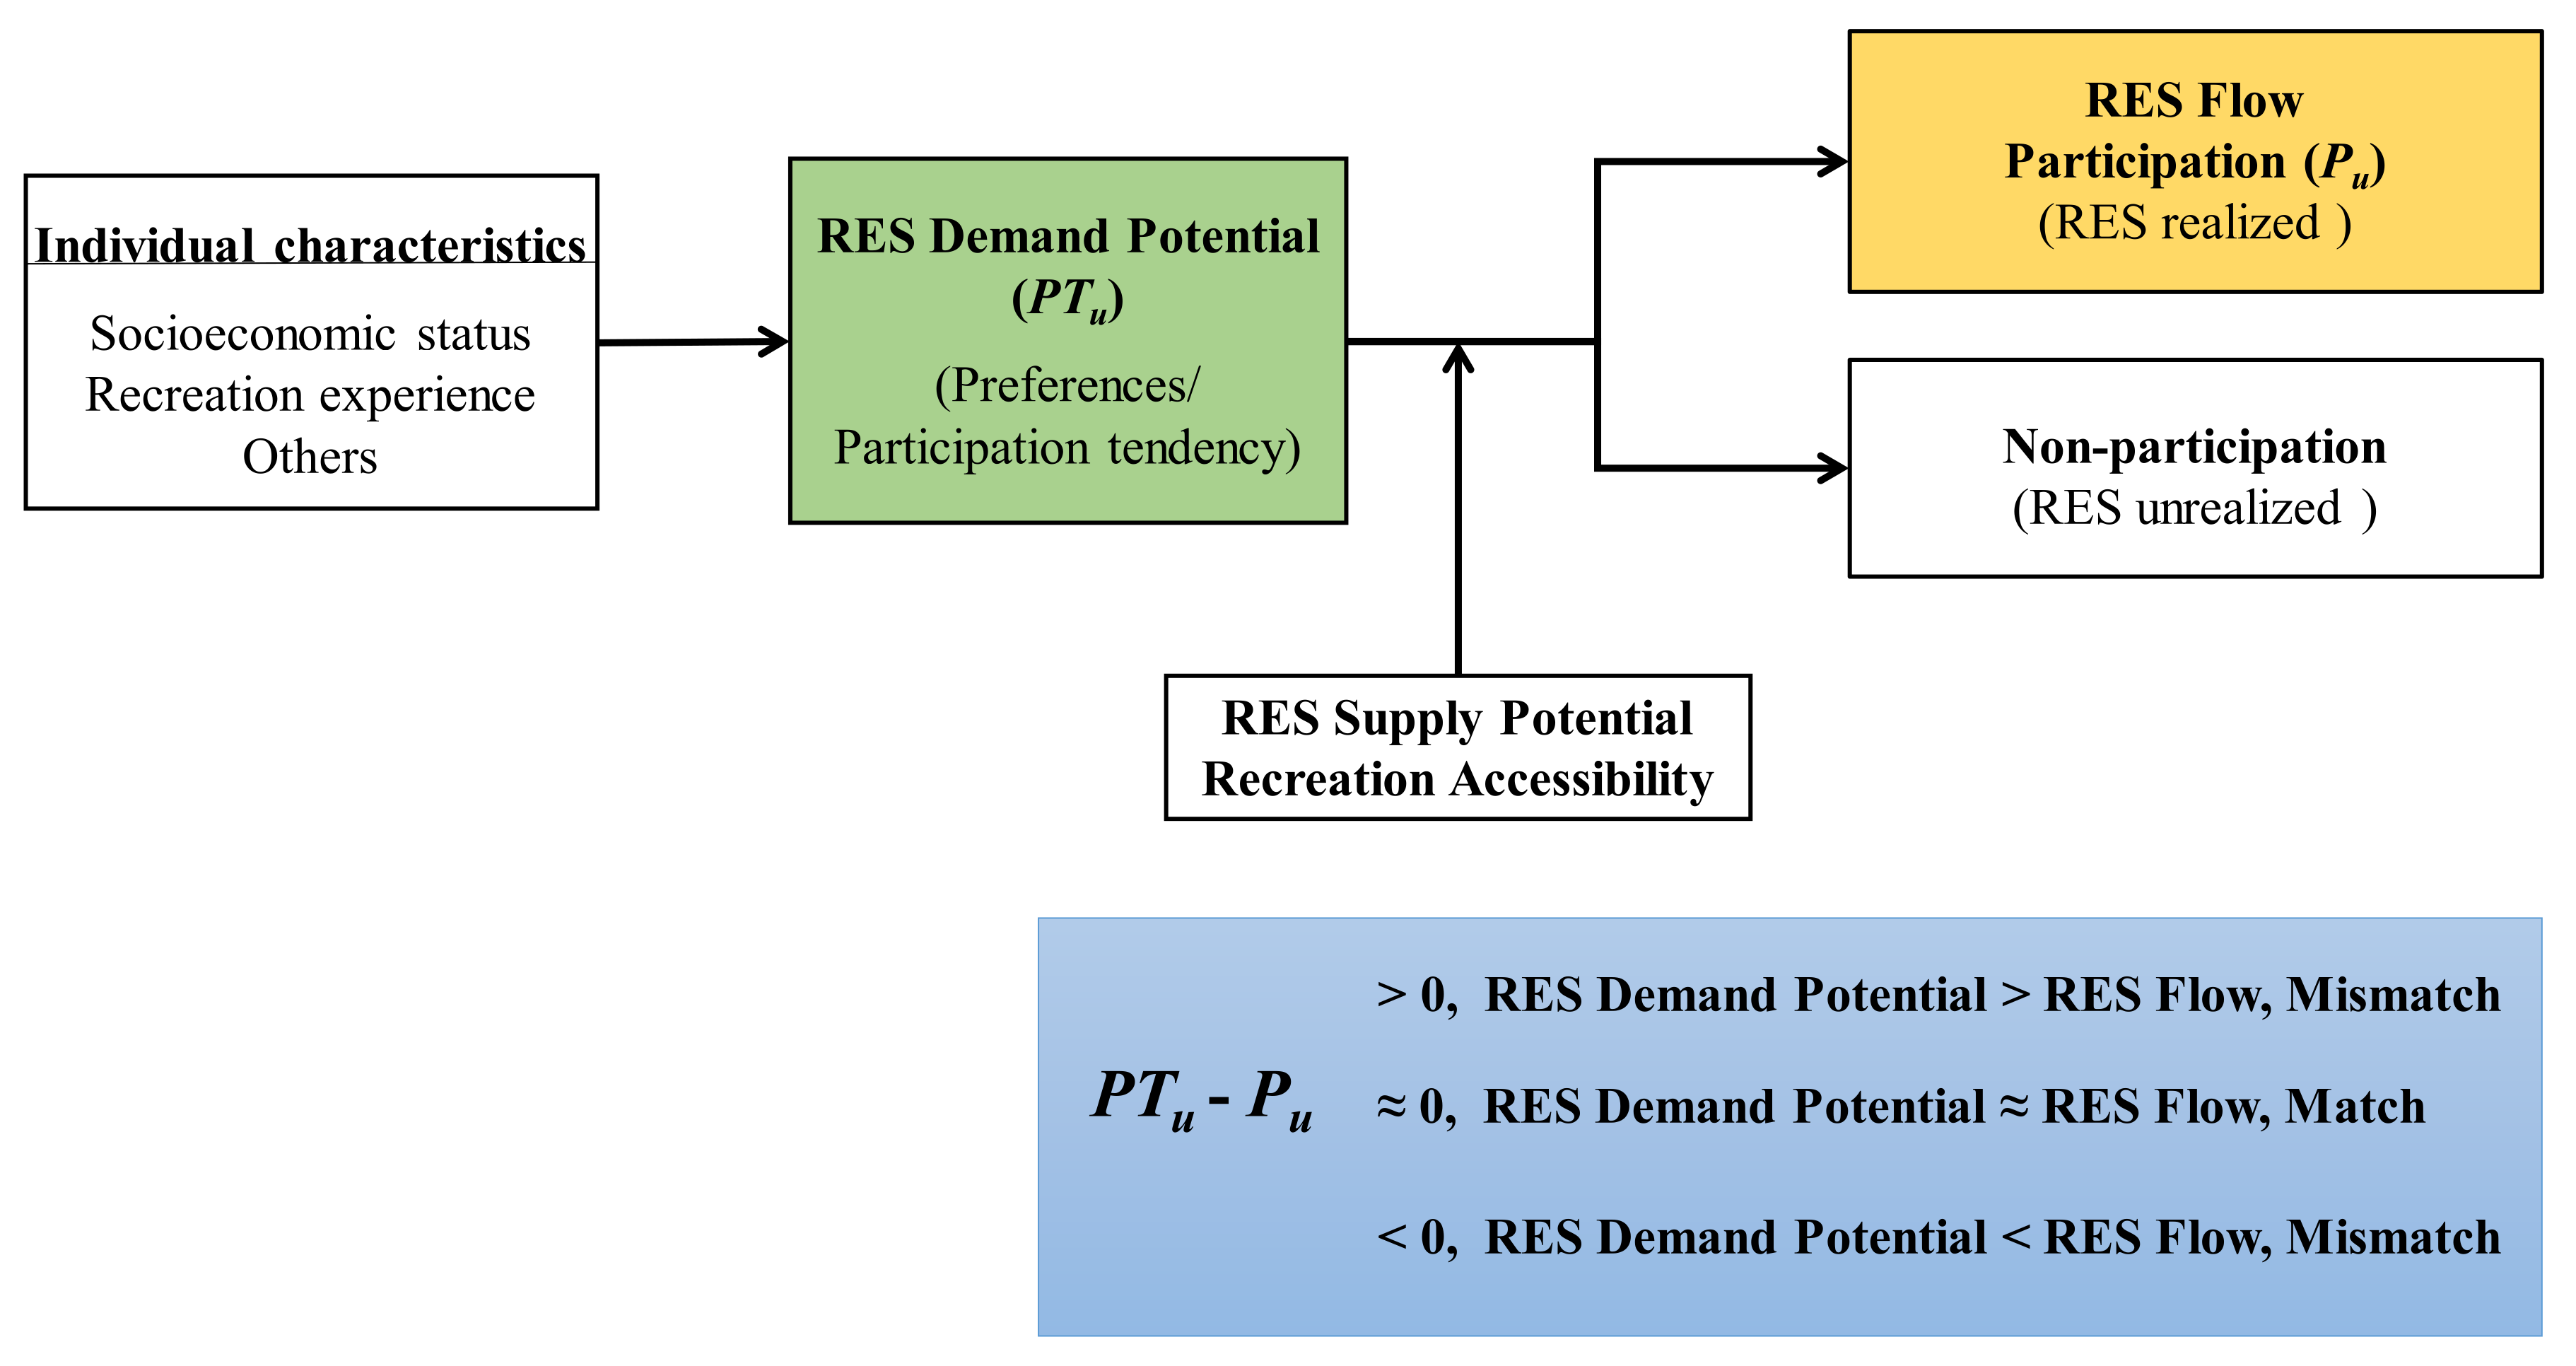
This study proposed a method that consisted of assessment and overlay analysis parts (Figure 2). According to previous studies [7,15,16,17,18,19], this study adopted an indicator assessment method to assess RES Supply Potential and Recreation Accessibility. This study administered web-based questionnaires to collect the participation tendency and the actual visits of the beneficiaries to assess the RES Demand Potential and the RES Flow, respectively. Based on the relationship between recreation demand and participation [21,22], RES Flow appeared when RES Supply Potential and Recreation Accessibility met the RES Demand Potential, RES realized; otherwise, RES Flow would not appear, RES unrealized. We compared the beneficiary’s participation tendency and participation to detect RES Match/Mismatch directly. When participation tendency was close to actual visits, the RES Demand Potential matched with the RES Flow; otherwise, mismatched (Figure 3). In protected areas, core protected areas are usually prohibited for recreational utilization, and the preserved natural capital usually has high recreation attraction. In YNP, Zone EPA is not allowed to enter for recreation; no RES Flow appears. The RES demand might therefore shift from Zone EPA to other areas where affordable to realize RES demand and result in RES Flow being greater than RES Demand Potential.
Furthermore, RES Supply Potential and Recreation Accessibility were overlaid with the land use zones to check the management outcome. RES Match/Mismatch was overlaid with RES Supply Potential, Recreation Accessibility, and land use zones to examine the supply status of recreation resources and management with different matching levels to provide specific management information.
The indicators were varied in units and scales; this study used the Min-Max Normalization method to obtain dimensionless indicators for further analysis. The details are described in the following subsections.

2.2.1. Spatial Quantification Unit

A grid was a commonly used quantification unit for spatial analysis. Stępniewska [26] pointed out that ecosystem assessment should be carried out in specific spatial units such as floodplains, watersheds, and horizons. Watersheds are natural catchments for collecting water, the species similarity in the same watershed is high, and the microhabitat variation is small [27]. People can overlook the environment within the region from the edge of the watershed, which is conducive to spatial management.
This study used watersheds as the spatial quantification unit to better reflect the environment’s real differences to facilitate the application of subsequent management actions. YNP was divided into 122 spatial units (u) (Figure S3). The average area for the 122 spatial units was 929,242 m2; the maximum and minimum areas were 5,200,781 m2 and 33 m2, respectively.
The primary input datasets were land cover (polygon dataset, scale 1:5000), land use zones (polygon dataset, scale 1:1000), and 20 m resolution Digital Elevation Model (DEM). The land cover and DEM were derived from the National Land Surveying and Mapping Center, Ministry of the Interior, and the land use zones were from the YNP administration. The land cover dataset at a scale of 1:5000 is made from aerial images with 25 cm resolution by National Land Surveying and Mapping Center, Ministry of the Interior. In addition, 25 cm resolution aerial images were used to identify the road cover.

2.2.2. RES Supply Potential Assessment

This study used the indicator assessment method to assess RES Supply Potential. We reviewed previous studies [7,15,16,17,18,19] to derive the four indicators that were most commonly used and demonstrated to be proxies for people’s preferences for recreation to assess the RES Supply Potential provided by natural capital. The four indicators included naturalness, water body, relief and presence of summit, and landscape diversity.
Referring to Paracchini et al. [28] and Peña et al. [16], the four indicators were considered equally important in providing RES and were given equal weights. For each spatial unit, this study first accumulated the four indicators’ normalized values and then conducted Min-Max Normalization on the sum to obtain RES Supply Potential for each spatial unit ( RES   Supply   Potential u ). The details and calculation methods for the four indicators were as follows.

Naturalness

Areas with high naturalness are more attractive for recreation than areas with low naturalness [16,29,30]. According to de Groot et al. [31], land cover and management practices influence ES supply. This study calculated each spatial unit’s naturalness by land cover and land use zones.
In YNP, the post-volcanic activities have led to warmer soil temperature, calcium deficiency, and strong acidic soil, accompanied by heavy precipitation and low temperature during the northeast monsoon season; therefore, YNP has subtropical rain forests, temperate evergreen broad-leaved forests, and grasslands. The forests have high biodiversity and naturalness. In contrast to the forests, the distribution of the grasslands is closer to post-volcanic activities; therefore, only Miscanthus and Arundinaria usawai can survive, resulting in low biodiversity. The post-volcanic activities can be seen on volcanic bare lands, which are remarkable landscapes in YNP. The grasslands are a great viewpoint to appreciate volcanoes, but recreation activities and facilities decrease their naturalness. Wetlands in YNP are surrounded by vegetation and are habitats for rare species. In addition, YNP is the origin of thirteen streams, and the varied topography shapes diverse stream landscapes within YNP. Irrigation ditches deliver surface water from the streams. The irrigation system distributes water to farmlands. Nowadays, many farmlands are abandoned and backed to nature status. The scattered agricultural lands are remnant farmlands from the past and are cultivated by local farmers. The constructed parks in YNP are more natural than urban parks because they are surrounded by vegetation.
Referring to Peña et al. [16], the scores of naturalness for each land cover (NLCi) were: artificial surfaces (0), agricultural land (1), parks (2), grassland (3), stream or irrigation ditches or volcanic bare land (4), wetland (5), and forest (6). Scores of naturalness for each land use zone (NLZi) were given according to the YNP land use zones: EUA (0), RA (1), SA (2), CHA (3), and EPA (3).
The calculation equation of naturalness for each spatial unit ( Naturalness u ) was as Equation (1):
Naturalness u = N L C i × N L Z j × A i j A
where NLCi is the score of naturalness for land cover i (i = 1~9), NLZi is the score of naturalness for land use zone j (j = 1~5), Aij is the area of the i-th land cover with j-th land use zone in the spatial unit, and A is the area of the spatial unit u.

Water Body

Water bodies have a specific attraction [16,30], and different types of water bodies provide various recreation attractions [17,28,32]. In this study, the water body for each spatial unit ( Water   body u ) was calculated by the proportion of water area in the unit; and different weights were given to different types of water bodies: stream (1) and wetland (2). The calculation equation of the presence of water for each spatial unit was as Equation (2):
Water   body u = The   area   of   s t r e a m   1 + The   area   of   w e t l a n d   2 A
where A is the area of the spatial unit u.

Relief and Presence of Summit

Topographic relief and mountains are attractive [16,30]. This study used a digital terrain model to calculate average topographic relief and count the summit number in each unit. Referring to Peña et al. [16], relief and presence of summit scores for each spatial unit were average topographic relief ≥32 m (2), average topographic relief <32 m and with some summits (1), average topographic relief <32 m and no summits (0).

Landscape Diversity

A diversified landscape is more attractive than a homogeneous landscape [30]. Landscape diversity refers to the temporal, spatial, and functional diversity and variability of different types of elements or ecosystems. The more the types of environments in the space, the higher the diversity of the landscape. Referring to Peña et al. [16], we calculated the landscape biodiversity for each spatial unit ( L a n d s c a p e   d i v e r s i t y u ) by Shannon’s diversity index, as shown in Equation (3):
L a n d s c a p e   d i v e r s i t y u = A R i   l n A R i
where ARi is the percentage of the i-th land cover area to the spatial unit area; i = 1~9.

2.2.3. Recreation Accessibility Assessment

Accessibility describes how easy it is for people to get to the recreation sites [33] and is often measured by road density, distance from the residence, and travel time [34]. Distance from the residence and travel time measured similar effects on accessibility but were different in measurement units. However, measured by travel time was more susceptible to traffic conditions and variated than that measured by the distance from the residence. Therefore, this study reviewed previous studies [7,15,16,18] to derive road density and distance from the residence as the quantitative indicators of Recreation Accessibility.
The two indicators were given equal weights because they contributed similarly to people’s access to the recreation sites. This study first accumulated the two indicators’ normalized values for each spatial unit and then conducted Min-Max Normalization on the sum to obtain Recreation Accessibility for each spatial unit ( Recreation   Accessibility u ). The details and calculation methods were as follows.

Road Density

Roads and other infrastructures can lead people to engage in recreational activities at recreation sites. A good infrastructure network can promote more recreational activities [16,35].
Road density is usually measured as the length of the roads per unit area. This study measured road density for each spatial unit ( Road   density u ) as the area of the roads per unit area to reflect the service capacity of the road, as shown in Equation (4):
Road   density u = T h e   a r e a   o f   r o a d A
where A is the area of the spatial unit u.

Distance from the Residence

People prefer recreation areas relatively close to their residences [30,36]. The closer they are to the urban dwellers’ residences, the more attractive the recreation areas are.
This study calculated the distance from residence for each spatial unit ( Distance   from   the   Residence u ) as the average shortest driving distance from the center of each spatial unit to the center of the 48 administrative districts of the Taipei Metropolitan Area, as shown in Equation (5):
Distance   from   the   Residence u = 1 48 k = 1 48 D D k
where DD is the shortest driving distance from the k administrative districts of the Taipei Metropolitan Area to the center of u spatial unit.

2.2.4. RES Demand Potential and RES Flow Assessment

This study used web-based questionnaires to collect the RES Demand Potential and RES Flow assessment data. The beneficiary of the RES provided by YNP was defined as the dwells of the Taipei Metropolitan Area. This study administered web-based questionnaires in October 2018 to survey Taipei Metropolitan dwellers over the age of 20. This study distributed questionnaires through various social networking platforms and public or private associations to collect samples using a snowball sampling strategy.

Questionnaire Design

The questionnaire included (1) the sociodemographic information of the respondents (gender, age, education level, and occupation), (2) their recreation participation tendency toward the land cover types of YNP, and (3) the number of actual visits to the land cover types of YNP in the past two years.
According to the features and definitions of each land cover type, this study collected YNP photos from Flicker, the administration, and researchers. We selected five photos for each land cover type. Respondents must view photos and descriptions of the land over types of YNP before answering questions. The question for recreation participation tendency was “how much do you want to engage in recreational activities in this type of environment”; 0–10 points, “0” is graded as do not want to go there at all, “10” is graded as want to go there very much. The question for the actual visits was “how many times have you visited this type of environment in the past two years to engage in recreational activities.” The content validity of the questionnaire and the representativeness of the photos were evaluated by five experts with recreation backgrounds.
As there are nine types of environments, to avoid the influence of the filling order on the participation tendency and actual visits caused by the lengthy questionnaire, this study designed two versions of the survey to increase its reliability. The questions in the two versions were the same, except for the photos provided for respondents to view and answer. Version A included forest, artificial surfaces, volcanic bare land, agricultural land, and stream environments; Version B included wetland, park, forest, grassland, and irrigation ditches environments for respondents to view and answer. The respondents were randomly directed to one of the versions through web page redirection grammar after entering the website.
Since forest is the main land cover type of YNP, both versions contained forest for respondents to view and answer. A t-test examined respondents’ participation tendency and the actual visits to the forest to verify whether versions A and B data could be merged for subsequent analysis. Two versions of web-based questionnaires are provided in the supplementary material.

RES Demand Potential Assessment

This study collected the recreation participation tendencies of the beneficiaries toward land cover types of YNP (PTLCi) through web-based questionnaires. The calculation equation of RES Demand Potential for each spatial unit ( PT u ) was as Equation (6).
PT u = P T L C i × A i A
where PTLCi is recreation participation tendency of the beneficiaries toward land cover i (i = 1~9), Ai is the area of the i-th land cover in the spatial unit, and A is the area of the spatial unit u.
The values of PT u were further normalized by conducting Min-Max Normalization to obtain the PT u for each spatial unit.

RES Flow Assessment

This study collected the percentages of actual visits to land cover types of YNP (PLCi) through web-based questionnaires and obtained the total visitation of YNP (N) from the YNP Administration’s statistics to assess the RES Flow. First, visitor density for each land cover (DLCi) was calculated by using Equation (7).
DLC i = N × P L C i T A i j
where N is 6,629,849 persons (2017–2018), PLCi is the percentages of actual visits to land cover i (i = 1~9), and TAij is the total area of the i-th land cover with j-th land use zone. Here, j = 1~4; because Zone EPA is not accessible.
Then, RES Flow for each spatial unit was assessed by Equation (8).
P u = ( D L C i × A i j )
where DLCi is the visitor density of land cover I (i = 1~9), and Aij is the area of the i-th land cover with j-th land use zone. j = 1~4, except Zone EPA.
The values of P u were further normalized by conducting Min-Max Normalization to obtain the P u for each spatial unit.

2.2.5. RES Match/Mismatch Detection

RES Match/Mismatch for each spatial unit (PTPu) was calculated by Equation (9). The closer that PTPu was to 0, the closer the RES Flow was to the RES Demand Potential of the beneficiaries.
P T P u = P T u P u
where PTu is the normalized value of RES Demand Potential for spatial unit u and Pu is the normalized value of RES Flow of spatial unit u.
The matching relationship was further classified by an interval of ±0.2. Five levels of RES Match/Mismatch included MM+2 (RES Demand Potential ≫ RES Flow), MM+1 (RES Demand Potential > RES Flow), M (RES Demand Potential ≈ RES Flow), MM−1 (RES demand Potential < RES flow), and MM-2 (RES Demand Potential ≪ RES Flow).

2.2.6. Overlay Analysis

This study conducted an overlay analysis to examine the spatial relationship between the RES Match/Mismatch and the resource supply status to provide specific management information. The RES Supply Potential and Recreation Accessibility were first classified into five levels to be consistent with the five RES Match/Mismatch levels.
This study overlaid RES Supply Potential and Recreation Accessibility with land use zones to check the management outcome. Then, this study overlaid RES Match/Mismatch with land use zones to examine the spatial relationship between land use management and RES Match/Mismatch status. Finally, RES Match/Mismatch was compared with RES Supply Potential and Recreation Accessibility to examine the supply status of recreation resources and management with different matching levels to provide specific management information.

3. Results

3.1. Statistical Results of the SAMPLES

3.1.1. Sample Composition

This study obtained 634 valid questionnaires (95% confidence level, 4% confidence interval), 317 questionnaires from Version A, and 317 questionnaires from Version B. The gender of the respondent was almost equilibrant. The majority of ages ranged from 20–29 years old (38.9%), followed by 30–39 years old (31.7%), and few respondents were over 70 years old (0.5%). The respondents’ highest proportion of education levels was university educated (59.2%), followed by graduate school and above (23.2%). In terms of occupation, the business had the largest proportion (20.7%), followed by the service industry (18.9%) and students (18.4%). Figure S4 shows the sociodemographic information of the respondents.
As shown in Table 1, the t-test results showed that there were no significant differences between versions A and B in terms of recreation participation tendency toward forests (t = −0.939, p > 0.05) and the number of visits to the forests (t = 0.426, p > 0.05). Therefore, this study regarded the samples of the two versions as a homogeneous sample group and merged the data for subsequent analysis.

3.1.2. Recreation Participation Tendency and Actual Visits

The results of the questionnaire survey showed that the respondents had the highest participation tendency toward forests (mean = 8.0), followed by grasslands (mean = 7.6), and then streams (mean = 7.2). Recreation participation tendency on irrigation ditches was the lowest (mean= 5.1). The average recreation participation tendencies toward land cover types of YNP shown in Table 2 were used as PTLCi in Equation (6).
In the past two years, the respondents’ total number of actual visits to different land cover types of YNP was 2657 visits. Among the total visits, respondents had the highest number of visits to forests (402, 15.1%), followed by grasslands (390, 14.7%), and then parks (341, 12.8%). The percentages of actual visits to land cover types of YNP shown in Table 2 were used as PLCi in Equation (7).

3.2. Spatial Distributions of RES Supply-Side and Demand-Side

Naturalness, water body, relief and presence of summit, and landscape diversity of YNP are shown in Figure S5 Road density and distance from the residence of YNP are shown in Figure S6. The distribution maps assessed by the indicators and demonstrated by ArcGIS showed spatial heterogeneity across YNP.

3.2.1. RES Supply Potential and Recreation Accessibility

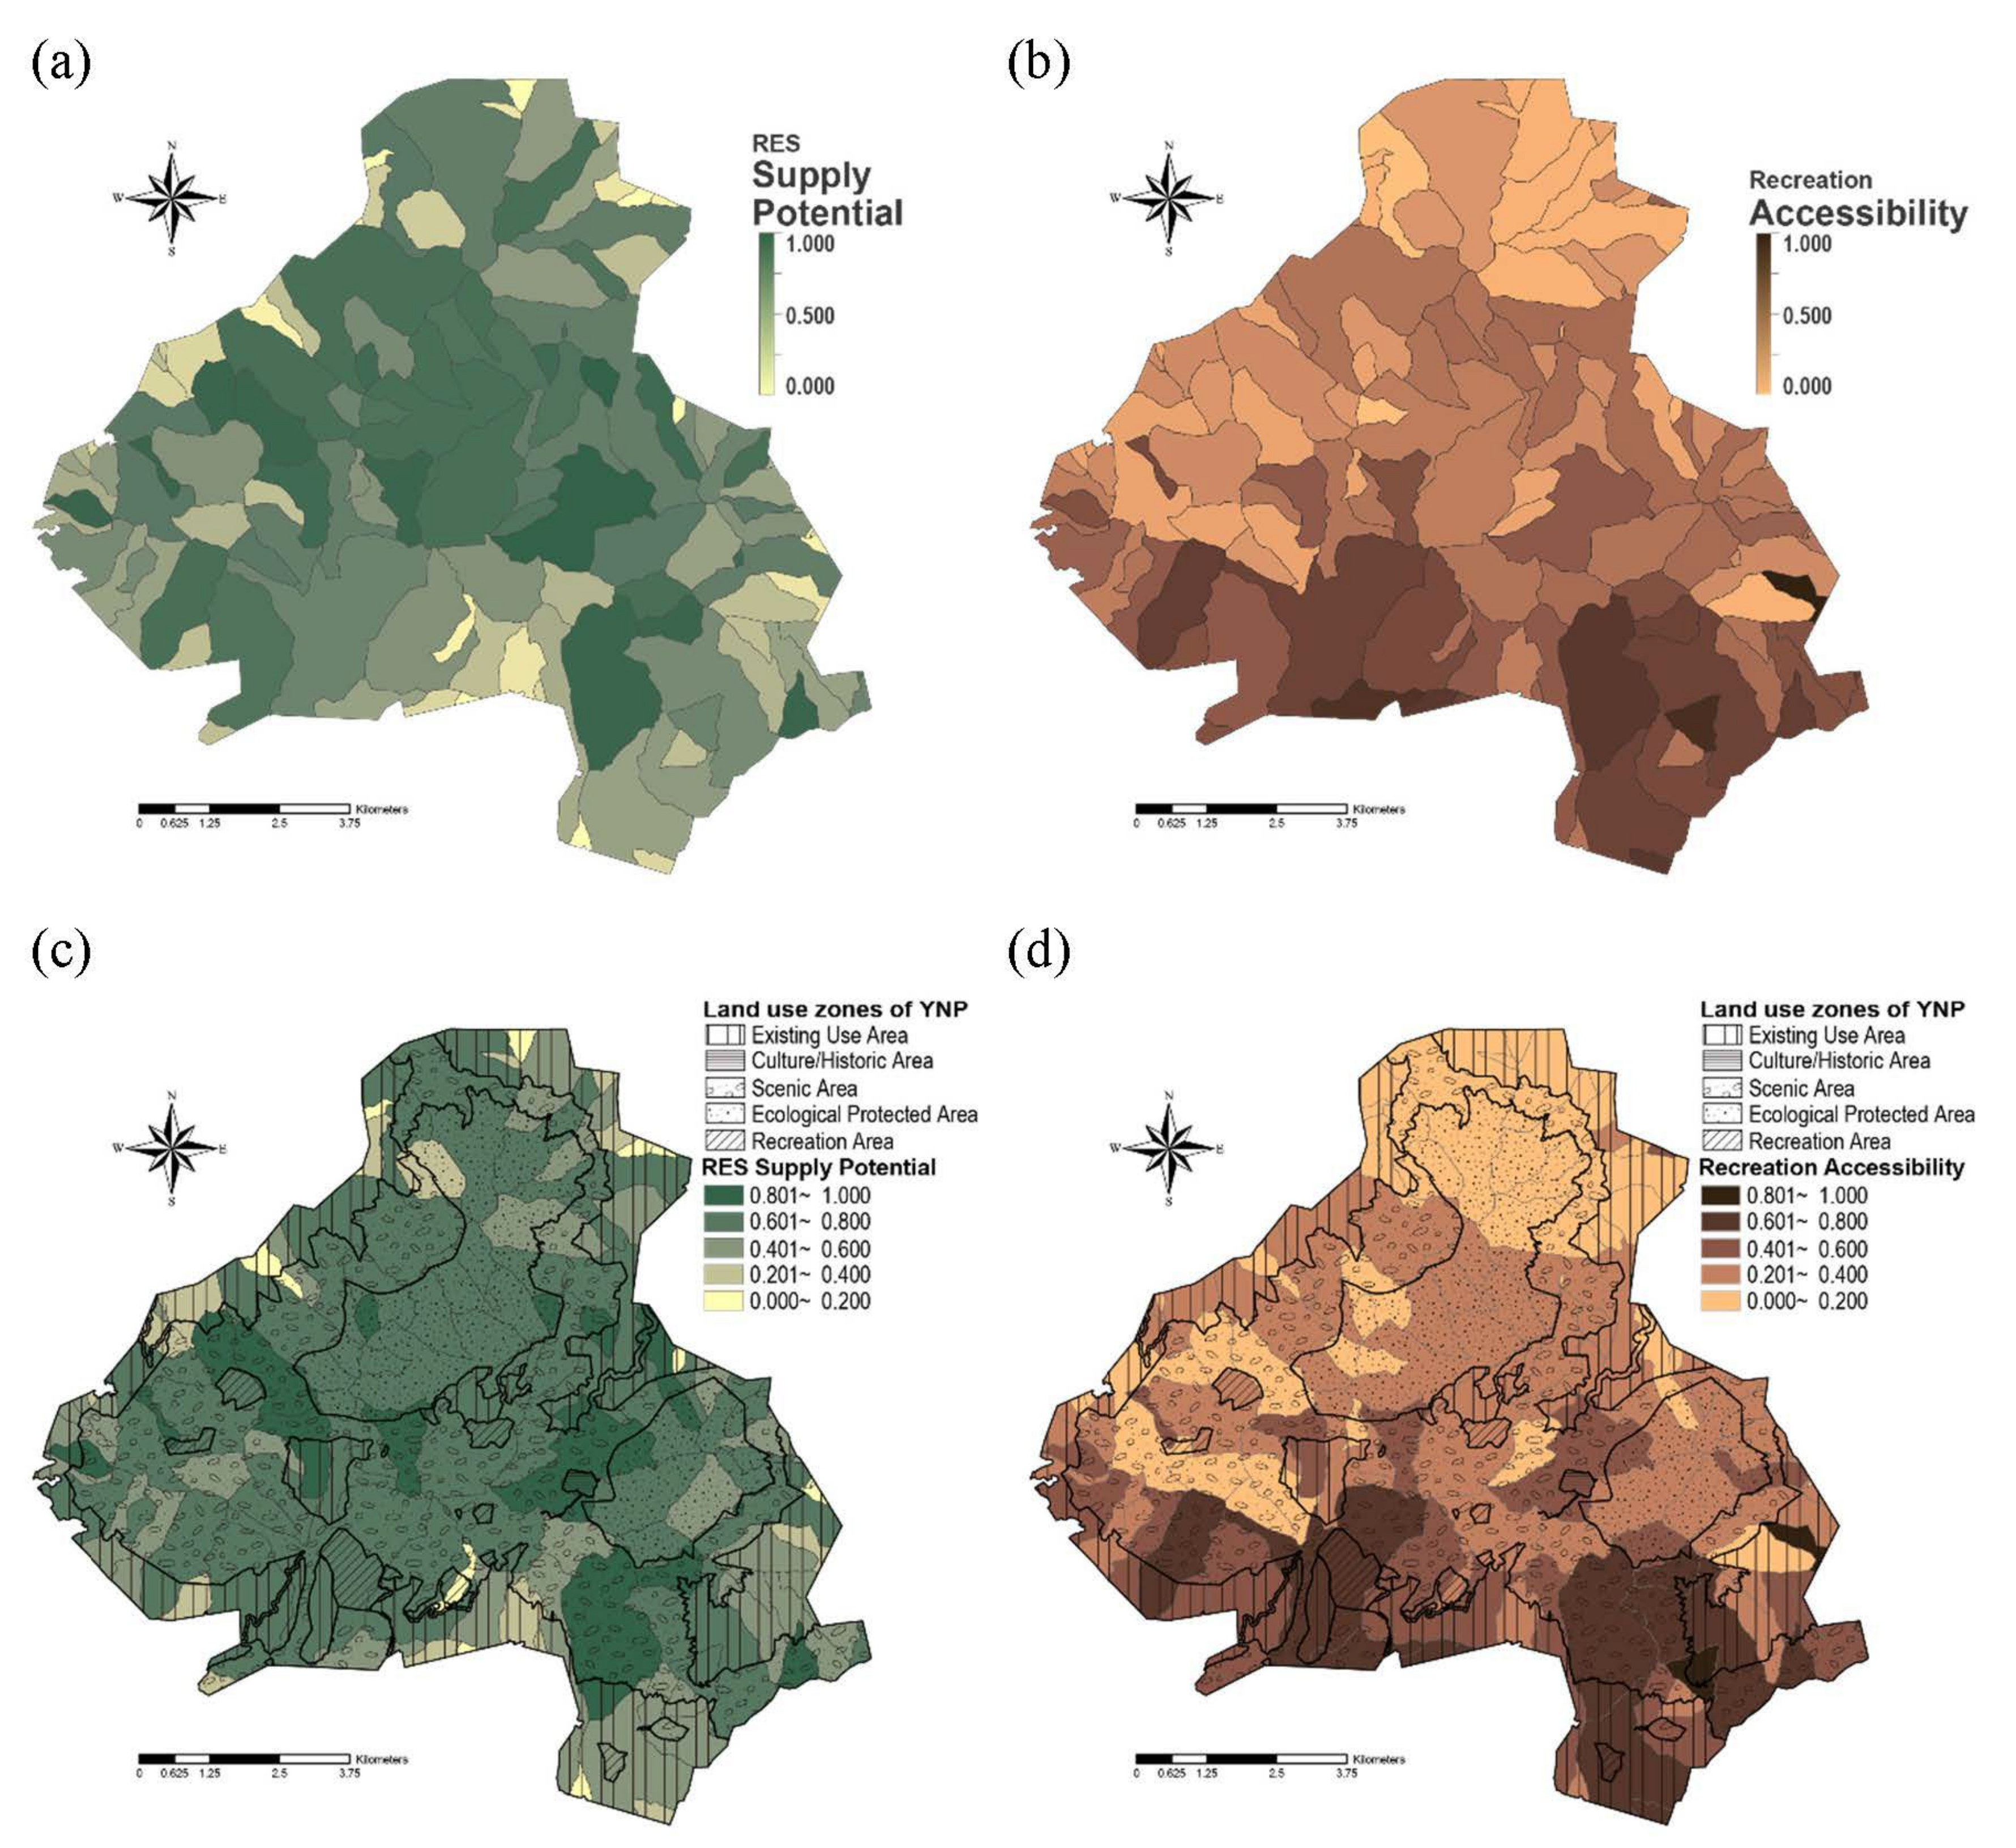
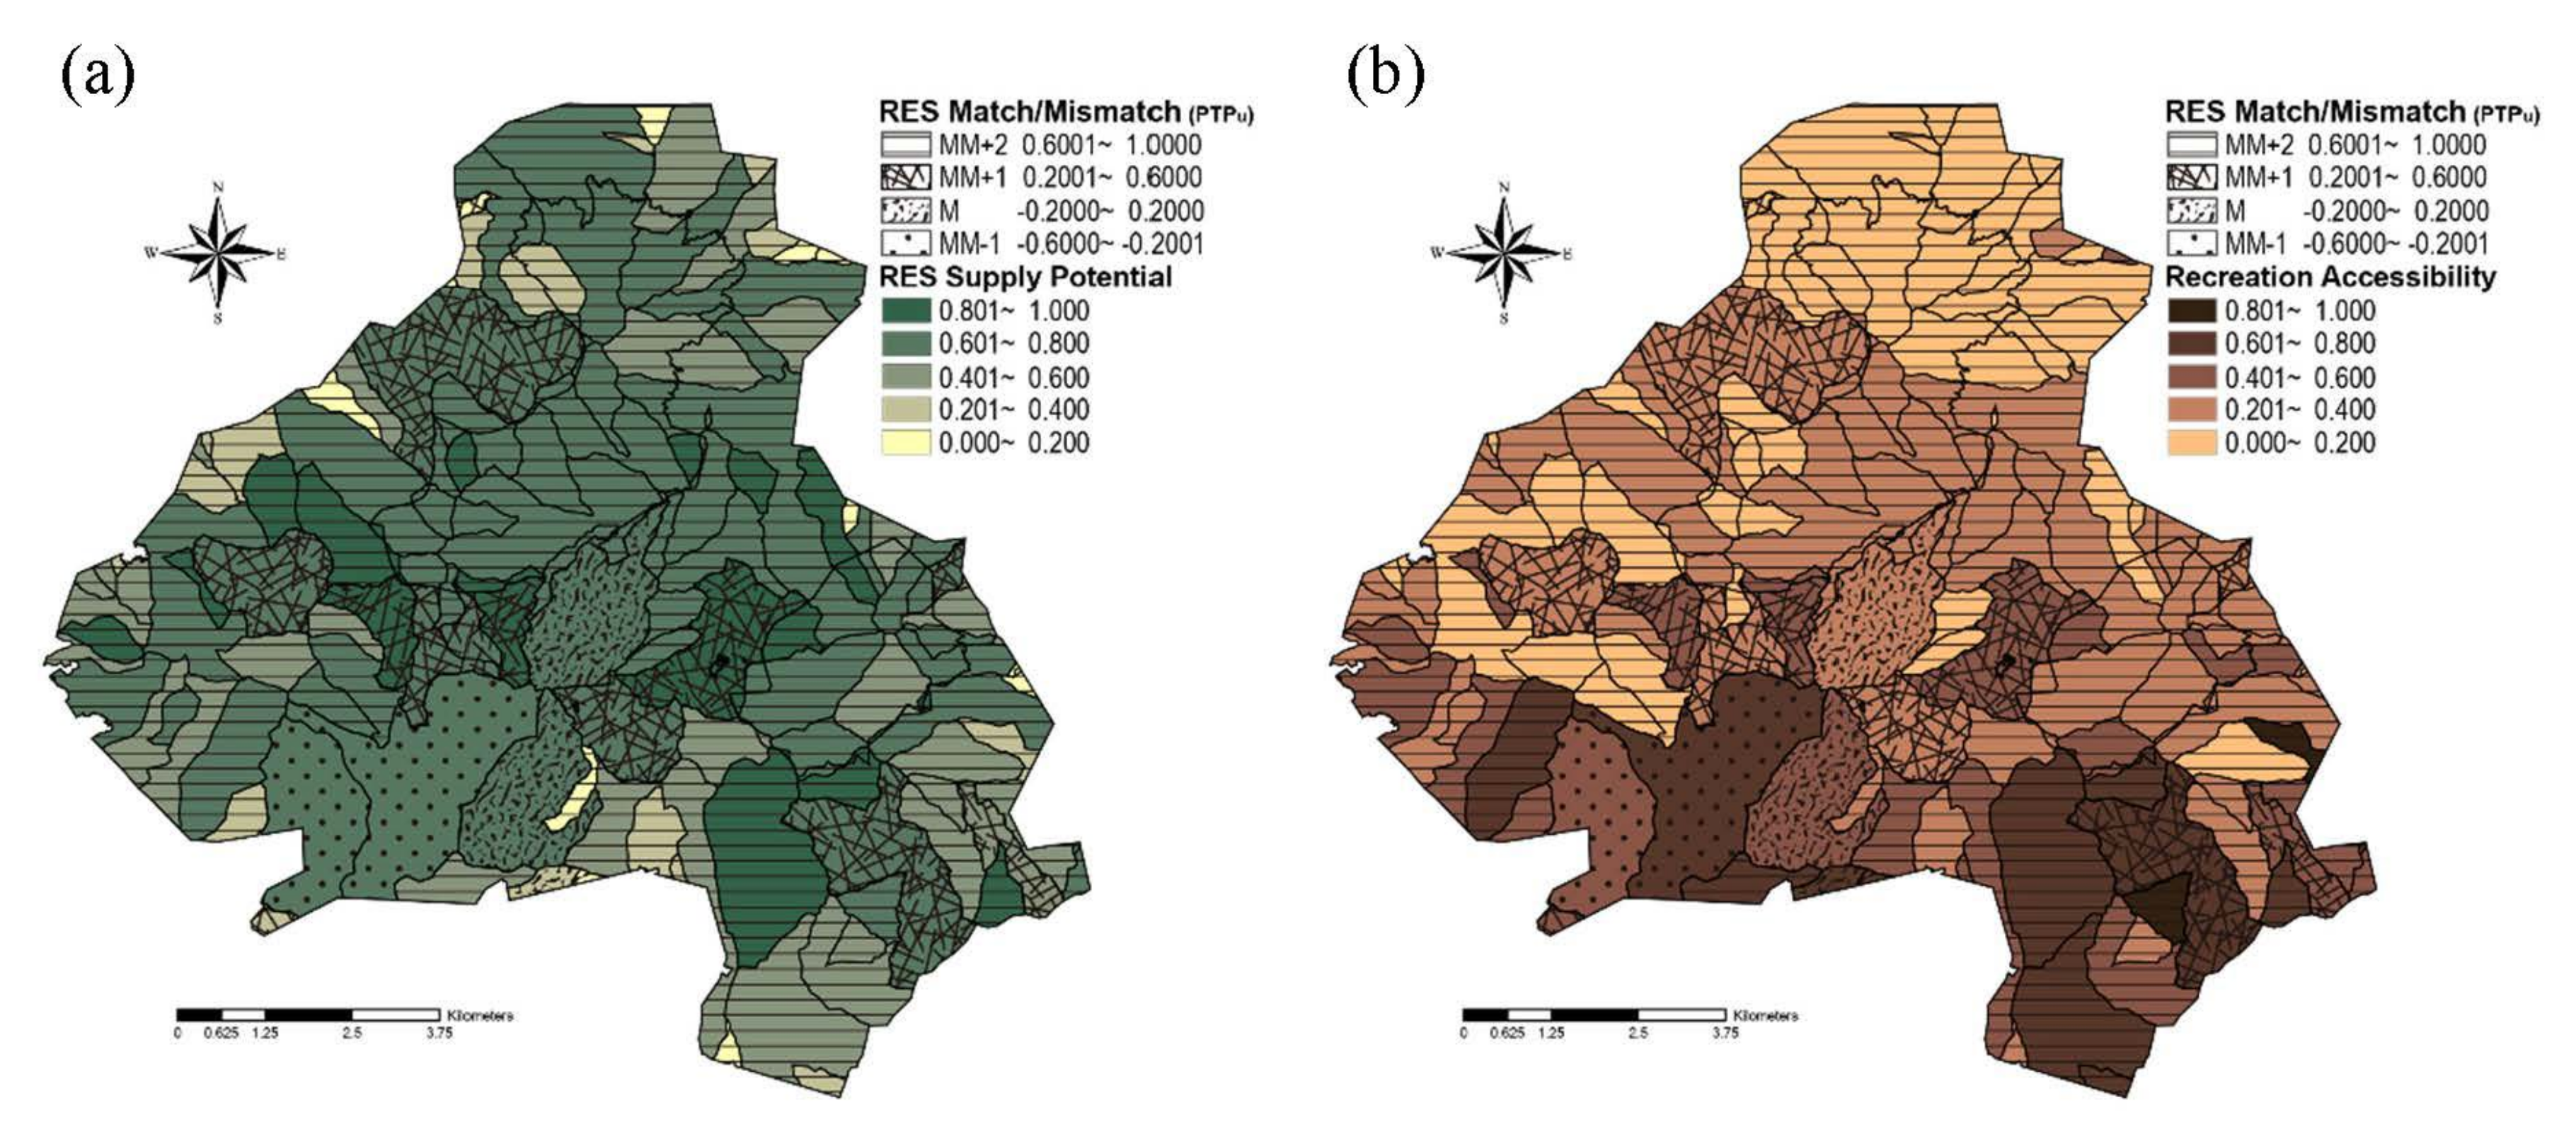
As shown in Figure 4a, the RES Supply Potential of YNP revealed spatial heterogeneity. The area with a RES Supply Potential higher than 0.6 accounted for 63.0%. The high RES Supply Potential areas were mainly located in the north-central part (Mt. Miantian, Mt. Bailaka, Mt. Song and Bayan), as well as Shuangsi in the southeast part (Figure 1). Overlaying with land use zones showed that high RES Supply Potential areas were mainly located in Zones SA, EUA, and EPA (Figure 4c; Table S1). Overall, the RES Supply Potential of YNP was high.
Unlike RES Supply Potential, the Recreation Accessibility of YNP was relatively low (Figure 4b). The area with Recreation Accessibility higher than 0.6 accounted for only 15.9%. The areas with high Recreation Accessibility were mainly located in the southern part (Zhuzihu, Yangming Park, and Shuangsi; Figure 1). Overlaying with land use zones showed that high Recreation Accessibility areas were mainly located in Zones EUA, SA, and RA (Figure 4d; Table S1).

3.2.2. RES Demand Potential and RES Flow

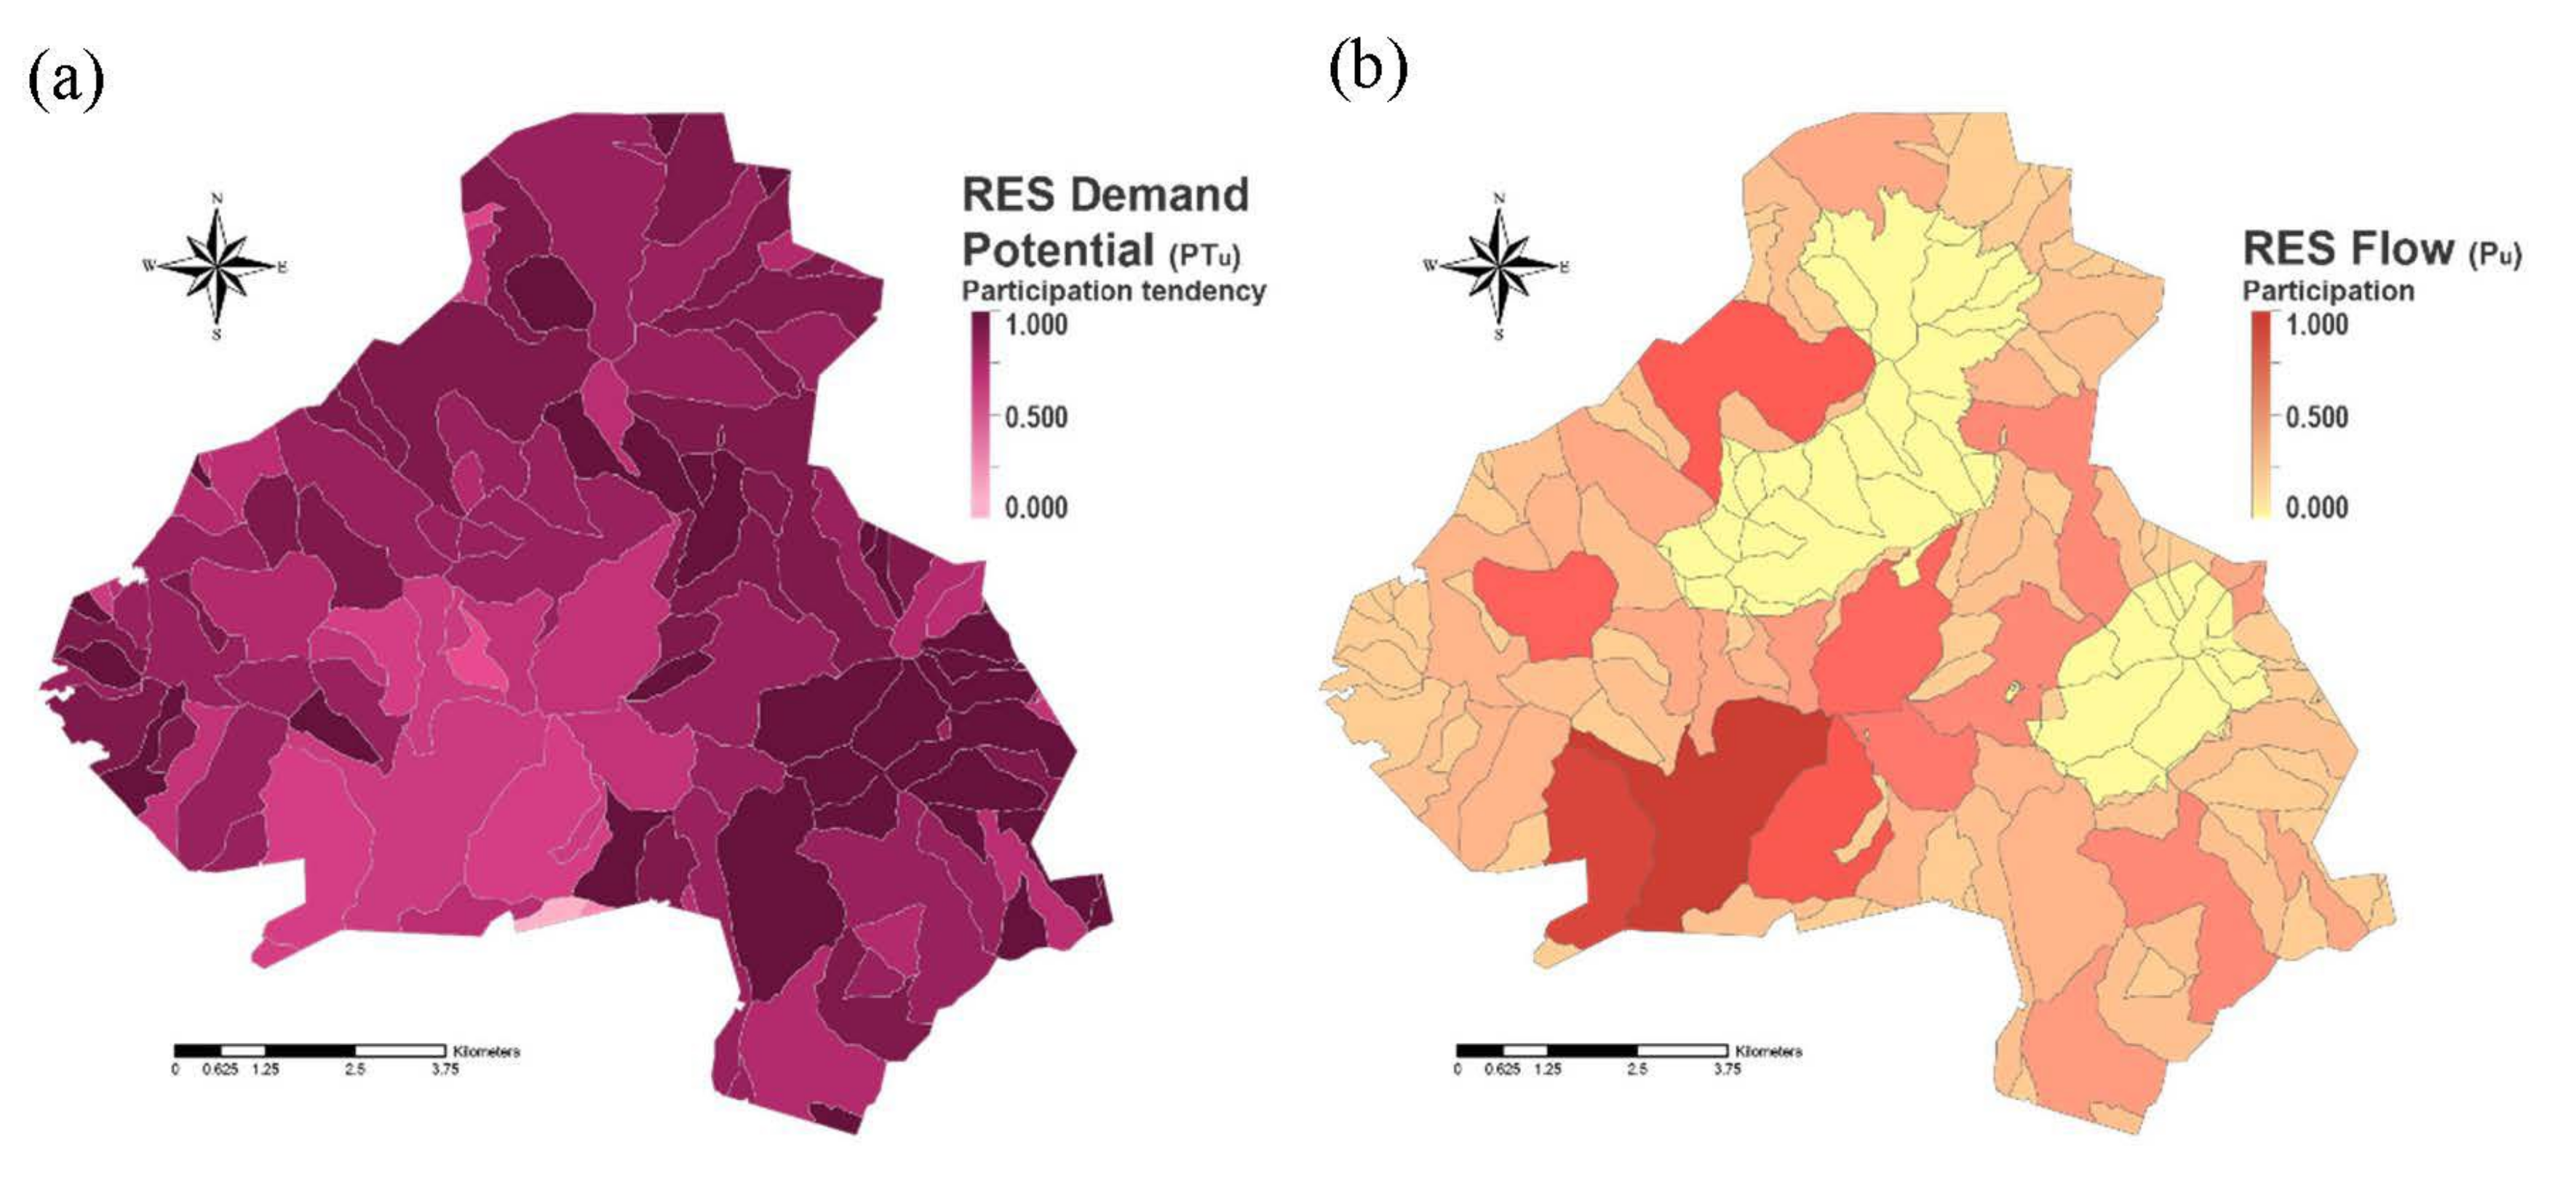
The spatial distribution of the respondents’ RES Demand Potential toward YNP is shown in Figure 5a. The area with RES Demand Potential higher than 0.6 accounted for 95.8%. Only a few areas of YNP were relatively less attractive to the beneficiaries. In other words, the beneficiaries had a high recreation demand potential across YNP.
The spatial distribution of the RES Flow of YNP is shown in Figure 5b. The area with RES Flow higher than 0.6 accounted for approximately 13.5%. Northern and eastern parts of YNP are ecological protection areas restricted to unauthorized entry by the regulation. The southern part of YNP was the main area visited by respondents. In particular, Mt. Qising and Yangming Park had the highest recreation participation, followed by Qingtiangang, Lenshuikeng, and Erziping (Figure 1 and Figure 5b).

3.3. Spatial Distributions of RES Match/Mismatch

3.3.1. Classification of RES Match/Mismatch

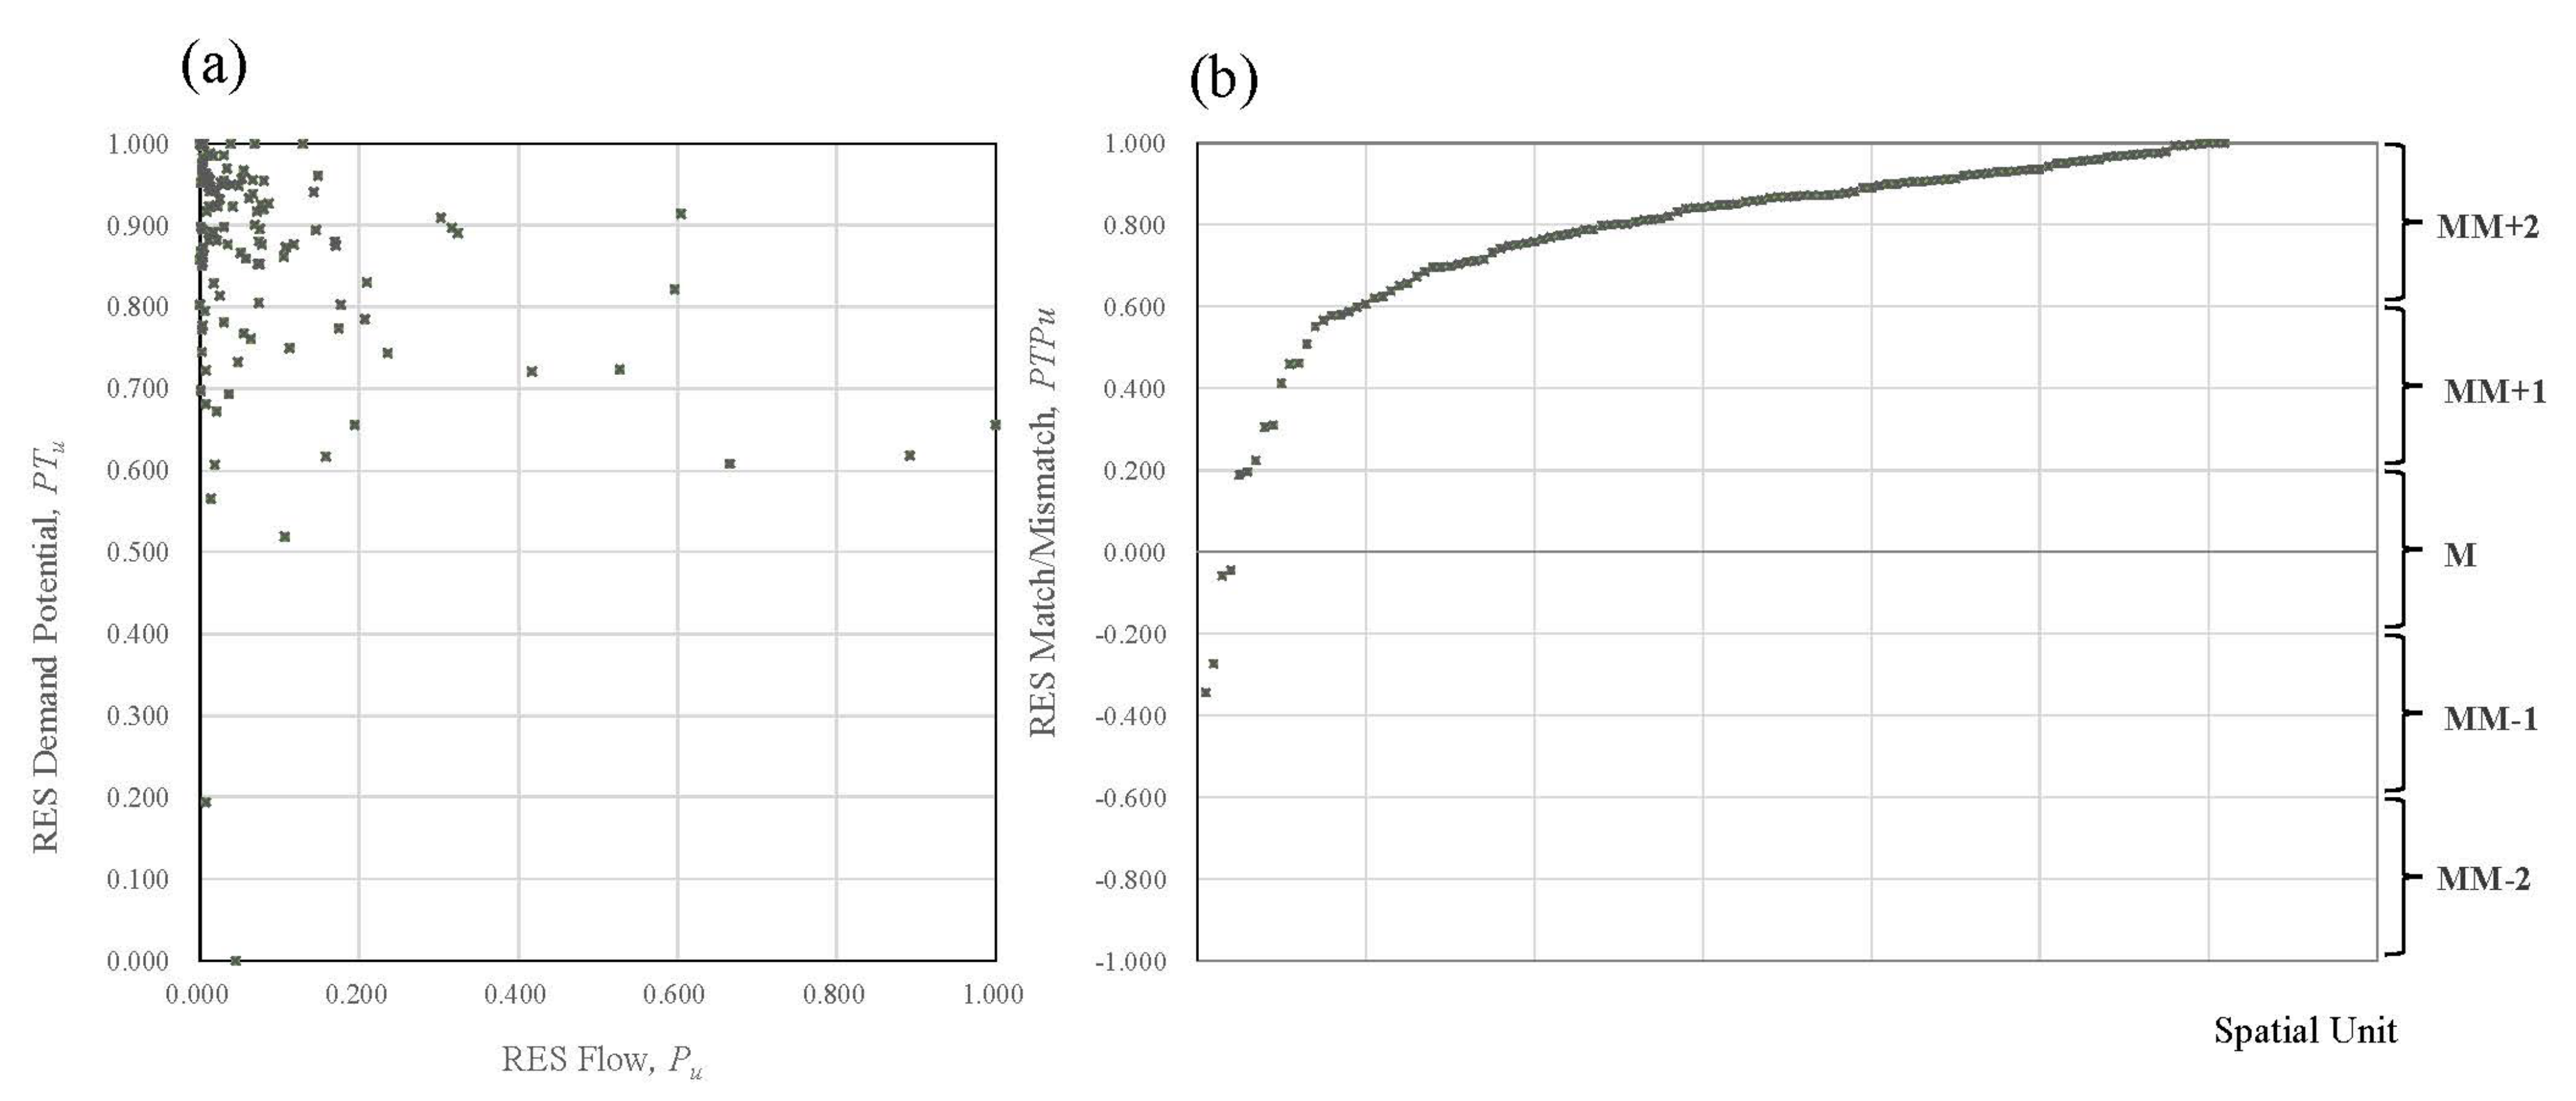
Figure 6a shows that only a few of the 122 spatial units achieved a balance between RES Demand Potential and RES Flow (close to the iso-diagonal line). The vast majority of the spatial units were in a state where the RES Demand Potential was higher than the RES Flow. The matching relationships were classified by an interval of ±0.2. As shown in Figure 6b, most spatial units were in the RES Match/Mismatch relationship of MM+1 and MM+2. There was no spatial unit belonging to MM-2.

3.3.2. Spatial Distributions of RES Match/Mismatch

The spatial distribution of RES Match/Mismatch is shown in Figure 7a. In YNP, MM+2, MM+1, M, and MM−1 accounted for 70.87%, 16.50%, 5.51%, and 7.12%, respectively. The RES match areas were mainly located in the south-central part (Yangming Park, Visitor Center, Qising Park, Mt. Qising, and Macao; Figure S2). Areas over-visited were mainly located in the southwest part (Yangmingshuwu, Mt. Zhongzheng, Longfinggu and Louhuanggu, and Mt. Shamao; Figure S2).
As shown in Figure 7b, the RES match areas (M) were mainly located in Zone SA. The over-visited areas (MM−1) were mainly located in Zones SA and EUA. As shown in Table S3, the highest proportion of the overlaying relationship between RES Match/Mismatch and land use zones was MM+2/SA (28.51%), followed by MM+2/EUA (23.24%), MM+2/EPA (18.65%), and MM+1/SA (11.67%). In addition, most land use zones belonged to MM+2, except Zone RA.

3.4. Spatial Relationship between RES Match/Mismatch and RES Supply-Side

As shown in Figure 8a, most areas with high RES Supply Potential were located in MM+2 and MM+1. The RES match areas (M) were all located in the area where the RES Supply Potential was higher than 0.6. A few areas with RES Supply Potential below 0.4 were found in MM+2 and MM+1 (Table S4).
Figure 8b shows that MM+2 and MM+1 were the areas with low Recreation Accessibility. For area M where RES Demand and RES Flow matched, the Recreation Accessibility was mostly moderate and high. However, the Recreation Accessibility was high for the areas where the RES Demand was lower than RES Flow (MM−1) (Table S5).

4. Discussion

4.1. Detecting from the Perspectives of Resource, Management, and Beneficiary

This study further considered the nature of RES supply-side and demand-side in assessing and detecting the spatial matching relationship from the resource, management, and beneficiary perspectives. Similar to the previous studies [7,15,16,17,18,19], this study used the indicator assessment method to assess RES Supply Potential and Recreation Accessibility from the resource and management perspectives. Since the indicators were demonstrated by the literature as proxies for people’s preferences for recreation, they could rationally reflect the RES provisioning potential of the natural capital. However, different from the previous studies [7,15,16,18], recreation accessibility was treated as one of the RES supply terms and assessed independently from RES demand, because managers could manipulate facilities to adjust the access level.
Regarding the RES demand-side, this study conducted web-based questionnaires to collect data to assess the RES Demand Potential and RES Flow from the beneficiary perspective. Compared to the previous studies [7,15,17,18,19], assessing the RES Match/Mismatch directly from the beneficiary perspective would greatly decrease the bias caused by assessment using population density and accessibility. Although the data collection might be costly, precise information is essential for specific policy and decision-making.
Resembled the RES mapping method proposed by Kulczyk et al. [9], this study assessed RES Supply Potential, Recreation Accessibility, RES Demand Potential, and RES Flow separately; detecting RES Match/Mismatch directly from the beneficiary perspective. Unlike their study, recreational activities in YNP are low recreational infrastructure-dependent; therefore, accessibility would be the factor that encourages recreational activity participation. However, narrowing down to the recreational usage areas (Zone SA), it might be necessary to integrate recreational infrastructure into the assessment to provide more detailed operational and meaningful information to support policy and decision-making.

4.2. Application in Policy and Decision-Making

Using the assessment methods proposed, the spatial distributions of RES Supply Potential and Recreation Accessibility of the YNP would provide spatial visualized information for managers in recreation resource inventories. The overlay analysis procedure could further help managers indicate the strengths or weaknesses of the areas toward RES issues to derive operation and management guides (Figure 2).
Among the RES Match/Mismatch levels of YNP, MM−1 (RES Demand Potential< RES Flow) accounted for 7.12% of the total area, which was the area managers should first launch actions to avoid or minimize over-visited impacts. The RES Supply Potential of this area was high (Table S4); although the public recreation preference was low, people still visited due to its high accessibility (Table S5). Because of the restrictions by non-entry regulation and low Recreation Accessibility, the beneficiaries would move to other areas of YNP with lower RES Demand potential. These situations seemed to be common in other protected areas as well. Restricted by land use zoning control and the facility’s provision level, people engaged in recreational activities in YNP with noticeable spatial distribution variances (Figure 4b). As a protected area, conservation and preservation are given top priority and have the most rigorous land use control; for example, the access is prohibited in Zone EPA. To secure biodiversity, rigorous land use control is necessary. Recreation Accessibility can be improved through infrastructure upgrades, thereby increasing the visiting rate [34]; however, other management actions should be applied first, for example, modifying visitors’ behavior, the usage location, and managing use levels [14]. Therefore, the short-term actions for YNP could guide the public to engage in recreational activities in other areas to relieve the recreational pressure of this area and conduct facilitative visitor management. The long-term actions might need continuously monitor the visitors’ behaviors and satisfaction to explore the difference between the realized RES and satisfied RES demands for adjusting their management policy and actions.
A protected area is under rigorous land use control, and the highly protected areas usually preserve great natural capital with higher recreation attractions for people. As a protected area, most areas of YNP were with high RES Supply Potential; and were mainly located in MM+2 (70.87%) and MM+1 (16.50%), where the areas’ RES Demand Potential much greater or greater than RES Flow and the Recreation Accessibility were low. However, due to RES Supply Potential being related to the environment characteristics and affected the extent of availability [37], natural capital management will affect its RES Supply Potential. In addition to providing RES, natural capital provides multiple ESs (e.g., habitat creation and maintenance, water purification and water treatment, air quality regulation). The RES Supply Potential of YNP was overall high (Figure 3a). At the same time, the public showed much higher recreation expectations for YNP (Figure 4a). Whether the RES Supply Potential should be converted to realized service completely (actual visits), multiple ESs of the natural capital needed to be considered comprehensively.

4.3. Limitations and Future Research Challenges

This study adopted an indicator assessment method to assess RES Supply Potential and Recreation Accessibility. However, the indicator assessment method depends on the availability of the dataset [17], and the calculation method may vary accordingly. As previous studies [16,28], this study considered the four indicators equally important in providing RES and used the same weights to accumulate the indicators to estimate the RES Supply Potential. However, it is worth investigating whether each indicator has a different weight. Whether these indicators could appropriately quantify the RES Supply Potential of natural capital may need more studies to validate in the future.
This study collected the required data through web-based questionnaires from the beneficiaries’ perspective. A web-based survey is commonly used for data collection for a geographically diverse population, but this method might encounter sampling bias. This study distributed the questionnaire to various social networking platforms and public or private associations to improve the survey’s visibility for the Taipei Metropolitan Area’s dwells and reduce sampling bias. Nevertheless, most of the respondents were young people (20–39 years old) who are more familiar with the use of the internet and are more frequent users than older people, which was a limitation in this research.
Since YNP is not a daily recreation destination, instead of asking visit frequency, this study asked the actual visits in the past two years to increase the data’s representativeness; however, other periods could be tested. In addition, this study collected the beneficiaries’ participation tendency and participation in recreation in a given setting without considering the influence of the substitution and complementarity of other attractions. Whether considering the co-opetition relationship between other attractions depends on management goals, and more research is needed if necessary. In addition, access is prohibited in the Zone EPA, and whether to exclude non-entry areas when calculating RES Flow may depend on management requirements and needs more research.

5. Conclusions

This study considered the nature of RES supply-side and demand-side in assessing and detecting the spatial matching relationship from the resource, management, and beneficiary perspectives to provide operational and meaningful information to support policy and decision-making for protected areas. The proposed method consisted of assessment and overlay analysis parts, which could not only detect RES Match/Mismatch rationally and directly but also obtain multiple spatial datasets to support decision-making. Therefore, the proposed method could be applied to other protected areas. In response to different decision-making considerations, more research on quantification and matching detection methods is needed in the future.

Supplementary Materials

The following supporting information can be downloaded at: https://www.mdpi.com/article/10.3390/f13111849/s1, Table S1. RES indicators. Table S2. Percentage of the overlaying relationship between RES Supply Potential and land use zones (unit: %). Table S3. Percentage of the overlaying relationship between Recreation Accessibility and land use zones (unit: %). Table S4. Percentage of the overlaying relationship between RES Match/Mismatch and land use zones (unit: %). Table S5. Percentage of the overlaying relationship between RES Match/Mismatch and RES Supply Potential (unit: %). Table S6. Percentage of the overlaying relationship between the RES Match/Mismatch and Recreation Accessibility (unit: %). Figure S1. Location, land cover, and land use zones of Yangmingshan National Park. Figure S2. Mountain peaks and recreation spots of YNP. Figure S3. Spatial units for the assessment of RES supply-side and demand-side. Figure S4. Sociodemographic information of the respondents. Figure S5. Spatial distributions of (a) Naturalness; (b) Presence of water; (c) Relief and presence of summit; and (d) Landscape diversity of YNP. Figure S6. Spatial distributions of (a) Road density and (b) Distance from the residence.

Author Contributions

Conceptualization, B.-S.L.; methodology, B.-S.L. and H.-C.C.; investigation and data curation, H.-C.C.; writing—original draft preparation, B.-S.L. and H.-C.C.; writing—review and editing, B.-S.L. Both authors have read and agreed to the published version of the manuscript.

Funding

This research was funded by National Science and Technology Council Taiwan ROC grant numbers [MOST 111-2410-H-002-162] and [MOST 105-2410-H-002-196] and Yangmingshan National Park Administration grant number [E0030].

Conflicts of Interest

The authors declare no conflict of interest.

References

  1. Millennium Ecosystem Assessment Ecosystems and Human Well-Being: Synthesis; Island Press: Washington, DC, USA, 2005.
  2. Haines-Young, R.; Potschin, M. Common International Classification of Ecosystem Services (CICES) V5.1 and Guidance on the Application of the Revised Structure. Available online: https://cices.eu/resources/ (accessed on 20 December 2021).
  3. Haines-Young, R.; Potschin, M. The links between biodiversity 4493, ecosystem services and human well-being. In Ecosystem Ecology: A New Systhsis; Raffaelli, D., Frid, C., Eds.; Cambridge University Press: Cambridge, UK, 2010. [Google Scholar]
  4. Potschin-Young, M.; Haines-Young, R.; Görg, C.; Heink, U.; Jax, K.; Schleyer, C. Understanding the role of conceptual frameworks: Reading the ecosystem service cascade. Ecosyst. Serv. 2018, 29, 428–440. [Google Scholar] [CrossRef] [PubMed]
  5. Chang, H.C.; Lin, B.S. Ecosystem services of Yangmingshan National Park and their supply structures. J. Outdoor Recreat. Tour. 2020, 33, 1–33. [Google Scholar] [CrossRef]
  6. Doak, D.F.; Bakker, V.J.; Goldstein, B.E.; Hale, B. What is the future of conservation? Trends Ecol. Evol. 2015, 29, 77–81. [Google Scholar] [CrossRef] [PubMed]
  7. Schirpke, U.; Vigl, L.E.; Tasser, E.; Tappeiner, U. Analyzing Spatial Congruencies and Mismatches between Supply, Demand and Flow of Ecosystem Services and Sustainable Development. Sustainability 2019, 11, 2227. [Google Scholar] [CrossRef] [Green Version]
  8. Schulp, C.J.E.; Lautenbach, S.; Verburg, P.H. Quantifying and mapping ecosystem services: Demand and supply of pollination in the European Union. Ecol. Indic. 2014, 36, 131–141. [Google Scholar] [CrossRef]
  9. Kulczyk, S.; Woźniak, E.; Derek, M. Landscape, facilities and visitors: An integrated model of recreational ecosystem services. Ecosyst. Serv. 2018, 31, 491–501. [Google Scholar] [CrossRef]
  10. González-García, A.; Palomo, I.; González, J.A.; García-Díez, V.; García-Llorente, M.; Montes, C. Biodiversity and ecosystem services mapping: Can it reconcile urban and protected area planning? Sci. Total Environ. 2022, 803, 150048. [Google Scholar] [CrossRef]
  11. Small, N.; Munday, M.; Durance, I. The challenge of valuing ecosystem services that have no material benefits. Glob. Environ. Chang. 2017, 44, 57–67. [Google Scholar] [CrossRef]
  12. Hermes, J.; Berkel, D.V.; Burkhard, B.; Plieninger, T.; Fagerholm, N.; von Haaren, C.; Albert, C. Assessment and valuation of recreational ecosystem services of landscapes. Ecosyst. Serv. 2018, 31, 289–295. [Google Scholar] [CrossRef]
  13. Daniel, T.C.; Muhar, A.; Arnberger, A.; Aznar, O.; Boyd, J.W.; Chan, K.M.A.; Costanza, R.; Elmqvist, T.; Flint, C.G.; Gobster, P.H.; et al. Contributions of cultural services to the ecosystem services agenda. Proc. Natl. Acad. Sci. USA 2012, 109, 8812–8819. [Google Scholar] [CrossRef]
  14. Marion, J.L. A Review and Synthesis of Recreation Ecology Research Supporting Carrying Capacity and Visitor Use Management Decision making. J. For. 2016, 114, 339–351. [Google Scholar] [CrossRef]
  15. Zulian, G.; Paracchini, M.L.; Maes, J.; Liquate, C. ESTIMAP: Ecosystem Services Mapping at European Scale; Publications Office of the European Union: Luxembourg, 2013. [Google Scholar] [CrossRef]
  16. Peña, L.; Casado-Arzuaga, I.; Onaindia, M. Mapping recreation supply and demand using an ecological and social evaluation approach. Ecosyst. Serv. 2015, 13, 108–118. [Google Scholar] [CrossRef]
  17. Baró, F.; Palomo, I.; Zulian, G.; Vizcaino, P.; Haase, D.; Gómez-Baggethun, E. Mapping ecosystem service capacity, flow and demand for landscape and urban planning: A case study in the Barcelona metropolitan region. Land Use Policy 2016, 57, 405–417. [Google Scholar] [CrossRef] [Green Version]
  18. Lorilla, R.S.; Kalogirou, S.; Poirazidis, K.; Kefalas, G. Identifying spatial mismatches between the supply and demand of ecosystem services to achieve a sustainable management regime in the Ionian Islands (Western Greece). Land Use Policy 2019, 88, 104171. [Google Scholar] [CrossRef]
  19. González-García, A.; Palomo, I.; González, J.A.; López, C.A.; Montes, C. Quantifying spatial supply-demand mismatches in ecosystem services provides insights for land-use planning. Land Use Policy 2020, 94, 104493. [Google Scholar] [CrossRef]
  20. Driver, B.L.; Brown, P.J. The opportunity spectrum concept and behavioral information in outdoor recreation resource supply inventories: A rationale. In Integrated Inventories of Renewable Natural Resources: Proceedings of the Workshop; USDA Forest Service General Technical Report RM-1978, 55; Rocky Mountain Forest and Range Experiment Station: Fort Collins, CO, USA, 1978. [Google Scholar]
  21. Lin, Y.J. Research on regional outdoor recreation resource planning methods: Discussion on the development strategy of recreation resources in Taiwan. City Plan. 1984, 11, 1–18. [Google Scholar]
  22. Pigram, J.J.; Jenkins, J.M. Outdoor Recreation Management, 2nd ed.; Routledge: London, UK, 2006. [Google Scholar]
  23. Smith, J.W.; Moore, R.L. Social-psychological factors influencing recreation demand: Evidence from two recreational rivers. Environ. Behav. 2012, 45, 821–850. [Google Scholar] [CrossRef]
  24. Fisher, B.; Turner, R.K.; Morling, P. Defining and classifying ecosystem services for decision making. Ecol. Econ. 2009, 68, 643–653. [Google Scholar] [CrossRef] [Green Version]
  25. Tourism Bureau of Taiwan Monthly Statistics of the Number of Tourists in the Main Tourist Destinations in Taiwan in 2018. Available online: https://admin.taiwan.net.tw/FileUploadCategoryListC003330.aspx?CategoryID=2638da16-f46c-429c-81f9-3687523da8eb&appname=FileUploadCategoryListC003330 (accessed on 25 February 2019).
  26. Stępniewska, M. Ecosystem Service Mapping and Assessment as a Support for Policy and Decision Making. Clean 2016, 44, 1414–1422. [Google Scholar] [CrossRef]
  27. Chen, J.H.; Lee, L.L.; Su, M.H.; Wu, S.P.; Lay, J.G.; Lee, C.T. The Interactions of Human Activities and Natural Resources around the Area Located at the North of Bailaka Highway and the West of Yangjin Highway in Yangmingshan National Park; Society for Wildlife and Nature: Taipei, Taiwan, 2011. [Google Scholar]
  28. Paracchini, M.L.; Zulian, G.; Kopperoinen, L.; Maes, J.; Schägner, J.P.; Termansen, M.; Zandersen, M.; Perez-Soba, M.; Scholefield, P.; Bidoglio, G. Mapping cultural ecosystem services: A framework to assess the potential for outdoor recreation across the EU. Ecol. Indic. 2014, 45, 371–385. [Google Scholar] [CrossRef]
  29. Ode, Å.; Fry, G.; Tveit, M.S.; Messager, P.; Miller, D. Indicators of perceived naturalness as drivers of landscape preference. J. Environ. Manag. 2009, 90, 375–383. [Google Scholar] [CrossRef] [PubMed]
  30. Kienast, F.; Degenhardt, B.; Weilenmann, B.; Wäger, Y.; Buchecker, M. A GIS-assisted mapping of landscape suitability for nearby recreation. Landsc. Urban Plan. 2012, 105, 385–399. [Google Scholar] [CrossRef]
  31. de Groot, R.S.; Alkemade, R.; Braat, L.; Hein, L.; Willemen, L. Challenges in integrating the concept of ecosystem services and values in landscape planning, management and decision making. Ecol. Complex. 2010, 7, 260–272. [Google Scholar] [CrossRef]
  32. Norton, L.R.; Inwood, H.; Crowe, A.; Baker, A. Trialling a method to quantify the ‘cultural services’ of the English landscape using Countryside Survey data. Land Use Policy 2012, 29, 449–455. [Google Scholar] [CrossRef] [Green Version]
  33. Rodrigue, J.; Comtois, C.; Slack, B. The Geography of Transport Systems, 2nd ed.; Routledge: London, UK, 2006. [Google Scholar]
  34. Ala-Hulkko, T.; Kotavaara, O.; Alahuhta, J.; Helle, P.; Hjort, J. Introducing accessibility analysis in mapping cultural ecosystem services. Ecol. Indic. 2016, 66, 416–427. [Google Scholar] [CrossRef]
  35. Maes, J.; Paracchini, M.L.; Zulian, G.; Dunbar, M.B.; Alkemade, R. Synergies and trade-offs between ecosystem service supply 4171, biodiversity, and habitat conservation status in Europe. Biol. Conserv. 2012, 155, 1–12. [Google Scholar] [CrossRef]
  36. Schipperijn, J.; Ekholm, O.; Stigsdotter, U.K.; Toftager, M.; Bentsen, P.; Kamper-Jørgensen, F.; Randrup, T.B. Factors influencing the use of green space: Results from a Danish national representative survey. Landsc. Urban Plan. 2010, 95, 130–137. [Google Scholar] [CrossRef]
  37. Weyland, F.; Laterra, P. Recreation potential assessment at large spatial scales: A method based in the ecosystem services approach and landscape metrics. Ecol. Indic. 2014, 39, 34–43. [Google Scholar] [CrossRef]
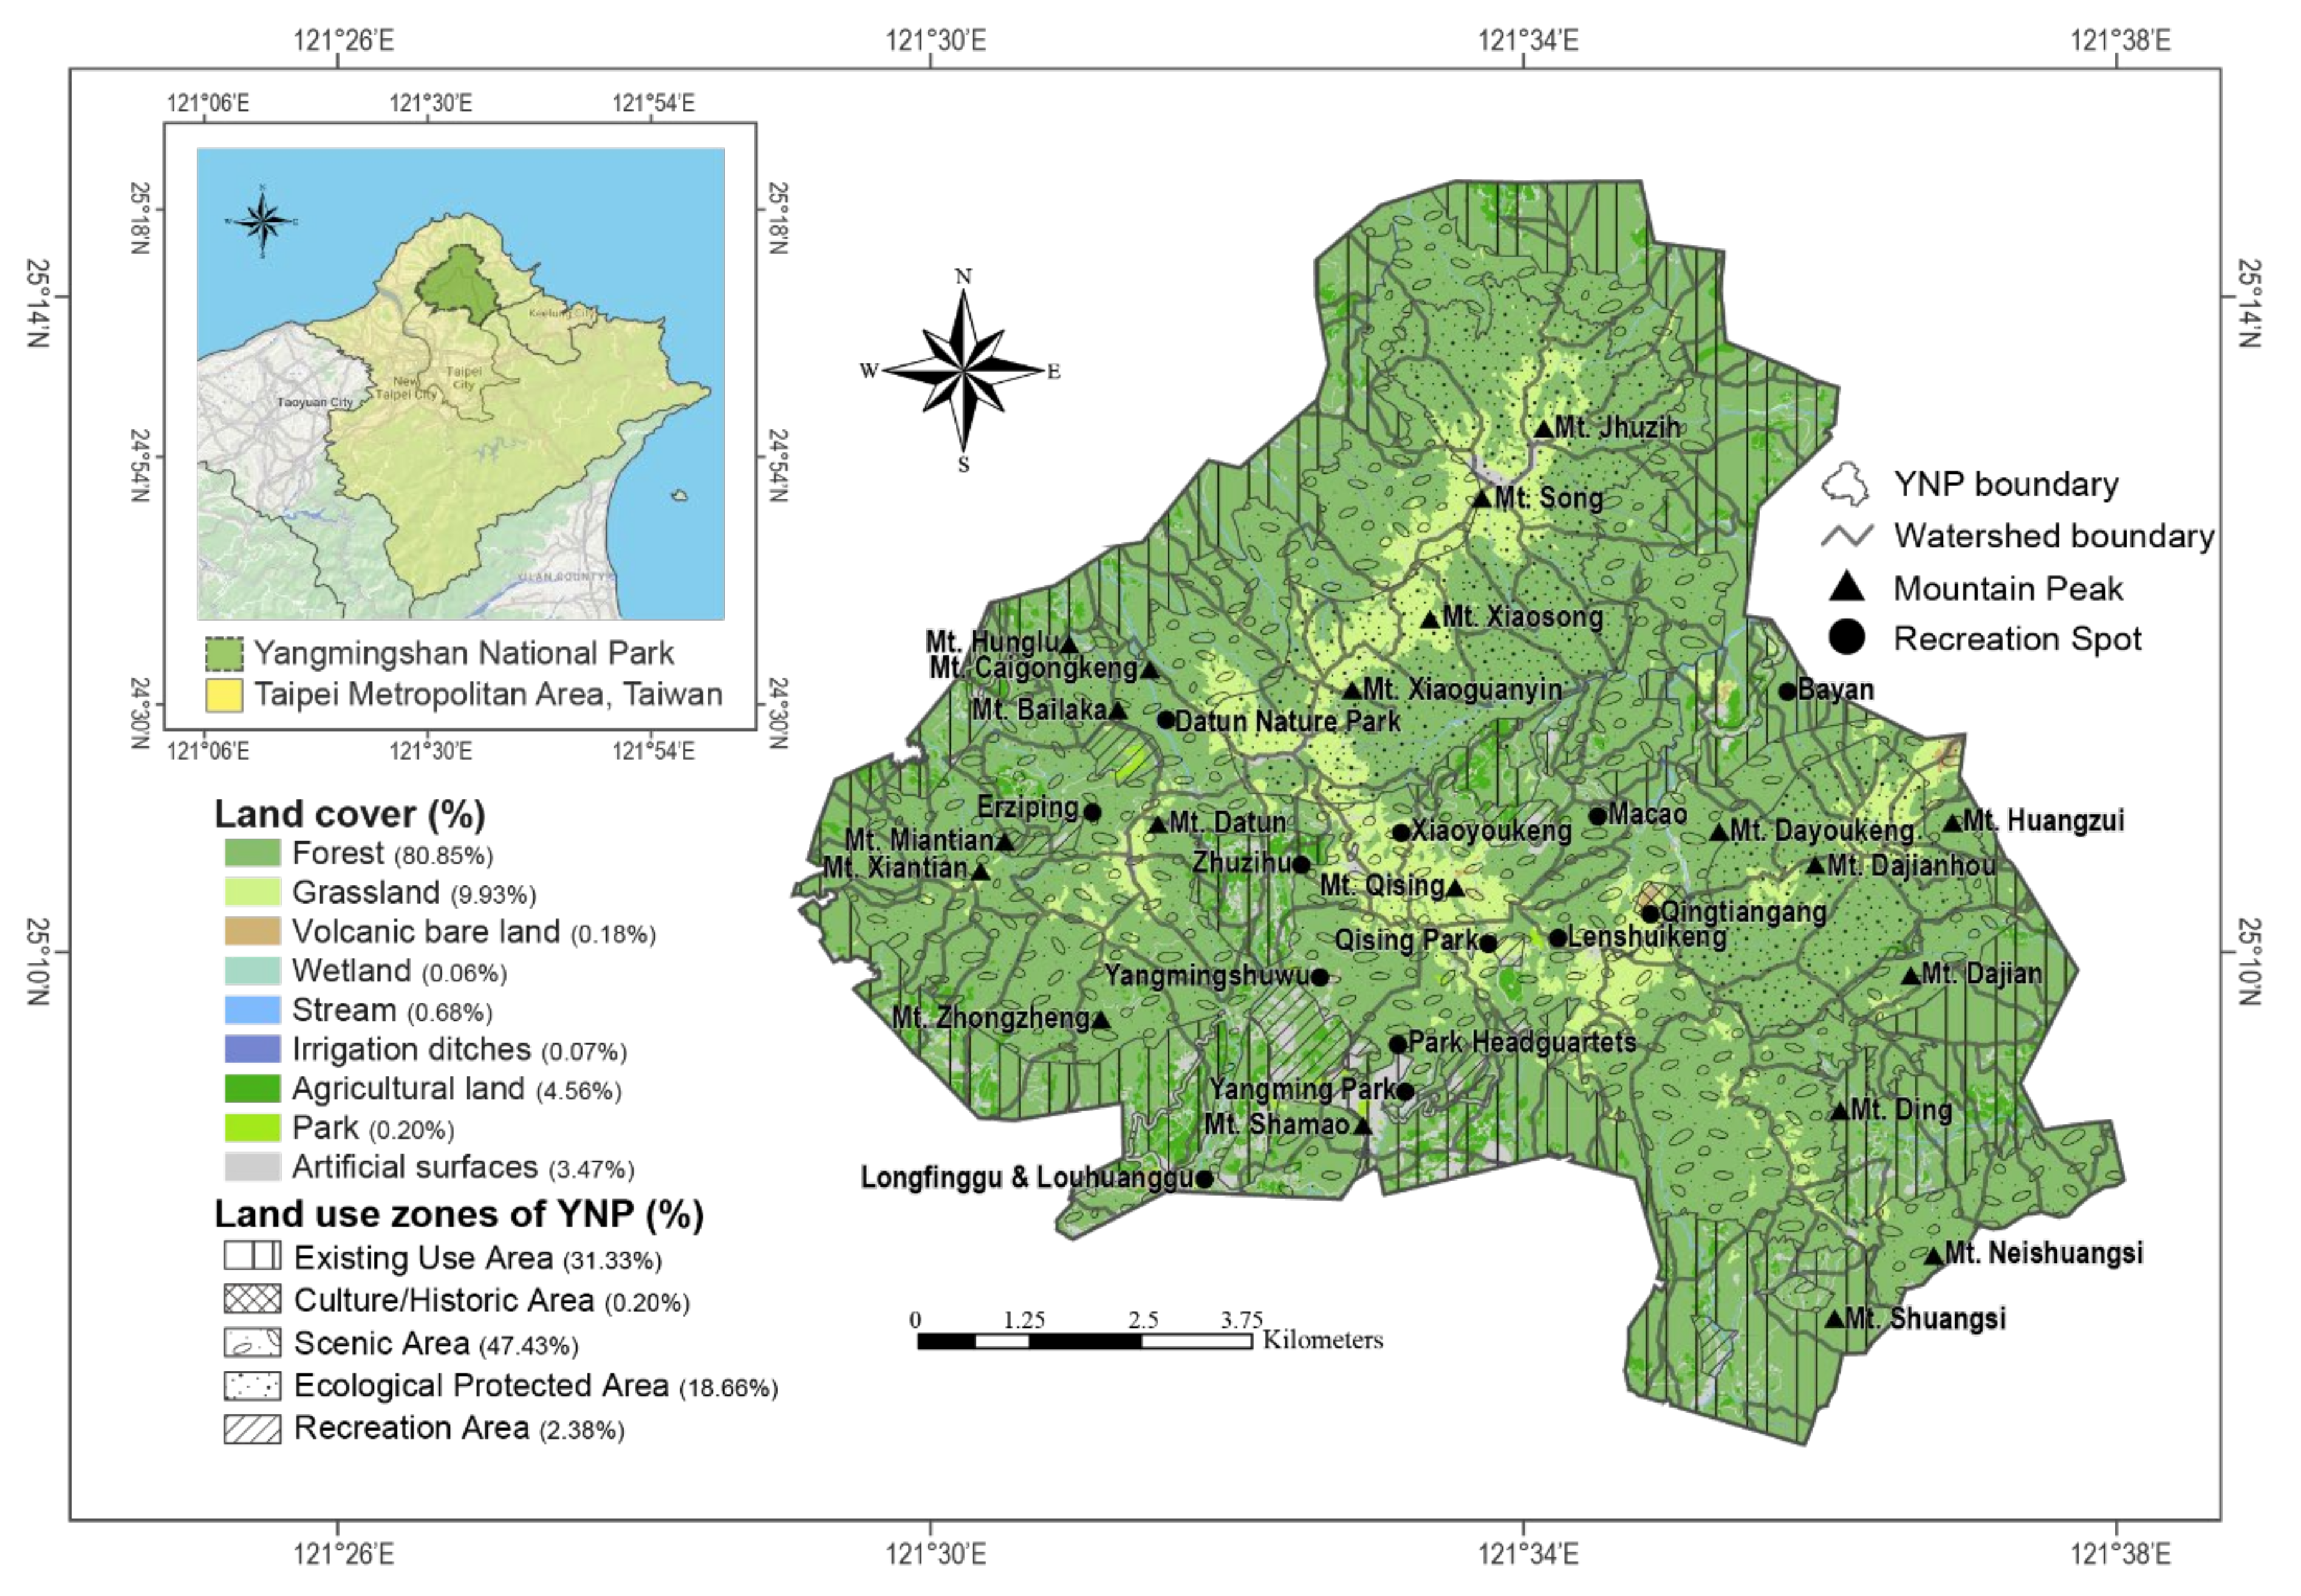
Figure 1. Location, land cover, land use zones, mountain peaks, and recreation spots of YNP.
Forests 13 01849 g001
Figure 2. The method and procedure for assessing and detecting the spatial matching relationship of supply-side and demand-side of RES from the resource, management, and beneficiary perspectives serve as policy and decision-making support.
Forests 13 01849 g002
Figure 3. Framework for detecting RES Match/Mismatch from the beneficiary perspective.
Forests 13 01849 g003
Figure 4. Spatial distributions of (a) RES Supply Potential and (b) Recreation Accessibility, (c) RES Supply Potential overlaying with land use zones, (d) Recreation Accessibility overlaying with land use zones.
Forests 13 01849 g004
Figure 5. Spatial distributions of (a) RES Demand Potential and (b) RES Flow.
Forests 13 01849 g005
Figure 6. Scatterplots of the 122 spatial units of YNP on (a) the relationship between RES Demand Potential and RES Flow and (b) the RES Match/Mismatch.
Forests 13 01849 g006
Figure 7. Spatial distributions of (a) RES Match/Mismatch and (b) RES Match/Mismatch overlaying with land use zones.
Forests 13 01849 g007
Figure 8. Spatial distributions of (a) RES Match/Mismatch overlaying with RES Supply Potential, and (b) RES Match/Mismatch overlaying with Recreation Accessibility.
Forests 13 01849 g008
Table 1. Results of t-test for recreation participation tendency toward forests and the number of visits to forests.
VersionnMeanSDtp
Recreation participation tendency toward forestsA3177.91.96−0.9390.348
B3178.11.84
Number of visits to forestsA3172.01.360.4260.671
B3172.01.37
Table 2. Respondents’ recreation participation tendencies toward different land cover types and actual visits to different land covers in the past two years.
Land Cover TypeRecreation Participation Tendency (PTCi)Actual Visits
(Mean ± SD)Number of VisitsPercentage of Actual Visits (PLCi, %)
Forests8.0 ± 1.9040215.1
Grasslands7.6 ± 1.8439014.7
Volcanic bare lands7.1 ± 2.042539.5
Wetlands6.7 ± 1.8130511.5
Streams7.2 ± 2.032248.4
Irrigation ditches5.1 ± 2.482549.6
Agricultural lands6.6 ± 2.202439.2
Parks6.7 ± 1.7334112.8
Artificial surfaces5.3 ± 2.472459.2
Total 2657100
Publisher’s Note: MDPI stays neutral with regard to jurisdictional claims in published maps and institutional affiliations.