Abstract
The Miombo woodland is the most extensive tropical woodland in south-central Africa. However, field sample plot data on forest cover changes, species distribution and carbon stocks in the Miombo ecoregion are inadequate for effective forest management. Owing to logistical challenges that come with field-based inventory methods, remote sensing plays an important role in supplementing field methods to fill in data gaps. Traditional satellite and manned aircraft remote sensing platforms have their own advantages and limitations. The advent of unmanned aerial systems (UASs) has made it possible to acquire forest data at unprecedented spatial and temporal scales. UASs are adaptable to various forest applications in terms of providing flexibility in data acquisition with different sensors (RGB, multispectral, hyperspectral, thermal and light detection and ranging (lidar)) at a convenient time. To highlight possible applications in the Miombo woodlands, we first provide an overview of the Miombo woodlands and recent progress in remote sensing with small UASs. An overview of some potential forest applications was undertaken to identify key prospects and challenges for UAS applications in the Miombo region, which will provide expertise and guidance upon which future applications in the Miombo woodlands should be based. While much of the potential of using UASs for forest data acquisition in the Miombo woodlands remains to be realized, it is likely that the next few years will see such systems being used to provide data for an ever-increasing range of forest applications.
1. Introduction
The Miombo woodland covers 2.7 million km2 in Africa, mainly Angola, the southern parts of the Democratic Republic of Congo, Malawi, Mozambique, Tanzania, Zambia and Zimbabwe [1]. The Miombo woodlands are characterized by the dominance of three key deciduous genera belonging to the family Fabaceae, subfamily Caesalpinioideae, in the genera Brachystegia, Julbernadia and Isoberlinia [2]. They occur in areas with generally poor soil nutrients and characterized by distinct wet and dry seasons, with annual mean rainfall ranging from 650 mm to 1500 mm [2,3]. Ref. [4] The Miombo woodlands are divided into dry and wet woodland types in line with rainfall in the zone of occurrence [4] as well as species composition and structure (see Table 1).

Table 1.
Categorization of the Miombo Woodlands.
The Miombo woodland is home to natural-resource-dependent communities and offers a multiplicity of ecoservices ranging from food (fruits, honey, edible insects and bush meat), construction materials (poles, timber and fiber), fuel (charcoal and firewood) and medicine- and water-provisioning services [5,6,7,8]. However, rapid population growth coupled with increases in electricity tariffs and the prices of petroleum products has led to increased demand for land for settlement and agriculture expansion as well as overexploitation of timber and fuel wood products [5,9]. Consequently, there is a rapid upsurge in deforestation and degradation of the woodlands across the ecoregion [10,11].
However, current estimates of forest cover changes, species distribution and carbon stocks in the Miombo ecoregion are inadequate for effective forest management, and international reporting requirements, such as the Reducing Emissions from Deforestation and Forest Degradation plus (REDD+), are necessary for forest conservation [3,10,12,13].
Many studies have been conducted on UAS applications in forestry in a number of continents with the goal of sharing knowledge on their utility, e.g., Refs. [14,15,16,17,18]. Nevertheless, a review focusing on UAS forestry applications in Miombo woodlands is still not available. A web-based search for articles on the keywords “Unmanned Aerial Systems”, “Unmanned Aerial Vehicles”, “Unoccupied Aerial vehicles”, “Remotely Piloted Aircraft Systems” and “Drones” and their acronyms “UAS”, “UAV” and “RPAS”, in combination with commonly used synonyms in forestry, including “forest”, “forestry” and “forests”, from 1st January 2010 to 31st December 2020 in the Web of Science Database (WoS) based on author affiliations revealed that Africa had the smallest number of publications of all the continents (Figure 1). Thirty-two articles were published with participation of African-affiliated authors, and only nine of those articles were purely UAS-forestry-application-related articles from sub-Saharan Africa. Furthermore, all these articles were published between the years 2016 and 2021. Table 2 shows that these studies were focused on biomass estimation and other forest structural attributes. Only three of these studies included other forest applications, namely: (i) height estimates of woody vegetation for monitoring disturbance from fire and grazing [19], (ii) use of multispectral UAS imagery to estimate pre-fire AGB for the purpose of quantifying the fuel load [20] and (iii) extracted tree crown morphology for predicting tree species [21]. With the continuous improvement of UAS platforms, sensors and processing technologies, the number of applications in sub-Saharan Africa are expected to increase, making it necessary to undertake a review of UAS applications in forestry to understand the associated opportunities and challenges in forest monitoring and management. Therefore, this paper is designed to summarize UAS applications in forestry and their implications for management of Miombo woodland attributes.
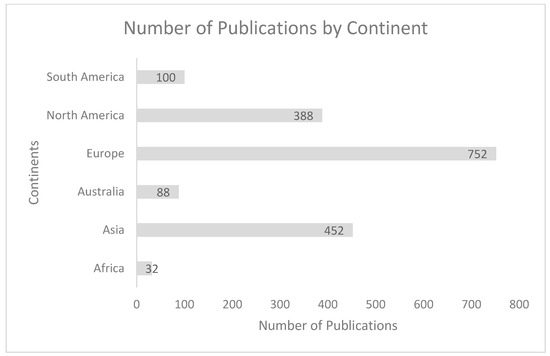
Figure 1.
Showing number of forest-related UAS publications by continent.
2. UAS Platforms, Sensors and Data Processing
2.1. Classification of UASs
There are many classifications of UASs, which are based on different characteristics such as size, weight, endurance and range capabilities (Table 3: Anderson and Gaston, Ref. [14]). The majority of UASs used in forest applications are in the small and micro classes because of their relatively low cost and ease of operation compared to other classes [15]. This trend in the application of UASs is expected to continue in the Miombo woodlands, e.g., Refs. [22,23], and therefore, this study will be focused on these two classes. Typically, UASs are classified based on the take-off and landing technique: (i) horizontal take-off and landing characteristic of fixed-wing (FW) aircraft (i.e., airplanes) and (ii) vertical take-off and landing characteristic of rotary-wing (RW) aircraft (i.e., helicopters, multi-rotor quadcopters, hexacopters, etc.). RW aircraft have the capability for vertical take-off and landing, making them suitable for deployment and launching in areas with limited space such as built-up areas and forests. Compared to FW aircraft, RW aircraft are cheaper, more compact and portable, easier to use for both autopilots and humans, and are more stable, leading to superior image quality [15,24]. The major limitation of RW aircraft is that they have complex mechanical systems with many rotor blades and so consume a lot of power, leading to low speed and less endurance and less thus flight time and area coverage per flight compared to FW aircraft.
FW aircraft have high speed, a large payload capacity and longer endurance and are able to cover longer distances within one flight, which makes them more suitable for mapping large areas compared to RW aircraft. The disadvantage of FW aircraft is their inability to engage in vertical take-off and landing, which makes them less suitable for applications in dense forest environments with limited space, and they are relatively more expensive than RW vehicles [24]. In addition, FW aircraft have lower stability, especially in windy conditions, which can impact image quality [15]. In terms of potential for application in the Miombo woodlands, which are characterized by generally open canopies, both FW and RW aircraft have high potential for application, but the RW vehicle is likely to dominate in line with global trends as revealed in a study by [17], who carried out a global review of the application of UASs in forestry from 2010 to 2019 and found that RW vehicles were more popular than FW platforms. A similar study by [18] corroborated these findings. The RW vehicle’s ease of use, affordability and compactness gives it an edge over its FW counterpart, albeit the FW vehicle has the advantage of high endurance. Furthermore, most UAS study sites are small, and regulations in the Miombo ecoregion countries require that the line of sight of the pilot is maintained, a requirement with which RW aircraft are compatible.
Table 2.
Summary of studies that applied UASs in forestry in sub-Saharan Africa.
Table 2.
Summary of studies that applied UASs in forestry in sub-Saharan Africa.
| UAS/Type | Sensor | Aim | Location | Product | Performance | Reference | Year |
|---|---|---|---|---|---|---|---|
| SenseFly eBee (FW) | RGB | Biomass estimation and impact of DTMs generated from different methods on AGB estimates | Malawi | AGB | r2 = 0.58 − 0.67 | [22] | 2016 |
| SenseFly eBee (FW) | RGB | Assess influence of plot size on AGB estimation | Malawi | AGB | r2 = 0.31 − 0.64 | [25] | 2017 |
| Soleon Coanda x12 (RW) | RGB | Monitor disturbance of fire and grazing on woody vegetation | Namibia | Mean tree height metrics | r2 = 0.7 | [19] | 2017 |
| SenseFly eBee (FW) | RGB, NIR | Assess UASs’ influence with regard to image resolution, sensor type and image overlap on AGB estimation accuracy | Malawi | AGB | r2 = 0.55 − 0.76 | [23] | 2019 |
| Unspecified DJI (RW) | RGB, and MS | Monitoring structural characteristics of vegetation | Botswana | Mean tree heights, crown area | N/A | [26] | 2020 |
| Phantom 4 DJI (MR) | RGB | Derive tree heights and assess sensitivity of derived heights on AGB estimation | Ethiopia | AGB | r2 = 0.99 | [27] | 2021 |
| Spark DJI (RW) | RGB | Assess woody and herbaceous phytomass | Senegal | AGB | r2 = 0.59 and 0.71 | [28] | 2021 |
| Spark DJI (RW) | RGB | Estimate tree height and crown area | Senegal | Mean tree heights, crown area | r2 = 0.84 and 0.93 | [21] | 2021 |
| Matrice 100 DJI (RW) | MS | Monitor pre-fire AGB | Botswana and Mozambique | AGB | r2 = 0.91 and 0.77 | [20] | 2021 |
RW = rotary wing, FW = fixed wing, RGB = red, green, blue, MS = multispectral, AGB = aboveground biomass.
Table 3.
Classes of UAS platforms.
Table 3.
Classes of UAS platforms.
| Size | Large | Medium | Small | Micro |
|---|---|---|---|---|
| Operating range | Up to 500 km | Up to 500 km | <10 km | <10 km |
| Endurance | Up to 2 days | Up to 10 h | <2 h | <1 h |
| Flying altitude | 3–20 km | <4 km | <1 km | <250 m |
| Payload | 50 kg | 50 kg | 5–30 kg | <5 kg |
2.2. UAS Sensors
UASs are flexible platforms with the capability to host a wide variety of sensors that can be used for different types of forest applications, including: forest inventory, conservation and monitoring of natural resources, fire monitoring, disease detection and mapping and many others [17]. In this section, we present some of the sensors most commonly applied in forestry studies with great potential for application in the Miombo woodlands.
2.2.1. Visible-Light Sensors (RGB)
The sensors that are sensitive to the portion of the electromagnetic spectrum (EM), about 0.4–0.7 µm, which is also sensed by the human eye, are referred to as visible-light or red, green and blue (RGB) sensors [29]. According to a review by [24], RGB sensors are the most commonly used sensors in UAS systems for forestry. A review by [17] on the global development and application of UAS technology in forestry from 2010 to 2019 revealed that 57% of UAS forest applications used RGB sensors. The major factors contributing to their popular use include: (i) their low cost compared to other sensors; (ii) their less complicated, easy-to-operate and lightweight design; (iii) their low cost and readily available processing software; (iv) the ease with which their RGB images can be processed compared to those from other sensors; and (v) the fact that most low-cost UASs come with an RGB camera integrated into the system [17,24]. These attributes explain why the RGB sensor is the most commonly applied in pioneering forestry applications in sub-Saharan Africa [19,21,22,23,25,26,27,28].
Despite their wider application, the limited spectral range of RGB sensors makes them inadequate for analyzing many vegetation parameters that require spectral information beyond the narrow visible spectrum [30]. For example, a study by [31], in nature reserves in Amtsvenn, Germany, demonstrated that a combination of UAS-RGB images with multispectral Pleiades images significantly improved overall tree species classification from 62% to 84% compared to using UAS-RGB images alone. Similar observations were made by [32], who found that the addition of a near-infrared band to an RGB sensor improved the tree species classification by about 11%. In [26], the effectiveness of UAS imagery for monitoring structural characteristics vegetation was assessed in a semiarid savanna woodland, Chobe Enclave, in northern Botswana, by comparing multiple approaches for extracting woody vegetation structure from UAS imagery. They assessed the efficacy of UAS imagery from RGB sensors and multispectral sensors to extract vegetation structure parameters (crown area and fractional woody cover) and found that the NIR band in the multispectral sensor improved tree crown delineation and estimates of crown area, fractional woody cover and herbaceous cover. However, despite the limitations of RGB sensors in the discrimination of tree species and studies of forest health, photogrammetric point clouds derived from RGB stereo images have been found to be comparable to and cost less than three-dimensional (3D) lidar data [33], which are currently lacking in the Miombo woodlands.
2.2.2. Multispectral
Multispectral sensors are sensitive to the visible part of the spectrum as well as wavelengths that fall beyond the visible spectrum, which may include: near-infrared (0.7–1.3 µm), middle-infrared (1.3–3 µm) and thermal-infrared (3–14 µm) regions [29], and spectral bands are stored as separate images in monotone. This allows for flexibility in choice of spectral bands to form desired image composites for image analysis. However, separate spectral bands increase the sophistication, weight and cost of the sensor as well as the processing and storage requirements for the resulting imagery [34]. Multispectral sensors that include the near-infrared (NIR) part of the EM have significant advantages in vegetation applications because of the high vegetation reflectance in NIR compared to the visible part of the EM. Many studies have used UASs with multispectral sensors in forest-management-related applications, for example: (i) species identification [32,35,36,37] and (ii) exploiting the dissimilarities in reflectance properties between the visible and near-infrared regions to calculate vegetation indices and monitor plant health [38,39,40]. The advantage of these sensors compared to RGB sensors is that the addition of NIR increases the possibility for computing various vegetation indices [41,42] required for analyzing vegetation health and increases the possibilities for discriminating among various tree species, e.g., Refs. [32,43]. For example, Ref. [44] compared UAS RGB and multispectral imagery io classify different vegetation covers and found that multispectral-based classification results were 10–15% higher than RGB-image-based results. The disadvantages of the multispectral sensors compared to RGB sensors include their higher cost and the requirement for more complex pre-processing methods in order to extract useful information from the captured images. As a result, fewer studies have employed UAS multispectral sensors compared to RGB sensors [17], and this is also reflected in the number of studies in sub-Saharan Africa under this review (Table 2). The Miombo woodland canopy is characterized by diverse tree species with a similar appearance [2], and the addition of NIR bands improves RGB sensors’ capability to discriminate among tree species that might otherwise be difficult to identify.
2.2.3. Hyperspectral Sensors
Hyperspectral sensors capture imagery in narrow spectral bands over a continuous spectral range, recording the spectra for all pixels in the scene. They capture more detailed information than multispectral sensors because an entire spectrum is acquired at each pixel. The major advantage of hyperspectral sensors is that they are able to discriminate among small spectral details over narrow bands of the EM, which could otherwise be generalized by multispectral broadband sensors [45]. This is useful for detailed vegetation analysis, for example, discrimination between different vegetation species [46,47,48]. According to the comparison of UAS sensors in a review by [24], the disadvantages that limit their application with UASs include their heavy payload, high cost, the requirement for a huge amount of storage space due to the large number of bands and complexity of data acquisition and analysis. Yao et al. [49] added that most hyperspectral sensors are linear-array and require specialized processing software, and users are expected to take care of data formats and geometric corrections. Due to these disadvantages, only a few studies have utilized this sensor type in other parts of the world [17,18], and none so far have been conducted in sub-Saharan Africa. However, with continuous developments in both sensor and processing software technologies, some of the stated limitations are expected to be overcome, and the cost is expected to decrease, which will open room for more applications [24], including in sub-Saharan Africa.
2.2.4. Thermal Sensors
Thermal infrared sensors capture information about the temperature of the heat emitted by objects, as opposed to reflected solar radiation, and images are produced based on temperature response of the emitting objects as opposed to their spectral reflectance properties. The application areas for UAS thermal sensors in forestry studies include: forest fire monitoring [50,51], forest health monitoring [52] and detecting warm-blooded animals in the forests [53]. The use of UAS thermal sensors in forestry studies is limited (see [17] for the number of published articles on UAS thermal sensors compared to those on other sensors and [18] for summary of applications) and is yet to be applied in sub-Saharan Africa. This could be due to their low spatial resolution compared to RGB and multispectral sensors, which limits the number of applications for which the data can be used. Another challenge for active fire remote sensing is the huge dynamic range of the brightness temperatures, which presents much more of an engineering challenge to measure. As a result, most thermal IR images saturate where there are active flames, especially the sensors light enough to be a feasible payload on a UAS [24]. Thermal cameras are also more expensive than RGB sensors, further limiting their application in the Miombo.
2.2.5. LIDAR Sensors
Lidar is an active laser-based remote sensing technology that measures distance based on the return time of emitted light [54]. The advantage of lidar in forest applications lies in its ability to characterize forest structure in 3D with high accuracy [55]. For example, studies in conifer stands by [56] in Norway and by [57] in British Columbia used airborne lidar to estimate stand height with (r2 = 0.90) and volume with (r2 = 0.45 to 0.89). The other important advantage is its ability to penetrate the forest canopy, which makes it possible to capture understory vegetation as well as bare earth terrain in forested areas, although terrain accuracy is reportedly reduced with increasing canopy cover [58]. For example, an assessment of a lidar-generated DTM in a mountainous forested area of western Washington State, United States of America, under varying vegetation conditions [58] found a mean DTM error ranging from 0.16 m for bare ground to 0.31 m for dense canopy. Examples of applications of UAS-mounted lidar (UAS-lidar) systems in forestry include: below-canopy mapping [59], tree stem detection and diameter measurements [60], forest change detection [61] and estimating forest structure parameters [62,63]. Despite its advantages compared to other sensors, UAS-lidar applications are still less pronounced, as evidenced by the number of articles published in a review by [17], and so far, there is no example of its application in sub-Saharan Africa. The major drawback of a UAS-lidar is its heavier payload, which requires bigger and relatively more expensive drones, and the associated higher cost of lidar sensors. However, the ability of lidar to penetrate forest canopies and detect bare earth elevations in difficult forest environments [64] compensates for some of the disadvantages; with expected reductions in cost and improvements in sensor technology, the number of studies employing this technology is expected to increase. A pioneering study by [65] developed a UAS-mounted lidar system (UAS-lidar) and were able to estimate tree heights and detect utility poles. In a similar study, Ref. [66] developed a low-cost UAS-lidar system with an accompanying workflow for producing 3D point clouds, and used it to measure tree location, height and crown width.
2.3. Data Processing
Typically, many UAS sensors will generate huge data volumes, which need to be processed to derive meaningful information to satisfy various forestry applications. There are several post-processing options for UAS imagery that can be pursued to satisfy intended forestry applications. Some common outputs from UAS imagery include: (i) mosaicking, which gives a seamless synoptic view of the area under study, (ii) 3D point clouds, which are used in forest inventory and estimating forest structure parameters, (iii) vegetation indices for monitoring forest health and discriminating between different species and (iv) classification and regression.
2.3.1. Mosaicking
UASs use small-format optical sensors that capture a series of overlapping photographs covering an area. Such single images cover an area of very limited spatial extent of a forest for meaningful analysis and need to be stitched together to form one composite image known as a mosaic. Most UAS optical imagery processing software uses a scale invariant feature transform (SIFT) algorithm for mosaic UAS imagery. Jia et al. [67] divides the mosaicking process into three stages: (i) image pre-processing (correction for image distortion); (ii) image registration (feature extraction, feature matching, model transformation and parameter estimation); and (ii) image fusion (eliminating discontinuity of color to achieve smooth transition from one photo to another). Finally, the mosaic is georeferenced using ground control points or orthorectified using a DTM.
2.3.2. Three-Dimensional Point Clouds
Three-dimensional (3D) point clouds are generated either directly using active lidar UAS sensors, e.g., as in [60,68], or indirectly from passive optical UAS digital aerial photography (DAP) using the structure from motion approach (SfM) [22,69,70,71].
The SfM approach stems from computer vision automatic feature-matching algorithms [72], and the principle is well-described in Westoby et al. (2012) and Iglhaut et al. (2019). According to Westoby et al. [73], SfM involves the re-establishment of the camera pose and scene geometry simultaneously through matching features in multiple overlapping, offset images and generating 3D point clouds in the image space coordinate system. The image space 3D point cloud is transformed into the object space in real-world coordinates by the use of ground control points (GCPs) with known coordinates in both systems to generate a digital surface model (DSM), orthomosaic or other point cloud statistics. The DSM is the key product from which a canopy height model (CHM) can be generated by subtracting a digital terrain model (DTM) from a DSM [74].
Conversely, the UAS lidar sensor directly generates a 3D point cloud, which undergoes three processes to produce a CHM: (i) de-noising to remove outliers (e.g., signals bouncing off from captured birds flying above the canopy) to generate a DSM; (ii) filtering or classifying, which entails separating ground from non-ground points to generate a DTM representing the ground terrain; and (iii) normalizing the DSM to generate a CHM by subtracting the DTM from the DSM.
Two methods have been applied to extract forest attributes from point clouds: the area-based approach (ABA) and individual tree detection (ITD) [75,76]. In ABA methods, forest characteristics, such as mean tree height, mean diameter, basal area, volume and biomass, are estimated at the stand or plot level using statistics calculated from point clouds, resulting in canopy height and density metrics used in regression, discriminant analysis or nonparametric estimation techniques, e.g., as in [77,78,79,80,81]. In the ITD methods, individual trees are segmented from point clouds, and tree-level attributes such as tree height, crown width and crown base height can be derived either directly from point clouds or statistical metrics such as those used in area-based approaches using crown metrics derived from point cloud data within individual tree segments [82,83,84].
The ABA approach can operate accurately with lower LIDAR pulse densities but requires more field-measured plots for calibration. On the other hand, the ITD-based approach requires fewer field data for calibrating the individual tree measurements [75]. However, the application of the ITD approach is still limited compared to ABA due the lack of generic algorithms that can extract individual trees in varying complex forest environments, especially broadleaf trees, which have an inconsistent morphological structure that is difficult to model using existing algorithms [76].
2.3.3. Image Classification
Apart from extracting point clouds for estimating forest structure parameters, ultra-high-resolution (UHR) optical UAS imagery can be classified to extract various forest characteristics that include (i) forest cover maps, (ii) forest burn severity, (ii) forest health [39] and forest tree species identification [37,85]. Classification of UHR UAS imagery is either based on pixel-based classifiers, e.g., maximum likelihood algorithm [43], or geographic-object-based image analysis (GEOBIA), machine learning (ML) algorithms [32] or a broad range of variants and hybrids of these methods [86]. However, the UHR UAS imagery presents new challenges, which include intra-crown spectral variability [37,43], illumination differences due to occlusion [87] and challenges in tree crown extraction [88]. GEOBIA, in which the classification is based on image objects that correspond to targeted real-world objects (e.g., individual tree crowns) instead of individual pixels [89], has been found to be effective in addressing some of these challenges [32].
GEOBIA has two main processing steps: (i) image segmentation, which is the process of dividing an image into homogeneous regions or objects that correspond to discernible features in remote sensing imagery, e.g., trees, buildings, grasslands and water bodies [90,91]; and (ii) classification of segmented image objects. Segmentation algorithms are categorized by the approach used to divide image objects: (i) pixel-based, (ii) edge-based, (iii) region-growing and (iv) the hybrid method; a detailed discussion of these approaches can be found in [90,92]. In natural forest environments, segmented objects correspond to individual tree crowns. Therefore, GEOBIA entails first delineating individual tree crowns (ITCs), followed by classification of identified ITCs into appropriate species based on the spectral characteristics of ITCs [88]. Tree species classification based on ITCs has been found to yield better results compared to pixel-based classification; for example, Ref. [37] reported 60% and 80% accuracy for the pixel-based approach and GEOBIA, respectively. Segmentation techniques have been applied to delineate ITCs from different UAS products, such as orthophoto mosaics, CHMs, point clouds or a combination of these. For example, Ref. [86] extracted ITCs from UAS-SfM- and UAS-lidar-generated point clouds in a Eucalyptus plantation in Valongo, Porto, Portugal, with accuracies of 80% and 96%, respectively. In a study by [32], multispectral UAV images acquired over a northern hardwood forest in Eastern Ontario, Canada, were segmented, and the generated image objects were classified using a machine learning (ML) algorithm (random forests) to identify different tree species. A study by [93] used GEOBIA to identify different vegetation species in the Himalayan Langtang National Park, Nepal, by segmentation, followed by multilevel image analysis, and achieved 78% accuracy.
2.3.4. Vegetation Indices
Vegetation indices (VIs) are useful algorithms for quantitative and qualitative monitoring and evaluation of vegetation cover, vigor, health and growth dynamics [42]. VIs are based on the reflection of EM radiation by vegetation, which makes it possible to distinguish vegetation from other ground elements. As a result, many VIs have been developed for various vegetation monitoring applications [41,42]. There are two broad categories of VIs that are commonly extracted from optical UAS imagery for monitoring vegetation (see Table 4 for formulae used to calculate these indices): (i) those that are based on multispectral or hyperspectral imagery (e.g., the Ratio Vegetation Index (RVI), Normalized Difference Vegetation Index (NDVI), Simple Ratio (SR) Vegetation Index, etc.) and (ii) those that are computed based on the visible spectrum (e.g., Excess Greenness Index (ExG), Normalized Difference Index (NDI)), Red–Green Ratio Index (RGRI), etc.).
Table 4.
Examples of visible-spectrum- and multispectral-based indices.
The NDVI is the most widely used VI, and is calculated from multispectral images as the normalized ratio between the red and near-infrared bands and used to detect and monitor vegetation status [42]. However, with regard to UASs, as revealed above, the RGB sensors are the most commonly used sensors, but they do not have the near-infrared band that facilitates vegetation detection. As a result, there are new efforts to establish VIs based on RGB sensors, as demonstrated in a study by Zhang et al. [94], who introduced the new Green–Red Vegetation Index (NGRVI) to extract vegetation information from the arid and semiarid Lake Ebinur Basin of the Xinjiang Uygur region of China with more than 90% accuracy. Another study by Agapiou [95] explored the use of various published VIs on openly licensed RGB UAS imagery from several case studies in different countries with different environments and found that Green Leaf Index (GLI) yielded the best results for all case studies.
3. UAS Applications in Forestry
Many forestry practitioners have successfully explored the use of UASs in different forest applications, namely: forest inventory and estimation of dendrometric parameters [22,63,69,82,96]; forest health [39,40]; species identification [35,37]; forest fire monitoring [97,98]; and detecting and quantifying canopy gaps [99,100]. However, many factors impede the full operationalization of UASs in forestry, due to variation in (i) forest structure and composition, (ii) landscapes, (iii) management and exploitation regimes and (iv) UAS regulations. Therefore, to better guide the application of UASs in forestry, more comparative studies are needed to determine suitable UAS remote sensing technologies for various forest environments and/or forestry applications [15].
3.1. Overview of UAS Applications in Forest in Sub-Saharan African
Based on the reviewed literature (Table 2), only five countries have applied UASs in forestry thus far in sub-Saharan African: three studies in Sahelian savanna, Senegal; three in the Miombo woodlands, Malawi; one in two countries, Botswana and Mozambique; and one in Namibia. As has been already noted, most of sub-Saharan Africa is lagging behind in UAS applications in forestry, and the following sections give an overview of these studies divided into two categories: biomass and tree attribute estimation, and disturbance monitoring.
3.1.1. Estimation Biomass and Other Vegetation Structural Attributes
A study by [28] assessed woody and herbaceous species phytomass using RGB UAS imagery collected in the Sahelian savanna in northern Senegal. Plot-level cross-validation revealed an r2 of 0.59 for woody phytomass and 0.71 for herbaceous phytomass, which confirmed the feasibility of low-cost UAS imagery for assessing Sahelian savanna phytomass. Another study by [21] applied UAS-SfM technology to estimate tree height and crown area in the Sahelian savanna in northern Senegal; they were able to achieve a strong correlation with ground measurements, r2 = 0.84 and r2 = 0.93 for tree height and crown area, respectively. They employed the random forest algorithm to classify tree species within the same study area by utilizing tree canopy morphology and canopy colors measured by UASs, and were able to predict tree species within an error of 20%. Kachamba et al. [22] evaluated the application of 3D data derived from UAS imagery for biomass estimation and also compared impacts of digital terrain models (DTMs) generated based on different methods and parameter settings in the Miombo woodlands, Muyobe Forest, Mzimba District, northern Malawi. The biomass was estimated at r2 = 0.58 − 0.67; there were no significant differences (p = 0.985) between tested DTMs except for that based on the Shuttle Radar Topography Mission (SRTM) (r2 = 0.12). In a subsequent study in the same study area, Kachamba et al. [25] assessed the influence of sample plot size on the efficiency of UAS-assisted biomass estimates. The results of this study were that a design-based field sample inventory assisted by three-dimensional point clouds obtained from aerial imagery acquired with a UAS showed that the root mean square errors as well as the standard error estimates of mean biomass decreased as sample plot sizes increased. Another study by Domingo et al. [23] in the same area assessed the influence of image resolution, camera type and side overlap on the prediction accuracy of biomass models constructed from ground-based data and UAS data. They compared the prediction accuracy of models reflecting two different image resolutions (10 and 15 cm ground sampling distance) and two camera types (NIR and RGB). They also assessed the effect of two different side overlap levels (70% and 80%) using data from the RGB camera. They found that accuracy improved when using the RGB camera which had finer image resolution compared to using the NIR camera which had coarser image resolution and decreased model accuracy. Though these studies yielded promising results, they were all carried out within the same study area of the Miombo woodlands. Therefore, to have conclusive results, more tests need to be carried out in different settings of the Miombo woodlands, with different species covering varying climatic and edaphic environments. In [26], the effectiveness of UAS imagery for monitoring structural characteristics of vegetation in a semiarid savanna woodland, in Chobe Enclave, northern Botswana, was assessed by comparing multiple approaches for extracting woody vegetation structure from UAS imagery. They assessed the efficacy of UAS imagery from RGB and multispectral sensors in extracting vegetation structure parameters (crown area and fractional woody cover). They found that the NIR band in the multispectral sensor improved tree crown delineation, crown area estimates and fractional woody cover and herbaceous cover within the study area. They also compared the region-growing and height threshold segmentation algorithms for delineating tree crowns and found that both performed well in the grass-dominated savanna sites where trees and shrubs are clearly distinguishable, but the height threshold outperformed the other region-growing algorithm in tree-dominated sites. A study by [27] derived tree heights from RGB UAS imagery and SfM techniques and assessed the sensitivity of derived tree heights on the estimation of aboveground biomass (AGB) in Desa’a dry land Afromontane Forest, northern Ethiopia, and achieved adjusted values of coefficients of determination, r2, of 0.98 and 0.99 for estimated tree heights and biomass, respectively.
3.1.2. Disturbance Monitoring
Mayr et al. [19] used UASs to monitor grazing and fire disturbances using the height of woody vegetation in a savanna in the northern Otjozondujupa region, Namibia, and achieved a good relationship between ground measurements and UAS-derived measurements (R2 = 0.7, RMSE < 0.9). A study by [20] combined multispectral UAS imagery and meteorological data from the ERA-5 land dataset to model instantaneous pre-fire AGB. Ground data were collected in two savanna regions of Southern Africa with different rainfall patterns: the north-west district (Ngamiland), Botswana, with 660 mm mean annual rainfall; and Nissan Province, northern Mozambique, with 940 mm mean annual rainfall. Their model was able to predict AGB with r2 = 0.91 and r2 = 0.77 for live grass and total fine fuel, respectively. However, their model was less effective in predicting biomass for other classes, such as wood debris, that are not significant for emissions in regions under consideration.
3.2. Estimating Forest Structure Parameters in Miombo Woodlands
The combination of UASs with non-radiometric RGB sensors and SfM (UAS-SFM) technology is a popular approach for estimating forest structure parameters [17,34,101]. This is mainly due to the low cost and easy accessibility associated with UAS RGB sensors as well as the processing software used in this approach [33]. The application of a UAS-SfM approach in characterizing forest structure has been demonstrated in many parts of the world, for example: temperate deciduous forests in Maryland, USA [102], tropical forest in Cambodia [103], temperate European beech forests in Italy [104], open-canopy mixed conifer forest in Wyoming, USA [82], mixed conifer–broadleaved forest in Japan [105], tropical woodlands in Malawi [22], tropical premontane wet forests in southern Costa Rica [106], mangrove forests in Malaysia [107], subtropical forests in Dinghushan, China [108] and dry sclerophyll eucalypt forests in Tasmania, Australia [62].
UAS-lidar data have been applied in the same way as data from manned airborne platforms [65,96,109,110]. Other studies have used integrated systems with both UAS-SfM and UAS-lidar, but this is usually done for synergistic benefit and to compare the performances of the two approaches [62,63]. Although they have been shown to be more accurate than UAS-SfM, only a few studies have used UAS-lidar systems for estimating forest structure parameters due to the high cost and heavy payload associated with lidar, which requires bigger and more sophisticated drones compared to UAS-SfM [68,109]. However, with continuous innovation in lidar sensors and UASs, prices are expected to decrease to make UAS-Lidar methods readily available to many forest managers.
Three-dimensional information from both UAS-SfM and UAS-lidar is suitable for describing the upper canopy layer of forests [63,111]. However, UAS-SfM has been observed to be inadequate in dense canopies with more than 60% cover due to the low accuracy of the DTM caused by poor optical image penetration in dense canopies [62,112]. In contrast, lidar has been shown to be more effective in generating a highly DTM, even in dense canopies with over 60% cover [58,113,114].
Therefore, for the Miombo woodlands, we conclude that UAS-SfM can be used as a low-cost alternative to estimate forest attributes including height, canopy dimensions and biomass in the dry Miombo woodlands and under leaf-off conditions in the wet Miombo woodlands. UAS-lidar can be used to estimate forest structure attributes including different layers of vertical canopy structure in both wet and dry Miombo woodlands. This detailed forest inventory information is required for sustainable forest management at a local or stand level and for international reporting mechanisms such as Reducing Emissions from Deforestation and Forest Degradation, plus forest conservation, sustainable management of forest and enhancement of carbon stocks (REDD+) and Monitoring, Reporting and Verification (MRV), which provides a financial incentive to developing countries for forest conservation and implementation of sustainable forest management based on national carbon stocks reported to the United Nations Framework Convention on Climate Change, UNFCCC [115,116]. However, Ref. [33] cautions that even with some reported successes in the application of UAS-SfM technology, challenges such as (i) differences in data acquired at different times due to variations in illumination conditions for different seasons, (ii) low accuracy of UAS-SfM DTMs in dense forest environments such as some parts of the wet Miombo, (iii) lack of UAS image acquisition and processing protocols that would produce consistent SfM data across different forest types and conditions and (iv) image-matching challenges such as illumination differences and changes in the position of branches due to wind for images acquired for different times and positions. Nevertheless, the DTM challenge can be overcome by the use of lidar sensors, which are now available as smaller payloads and relatively cheaper versions that are able to be mounted on UASs. UAS-lidar technology can be used to provide a one-off accurate DTM, which can be used repeatedly since terrain in forest environments generally remains stable over a long time. Thus, the less costly UAS-SfM DSM can be used with the UAS-lidar DTM to provide a more accurate CHM for detailed multi-temporal 3D forest structure information for many forest applications, including monitoring.
3.3. Phenology of Miombo Woodlands
Ultra-high-resolution UAS imagery provides the spatial detail required to study both leaf and flowering phenology of Miombo tree species. Further, the flexibility with which data can be acquired with UASs provides an opportunity for optimally timed capture of important phenological events that are difficult to capture by other remote sensing platforms such as satellites due to cloud cover or unsynchronized data capture relative to occurrence of the event. For example, Ref. [117] acquired UAS imagery for 34 dates over a 12-month period to monitor tree-species-level leaf phenology in a tropical forest in Panama and revealed undescribed patterns of high intraspecific variation and complex leaf cover changes for some species. This approach could be promulgated to the Miombo woodlands to study phenologies that are not yet well-understood. Most Miombo species are deciduous or semideciduous, shedding their leaves in the dry season, and new leaves flush weeks to a month or more before the onset of the rainy season [2]. The young Brachystegia leaves are concentrated with anthocyanin, giving rise to a reddish spring foliage. Flowering of most Miombo trees and shrubs occurs just prior to the rainy season (September-October), with the exception of Julbernardia paniculata (February–April) and J. globiflora (November to April). Further, the understory herbaceous layer dries soon after the rainy season. Additionally, the distinct structure of Miombo woodlands, especially the variation across seasons (Table 2), gives an indication of the potential of the use of UASs in Miombo woodland management.
3.4. Classification of Miombo Tree Species
The Miombo dominant canopy species have similar physiognomy, resulting in a similar appearance, which is attributed to the fact that most of these species are of the family Caesalpiniodeae [2]. This familial similarity in appearance presents challenges as there is high spectral similarity between co-occurring species, which may be difficult to discriminate between using low-spatial/spectral/temporal-resolution remote sensing imagery. UAS platforms provide flexibility to accommodate multiple sensors (RGB, multispectral, hyperspectral and lidar), which can be used to acquire ultra-high-spatial-resolution imagery at convenient frequent intervals for use in the identification of tree species [24]. UASs enable the acquisition of imagery at sub-meter resolution, making it usable for the identification of individual tree species. However, ultra-high spatial resolutions may lead to different spectral responses from different parts of the same tree, such as leaves, branches and trunks, which can make it difficult to identify trees at the species level due to variation in textures and spectral signatures within the same tree. Other challenges in using high-resolution optical data from UASs for classification of tree species that might affect the quality of results include: (i) variation in illumination conditions for images taken on different dates and at different times of day that will result in different spectral responses for the same objects, (ii) intraspecies variation in phenological development, which is common in the Miombo woodlands and (iii) similarities in leaves and morphology of different tree species in the Miombo woodlands, which will result in the mixing of different species. As a result, object-based image analysis is preferred to conventional pixel-based classifiers for UAS imagery. For example, a study by [32] showed an improvement in classification results for identifying tree species from 50 to 60% for pixel-based classification to 80% percent for object-based classification using the same UAS imagery in the same area.
Flexible Temporal Frequency
UASs provide a flexible temporal frequency [15] at which data can be acquired to ensure that collection coincides with important phenological events that can help in discriminating among different tree species. The proper timing of these events in the Miombo, for example, can help in discriminating between: (i) the herbaceous layer and the tree canopy using the Normalized Difference Vegetation Index (NDVI) at the end of the rainy season in May, (ii) Brachystegia species and other species at leaf flushing using reddish color and (iii) Julbernardia species using the late flowering event [2]. For example, [118] used the random forest (RF) classification algorithm to classify five deciduous species groups on a 130-hectare broadleaved forest in Grand-Leez, Belgium, using single-date, two-date and three-date multispectral UAS image combinations at critical phenological stages and found that three-date combinations yielded superior results compared to the other combinations because of the different phenological characteristics of different species.
3.5. Monitoring Disturbances
A UAS may be a useful tool in monitoring the disturbances and recovery of the Miombo woodland at the landscape level. The disturbances in the Miombo mainly arise from the interaction of three factors, namely [2]: (i) anthropogenic influences, (ii) fire and (iii) herbivory.
3.5.1. Anthropogenic Disturbances
Disturbances as a result of Miombo woodland utilization by people include complete clearing for cropping, shifting cultivation, selective harvesting of trees for timber, firewood, charcoal production, medicine and livestock grazing. While disturbances from huge clearings for cropping and charcoal production are detectable using freely available moderate-resolution satellite imagery such as Landsat and Sentinel, e.g., as in [10,119], small-scale disturbances from selective cutting and lopping of trees and understory grazing are difficult to detect from such imagery and occur at spatial and temporal scales that are difficult and costly to cover using field methods [120,121,122]. Furthermore, for shifting cultivation agriculture, which is common in the Miombo woodlands, some clearings are too small (0.5–2 ha) to be covered by moderate-resolution imagery [10]. UASs can be used to capture ultra-high-spatial-resolution imagery with the timing and frequency required to monitor disturbances and recovery from selective harvesting and lopping of trees and bridge the temporal and spatial gap between freely available satellite imagery and field methods. For example, a study by [123] used repeated UAS flights to monitor selective logging at the individual tree level in a pine-dominated forest in Germany; they were able to detect felled trees with a precision and recall of 97.5% and 91.7%, respectively. In a post-harvest assessment of charcoal and timber, Ref. [103] used UAS imagery before and after a selective logging event in a tropical forest in Myanmar to quantify changes in aboveground biomass (AGB). In addition, UAS methodologies proposed by [124,125] to quantify harvested timber and detect illegal logging in protected areas may be useful in monitoring such areas as the Miombo woodlands. Further, UAS-SfM imagery can be used to monitor biomass changes due to grazing in open Miombo woodlands with less than 50% canopy cover, while in forests with greater than 50% canopy cover, UAS-lidar, which can penetrate through the canopy and give a full vertical characterization of the forest, can be used to monitor disturbances related to understory grazing [112].
3.5.2. Fire-Related Disturbances
Fires are a major cause of changes in the structure and composition of Miombo woodlands [2]. Therefore, pre-fire, during-fire and post-fire forest management are important. UASs with ultra-high spatial resolution and flexibility of deployment are one of the emerging remote sensing tools for fire management [97,126,127]. Grass and woody plant leaf litter are the major fuel load for fires in the Miombo woodlands [128] that could be quantified using UASs to assess the risk and serve as an early warning indicator for the likelihood of a fire occurrence. In terms of fire prevention and early warnings, Ref. [129] proposed a methodology based on high-resolution UAS-lidar point clouds that can be used to characterize forest fuel load. [130] used a UAS mounted with infrared and visible-light sensors to capture imagery and employed reflectance in six wavelengths in the visible and infrared ranges to estimate fuel moisture in grasslands in western Washington, United States of America (USA). Another study by [131] evaluated the feasibility of using UAS imagery for estimating forest canopy fuels in a ponderosa pine stand in Flagstaff, Arizona, USA, and accurately estimated canopy cover (R2 = 0.82, RMSE = 8.9%). During a fire event, UASs with thermal infrared sensors can be used for active fire detection and monitoring. For example, Ref. [50] deployed a fleet of three UASs mounted with infrared and thermal sensors to measure and monitor the evolution of fire and demonstrated that UASs can cover the gap between the spatial measurement scales of cameras deployed on satellites and on towers. Ref. [132] used UAS thermal infrared imagery to track the development of an active wildfire in real time and generated valuable data for managing the wildfire emergency response. For assessment of post-fire damage and recovery, the potential of using indices derived from RGB sensors mounted on a UAS was demonstrated in studies by [127] and [126], who were able to assess the extent and severity of fires and subsequent recovery of the ecosystems at the landscape scale. The above examples of application of UASs in fire studies speak to the potential that UASs have in bridging the data gap in fire studies in the Miombo woodlands.
3.5.3. Herbivore-Related Disturbances
Herbivores have been associated with causing changes in plant biomass, forest structure and diversity across the African savannas [4]. In the Miombo woodlands, the largest share of herbivory-related disturbances have been attributed to elephants [2,133,134]. For example, a study by [135] revealed that increased elephant numbers in Chizarira National Park, Zimbabwe, contributed to the destruction of 67% of the 500 original mature Brachystegia boehmii trees. Another study by [136], who monitored biomass changes over a four-year period (1972–1976) in the Sengwa Wildlife Research Area in Zimbabwe, reported a 46% decline in the biomass of canopy trees, a 42% decline in basal area and a 23% decline in density, which was attributed to elephants. Other studies in similar environments have attributed the structure changes in vegetation cover to the combined effect of elephants and fire [137,138] The impact of herbivory on vegetation is heterogenous and mainly species-specific and occurs at different spatial scales [2,134,135]. The interactions between herbivores and vegetation as well as their spatial heterogeneity are essential for understanding ecosystem structure and function in the Miombo woodlands [2]. Though remote sensing has been identified as an essential tool for quantifying the impacts of herbivory on vegetation structure [139,140], it is still underutilized for this purpose in the Miombo woodlands [3]. The advent of UASs has provided an opportunity to collect high-spatial/temporal-resolution imagery data that are suitable for quantifying herbivory [14]. For instance, Ref. [141] used repeated UAS flights from 2018 and 2019 to quantify vegetation impacted by rodents in four complex landscapes of northern Sweden. They applied image raster math by subtracting 2019 NDVI imagery from 2018 NDVI imagery to estimate changes in NDVI values as an indication of rodent impacts on vegetation. These methods and high-resolution UAS imagery have the potential to be used in monitoring disturbances caused by herbivores in the Miombo, which occur at smaller spatial scales that would otherwise be difficult to detect using medium-resolution satellite imagery.
3.6. Bridging the Data Gap
Miombo woodlands exhibit multifaceted vegetation patterns varying from sparse to dense vegetation emanating from edaphic factors and disturbances (anthropogenic, fires and herbivory) [2]. If not well-captured, small-scale spatial variation in vegetation cover can lead to inaccurate quantification of biophysical and ecological properties of vegetation [142]. Effective forest management and international reporting requirements such as REDD+ require vegetation data products covering the whole spatial spectrum from detailed field inventories to satellite remote-sensing-based wall-to-wall mapping [122]. On one hand, detailed field inventory methods have been used to estimate biophysical properties of vegetation within the Miombo ecoregion [7,143,144,145], though these studies were conducted on relatively small sites that are inadequate for regional wall-to-wall mapping. On the other hand, medium-spatial-resolution imagery (10–250) has been used in mapping forest cover changes [10,11,146,147] and estimating charcoal-related degradation [119,148] in the Miombo woodlands and achieved promising results that can be used for wall-to-wall mapping. However, medium-resolution satellite imagery is unable to detect forest changes that occur at a smaller spatial scale in the Miombo woodlands [149], for example: (i) selective tree harvesting for firewood, charcoal production and timber [150], (ii) shifting cultivation and small field clearings of less than two hectares [10] and (iii) under-canopy biomass removal due to grazing [143]. As evidenced by this review, UAS technology has demonstrated its potential to bridge the spatial data gap that exists between detailed field inventory methods and satellite-based remote sensing methods that are required for wall-to-wall mapping of the Miombo woodlands. This can be achieved through a two-phase sampling design where areas covered by a UAS are sampled with field plots and areas covered by wall-to-wall satellite imagery are sampled using a UAS.
3.7. Current Status of Application of UASs in Miombo Woodlands
Although there is great potential for the application of UASs in the Miombo woodlands, the current status of application (Table 5) is still at a rudimentary level, and all studies were focused on estimation of forest structure attributes using the RGB and NIR sensors, and were carried out at one site in the dry Miombo [22,23,25]. Other forest applications and UAS sensors, which have been evinced by earlier reviews [14,15,16,17,18,24], are yet to be exploited in the Miombo woodlands. This shows that more studies need to be undertaken in different environments of the Miombo woodlands to actualize the potential benefits of UAS technology.
Table 5.
Overview of UAS application status in the Miombo woodlands.
4. Challenges for UAS Implementation in the Miombo Woodland
Although the advent of UAS technology has presented a lot of opportunities to improve management of forest resources in the Miombo woodland region, they come with challenges which need to be understood for successful implementation of the technology (Table 6). These challenges come from the limitations of UAS technology as well as global operating guidelines and regulations.
Table 6.
Summary of opportunities and challenges for potential UAS application areas in the Miombo woodlands.
4.1. Regulation
Globally, UASs are subjected to aviation safety rules just like manned aircraft, and countries have developed legislation to regulate the use of UASs with the goal of minimizing the risks to other airspace users and also to both people and property on the ground [151]. Therefore, it is important for any UAS operators to consult the legislation regulating drone use in the country of intended use [152]. In the Miombo woodland ecoregion, the Democratic Republic of Congo (DRC), Malawi, Tanzania, Zimbabwe and Zambia have legislation and Mozambique a directive guiding the operation of UASs, while in Angola there is no known legislation [153].
Despite good intentions, the implementation of UAS regulations presents barriers to their successful application in forestry. A frequent challenge is the time needed to approve an application for flying permits [154], which might result in missing the timing of data collection for important forest-related research events in the Miombo woodlands (e.g., vegetation phenological events) [128]. The other challenge is the restriction that the UAS should be flown within the visual line of sight (VLOS) of the pilot, which restricts the area that can be flown per flight. Furthermore, the restriction that a UAS be flown up to a maximum height of 120 m aboveground (and for Malawi, 45 m aboveground) results in increased resolution of the captured imagery and the number of captured photos, which increases computer processing demands. Where there are disparities in the laws and policies on the use of UASs among the Miombo ecoregion countries, cross-frontier projects among practitioners and researchers, which are very important in forest management, may be negatively impacted.
4.2. Site Environment Challenges
A detailed understanding of the operational site’s potential hazards and distractions is a key requirement for successful mission planning and execution of UAS data collection [155]. Some sections of the Miombo woodlands are home to a variety of wildlife, some of which are aggressive (e.g., lions, buffalos and elephants, among others) [128], and may distract the operators of UASs. Furthermore, flocks of Guinea fowls and large birds of prey such as eagles and other birds that inhabit Miombo woodlands might cause bird strikes on UASs. To mitigate such wildlife accidents, UAS operators should be aware of their occurrence and behavior beforehand.
Site topography has been found to have a big influence on the quality of 3D point clouds required for estimating forest structure parameters [23,106]. For example, a study by [23] conducted in the Miombo woodlands found that errors in tree height estimates increased with increases in the steepness of the slope, with the largest errors coming from slopes above a 35% incline. Another study by [156] used UAS-SFM to quantify boreal forest structure and composition in interior Alaska, USA, and reported difficulties in acquiring data along the steep slopes due to problems in adjusting the UAS platform to sustain a constant flight altitude above the entire site terrain.
4.3. Weather Limitations
UAS operations are sensitive to weather conditions, such as high wind speed, precipitation and extreme temperatures, which might impede UAS data collection at the optimal time of capturing relevant events (e.g., phenology, fire, insect infestations and many others) and sometimes may damage UAS components [157]. In addition, varying illumination conditions during image capture affect image quality, which may complicate image processing and lead to poor results [158]. Furthermore, wind-induced motion of leaves and branches during image capture can bring about complications in processing UAS imagery, resulting in the mismatch of features in overlapping images and poor-quality orthophotos and 3D point clouds [33]. According to historical climate data [159], in the Miombo ecoregion, high wind speeds are experienced between June and October, a period when most Miombo tree species go through leaf dropping, flowering and leaf shooting, while rainfall occurs around November to April [2]. Clouds are a prominent feature in the Miombo ecoregion, especially from November to June [159], and changes in cloud conditions during data collection can lead to changes in illumination conditions, which can cause biased estimation of measured spectral and structural variables [160,161]. Adverse weather conditions may result in poorly timed UAS operations and an inaccurate assessment of forests or affect operations times, resulting in project delays, which may discourage potential forest managers from using the technology. High overlap and side lap as well as restricting flight times to around noon have been proposed as some of the mitigating measures for unfavorable illumination conditions [33,161]. Ultimately, observation of prevailing weather conditions in the area of interest is critical to proper flight timing to reduce the effects of wind, clouds and shadow within imagery in order to produce the best data possible for the intended application [162].
4.4. Limitation of UAS Sensors
Most cameras that are used in UASs are not designed for remote sensing applications, and as such spectral response curves for such cameras are poorly calibrated, making it difficult to convert brightness values into radiance [34], which is essential for comparative analyses. Moreover, most consumer-grade cameras have limited spectral resolution and no infrared band, which limits their application for vegetation analysis. Another limitation of such cameras is that they are susceptible to vignette, where the center of the image appears brighter than the edges [163], which is a result of differences in light paths between the center and edges of the lens, causing a radial shadowing effect at the edges of the image [34]. Such negative effects have to be corrected in order to preserve spectral and structural attributes that are required for vegetation monitoring [87]. In instances where information beyond the visible part of the EM is required (e.g., species discrimination and detailed vegetation analysis), multispectral or hyperspectral sensors can be used [18].
Furthermore, for optical sensors, single UAS photos are usually mosaiced before any analysis at the landscape level [67], but the process of mosaicking presents challenges caused by vignetting, relief displacement and misregistration, as well as image artifacts created when image-balancing algorithms fail [34]. Poor-quality mosaics cause errors in spectral analysis, which can lead to biased estimates of forest inventory attributes. Some of the mosaic artifacts can be mitigated by following the UAS data collection protocol proposed by [161].
4.5. Endurance Challenge
The major limitation of most small UASs that are used in forest applications, especially multi-rotors, is low endurance, which means they can cover only a small area per flight [15,24]. Flight times for most UAS batteries range between 10 and 30 min [164]. However, this limitation is mitigated by mission planning software, which allows the pilot to pre-plan a photographic mission, set mission parameters (flying height, end lap, side lap, camera shutter speed, aircraft speed, etc.), predetermine the flight time and area to be covered and fly the aircraft autonomously, with minimal intervention. When the battery power is nearly depleted, the aircraft automatically comes back to land and the pilot can change the battery and re-launch the aircraft to continue the mission where it ended. Even with this capability of mission planning software, the limited area coverage per flight is still a challenge, which may discourage some practitioners from embracing this technology in the Miombo ecoregion.
4.6. Processing and Storage Challenges
Automatic interpretation of ultra-high (under 10 cm)-resolution images collected by UASs for species mapping is challenging to achieve using per-pixel classifiers that are implemented in most commonly used commercial image processing software packages [37]. However, progress has been reported in the use of GEOBIA and machine learning techniques to classify tree species [32,165], though these solutions tend to be site-specific and data-dependent, and thus cannot be easily generalized. Furthermore, image interpretation using GEOBIA and machine learning requires expensive specialized commercial software or open-source software with a steep learning curve, which might be beyond the capacity of most forest managers in the Miombo ecoregion. Another challenge is that ultra-high-resolution data collected by UASs demand expensive computer hardware with a high processing and storage capacity, which might be unaffordable for many institutions in the Miombo ecoregion countries and therefore may impede their application. For example, Agisoft Metashape, a popular software for generating point clouds and building mosaics from UAS imagery, requires a minimum of 16 GB for processing UAS imagery [166]. Depending on the size of the project and available hardware, processing of UAS imagery to generate meaningful data products for various applications can take many hours, which can be discouraging for many professionals.
4.7. Vegetation Cover Challenges
Miombo woodlands are generally open with little overlap between tree crowns (Table 4), but the density of trees varies in response to climate, topography, disturbance and edaphic factors [2,3]. Vegetation cover has a significant influence on the performance of data processing algorithms and quality of generated data products [69,167]. The quality of a CHM, which is a fundamental product in the estimation of vegetation structural attributes [168], is highly correlated to the quality of the DTM used in generating it [74]. Mlambo et al. [112] evaluated the performance of UAS-SfM in two United Kingdom sites: (i) Meshaw, Denvo, which has a relatively open canopy and (ii) Dryden, Scotland, which has a closed canopy. Comparison of the CHM generated by lidar and UAS-SfM 3D point clouds exhibited high correlation (r2 = 0.75) at Meshaw. At Dryden, there was poor correlation between UAS-SfM-estimated and ground-measured tree heights (r2 = 0.19), which was attributed to poor canopy penetration of UAS imagery. Their study recommended that the effect of poor canopy penetration can be mitigated by capturing UAS imagery during leaf-off season in deciduous forests. Their recommendations were corroborated by [169], who used leaf-off UAS-SfM-derived DTMs as a ground reference for supporting teak plantation inventory in the dry forests of the coastal region of Ecuador. A study by [170] assessed tree damage in the West Virginia Research Forest using a leaf-on generated UAS-SfM DSM, which gave better definition of the top canopy definition, and the leaf-off DTM, which gave a better definition of the ground. From lessons learnt from [112,169,170], we anticipate challenges in the quality of DTMs that will be generated by UAS-SfM in the closed-canopy environments that characterize some parts the Miombo. However, the UAS-SfM DTM quality challenge can be mitigated by either using leaf-off UAS imagery or UAS-lidar to generate a one-off DTM that can be used repeatedly with multi-temporal UAS-SfM DSM to compute CHMs for monitoring forest structural attributes.
In terms of classification of individual tree species, the detection accuracy of ITCs tends to decrease with increases in the tree density, species diversity and canopy structural complexity, which ultimately affects the quality of the final tree species classification results [36,171,172]. The Miombo woodlands are characterized by irregular tree crowns with a similar appearance [2]. In wet Miombo, there is typically overlapping of the crowns of neighboring trees. These attributes of the Miombo have been reported to cause challenges in identification of ITCs in similar forest environments [36,37,118]. Some studies use fusion of structural and spectral information and multi-temporal imagery [35,118] to improve the accuracy of identification of tree species.
4.8. Future Directions
This review has evinced progress in UAS technology in various forest applications, though it is not yet fully embraced within the Miombo ecoregion as such data gaps still exist. There are several potential future directions for applying UAS technology in the Miombo woodlands, including, the choice of sensors and, data processing techniques which are available for the monitoring of Miombo woodlands. It is hoped that future research explores the utility of UAS technology to fill existing data gaps in (i) estimation of forest structural attributes, (ii) identification of tree species, (iii) monitoring forest health, (iv) monitoring forest fires, and (v) monitoring small scale degradation, which are critical to meeting the objectives of the REDD+ project. Challenges still exist in developing and operationalizing the UAS data collection and processing techniques in monitoring the Miombo woodlands. The existence of studies focusing on the use of UAS technology to estimate vegetation parameters within the Miombo ecoregion in the recent past [22,23,25], sets the tone for UAS based studies. With continuous improvement in UAS sensor and data processing technology coupled with the reduction in prices of specialized sensors [24], it is envisaged that more studies focusing on the use of UAS technology for monitoring the Miombo woodlands. The focus should be towards developing best practices for data collection, data processing techniques and model validation, which can be achieved by testing the technology in different environments of the Miombo. Some of the initiatives that could be undertaken to enhance operationalization of the use of UAS technology in the Miombo woodlands are proposed in Table 7. It is anticipated the use of UAS based methods will complement the existing methods to fill the existing spatial gap between ground-based methods and wall to wall satellite imagery.
Table 7.
Future directions.
5. Conclusions
The Miombo woodlands ecoregion suffers from a lack of quantitative estimates of forest cover changes, species distributions and carbon stocks, which is key information required for effective forest management and international carbon MRV requirements. UASs present an alternative and supplementary method to rapidly collect forest data at high spatial and temporal resolution that are required for monitoring and management of the Miombo woodlands. The key attributes of the Miombo woodlands provide a potential area for application of UAS technology in undertaking forest inventory, which is important for forest monitoring and management. It is a useful tool for estimating forest structure attributes, species identification, effects from fire and forest degradation, all of which are necessary for forest management. However, if the UAS technology is to be widely applied in the Miombo region, it is also important to comply with restrictive regulations and to obtain required flight permits.
Author Contributions
All of the authors made substantial contributions towards the successful completion of this manuscript: Conceptualization, H.S. and S.S.; methodology, validation, H.S. and S.S. writing—original draft preparation, H.S.; review and editing, P.W.C., A.T.H. and A.R. All authors have read and agreed to the published version of the manuscript.
Funding
This research was funded by The United States Agency for International Development through Partnerships for Enhanced Engagement in Research (PEER) program (2000009945). Additional funding was provided by Oliver R Tambo African Research Chair Initiative (ORTARChI) project, an initiative of Canada’s International Development Research Centre (IDRC), South Africa’s National Research Foundation (NRF) and the Department of Science and Innovation (DSI), in partnership with the Oliver & Adelaide Tambo Foundation (OATF) and National Science and Technology Council, Zambia.
Data Availability Statement
The data are available on request from the corresponding author.
Acknowledgments
This research was supported by the USDA Forest Service, Rocky Mountain Research Station. The findings and conclusions in this publication are those of the authors and should not be construed to represent any official USDA or U.S. Government determination or policy.
Conflicts of Interest
The authors declare no conflict of interest.
References
- Campbell, B. The Miombo in Transition: Woodlands and Welfare in Africa; Center for International Forestry Research: Bogor, Indonesia, 1996; ISBN 9798764072. [Google Scholar]
- Frost, P. The Ecology of Miombo Woodlands. In The Miombo in Transition: Woodlands and Welfare in Africa; Campbell, B., Ed.; Center for International Forestry Research (CIFOR): Jakarta, Indonesia, 1996; pp. 11–57. [Google Scholar]
- Ribeiro, N.; Cumbana, M.; Mamugy, F.; Chaúque, A. Remote Sensing of Biomass in the Miombo Woodlands of Southern Africa: Opportunities and Limitations for Research. In Remote Sensing of Biomass—Principles and Applications; Fatoyinbo, T., Ed.; InTech: Rijeka, Croatia, 2012; pp. 77–98. [Google Scholar]
- White, F. The vegetaion of frica. In Natural Resources Reasearch; UNESCO: Paris, France, 1983. [Google Scholar]
- Syampungani, S.; Chirwa, P.W.; Akinnifesi, F.K.; Sileshi, G.; Ajayi, O.C. The Miombo Woodlands at the Cross Roads: Potential Threats, Sustainable Livelihoods, Policy Gaps and Challenges; Blackwell Publishing Ltd.: Oxford, UK, 2009; Volume 33, pp. 150–159. [Google Scholar]
- Chirwa, P.W.; Larwanou, M.; Syampungani, S.; Folaranmi, B.D. Management and restoration practices in degraded landscapes of Eastern Africa and requirements for up-scaling. Int. For. Rev. 2015, 17, 20–30. [Google Scholar] [CrossRef]
- Kachamba, D.J.; Eid, T.; Gobakken, T. Above- and Belowground Biomass Models for Trees in the Miombo Woodlands of Malawi. Forests 2016, 7, 38. [Google Scholar] [CrossRef]
- Ryan, C.M.; Williams, M.; Grace, J. Above- and Belowground Carbon Stocks in a Miombo Woodland Landscape of Mozambique. Biotropica 2011, 43, 423–432. [Google Scholar] [CrossRef]
- Luoga, E.J.; Witkowski, E.T.F.; Balkwill, K. Harvested and standing wood stocks in protected and communal miombo woodlands of eastern Tanzania. For. Ecol. Manag. 2002, 164, 15–30. [Google Scholar] [CrossRef]
- Mayes, M.T.; Mustard, J.F.; Melillo, J.M. Remote Sensing of Environment Forest cover change in Miombo Woodlands: Modeling land cover of African dry tropical forests with linear spectral mixture analysis. Remote Sens. Environ. 2015, 165, 203–215. [Google Scholar] [CrossRef]
- Halperin, J.; LeMay, V.; Coops, N.; Verchot, L.; Marshall, P.; Lochhead, K. Remote Sensing of Environment Canopy cover estimation in miombo woodlands of Zambia: Comparison of Landsat 8 OLI versus RapidEye imagery using parametric, nonparametric, and semiparametric methods. Remote Sens. Environ. 2016, 179, 170–182. [Google Scholar] [CrossRef]
- Herold, M.; Schiller, F. An Assessment of National Forest Monitoring Capabilities in Tropical Non-Annex I Countries: Recommendations for Capacity Building; Friedrich Schiller University: Jena, Germany, 2009. [Google Scholar]
- Barquín, L.; Chacón, M.; Panfil, S.; Adeleke, A.; Florian, E.; Triraganon, R. The Knowledge and Skills Needed to Engage in REDD+: A Competencies Framework; Conservation International: Arlington, VA, USA, 2014. [Google Scholar]
- Anderson, K.; Gaston, K.J. Lightweight unmanned aerial vehicles will revolutionize spatial ecology. Front. Ecol. Environ. 2013, 11, 115–168. [Google Scholar] [CrossRef]
- Tang, L.; Shao, G. Drone remote sensing for forestry research and practices. J. For. Res. 2015, 26, 791–797. [Google Scholar] [CrossRef]
- Banu, T.P.; Borlea, G.F. The Use of Drones in Forestry. J. Environ. Sci. Eng. 2016, B5, 557–562. [Google Scholar] [CrossRef]
- Eugenio, F.C.; Schons, C.T.; Mallmann, C.L.; Schuh, M.S.; Fernandes, P.; Badin, T.L. Remotely piloted aircraft systems and forests: A global state of the art and future challenges 1. Can. J. For. Res. 2020, 50, 705–716. [Google Scholar] [CrossRef]
- Guimarães, N.; Pádua, L.; Marques, P.; Silva, N.; Peres, E.; Sousa, J.J. Forestry Remote Sensing from Unmanned Aerial Vehicles: A Review Focusing on the Data, Processing and Potentialities. Remote Sens. 2020, 12, 1046. [Google Scholar] [CrossRef]
- Mayr, M.J.; Malß, S.; Ofner, E.; Samimi, C. Disturbance feedbacks on the height of woody vegetation in a savannah: A multi-plot assessment using an unmanned aerial vehicle (UAV). Int. J. Remote Sens. 2018, 39, 4761–4785. [Google Scholar] [CrossRef]
- Eames, T.; Russell-Smith, J.; Yates, C.; Edwards, A.; Vernooij, R.; Ribeiro, N.; Steinbruch, F.; van der Werf, G.R. Instantaneous pre-fire biomass and fuel load measurements from multi-spectral UAS mapping in southern African Savannas. Fire 2021, 4, 2. [Google Scholar] [CrossRef]
- Bossoukpe, M.; Faye, E.; Ndiaye, O.; Diatta, S.; Diatta, O.; Diouf, A.A.; Dendoncker, M.; Assouma, M.H.; Taugourdeau, S. Low-cost drones help measure tree characteristics in the Sahelian savanna. J. Arid. Environ. 2021, 187, 104449. [Google Scholar] [CrossRef]
- Kachamba, D.J.; Ørka, H.O.; Gobakken, T.; Eid, T.; Mwase, W. Biomass estimation using 3D data from unmanned aerial vehicle imagery in a tropical woodland. Remote Sens. 2016, 8, 968. [Google Scholar] [CrossRef]
- Domingo, D.; Ørka, H.O.; Næsset, E.; Kachamba, D.; Gobakken, T. Effects of UAV Image Resolution, Camera Type, and Image Overlap on Accuracy of Biomass Predictions in a Tropical Woodland. Remote Sens. 2019, 11, 948. [Google Scholar] [CrossRef]
- Colomina, I.; Molina, P. Unmanned aerial systems for photogrammetry and remote sensing: A review. ISPRS J. Photogramm. Remote Sens. 2014, 92, 79–97. [Google Scholar] [CrossRef]
- Kachamba, D.J.; Eid, T.; Gobakken, T. Influence of Plot Size on Efficiency of Biomass Estimates in Inventories of Dry Tropical Forests Assisted by Photogrammetric Data from an Unmanned Aircraft System. Remote Sens. 2017, 9, 610. [Google Scholar] [CrossRef]
- Kolarik, N.E.; Gaughan, A.E.; Stevens, F.R.; Pricope, N.G.; Woodward, K.; Cassidy, L.; Salerno, J.; Hartter, J. A multi-plot assessment of vegetation structure using a micro-unmanned aerial system (UAS) in a semi-arid savanna environment. ISPRS J. Photogramm. Remote Sens. 2020, 164, 84–96. [Google Scholar] [CrossRef]
- Hadush, T.; Girma, A.; Zenebe, A. Tree Height Estimation from Unmanned Aerial Vehicle Imagery and Its Sensitivity on Above Ground Biomass Estimation in Dry Afromontane Forest, Northern Ethiopia. Momona Ethiop. J. Sci. 2022, 13, 256–280. [Google Scholar] [CrossRef]
- Bossoukpe, M.; Ndiaye, O.; Diatta, O.; Diatta, S.; Audebert, A.; Couteron, P.; Leroux, L.; Diouf, A.A.; Dendoncker, M.; Faye, E.; et al. Unmanned aerial vehicle for the assessment of woody and herbaceous phytomass in Sahelian savanna. Rev. dElevage Med. Vet. des Pays Trop. 2021, 74, 199–205. [Google Scholar] [CrossRef]
- Lillesand, T.M.; Kiefer, R.W.; Chipma, J.W. Remote Sensing and Image Interpretation, 7th ed.; Wiley: Hoboken, NJ, USA, 2015. [Google Scholar]
- Nebikera, S.; Annena, A.; Scherrerb, M.; Oeschc, D. A Light-Weight Multispectral Sensor for Micro UAV—Opportunities for Very High Resolution Airborne Remote Sensing. In Proceedings of the International Archives of the Photogrammetry, Remote Sensing and Spatial Information Sciences, XXIst ISPRS Congress, Beijing, China, 3–11 July 2008; Volume XXXVII Part B1, pp. 1193–1200. Available online: https://www.isprs.org/proceedings/XXXVII/congress/1_pdf/204.pdf (accessed on 23 September 2022).
- Effiom, A.E.; Van Leeuwen, L.M.; Nyktas, P.; Okojie, J.A.; Erdbrügger, J. Combining unmanned aerial vehicle and multispectral Pleiades data for tree species identification, a prerequisite for accurate carbon estimation. J. Appl. Remote Sens. 2019, 13, 034530. [Google Scholar] [CrossRef]
- Franklin, S.E.; Ahmed, O.S. Deciduous tree species classification using object-based analysis and machine learning with unmanned aerial vehicle multispectral data multispectral data. Int. J. Remote Sens. 2017, 39, 1–10. [Google Scholar] [CrossRef]
- Iglhaut, J.; Cabo, C.; Puliti, S.; Piermattei, L.; O’Connor, J.; Rosette, J. Structure from Motion Photogrammetry in Forestry: A Review. Curr. For. Reports 2019, 5, 155–168. [Google Scholar] [CrossRef]
- Whitehead, K.; Hugenholtz, C.H. Remote Sensing of the Environment with Small Unmanned Aircraft Systems (UASs), Part 1: A review of progress and challenges. J. Unmmaned Veh. Syst. 2014, 2, 69–85. [Google Scholar] [CrossRef]
- Gini, R.; Sona, G.; Ronchetti, G.; Passoni, D.; Pinto, L. Improving Tree Species Classification Using UAS Multispectral Images and Texture Measures. Int. J. Geo-Information 2018, 7, 315. [Google Scholar] [CrossRef]
- Xu, Z.; Shen, X.; Cao, L.; Coops, N.C.; Goodbody, T.R.H.; Zhong, T.; Zhao, W.; Sun, Q.; Ba, S.; Zhang, Z.; et al. Tree species classi fi cation using UAS-based digital aerial photogrammetry point clouds and multispectral imageries in subtropical natural forests. Int. J. Appl. Earth Obs. Geoinf. 2020, 92, 1–14. [Google Scholar] [CrossRef]
- Franklin, S.E. Pixel- and object-based multispectral classification of forest tree species from small unmanned aerial vehicles. J. Unmmaned Veh. Syst. 2017, 6, 195–211. [Google Scholar] [CrossRef]
- Minarik, R.; Langhammer, J. Use of A Multispectral UAV Photogrammetry for Detection and Tracking of Forest Disturbance Dynamics. Int. Arch. Photogramm. Remote Sens. Spatial Inf. Sci. 2019, XLII-2-W17, 209–215. [Google Scholar] [CrossRef]
- Dash, J.P.; Watt, M.S.; Pearse, G.D.; Heaphy, M.; Dungey, H.S. ISPRS Journal of Photogrammetry and Remote Sensing Assessing very high resolution UAV imagery for monitoring forest health during a simulated disease outbreak. ISPRS J. Photogramm. Remote Sens. 2017, 131, 1–14. [Google Scholar] [CrossRef]
- Czapski, P.; Kacprzak, M.; Kotlarz, J.; Mrowiec, K.; Kubiak, K.; Tkaczyk, M. Preliminary analysis of the forest health state based on multispectral images acquired by Unmanned Aerial Vehicle. Folia For. Pol. Ser. A 2015, 57, 138–144. [Google Scholar] [CrossRef]
- Bannari, A.; Morin, D.; Bonn, F.; Huete, A.R. A review of vegetation indices. A Rev. Veg. Indices 1995, 13, 95–120. [Google Scholar] [CrossRef]
- Xue, J.; Su, B. Significant Remote Sensing Vegetation Indices: A Review of Developments and Applications. J. Sens. 2017, 2017, 1–17. [Google Scholar] [CrossRef]
- Gini, R.; Passoni, D.; Pinto, L.; Sona, G. Use of Unmanned Aerial Systems for multispectral survey and tree classification: A test in a park area of northern Italy multispectral survey and tree classification. Eur. J. Remote Sens. 2014, 47, 251–269. [Google Scholar] [CrossRef]
- Ahmed, O.S.; Shemrock, A.; Chabot, D.; Dillon, C.; Wasson, R.; Franklin, S.E.; Ahmed, O.S.; Shemrock, A.; Chabot, D.; Dillon, C.; et al. Hierarchical land cover and vegetation classification using multispectral data acquired from an unmanned aerial vehicle. Int. J. Remote Sens. 2017, 38, 2037–2052. [Google Scholar] [CrossRef]
- Adão, T.; Hruška, J.; Pádua, L.; Bessa, J.; Peres, E.; Morais, R.; Sousa, J.J. Hyperspectral Imaging: A Review on UAV-Based Sensors, Data Processing and Applications for Agriculture and Forestry. Remote Sens. 2017, 9, 1110. [Google Scholar] [CrossRef]
- Naidoo, L.; Cho, M.A.; Mathieu, R.; Asner, G. Classification of savanna tree species, in the Greater Kruger National Park region, by integrating hyperspectral and LiDAR data in a Random Forest data mining environment. ISPRS J. Photogramm. Remote Sens. 2012, 69, 167–179. [Google Scholar] [CrossRef]
- Fassnacht, F.E.; Neumann, C.; Förster, M.; Buddenbaum, H.; Ghosh, A.; Clasen, A.; Joshi, P.K.; Koch, B. Comparison of Feature Reduction Algorithms for Classifying Tree Species With Hyperspectral Data on Three Central European Test Sites. IEEE J. Sel. Top. Appl. EARTH Obs. Remote Sens. 2014, 7, 2547–2561. [Google Scholar] [CrossRef]
- Fung, T.; Fung, H.; Ma, Y.; Siu, W.L. Band Selection Using Hyperspectral Data of Subtropical Tree Species Band Selection Using Hyperspectral Data of Subtropical Tree Species. Geocarto Int. 2008, 18, 3–11. [Google Scholar] [CrossRef]
- Yao, H.; Qin, R.; Chen, X. Unmanned Aerial Vehicle for Remote Sensing Applications—A Review. Remote Sens. 2019, 11, 1443. [Google Scholar] [CrossRef]
- Merino, L.; Caballero, F.; Martínez-de-dios, J.R.; Maza, I.; Ollero, A. An Unmanned Aircraft System for Automatic Forest Fire Monitoring and Measurement. J. Intell. Robot. Syst. 2012, 65, 533–548. [Google Scholar] [CrossRef]
- Hristov, G.; Raychev, J.; Kinaneva, D.; Zahariev, P. Emerging Methods for Early Detection of Forest Fires Using Unmanned Aerial Vehicles and Lorawan Sensor Networks. In Proceedings of the 28th EAEEIE Annual Conference, Reykjavik, Iceland, 26–28 September 2018; IEEE: Reykjavik, Iceland, 2018; pp. 1–9. [Google Scholar]
- Smigaj, M.; Gaulton, R.; Barr, S.L.; Suárez, J.C. Uav-Borne Thermal Imaging for Forest Health Monitoring: Detection of Disease-Induced Canopy Temperature Increase. Int. Arch. Photogramm. Remote Sens. Spatial Inf. Sci. 2015, XL-3/W3, 349–354. [Google Scholar] [CrossRef]
- Witczuk, J.; Pagacz, S.; Zmarz, A.; Cypel, M.; Witczuk, J. Exploring the feasibility of unmanned aerial vehicles and thermal imaging for ungulate surveys in forests—preliminary results. Int. J. Remote Sens. 2017, 39, 1–18. [Google Scholar] [CrossRef]
- Pádua, L.; Vanko, J.; Hruška, J.; Adão, T.; Sousa, J.J.; Peres, E.; Morais, R. UAS, sensors, and data processing in agroforestry: A review towards practical applications. Int. J. Remote Sens. 2017, 38, 1–43. [Google Scholar] [CrossRef]
- Popescu, S.c.; Hauglin, M. Estimation of Biomass Components by Airborne Laser Scanning. In Forest Application of Airborne Laser Scanning: Concepts and Case Studies, Managing Forest Ecosystems; Maltamo, M., Naesset, E., Vauhkonen, J., Eds.; Springer Nature: Cham, Switzerland, 2014; pp. 157–175. [Google Scholar]
- Naesset, E. Estimating timber volume of forests stands using laser scanner data. Remote Sens. Environ. 1997, 67, 246–253. [Google Scholar] [CrossRef]
- Magnussen, S.; Boudewyn, P. Derivations of stand heights from airborne laser scanner data with canopy-based quantile estimators. Can. J. For. Res. 1998, 28, 1016–1031. [Google Scholar] [CrossRef]
- Reutebuch, S.E.; Mcgaughey, R.J.; Andersen, H.; Carson, W.W. Accuracy of a high-resolution lidar terrain model under a conifer forest canopy. Can. J. Remote Sens. 2003, 29, 527–535. [Google Scholar] [CrossRef]
- Chisholm, R.A.; Cui, J.; Lum, S.K.Y.; Chen, B.M. UAV LiDAR for below-canopy forest surveys. J. Unmmaned Veh. Syst. 2013, 68, 61–68. [Google Scholar] [CrossRef]
- Kuželka, K.; Slavík, M.; Surový, P. Very High Density Point Clouds from UAV Laser Scanning for Automatic Tree Stem Detection and Direct Diameter Measurement. Remote Sens. 2020, 12, 1236. [Google Scholar] [CrossRef]
- Wallace, L.; Lucieer, A.; Watson, C.S. Evaluating Tree Detection and Segmentation Routines on Very High Resolution UAV LiDAR Data. IEEE Trans. Geosci. Remote Sens. 2014, 52, 7619–7628. [Google Scholar] [CrossRef]
- Wallace, L.; Lucieer, A.; Malenovskỳ, Z.; Turner, D.; Vopěnka, P. Assessment of forest structure using two UAV techniques: A comparison of airborne laser scanning and structure from motion (SfM) point clouds. Forests 2016, 7, 62. [Google Scholar] [CrossRef]
- Cao, L.; Liu, H.; Fu, X.; Zhang, Z.; Shen, X.; Ruan, H. Comparison of UAV LiDAR and Digital Aerial Photogrammetry Point Clouds for Estimating Forest Structural Attributes in Subtropical Planted Forests. Forests 2019, 10, 145. [Google Scholar] [CrossRef]
- White, J.C.; Wulder, M.A.; Vastaranta, M.; Coops, N.C.; Pitt, D.; Woods, M. The Utility of Image-Based Point Clouds for Forest Inventory: A Comparison with Airborne Laser Scanning. Forests 2013, 4, 518–536. [Google Scholar] [CrossRef]
- Lin, Y.; Hyyppä, J.; Jaakkola, A. Min-UAV-Borne LIDAR for fine-scale Mapping. IEEE Geosci. Remote Sens. 2011, 8, 426–430. [Google Scholar] [CrossRef]
- Wallace, L.; Lucieer, A.; Watson, C.; Turner, D. Development of a UAV-LiDAR system with application to forest inventory. Remote Sens. 2012, 4, 1519–1543. [Google Scholar] [CrossRef]
- Jia, Y.; Su, Z.; Zhang, Q.; Zhang, Y.; Gu, Y.; Chen, Z. Research on UAV Remote Sensing Image Mosaic Method Based on SIFT. Int. J. Signal Process. Image Process. Pattern Recognit. 2015, 8, 365–374. [Google Scholar] [CrossRef]
- Wallace, L.O.; Lucieer, A.; Watson, C.S. Assessing the Feasibility of UAV-Based Lidar for High Resolution Forest Change Detection. Int. Arch. Photogramm. Remote Sens. Spatial Inf. Sci. 2012, XXXIX-B7, 499–504. [Google Scholar] [CrossRef]
- Dandois, J.P.; Ellis, E.C. Remote Sensing of Vegetation Structure Using Computer Vision. Remote Sens. 2010, 2, 1157–1176. [Google Scholar] [CrossRef]
- Tomaštík, J.; Mokroš, M.; Surový, P.; Grznárová, A.; Merganiˇ, J. UAV RTK/PPK Method—An Optimal Solution for Mapping Inaccessible Forested Areas? Remote Sens. 2019, 11, 721. [Google Scholar] [CrossRef]
- Xu, Z.; Ruan, H. Estimation of secondary forest parameters by integrating image and point cloud-based metrics acquired from unmanned aerial vehicle. J. Appl. Remote Sens. 2020, 14, 022204. [Google Scholar] [CrossRef]
- Snavely, N.; Seitz, S.M.; Szeliski, R. Modeling the World from Internet Photo Collections. Int. J. Comput. Vis. 2007, 6, 245–255. [Google Scholar] [CrossRef]
- Westoby, M.J.; Brasington, J.; Glasser, N.F.; Hambrey, M.J.; Reynolds, J.M. “Structure-from-Motion” photogrammetry: A low-cost, effective tool for geoscience applications. Geomorphology 2012, 179, 300–314. [Google Scholar] [CrossRef]
- Kraus, K.; Pfeifer, N. Determination of terrain models in wooded areas with airborne laser scanner data. ISPRS J. Photogramm. Remote Sens. 1998, 53, 193–203. [Google Scholar] [CrossRef]
- Yu, X.; Hyyppä, J.; Holopainen, M.; Vastaranta, M. Comparison of Area-Based and Individual Tree-Based Methods for Predicting Plot-Level Forest Attributes. Remote Sens. 2010, 2, 1481–1495. [Google Scholar] [CrossRef]
- Chen, Q. LiDAR Remote Sensing Of Vegetation Biomass. In Remote Sensing of Natural Resources; CRC Press: Boca Raton, FL, USA, 2013; pp. 399–420. [Google Scholar] [CrossRef]
- Means, J.E.; Acker, S.A.; Fitt, B.J.; Renslow, M.; Emerson, L.; Hendrix, C.J. Predicting Forest Stand Characteristics with Airborne Scanning Lidar. Photogramm. Eng. Remote Sens. 2000, 66, 1367–1371. [Google Scholar]
- Naesset, E.; Gobakken, T.; Holmgren, J.; Maltamo, M. Laser scanning of forest resources: The Nordic experience Laser Scanning of Forest Resources: The Nordic Experience. Scand. J. For. Res. 2004, 19, 482–499. [Google Scholar] [CrossRef]
- Hudak, A.T.; Crookston, N.L.; Evans, J.S.; Hall, D.E.; Falkowski, M.J. Nearest neighbor imputation of species-level, plot-scale forest structure attributes from LiDAR data. Remote Sens. Environ. 2008, 112, 2232–2245. [Google Scholar] [CrossRef]
- Maltamo, M.; Naesset, E.; Vauhkonen, J. Forestry Applications of Airborne Laser Scanning; Springer: Dordrecht, The Netherlands, 2014; Volume 27. [Google Scholar]
- Cao, L.; Zhang, Z.; Yun, T.; Wang, G.; Ruan, H.; She, G. Estimating Tree Volume Distributions in Subtropical Forests Using Airborne LiDAR Data. Remote Sens. 2019, 11, 97. [Google Scholar] [CrossRef]
- Mohan, M.; Silva, C.A.; Klauberg, C.; Jat, P.; Catts, G.; Hudak, A.T.; Dia, M. Individual Tree Detection from Unmanned Aerial Vehicle ( UAV ) Derived Canopy Height Model in an Open Canopy Mixed Conifer Forest. Forestry 2017, 8, 340. [Google Scholar] [CrossRef]
- Vastaranta, M.; Holopainen, M.; Yu, X.; Haapanen, R.; Melkas, T.; Hyyppä, J.; Hyyppä, H. Individual tree detection and area-based approach in retrieval of forest inventory characteristics from low-pulse airborne laser scanning data. Photogramm. J. Finl. 2011, 22, 1–13. [Google Scholar]
- Guerra-hernández, J.; Cosenza, D.N.; Carlos, L.; Rodriguez, E.; Silva, M.; Tomé, M.; Díaz-varela, R.A.; Cosenza, D.N.; Carlos, L.; Rodriguez, E.; et al. Comparison of ALS and UAV (SfM) derived high density point clouds for individual tree detection in Eucalyptus plantations. Int. J. Remote Sens. 2018, 39, 5211–5235. [Google Scholar] [CrossRef]
- Feng, X.; Li, P. A Tree Species Mapping Method from UAV Images over Urban Area Using Similarity in Tree Crown Object Histograms. Remote Sens. 2019, 11, 982. [Google Scholar] [CrossRef]
- Singh, M.; Evans, D.; Tan, B.S.; Nin, C.S. Mapping and Characterizing Selected Canopy Tree Species at the Angkor World Heritage Site in Cambodia Using Aerial Data. PLoS ONE 2015, 10, 1–26. [Google Scholar] [CrossRef] [PubMed]
- Whitehead, K.; Hugenholtz, C.H.; Myshak, S.; Brown, O.; Leclair, A.; Tamminga, A.; Barchyn, T.E.; Moorman, B.; Eaton, B. Remote sensing of the environment with small unmanned aircraft systems (UASs), part 2: Scientific and commercial applications 1. J. Unmmaned Veh. Syst. 2014, 102, 86–102. [Google Scholar] [CrossRef]
- Gomes, M.F.; Maillard, P. Detection of Tree Crowns in Very High Spatial Resolution Images. Environ. Appl. Remote Sens. 2016, 41–71. [Google Scholar] [CrossRef]
- Blaschke, T. Object based image analysis for remote sensing. ISPRS J. Photogramm. Remote Sens. 2010, 65, 2–16. [Google Scholar] [CrossRef]
- Pal, N.R.; Pal, S.K. A review on image segmentation techniques. Parttern Recognit. 1993, 26, 1277–1294. [Google Scholar] [CrossRef]
- Costa, H.; Foody, G.M.; Boyd, D.S. Supervised methods of image segmentation accuracy assessment in land cover mapping. Remote Sens. Environ. 2017, 205, 338–351. [Google Scholar] [CrossRef]
- Hossain, M.D.; Chen, D. Segmentation for Object-Based Image Analysis ( OBIA ): A review of algorithms and challenges from remote sensing perspective. ISPRS J. Photogramm. Remote Sens. 2019, 150, 115–134. [Google Scholar] [CrossRef]
- Mishra, N.B.; Mainali, K.P.; Shrestha, B.B.; Radenz, J.; Karki, D. Species-level Vegetation Mapping in a Himalayan Treeline Ecotone using Species-Level Vegetation Mapping in a Himalayan Treeline Ecotone Using Unmanned Aerial System (UAS) Imagery. ISPRS Int. J. Geo-Inf. 2018, 7, 445. [Google Scholar] [CrossRef]
- Zhang, X.; Zhang, F.; Qi, Y.; Deng, L.; Wang, X. New research methods for vegetation information extraction based on visible light remote sensing images from an unmanned aerial vehicle (UAV). Int. J. Appl. Earth Obs. Geoinf. 2019, 78, 215–226. [Google Scholar] [CrossRef]
- Agapiou, A. Vegetation Extraction Using Visible-Bands from Openly Licensed Unmanned Aerial Vehicle Imagery. Drones 2020, 4, 27. [Google Scholar] [CrossRef]
- Guo, Q.; Su, Y.; Hu, T.; Zhao, X.; Wu, F.; Li, Y.; Liu, J.; Chen, L.; Xu, G.; Lin, G.; et al. An integrated UAV-borne lidar system for 3D habitat mapping in three forest ecosystems across China An integrated UAV-borne lidar system for 3D habitat mapping in three forest ecosystems across China. Int. J. Remote Sens. 2017, 38, 2954–2972. [Google Scholar] [CrossRef]
- Shin, J.; Seo, W.; Kim, T.; Park, J.; Woo, C. Using UAV Multispectral Images for Classification of Forest Burn Severity—A Case Study of the 2019 Gangneung Forest Fire. Forests 2019, 10, 1025. [Google Scholar] [CrossRef]
- Rossi, F.C.; Fritz, A.; Becker, G. Combining Satellite and UAV Imagery to Delineate Forest Cover and Basal Area after Mixed-Severity Fires. Sustainability 2018, 10, 2227. [Google Scholar] [CrossRef]
- Getzin, S.; Nuske, R.S.; Wiegand, K. Using Unmanned Aerial Vehicles (UAV) to Quantify Spatial Gap Patterns in Forests. Remote Sens. 2014, 6, 6988–7004. [Google Scholar] [CrossRef]
- Fischer, R.; Bohn, F.; Dantas, M.; Paula, D.; Dislich, C.; Groeneveld, J.; Gutiérrez, A.G.; Kazmierczak, M.; Knapp, N.; Lehmann, S.; et al. Lessons learned from applying a forest gap model to understand ecosystem and carbon dynamics of complex tropical forests. Ecol. Modell. 2016, 326, 124–133. [Google Scholar] [CrossRef]
- Torresan, C.; Berton, A.; Carotenuto, F.; Di, S.F.; Gioli, B.; Matese, A.; Miglietta, F.; Zaldei, A.; Wallace, L.; Torresan, C.; et al. Forestry applications of UAVs in Europe: A review. Int. J. Remote Sens. 2017, 38, 2427–2447. [Google Scholar] [CrossRef]
- Dandois, J.P.; Ellis, E.C. High spatial resolution three-dimensional mapping of vegetation spectral dynamics using computer vision. Remote Sens. Environ. 2013, 136, 259–276. [Google Scholar] [CrossRef]
- Ota, T.; Ahmed, O.S.; Thu, S.; Cin, T.; Mizoue, N. Forest Ecology and Management Estimating selective logging impacts on aboveground biomass in tropical forests using digital aerial photography obtained before and after a logging event from an unmanned aerial vehicle. For. Ecol. Manag. 2019, 433, 162–169. [Google Scholar] [CrossRef]
- Giannetti, F.; Chirici, G.; Gobakken, T.; Næsset, E.; Travaglini, D.; Puliti, S. Remote Sensing of Environment A new approach with DTM-independent metrics for forest growing stock prediction using UAV photogrammetric data. Remote Sens. Environ. 2018, 213, 195–205. [Google Scholar] [CrossRef]
- Jayathunga, S.; Owari, T.; Tsuyuki, S. The use of fixed-wing UAV photogrammetry with LiDAR DTM to estimate merchantable volume and carbon stock in living biomass over a mixed conifer-broadleaf forest. Int. J. Appl. Earth. Obs. Geoinf. 2018, 73, 767–777. [Google Scholar] [CrossRef]
- Zahawi, R.A.; Dandois, J.P.; Holl, K.D.; Nadwodny, D.; Reid, J.L.; Ellis, E.C. Using lightweight unmanned aerial vehicles to monitor tropical forest recovery. Biol. Conserv. 2015, 186, 287–295. [Google Scholar] [CrossRef]
- Otero, V.; Van De Kerchove, R.; Satyanarayana, B.; Martínez-espinosa, C.; Amir, M.; Fisol, B.; Rodila, M.; Ibrahim, B.; Sulong, I.; Mohd-lokman, H.; et al. Managing mangrove forests from the sky: Forest inventory using field data and Unmanned Aerial Vehicle (UAV) imagery in the Matang Mangrove Forest Reserve, peninsular Malaysia. In Forest Ecology and Management; Elsevier: London, UK, 2018; Volume 411, pp. 35–45. [Google Scholar]
- Zhang, J.; Hu, J.; Lian, J.; Fan, Z.; Ouyang, X.; Ye, W. Seeing the forest from drones: Testing the potential of lightweight drones as a tool for long-term forest monitoring Seeing the forest from drones: Testing the potential of lightweight drones as a tool for long-term forest monitoring. BIOC 2017, 198, 60–69. [Google Scholar] [CrossRef]
- Jaakkola, A.; Hyyppä, J.; Kukko, A.; Yu, X.; Kaartinen, H.; Lehtomaki, M.; Lin, Y. A low-cost multi-sensor mobile mapping system and its feasibility for tree measurements. ISPRS J. Photogramm. Remote Sens. 2010, 65, 514–522. [Google Scholar] [CrossRef]
- Torres, F.M.; Garcia, A.M. Article A Lightweight UAV-Based Laser Scanning System For Forest Application. Bull. Geod. Sci. 2018, 24, 318–334. [Google Scholar]
- Dainelli, R.; Toscano, P.; Filippo, S.; Gennaro, D.; Matese, A. Recent Advances in Unmanned Aerial Vehicle Forest Remote Sensing — A Systematic Review. Part I: A General Framework. Forests 2021, 12, 327. [Google Scholar] [CrossRef]
- Mlambo, R.; Woodhouse, I.H.; Gerard, F.; Anderson, K. Structure from Motion (SfM) Photogrammetry with Drone Data: A Low Cost Structure from Motion (SfM) Photogrammetry with Drone Data: A Low Cost Method for Monitoring Greenhouse Gas Emissions from Forests in Developing Countries. Forests 2017, 8, 68. [Google Scholar] [CrossRef]
- Simpson, J.E.; Smith, T.E.L.; Wooster, M.J. Assessment of Errors Caused by Forest Vegetation Structure in Airborne LiDAR-Derived DTMs. Remote Sens. 2017, 9, 1101. [Google Scholar] [CrossRef]
- Bigdeli, B.; Amirkolaee, A.H.; Pahlavani, P. DTM extraction under forest canopy using LiDAR data and a modified invasive weed optimization algorithm. Remote Sens. Environ. 2018, 216, 289–300. [Google Scholar] [CrossRef]
- Goetz, S.J.; Hansen, M.; Houghton, R.A.; Walker, W.; Laporte, N.; Busch, J. Measurement and monitoring needs, capabilities and potential for addressing reduced emissions from deforestation and forest degradation under REDD+. Environ. Res. Lett. 2015, 10, 123001. [Google Scholar] [CrossRef]
- Day, M.; Gumbo, D.; Moombe, K.B.; Wijaya, A.; Sunderland, T. Zambia Country Profile: Monitoring, Reporting and Verification for REDD +; CIFOR: Bogor, Indonesia, 2014. [Google Scholar]
- Park, J.Y.; Muller-landau, H.C.; Lichstein, J.W.; Rifai, S.W.; Dandois, J.P.; Bohlman, S.A. Quantifying Leaf Phenology of Individual Trees and Species in a Tropical Forest Using Unmanned Aerial Vehicle (UAV) Images. Remote Sens. 2019, 11, 1534. [Google Scholar] [CrossRef]
- Lisein, J.; Michez, A.; Claessens, H.; Lejeune, P. Discrimination of Deciduous Tree Species from Time Series of Unmanned Aerial System Imagery. PLoS ONE 2015, 10, e0141006. [Google Scholar] [CrossRef] [PubMed]
- Sedano, F.; Lisboa, S.; Duncanson, L.; Ribeiro, N.; Sitoe, A.; Sahajpal, R.; Hurtt, G.; Tucker, C. Monitoring intra and inter annual dynamics of forest degradation from charcoal production in Southern Africa with Sentinel—2 imagery. Int. J. Appl. Earth Obs. Geoinf. 2020, 92, 102184. [Google Scholar] [CrossRef]
- Hosonuma, N.; Herold, M.; De Sy, V.; De Fries, R.S.; Brockhaus, M.; Verchot, L.; Angelsen, A.; Romijn, E. An assessment of deforestation and forest degradation drivers in developing countries. Environ. Res. Lett. 2012, 7, 1–12. [Google Scholar] [CrossRef]
- Romijn, E.; Herold, M.; Kooistra, L.; Murdiyarso, D.; Verchot, L. Assessing capacities of non-Annex I countries for national forest monitoring in the context of REDD +. Environ. Sci. Policy 2012, 19–20, 33–48. [Google Scholar] [CrossRef]
- Mitchell, A.L.; Rosenqvist, A.; Mora, B. Current remote sensing approaches to monitoring forest degradation in support of countries measurement, reporting and verification (MRV) systems for REDD+. Carbon Balance Manag. 2017, 12, 1–22. [Google Scholar] [CrossRef]
- Thiel, C.; Müller, M.M.; Berger, C.; Cremer, F.; Hese, S.; Baade, J.; Klan, F.; Pathe, C. Monitoring Selective Logging in a Pine-Dominated Forest in Central Germany with Repeated Drone Flights Utilizing A Low Cost RTK Quadcopter. Drones 2020, 4, 11. [Google Scholar] [CrossRef]
- Samiappan, S.; Turnage, G.; Mccraine, C.; Skidmore, J.; Hathcock, L.; Moorhead, R. Post-Logging Estimation of Loblolly Pine (Pinus taeda) Stump Size, Area and Population Using Imagery from a Small Unmanned Aerial System. Drones 2017, 1, 4. [Google Scholar] [CrossRef]
- Puliti, S. Tree-Stump Detection, Segmentation, Classification, and Measurement Using Unmanned Aerial Vehicle (UAV) Imagery. Forests 2018, 9, 102. [Google Scholar] [CrossRef]
- Fraser, R.H.; Van Der Sluijs, J.; Hall, R.J. Calibrating Satellite-Based Indices of Burn Severity from UAV-Derived Metrics of a Burned Boreal Forest. Remote Sens. 2017, 9, 279. [Google Scholar] [CrossRef]
- Mckenna, P.; Erskine, P.D.; Lechner, A.M.; Phinn, S. Measuring fire severity using UAV imagery in semi arid central Queensland, Australia. Int. J. Remote Sens. 2017, 38, 4244–4264. [Google Scholar] [CrossRef]
- Ribeiro, N.S.; de Miranda, P.L.S.; Timberlake, J. Biogeography and Ecology of Miombo Woodlands. In Miombo Woodlands in a Changing Environment: Securing the Resilience and Sustainability of People and Woodlands; Ribeiro, N.S., Yemi, K., Chirwa, P.W., Grundy, I.M., Eds.; Springer: Cham, Switzerland, 2020; pp. 9–53. [Google Scholar]
- Fernández-Álvarez, M.; Armesto, J.; Picos, J. LiDAR-Based Wildfire Prevention in WUI: The Automatic Detection, Measurement and Evaluation of Forest Fuels. Forests 2019, 10, 148. [Google Scholar] [CrossRef]
- Barber, N.; Alvarado, E.; Kane, V.R.; Mell, W.E.; Moskal, L.M. Estimating Fuel Moisture in Grasslands Using UAV-Mounted Infrared and Visible Light Sensors. Sensors 2021, 12, 6350. [Google Scholar] [CrossRef] [PubMed]
- Shin, P.; Sankey, T.; Moore, M.M.; Thode, A.E. Evaluating Unmanned Aerial Vehicle Images for Estimating Forest Canopy Fuels in a Ponderosa Pine Stand. Remote Sens. 2018, 10, 1266. [Google Scholar] [CrossRef]
- Valero, M.M.; Rios, O.; Mata, C.; Pastor, E.; Planas, E. An integrated approach for tactical monitoring and data-driven spread forecasting of wild fires. Fire Saf. J. 2017, 91, 835–844. [Google Scholar] [CrossRef]
- Ribeiro, N.S.; de Miranda, P.L.S.; Timberlake, J. Miombo Woodlands in a Changing Environment: Securing the Resilience and Sustainability of People and Woodlands. In Miombo Woodlands in a Changing Sustainability of People the Resilience and Environment: Securing and Woodlands; Ribeiro, N.S., Katerere, Y., Chirwa, P.W., Grundy, I.M., Eds.; Springer Nature: Cham, Switzerland, 2020; Volume 38, pp. 188–189. [Google Scholar]
- Hempson, G.P.; Archibald, S.; Bond, W.J. A continent-wide assessment of the form and intensity of large mammal herbivory in Africa. Science 2015, 350, 1056–1061. [Google Scholar] [CrossRef]
- Thomson, P.J. The role of elephants, fire and other agents in the decline of a Brachystegia boehmii woodland. J. South. African Wildl. Manag. Assoc. 1975, 5, 11–18. [Google Scholar]
- Guy, P.R. Changes in the Biomass and Productivity of Woodlands in the Sengwa Wildlife Research Area, Zimbabwe. J. Appl. Ecol. 1981, 18, 507–519. [Google Scholar] [CrossRef]
- Ribeiro, N.S.; Shugart, H.H.; Washington-Allen, R. The effects of fire and elephants on species composition and structure of the Niassa Reserve, northern Mozambique. For. Ecol. Manag. 2008, 255, 1626–1636. [Google Scholar] [CrossRef]
- Dublin, H.T.; Sinclair, A.R.E.; McGlade, J. Elephants and Fire as Causes of Multiple Stable States in the Serengeti-Mara Woodlands. J. Anim. Ecol. 1990, 59, 1147. [Google Scholar] [CrossRef]
- Yang, F.; Shao, Q.; Jiang, Z. A population census of large herbivores based on UAV and its effects on grazing pressure in the yellow-river-source national park, China. Int. J. Environ. Res. Public Health 2019, 16, 4402. [Google Scholar] [CrossRef] [PubMed]
- Levick, S.R.; Asner, G.P.; Kennedy-Bowdoin, T.; Knapp, D.E. The relative influence of fire and herbivory on savanna three-dimensional vegetation structure. Biol. Conserv. 2009, 142, 1693–1700. [Google Scholar] [CrossRef]
- Siewert, M.B.; Olofsson, J. UAV reveals substantial but heterogeneous effects of herbivores on Arctic vegetation. Sci. Rep. 2021, 11, 19468. [Google Scholar] [CrossRef]
- Aubry, P.; Debouzie, D. Estimation of the mean from a two-dimensional sample: The geostatistical model-based approach. Ecology 2001, 82, 1484–1494. [Google Scholar] [CrossRef]
- Chidumayo, E.N. Forest degradation and recovery in a miombo woodland landscape in Zambia: 22 years of observations on permanent sample plots. For. Ecol. Manage. 2013, 291, 154–161. [Google Scholar] [CrossRef]
- Handavu, F.; Syampungani, S.; Sileshi, G.W.; Chirwa, P.W.C. Aboveground and belowground tree biomass and carbon stocks in the miombo woodlands of the Copperbelt in Zambia. Carbon Manag. 2021, 12, 307–321. [Google Scholar] [CrossRef]
- Mugasha, W.; Eid, T.; Bollandsås, O.M.; Malimbwi, R.E.; Chamshama, S.A.; Zahabu, E.; Katani, J.Z. Allometric models for prediction of aboveground biomass of single trees in miombo woodlands in Tanzania. In Proceedings of the First Climate Change Impacts, Mitigation and Adaptation Programme Scientific Conference, Doha, Qatar, 26 November–8 December 2012; pp. 8–17. [Google Scholar]
- Sedano, F.; Gong, P.; Ferra, M. Land cover assessment with MODIS imagery in southern African Miombo ecosystems. Remote Sens. Environ. 2005, 98, 429–441. [Google Scholar] [CrossRef]
- Cabral, A.I.R.; Vasconcelos, M.J.; Oom, D.; Sardinha, R. Spatial dynamics and quanti fi cation of deforestation in the central-plateau woodlands of Angola (1990–2009). Appl. Geogr. 2010, 31, 1185–1193. [Google Scholar] [CrossRef]
- Sedano, F.; Lisboa, S.N.; Duncanson, L.; Ribeiro, N.; Sitoe, A.; Sahajpal, R.; Hurtt, G. Monitoring forest degradation from charcoal production with historical Landsat imagery. A case study in southern Mozambique. Environ. Res. Lett. 2020, 15, 015001. [Google Scholar] [CrossRef]
- GOFC-GOLD. A Sourcebook of Methods and Procedures for Monitoring and Reporting Anthropogenic Greenhouse Gas Emissions and Removals Associated with Deforestation, Gains and Losses of Carbon Stocks in Forests Remaining Forests, and Forestation; GOFC-GOLD Project Office: Tbilisi, Georgia, 2016. [Google Scholar]
- Chidumayo, E.N.; Gumbo, D.J. The environmental impacts of charcoal production in tropical ecosystems of the world: A synthesis. Energy Sustain. Dev. 2013, 17, 86–94. [Google Scholar] [CrossRef]
- Stöcker, C.; Bennett, R.; Nex, F.; Gerke, M.; Zevenbergen, J. Review of the Current State of UAV Regulations. Remote Sens. 2017, 9, 459. [Google Scholar] [CrossRef]
- Duffy, J.P.; Cunliffe, A.M.; Debell, L.; Sandbrook, C.; Wich, S.A.; Shutler, J.D.; Myers-smith, I.H.; Varela, M.R.; Anderson, K. Location, location, location: Considerations when using lightweight drones in challenging environments. Remote Sens. Ecol. Conserv. 2017, 4, 7–19. [Google Scholar] [CrossRef]
- Global Drone Regulations Database. 2014. Available online: https://droneregulations.info/index.html (accessed on 11 December 2020).
- Rango, A.; Laliberte, A.S. Impact of flight regulations on effective use of unmanned aircraft systems for natural resources applications. J. Appl. Remote Sens. 2010, 4, 1–12. [Google Scholar] [CrossRef]
- Cromwell, C.; Giampaolo, J.; Hupy, J.; Miller, Z.; Chandrasekaran, A. A systematic review of best practices for UAS data collection in forestry-related applications. Forests 2021, 12, 957. [Google Scholar] [CrossRef]
- Alonzo, M.; Andersen, H.E.; Morton, D.C.; Cook, B.D. Quantifying boreal forest structure and composition using UAV structure from motion. Forests 2018, 9, 119. [Google Scholar] [CrossRef]
- ClimaCell. Why Drone Can’t Use Regular Weather Forecasts. Available online: https://www.tomorrow.io/blog/why-%0Adrones-cant-use-regular-weather-forecasts (accessed on 12 August 2022).
- Cessna, J.; Alonzo, M.G.; Foster, A.C.; Cook, B.D. Mapping boreal forest spruce beetle health status at the individual crown scale using fused spectral and structural data. Forests 2021, 12, 1145. [Google Scholar] [CrossRef]
- Weatheronline. Historical Wether Data. Available online: https://www.woeurope.eu/ (accessed on 18 August 2022).
- Doughty, C.L.; Cavanaugh, K.C. Mapping coastal wetland biomass from high resolution unmanned aerial vehicle (UAV) imagery. Remote Sens. 2019, 11, 540. [Google Scholar] [CrossRef]
- Dandois, J.P.; Olano, M.; Ellis, E.C. Optimal altitude, overlap, and weather conditions for computer vision UAV estimates of forest structure. Remote Sens. 2015, 7, 13895–13920. [Google Scholar] [CrossRef]
- Poley, L.G.; McDermid, G.J. A Systematic Review of the Factors Influencing the Estimation of Vegetation Aboveground Biomass Using Unmanned Aerial Systems. Remote Sens. 2020, 12, 1052. [Google Scholar] [CrossRef]
- Kelcey, J.; Lucieer, A. An Adaptive Texture Selection Framework For Ultra-High Resolution Uav Imagery. In Proceedings of the IEEE International Geoscience and Remote Sensing Symposium (IGARSS), Melbourne, Australia, 21–26 July 2013; pp. 3884–3886. [Google Scholar]
- Hardin, P.J.; Lulla, V.; Jensen, R.R. Small Unmanned Aerial Systems (sUAS) for environmental remote sensing: Challenges and opportunities revisited. GIScience Remote Sens. 2018, 56, 1–14. [Google Scholar] [CrossRef]
- Liu, T.; Abd-Elrahman, A.; Morton, J.; Wilhelm, V.L. Comparing fully convolutional networks, random forest, support vector machine, and patch-based deep convolutional neural networks for object-based wetland mapping using images from small unmanned aircraft system. GIScience Remote Sens. 2018, 55, 243–264. [Google Scholar] [CrossRef]
- Agisoft LLC. Agisoft Metashape User Manual. St. Petersburg, Russia. 2019. Available online: www.agisoft.com (accessed on 21 July 2021).
- Lisein, J.; Pierrot-Deseilligny, M.; Bonnet, S.; Lejeune, P. A Photogrammetric Workflow for the Creation of a Forest Canopy Height Model from Small Unmanned Aerial System Imagery. Forests 2013, 4, 922–944. [Google Scholar] [CrossRef]
- Korhonen, L.; Morsdorf, F. Estimation of Canopy Cover, Gap Fraction and Leaf Area Index with Airborne Laser. In Forest Applications of Airborne Laser Scanning: Concepts and Case Studies; Maltamo, M., Naesset, E., Vauhkonen, J., Eds.; Springer: Dordrecht, The Netherlands, 2014; pp. 397–417. [Google Scholar]
- Aguilar, F.J.; Rivas, J.R.; Nemmaoui, A.; Peñalver, A.; Aguilar, M.A. UAV-Based Digital Terrain Model Generation under Leaf-O ff Conditions to Support Teak Plantations Inventories in Tropical Dry Forests. A Case of the Coastal Region of Ecuador. Sensors 2019, 19, 1934. [Google Scholar] [CrossRef] [PubMed]
- Hentz, K.M.Â.; Strager, M.P. Cicada (Magicicada) Tree Damage Detection Based on UAV Spectral and 3D Data. Nat. Sci. 2018, 10, 31–44. [Google Scholar]
- Pu, R. Tree species Classifcation. In Remote Sensing of Natural Resources; Wang, G., Weng, Q., Eds.; CRC Press: Boca Raton, FL, USA; Taylor & Francis Group: London, UK, 2014; pp. 1–529. [Google Scholar]
- Wang, K.; Wang, T.; Liu, X. A review: Individual tree species classification using integrated airborne LiDAR and optical imagery with a focus on the urban environment. Forests 2018, 10, 1. [Google Scholar] [CrossRef]

Publisher’s Note: MDPI stays neutral with regard to jurisdictional claims in published maps and institutional affiliations. |
© 2022 by the authors. Licensee MDPI, Basel, Switzerland. This article is an open access article distributed under the terms and conditions of the Creative Commons Attribution (CC BY) license (https://creativecommons.org/licenses/by/4.0/).