Article

Water Retention Characteristics of Mineral Forest Soils in Finland: Impacts for Modeling Soil Moisture

Natural Resources Institute Finland, Latokartanonkaari 9, 00790 Helsinki, Finland
*
Author to whom correspondence should be addressed.
Forests 2022, 13(11), 1797; https://doi.org/10.3390/f13111797
Submission received: 19 August 2022 / Revised: 14 October 2022 / Accepted: 26 October 2022 / Published: 29 October 2022
(This article belongs to the Special Issue Forest Management, Hydrology and Biogeochemistry Modelling)

Abstract

:
Soil hydraulic properties are central for soil quality and affect forest productivity and the impacts of climate change on forests. The water retention characteristics (WRC) of mineral forest soils in Finland are not well known, and practical tools to predict them for hydrological, biogeochemical and forest models are lacking. We statistically analyzed mineral forest soils WRC from over 130 sites in Finland, focusing on the humus layer and main root zone (0–19 cm depth). We showed that mineral forest soils can be grouped into five WRC classes that are well predictable from soil bulk density, organic matter content and clay fraction. However, the majority of the forest soils are hydrologically rather similar. We found that neither topsoil maps nor any combination of open geospatial data were able to predict WRC. Thus, in the absence of site-specific soil data, parameterizing WRC as a function of forest site fertility type was proposed. We demonstrated the approach in soil moisture modeling at a small forest headwater catchment and showed that the soil moisture response to weather conditions is jointly affected by WRC, stand attributes and topography. We showed that drought risks are highest for dense mature forests at nutrient-poor, coarse-textured sites and lower for young stands on peatlands and lowland herb-rich sites with groundwater influence. The results improve hydrological predictions for Finnish forests, and the open dataset can contribute to the larger synthesis and development of boreal forest soil pedo-transfer functions.

1. Introduction

Hydraulic properties of soils, such as their ability to infiltrate, conduct and store water are central factors for soil quality [1,2,3]. The soil physical properties and topographical position in the landscape determine how soil moisture and aeration respond to meteorological conditions and plant water use [4,5,6,7,8]. These abiotic factors, in turn, are key controls for biogeochemical processes underlying forest productivity [9,10], carbon and nutrient cycles [11,12,13], soil erosion and element leaching [14,15] and ecosystem resilience to extreme events [16]. Soil texture, moisture and frost depth also affect soil strength and compaction [17,18,19,20,21], providing strong constraints for scheduling and executing forest operations, timber harvests and wood procurement [22,23,24].
Accurate knowledge on soil moisture and its spatiotemporal variability is thus needed to sustainable manage forest soil functions, forest ecosystems and environmental quality [1,2]. Hydrological, biogeochemical and forest ecosystem models are essential for planning sustainable forest management (e.g., plant selection, management chains, nutrient and carbon sink management), assessing risks for abiotic stresses (droughts, waterlogging) and forecasting operating conditions for forestry practitioners [25,26,27,28].
It is established that the hydraulic properties depend on the soil texture, organic matter content, bulk density, macro-porosity and stoniness, among other factors [29,30]. As soil water retention characteristics (WRC) and soil hydraulic conductivity are laborious to measure, statistical pedo-transfer functions (PTFs) are a common way to predict soil hydraulic properties from easily measurable or readily available soil data [29,30,31]. The complexity of PTFs ranges from simple look-up tables, where WRC are predicted for given soil types (‘class-PTF’s), to regression models based on soil physical properties and machine-learning approaches such as neural networks (see review in [30]). However, existing soil hydraulic databases are generally biased toward agricultural soils, and data on boreal forest soils remain scarcer [32,33]. In Finland, there are several studies on WRC of mineral forest soils [34,35,36,37,38,39] and drained peatland forests [40], but synthesis and PTFs to predict WRC for hydrological models are lacking.
The proliferation of open high-resolution geospatial (GIS) and weather data is now starting to enable distributed process-based models to emerge as planning tools in forestry [23,27,41,42]. The use of such models, however, would require that soil hydraulic properties can be predicted from geospatial data. In Southern Finland, soil maps exist at 1:20,000 resolution, while the whole country is covered at a scale of 1:200,000. The multi-source National Forest Inventory (mNFI) provides forest attributes and forest site type classification at 16 m resolution throughout the country [43]. The digital elevation model and range of topography-derived wetness and terrain indices cover the country at 2–16 m resolution [44,45]. A few studies have examined the potential of geospatial data in predicting soil properties [21,46,47], and the usability of geospatial datasets for predicting forest soil hydraulic characteristics remains largely unexplored.
To fill these important knowledge gaps and enable better hydrological predictions for forest soils, we analyze an extensive dataset on soil water retention characteristic measured at several depths (humus layer, 0–20, 0–40 and 40- cm depths) from 139 mineral soil forest sites in Finland. We develop class-PTFs to predict the hydraulic characteristics from readily measurable soil properties and test the suitability of open geospatial data for such predictions. Furthermore, we use the established Mualem–van Genuchten [48,49] model to characterize the WRC. Finally, we illustrate the importance of the hydrological properties and landscape heterogeneity for soil moisture and drought risk predictions. The specific objectives were: (1) To explore the means and variability of hydraulic characteristics in Finnish forest soils and their dependency on soil properties, (2) To evaluate how they can be predicted based on open geospatial data, and (3) To compile a database and PTFs for predicting mineral forest soil hydraulic characteristics for modeling. The database and Python (3.x) functions are included as Supplementary Materials to use the results in future research and applications.

2. Materials and Methods
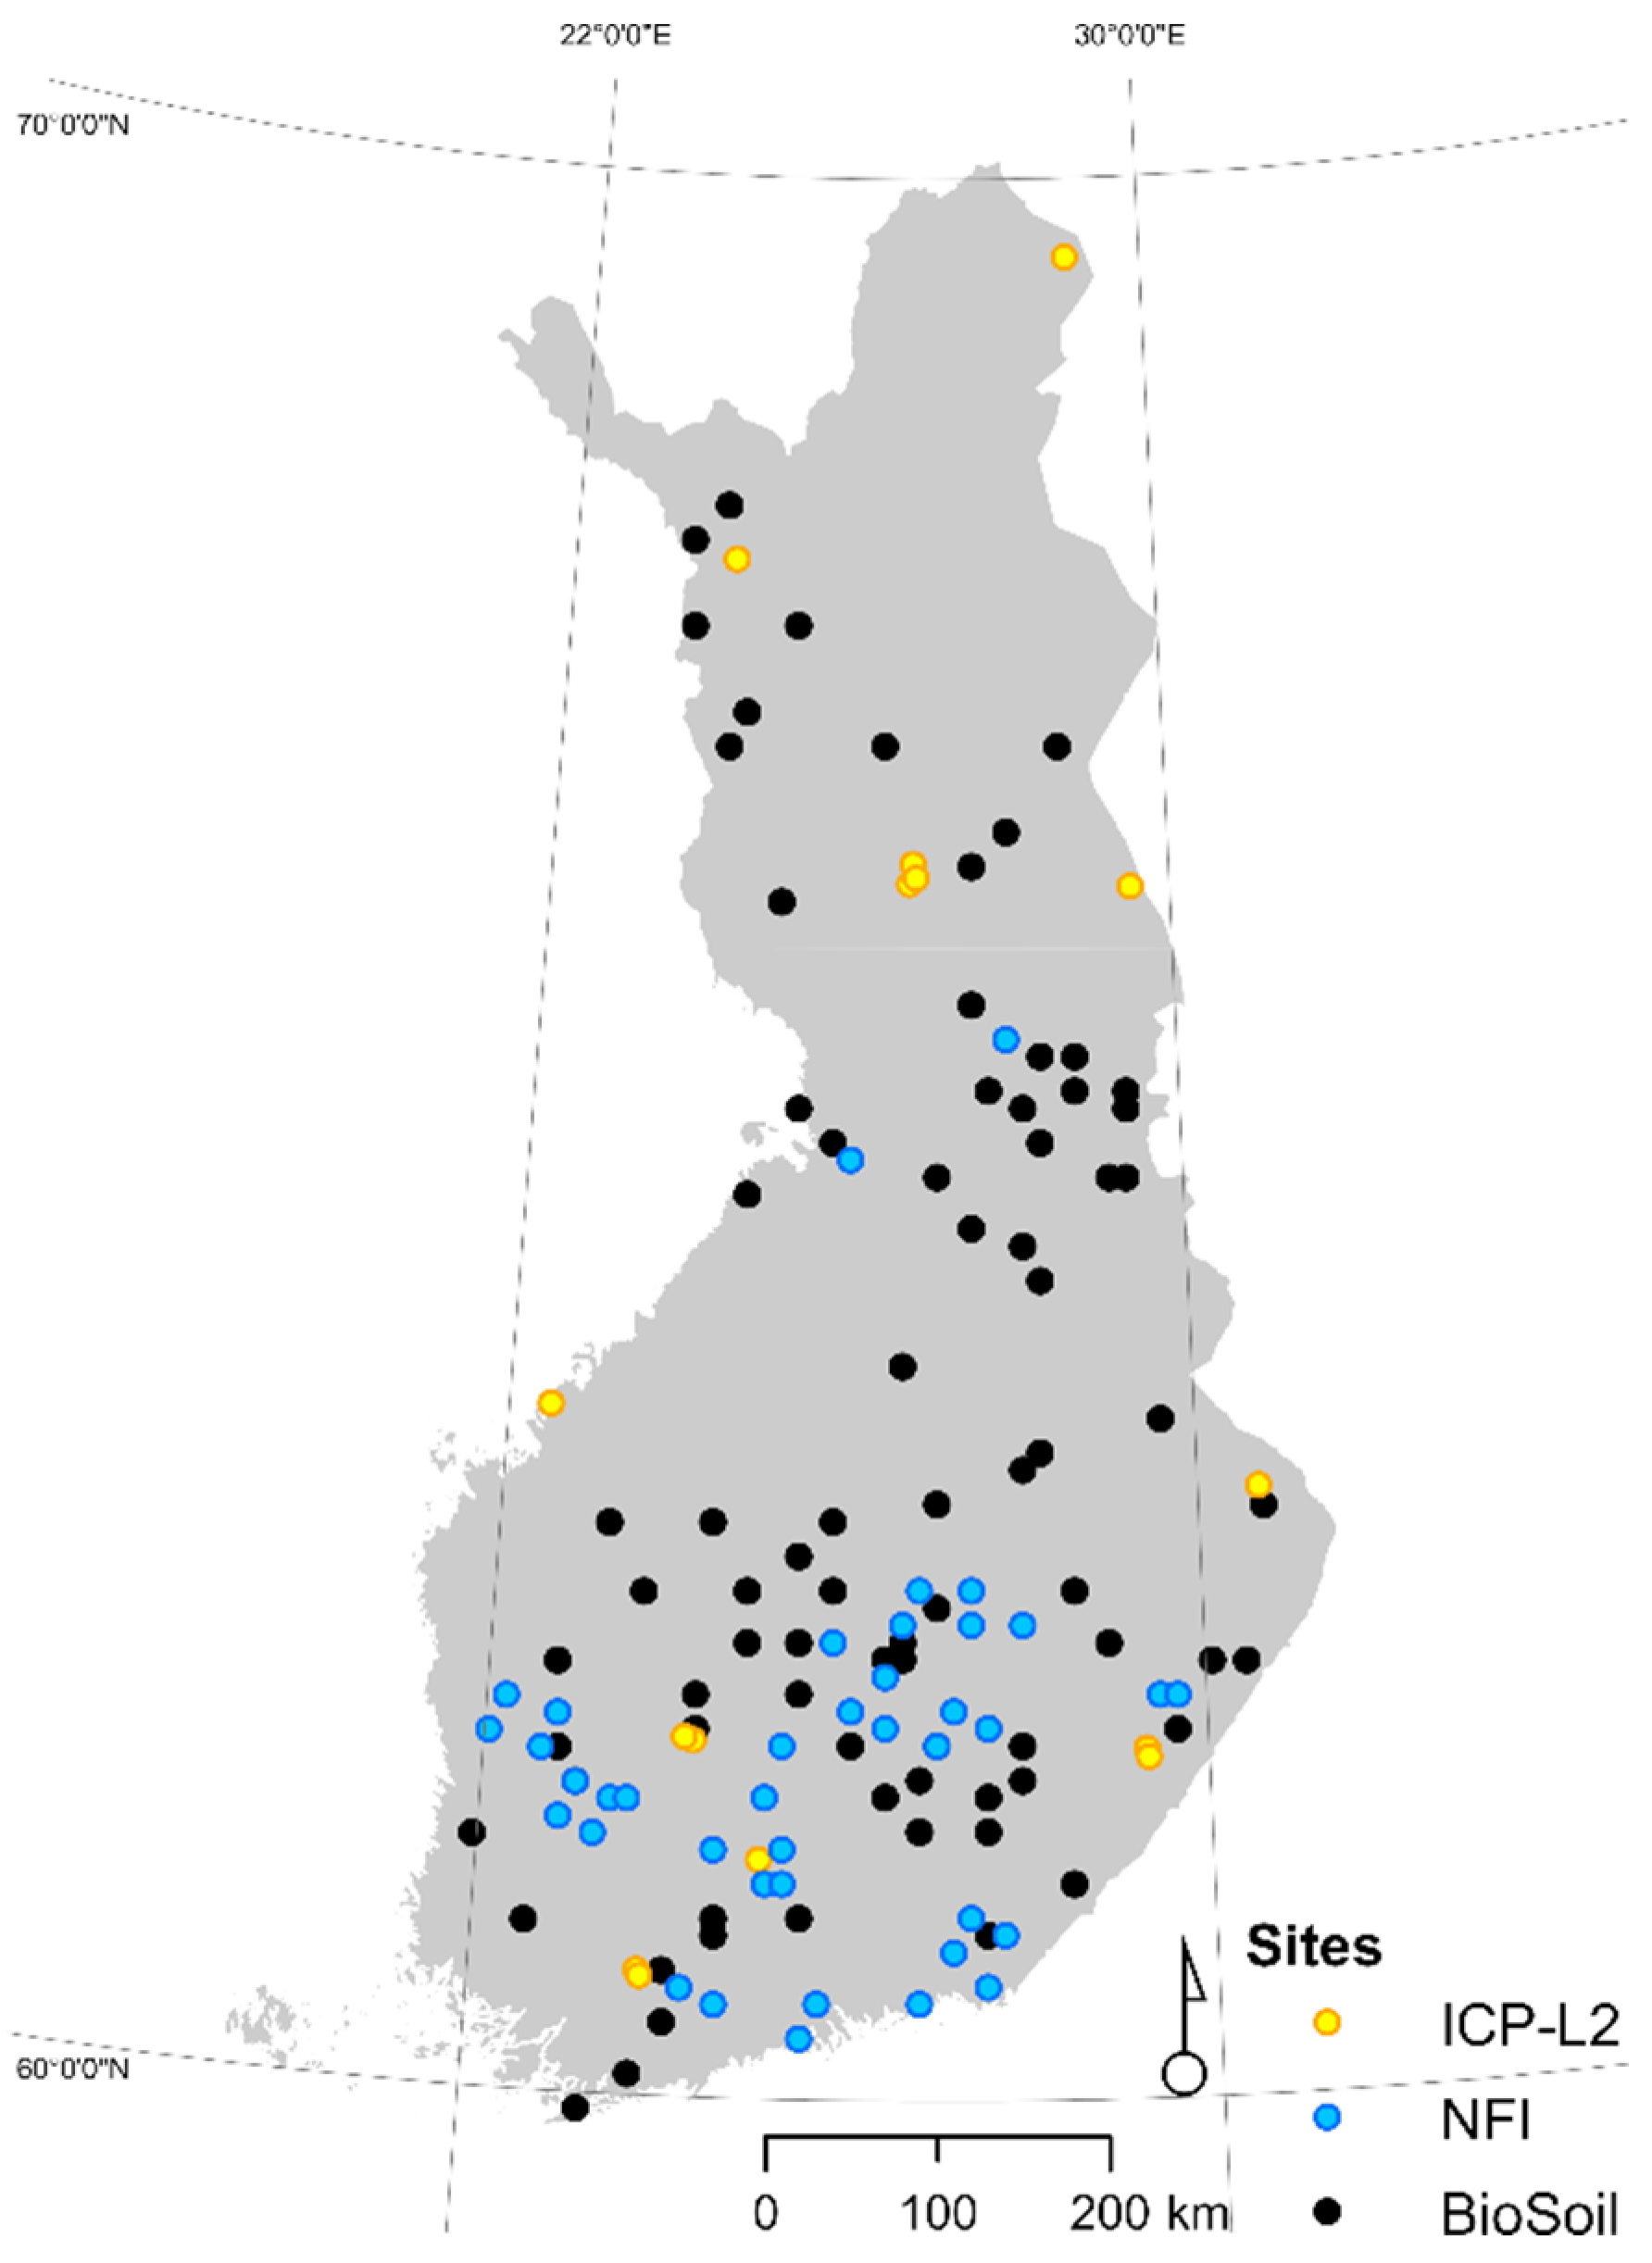
2.1. Field Data

The data on upland forest soil texture, carbon stocks and physical properties were collected under the EU BioSoil project in 2006–2007 [21,50]. The Finnish plots measured in the BioSoil project consist of a subset of the permanent plots of the 8th Finnish National Forest Inventory (NFI8). In total, 82 upland mineral soil forest plots were here examined for soil water retention characteristics, yielding in total 372 soil core samples. The subset of 82 sites was selected based on two criteria: to represent the site fertility distribution of the forests in Finland and to have sufficiently low stone content to enable the sampling of volumetric samples used in soil water retention measurements. In addition to the BioSoil data, 183 soil core samples were collected for water retention determination from 3–4 layers, including the humus layer, from the 18 Finnish sites belonging to the pan-European intensive forest monitoring network (ICP Forest Level II; http://icp-forests.net [51,52]). Furthermore, an additional 39 NFI sites around Finland were examined in years 2011–2015, and 338 soil core samples were collected for analysis of soil hydraulic properties from 3 to 4 layers, including humus layer characteristics. Altogether, the dataset consists of 139 forest site plots (Figure 1), where 893 soil core samples were collected for water retention characteristics.

2.2. Laboratory Measurements of Soil Properties

The particle size was analyzed using the laser-diffraction method. However, 60 random samples from the depth of 10–20 cm (commonly with the highest clay contents) were analyzed using the sedimentation method. The sedimentation method was applied after organic matter had been removed from the samples using H2O2 [53]. The values from the laser-diffraction method were calibrated with unpublished test data analyzed using both methods [50]. The organic matter content was estimated based on loss on ignition (LOI) at 550 °C for two hours (=100% minus percentage ash content). The bulk density (Db) was determined as the ratio of the dry mass (dried at 105 °C) to volume at −0.3 kPa matric potential [50,54,55]. The particle density (Dp) was estimated using an average density of 2.65 g cm−3 applied to mineral components and 1.5 g cm−3 applied to organic components [56].
The volumetric water retention characteristics of undisturbed soil samples were determined using a pressure plate apparatus (Soilmoisture Equipment Corp., Santa Barbara, CA, USA) at decreasing matric potentials Ψ (kPa) [50,54]. Soil-filled metal cylinders (d = 58, h = 60 mm) were first saturated overnight and then allowed to drain freely to −0.3 kPa matric potential and then exposed to successive matric potentials down to −1500 kPa. At each potential, the volumetric water content θ (m3 m−3) was determined by weighing and measuring the transient sample volume.
The total porosity (TP) was estimated to be (Dp − Db) Dp−1, where Db is the soil bulk density. The water content at field capacity (FC), the amount of water the soil can store against gravity drainage, was estimated as the water retention at a matric potential of −10 kPa [55,57]. The wilting point (WP), characterizing the lower limit for plant available water content, is defined as the volumetric water content at −1500 kPa [55]. The available water capacity AWC (= FC − WP) defines the plant available water between field capacity and wilting point. The air-filled porosity (θa) is estimated as TP-θ, where θ is the actual volumetric water content.

2.3. Fitting the Water Retention Curves

We focused the analysis on the organic humus layer on top of the mineral soil and the 0–19 cm mineral soil layer. The latter corresponds to the layer where the majority of tree and ground vegetation fine roots are located [58,59]. We fitted the Mualem–van Genuchten (MvG) model to the data. It describes the non-linear relationship between volumetric soil moisture (θ, m3m−3) and matrix potential (Ψ, kPa) as [30,49]:
θ ( Ψ ) = θ r + θ s θ r   [ 1 + ( α Ψ ) n ] m
where θr is residual and θs saturated water content (equals TP, m3 m−3), and α (kPa−1), n (-) and m = 1 − 1/n are fitting parameters. We used Python package lmfit [60] to fit Equation (1) and constrained the number of fitted parameters to three by setting θs equal to measured TP. The root mean square error (rmse) was used as a goodness of fit statistic. Equation (1) was fitted to each sample separately and to the means of each group to determine class-based WRCs (see example in Figure 2).

2.4. Clustering the Soils According to Their Hydraulic Properties

To explore the means and variability of hydraulic properties in the root zone mineral soil, we used agglomerative clustering and decision trees to define groupings in the data. First, we pooled all samples made at various depths within the 0–19 cm layer, resulting in a dataset of 387 analyzed soil samples. Next, we applied the agglomerative hierarchical farthest neighbor clustering, an unsupervised bottom–up clustering method, to label the dataset based on the measured TP, FC and WP. In the method, each observation (i.e., analyzed soil sample) starts as its own cluster and clusters are sequentially combined into larger clusters until all observations have ended up being in a single cluster [61]. The merging process can be illustrated as a dendogram, where leaves are individual observations at the start of the process, and the root node is the final step of the process containing all the observations. In the tree, the depth of the node is a distance where the two closest clusters have been merged. We used the complete linkage approach in which the Euclidian distance between clusters was calculated between the farthest element pair shared by two clusters [62]. After clustering, each soil sample was thus assigned to a WRC class and labeled accordingly. The appropriate number of clusters was determined by expert judgement to compromise between cluster interpretability and their predictability based on readily available soil data (Section 2.5).

2.5. Predicting the Hydrological Properties: Defining the Class-PTF’s for Hydrological Models

We tested how the readily available soil data and/or open geospatial data can be used to predict the hydrological properties. We used decision tree classifier, a non-parametric supervised learning method [63], to extract possible features from independent data to correctly predict the WRC class (Section 2.4) for a soil sample. In classification, the dataset was randomly divided into training, test and validation data (0.75/0.15/0.10 split). In decision tree construction, the training data were divided into subsets based on the gini impurity index, which is a measure of how often a randomly chosen element from the subset would be incorrectly labeled if it was randomly labeled according to the distribution of labels in the subset. Only binary splits were allowed, meaning that in case of continuous variables, weighted averages were used as a split boundary. The uneven size of the clusters (Section 2.4) was accounted for when constructing the decision tree by using an inverse of their sizes as cluster weights. By using test data, parameters were adjusted to prevent over-fitting: the maximum depth was limited to 3, the minimum samples per leaf was 5, and the minimum impurity decrease was 0.01. The model performance was assessed using a model accuracy score, which measures how well the predicted label of an observation corresponds its true label in test/validation data. The model accuracy score has a value between 0.0 and 1.0 depending on the model having predicted all samples to match their true labeling (score 1.0) or having a model failed to label all samples correctly (score 0.0). For both the agglomerative hierarchical clustering and decision tree classifier, we used Python machine learning package Scikit-learn (v. 1.0.2) [64].
We consider two learning problems: First, we tested whether soil physical properties (Db, LOI, clay, silt and sand fractions) and measured site properties (NFI grain size and site-type observations, see Supplementary Materials) can predict the belonging of a soil sample into a correct class. If successful, the obtained decision tree would provide ‘a roadmap’ from readily measurable parameters to hydraulic properties (i.e., ‘class-PTFs’ [29]). Second, we asked if the same is possible using only open geospatial data, including topsoil (superficial deposits) maps [65], topographic features such as slope, aspect, topographic wetness index (TWI [45]), depth to water index (DTW [44]), terrain ruggedness indices (TRI, TPI), and static forest site-type attribute from the multi-source National Forest Inventory (mNFI [43]). If successful, such a decision tree would enable predicting hydrological properties for distributed hydrological and biogeochemical modeling. The open geospatial data variables and their pre-processing is described in the Supplementary Materials.
Furthermore, we explore the means and variability of the measured soil hydrological and physical properties within and across top soil types (provided by soil maps) and NFI site types, and we examine their nested combinations. For the analyses, the site types were pre-grouped into herb-rich (including OMaT and OMT types of the Finnish site-type classification [66]), mesic (MT), sub-xeric (VT) and xeric (CT, CIT and forests on rocky and sandy terrain) classes. The topsoil map was pre-classified into organic (peats), fine-textured (clays, silt, finer fine sand), fine tills, sandy tills, and coarse-textured (sand, gravel, gravelly till).

2.6. Soil Moisture and Drought-Risk Predictions

We demonstrated how soil water retention characteristics, vegetation and topography drive intra-annual soil moisture dynamics and may regulate forest drought risks. We used the Spatial Forest Hydrology model (SpaFHy [42]) on a ca. 150 ha forest headwater catchment Paunulanpuro (61°40′N, 24°20′E) at Orivesi, Southern Finland to model soil moisture at 16 × 16 m resolution at a daily timestep. Paunulanpuro is a typical managed boreal forest catchment in the region, having a mean stem volume 167 m3ha−1, mean one-sided leaf-area index (LAI) of 4.4 m2m−2, and the forests consisting of 9% peatlands, 28% herb-rich, 53% mesic, 9% sub-xeric and 1% xeric site types. According to the soil map, ca. 80% of the catchment is on medium-textured soils [42,67]. The long-term mean (1981–2010) annual temperature is +3.5 °C and precipitation (P) is 711 mm.
The SpaFHy model consists of sub-models representing the hydrological cycle in vegetation (interception, evaporation, transpiration, snow processes) and in the organic layer and root zone (soil moisture dynamics). The lateral water transport and base and return flow sub-model follows the top model approach [68]. The SpaFHy is described in detail by [42], who tested it across over twenty boreal forest catchments and several eddy-covariance flux sites. The model has been lately extended to include nutrient balance and leaching to predict water quality impacts of forest management [27]. In the parameterization, we follow [42], with the exception of the humus layer and soil, where the soil map-based parameterization of hydrological properties (TP, FC, WP) was replaced by forest site-type-based parameters and humus layer properties obtained in this study. We used mNFI data to determine the dominant canopy height, canopy closure and coniferous and deciduous tree LAIs, and DEM and TWI rasters to derive the parameters of the top model submodule to approximate lateral shallow ground water flow. Daily weather data from 2000 to 2015 provided by the Finnish Meteorological Institute at 10 × 10 km grid were used as model input.
A proxy of physiological drought, i.e., the occurrence of growing season θ, significantly affecting transpiration, is evaluated for each grid cell using the modeled θ. For this, we adopt the same soil moisture modifier fw (-) as in [42] giving the relative decrease in canopy conductance (and transpiration rate) as a function of relative plant available water REW = (θ − WP)/(FC − WP) (−) as
f w = m i n [ ( 0.02 + R E W / 0.2 ) ,   1 ]   .

3. Results and Discussion

3.1. Humus Layer Hydraulic Characteristics

The average WRC curve and selected hydraulic parameters for the forest humus layer (N = 102) are shown in Figure 2. The humus layer is characterized by low bulk density (mean 0.19 g cm−3) and high TP (≈0.90). The porous coarse structure of this partially decomposed organic material leads to a steep WRC curve with FC ≈0.3 and WP ≈0.1, which is in line with earlier studies from boreal humus layers [34,69,70]. The hydraulic characteristics also resemble those of poorly decomposed Sphagnum peat [71]. We found that the humus layer hydraulic characteristics did not significantly vary across forest site types, grain-size distribution of underlying mineral soil (NFI observations) or topographic indices (not shown), which was likely because the heterogeneity in microtopography and vegetation within sites dominate the observed variability in the humus layer characteristics [21,50]. Thus, we propose the average water retention characteristics in Figure 2 as a generic estimate for the boreal forest humus layer, but at the same time, we note that particularly FC may be highly variable depending on the amount of fine mineral soil fractions mixed with the organic plant residues. According to the BioSoil data, the mean humus layer depth varies slightly across the site types being 3.7 cm in herb-rich, 5.0 cm in mesic, 4.6 cm in sub-xeric and 3.5 cm in the xeric sites [21].

3.2. Mineral Soil Hydraulic Characteristics in the Root Zone

The bivariate Spearman rank correlation coefficients between the physical and hydrological properties of the main root zone (0–19 cm layer below the humus) are shown in Figure 3. As variations in mineral soil particle density are small compared to those of soil bulk density, there is a nearly perfect negative correlation between Db and porosity. Both these variables are strongly correlated with the organic matter content (LOI). LOI is thus an important determinant of the soil hydrological functions; FC and WP and plant available water (AWC) increase with increasing soil carbon content. LOI is positively correlated with clay and silt fractions indicating on average higher organic matter content on fine-textured than coarse textured soils. Soil texture does not correlate with Db or TP but does significantly influence water retention characteristics as FC, WP and AWC are positively correlated with clay and silt and negatively with the sand fraction. Of the MvG water retention curve (Equation (1), Supplementary Figure S1), parameter n is positively correlated with Dp and sand content, and it is negatively correlated with LOI and fine (clay, silt) fractions. The air-entry potential α is negatively correlated with Dp (and positively with TP). Note also that the MvG parameters are correlated particularly n with α and θr.
The dendrogram in Figure 4 shows how the data (0–19 cm layer in mineral soil) can be divided into five distinct groups (C1–C5, characteristics are shown in Figure 5 and Table 1, and water retention curves in Figure S1) based on the measured hydraulic properties (TP, FC and WP). C1 represents soils with highest porosity (TP > 0.7 m3m−3), field capacity (FC > 0.45 m3m−3) and plant available water content (AWC > 0.2 m3m−3), which is predominantly because of high organic matter content (Figure 5) and fine parent material (see NFI grain-size classification, Table 2) and low bulk density. These soils were mainly found on the most productive herb-rich and mesic forest site types, while the nutrient poor site types are absent (Table 2). The Db increases while LOI, TP, FC and WP decrease when moving from C1 to C2. C2 represents fine to medium-textured soils in the fertile herb-rich and mesic sites. Contrary to the first two classes, C3 has low organic matter content and TP, while the relatively high wilting point (WP ≈ 0.2 m3m−3) leads to significantly lower AWC. The C3 represents fine-textured clay and silt soils associated mainly with the most fertile herb-rich sites. The medium-textured and coarse mineral soils on mesic to xeric site-types are clustered to C4 and C5, which jointly comprise ca. 75% of the data. C4 has the lowest LOI, FC and WP, and it has smallest plant available water capacity. It includes the nutrient-poor xeric sites and coarse-textured soils. C5 has higher TP, FC, WP and AWP than C4, as the organic matter content is larger and the fraction of coarse-textured soils is smaller (Figure 5, Table 1).
Approximately 72% of the forest land in southern Finland and 81% in northern Finland consist of mineral soils, of which the majority are coarse to medium-texture Podzols [72]. Agricultural land has commonly been taken for use from fertile fine-grained soils when remaining coarser soils are left forested [72,73]. This uneven distribution of forest lands across soil and site types is reflected in the strongly uneven sizes of the clusters, where C5, C4 and C2 jointly consist of more than 90% of the samples (Figure 5, Table 1). In boreal forests, the stand structure and ground vegetation differentiate according to the climatic, geomorphologic and edaphic conditions, leading to the formation of distinct forest site types [66,74,75,76]. Forest site type and the natural dominance of tree species can be seen as ‘static’ or slowly varying attributes of the forest land, whose spatial distribution in a climatic region reflects the combined effects of soil texture, soil hydrological characteristics, sites hydrological regime and fertility [36,50,77]. While different forest site types can occur over a relatively wide range of soil textures, coarse soil fractions tend to increase and fine fractions and organic matter content decrease along with a declining productivity gradient from herb-rich to xeric sites [36,50,78,79]. These trends explain why the WRC classes C1 and 2 with high TP and FC are most frequently associated with nutrient-rich site types and fine and medium-textured soils, and why nutrient-poor sites on coarse soils form a distinct WRC class C4 (Figure 5). As C1, C2 and C5 all have both high AWC and air-filled porosity at field-capacity, i.e., TP−FC (Figure 4; Table 1), they are less prone to both drought stress and hypoxic conditions. These risks are most pronounced at C4 (low FC and AWC, coarse-to medium textured nutrient-poor xeric sites) and C3 (fine-textured clay soils with small air-filled porosity at field capacity), respectively.

3.3. Water Retention Characteristics Can Be Predicted from Measured Soil Properties but Not from Open Geospatial Data

The five WRC classes found by agglomerative clustering (Figure 4 and Figure 5, Table 1) could be reasonably well predicted using the decision tree model based on measured soil properties (Figure 6). The best model accuracy score in the validation/test dataset was 0.84 for a model where Db, LOI and clay fraction are the explaining factors. Using a model where the clay fraction was replaced by sand (or clay + silt) fraction yielded almost similar accuracy (0.81). None of the other independent variables tested were identified as significant predictors. The decision tree starts from the whole dataset and successive criteria (‘if-clauses’) divide data (arrows in Figure 6) into subsets until all observations have been assigned to a WRC class. For instance, the first criterion (Db ≤ 1.128 g cm−3, top row) near perfectly separates data between classes C1 and C2 vs. C3 and C4, while C5 is not yet identified. The second criterion on the left branch (LOI ≤ 0.103) then separates between C1 and the rest, while the clay fraction is used to split the remaining data between C2 and C5. We also find that there is only one pathway to respective classes C1–C4, while several pathways lead to the largest class C5 (Figure 6). The decision tree to predict WRC classes follows the previous findings that forest soil WRC is best determinable by a soil’s fine fraction (clay + silt), organic matter content and bulk density [34,36,50]. In forest topsoils, the fine fraction content has been found to be closely related to water retention at field capacity, soil layer and site type [50].
In case only open geospatial data were used in the decision tree, the model accuracy score was always below 0.5, which is independent of tree structure or depth (rows in Figure 6). This indicates that the WRC classes could not reliably be predicted from any combination of open geospatial data alone. Most importantly, we found only minor differences in hydrological characteristics across the soil map categories (Supplementary Figure S4), although soil maps are often used as a basis for PTFs to predict water retention characteristics [29,30]. This finding was not affected by the ‘pre-grouping’ of the soil map categories to broader classes (Section 2.4). The reason soil maps do not work in predicting forest soils WRC, although measured soil properties explain WRC characteristics (Figure 3, Figure 5 and Figure 6), is likely a combination of several factors. First, the ‘topsoil’ maps in Finland indicate soil type at the 0.4–0.9 m depth, which falls below the main root zone analyzed here. Second, the resolution of the soil map is coarse (1:20,000 in southern and 1:200,000 in northern Finland), and the boundaries between soil types are uncertain depending on the original soil sample density, sample classification and the minimum size of polygon being usually 4–6 hectares [65,80]. Third, and most importantly, the underlying soil type is only a partial proxy of WRC (Figure 3 and Figure 5) and may miss important predictors such as organic matter content. Usually a certain soil map class, such as till, contains several soil types from clay to rocks with varying water retention characteristics [80,81].
The variability of hydrological properties is also related to site’s hydrological regime, topography and management history. In northern Finland, the soil’s fine fraction content, organic matter content and FC have been found to increase significantly with increasing TWI [21,39]. Ref. [21] found slope and TWI to have an influence on the organic matter proportion and depth of the humus layer; however, most of the variation (61–72%) remained unexplained. In our results, the topographic wetness indices (TWI, DTW) or terrain ruggedness indices did not appear as significant predictors of WRC alone or in conjunction with soil maps or NFI forest site type. This suggests the open GIS data layers do not contain sufficient information on the factors driving WRC variability across Finland, or the sample size was insufficient to reveal such patterns. This is different from [46,47,82], who found topographic features useful in predicting soil water retention in mineral soils, although correlations have often been weak. Similar to our results, Ref. [83] did not find a significant relationship between topographic indices and water retention characteristics at the landscape scale, which suggests that the role of topography on explaining WRC variability can be scale dependent and vary across soil and environment types [82].
While the data were grouped according to the NFI forest site fertility type, we found differences in the mean WRC characteristics and MvG water retention parameters (Table 2). The TP, FC, WP and AWC decreased with decreasing site fertility (Supplementary Figure S3, Table 2), and they were within each site type always highest on fine-grained soils (NFI grain size observation, Supplementary Figure S3), which is in line with the correlation matrix (Figure 3). We thus propose forest site type as a robust proxy for WRC, as it integrates the influence of soil texture, topography, climate and vegetation influences into root-zone physical properties. The forest site fertility type, available both from mNFI and Finnish Forest Centre grid data at 16 m resolution, is currently the most viable way to predict WRC for distributed forest hydrological modeling (using Table 2 and Supplementary Figure S3)—or to sites where data on soil physical properties (Figure 6) are not available.

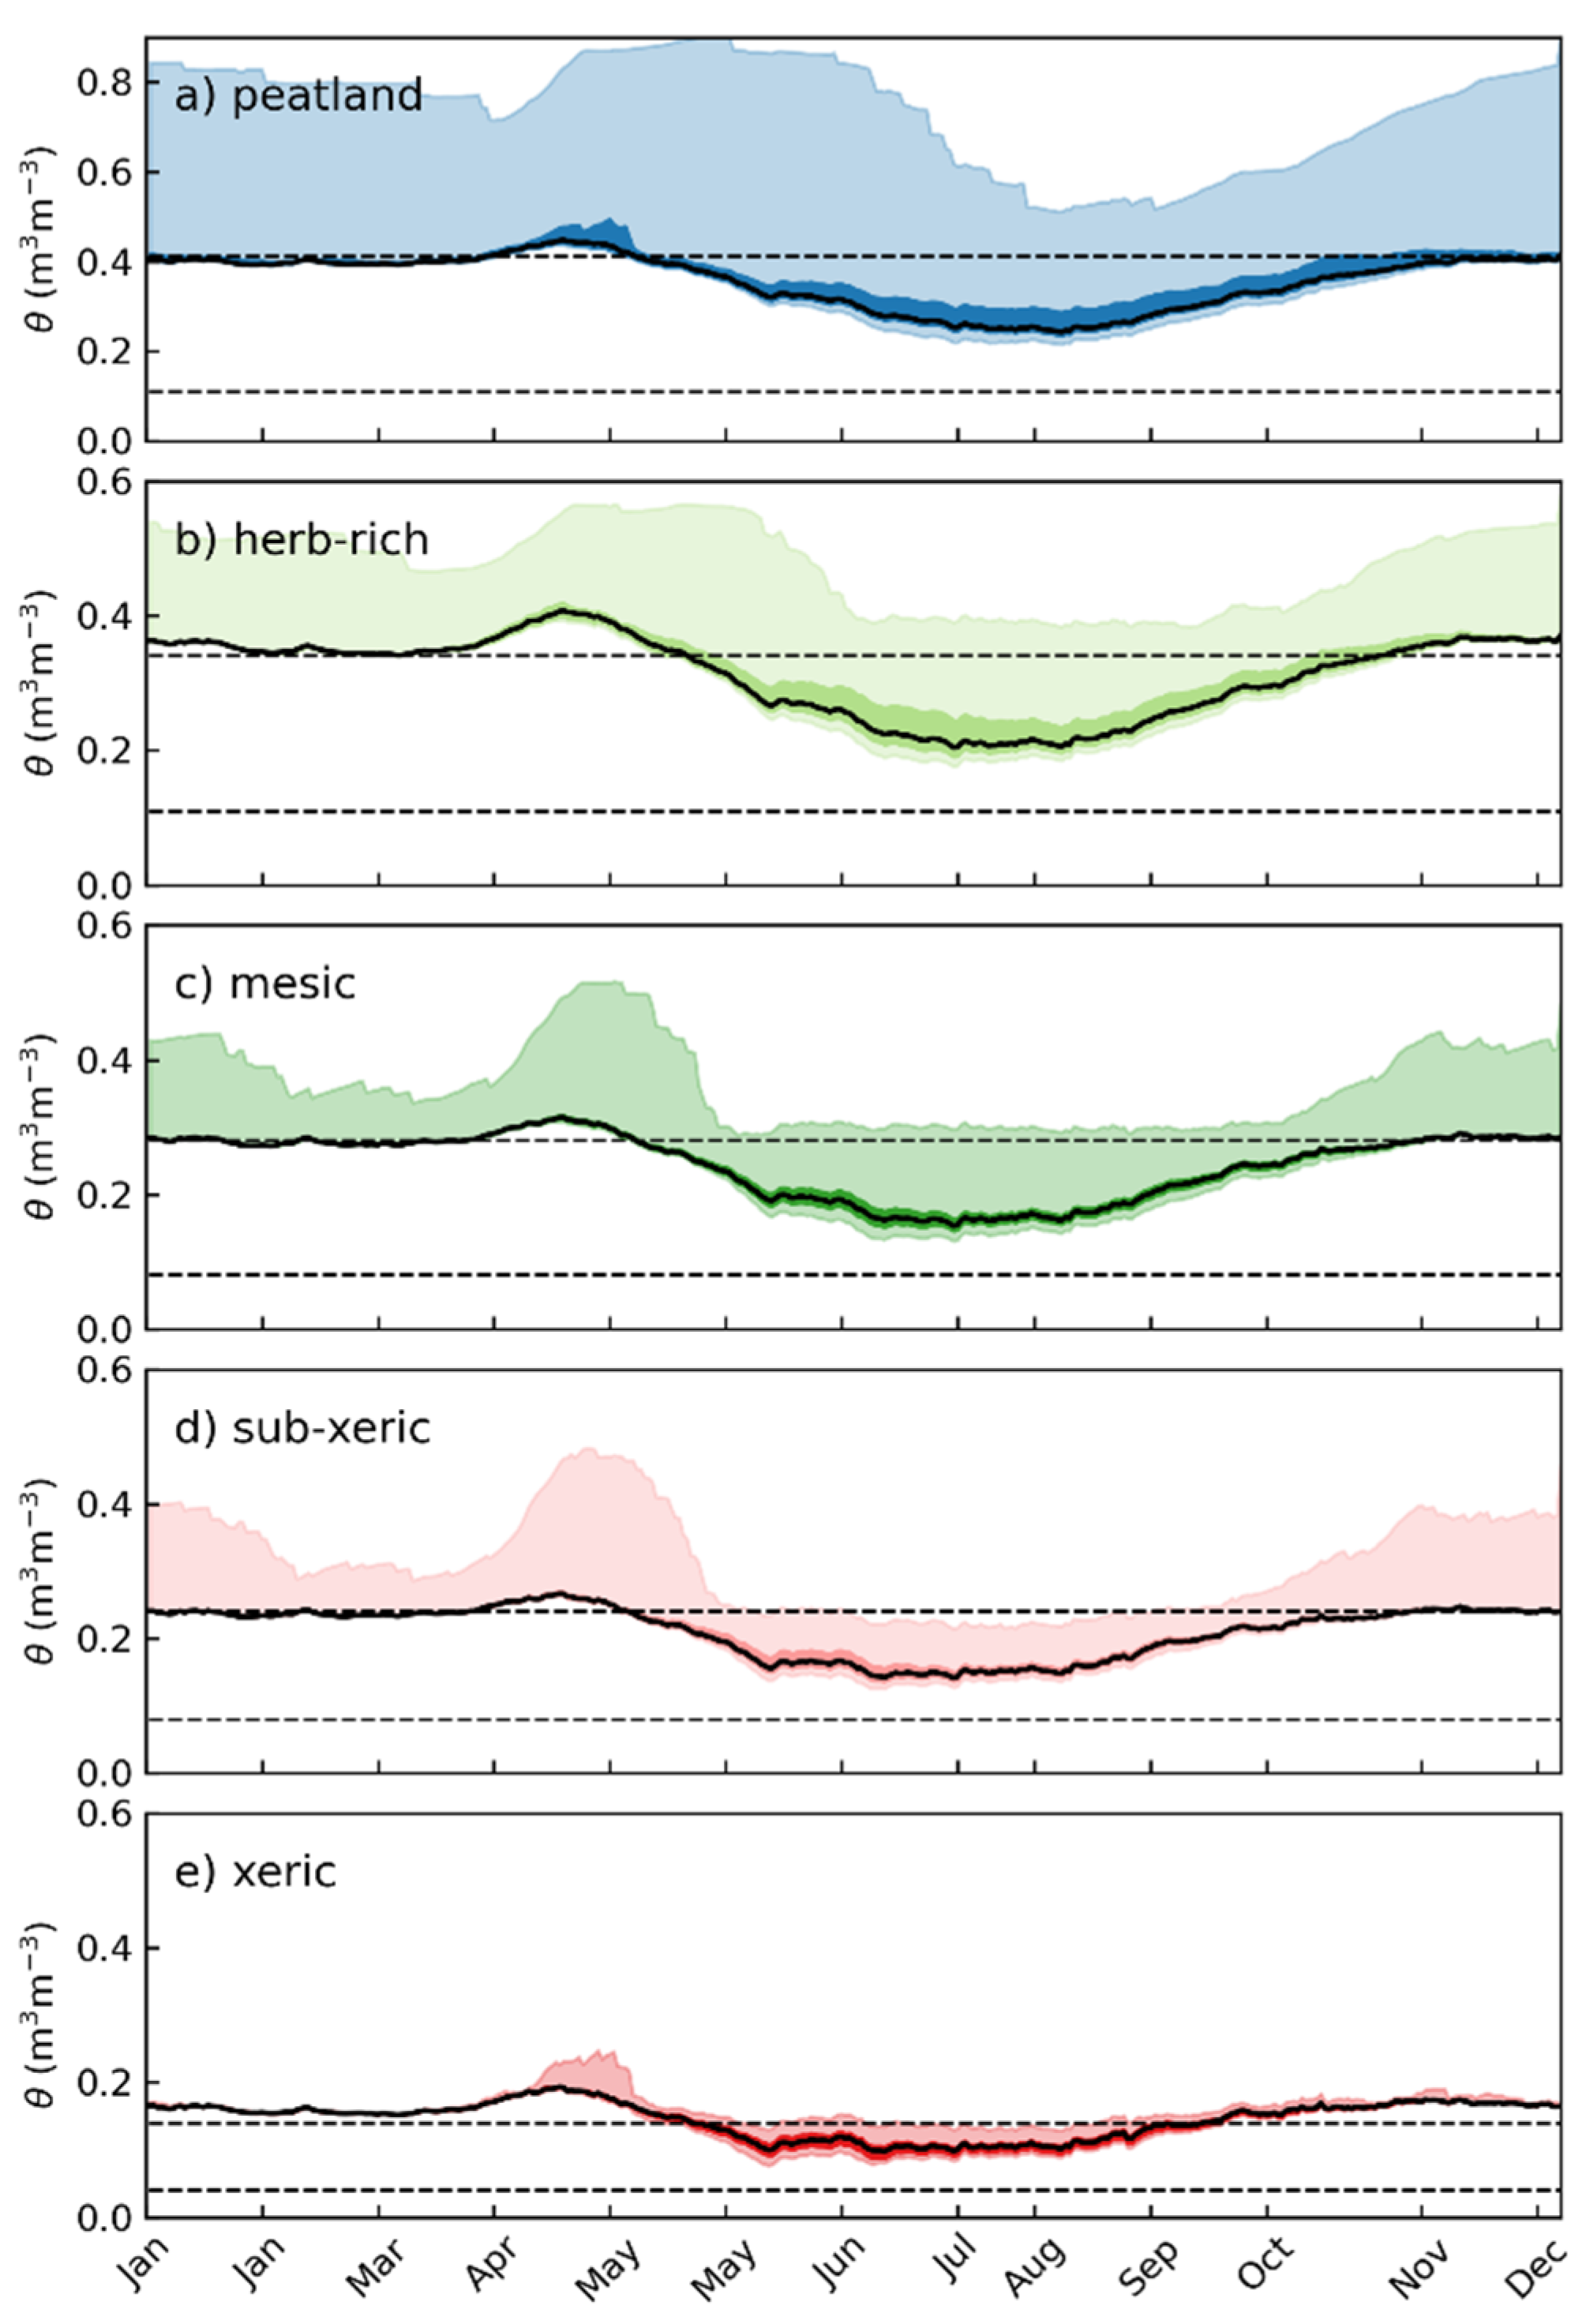
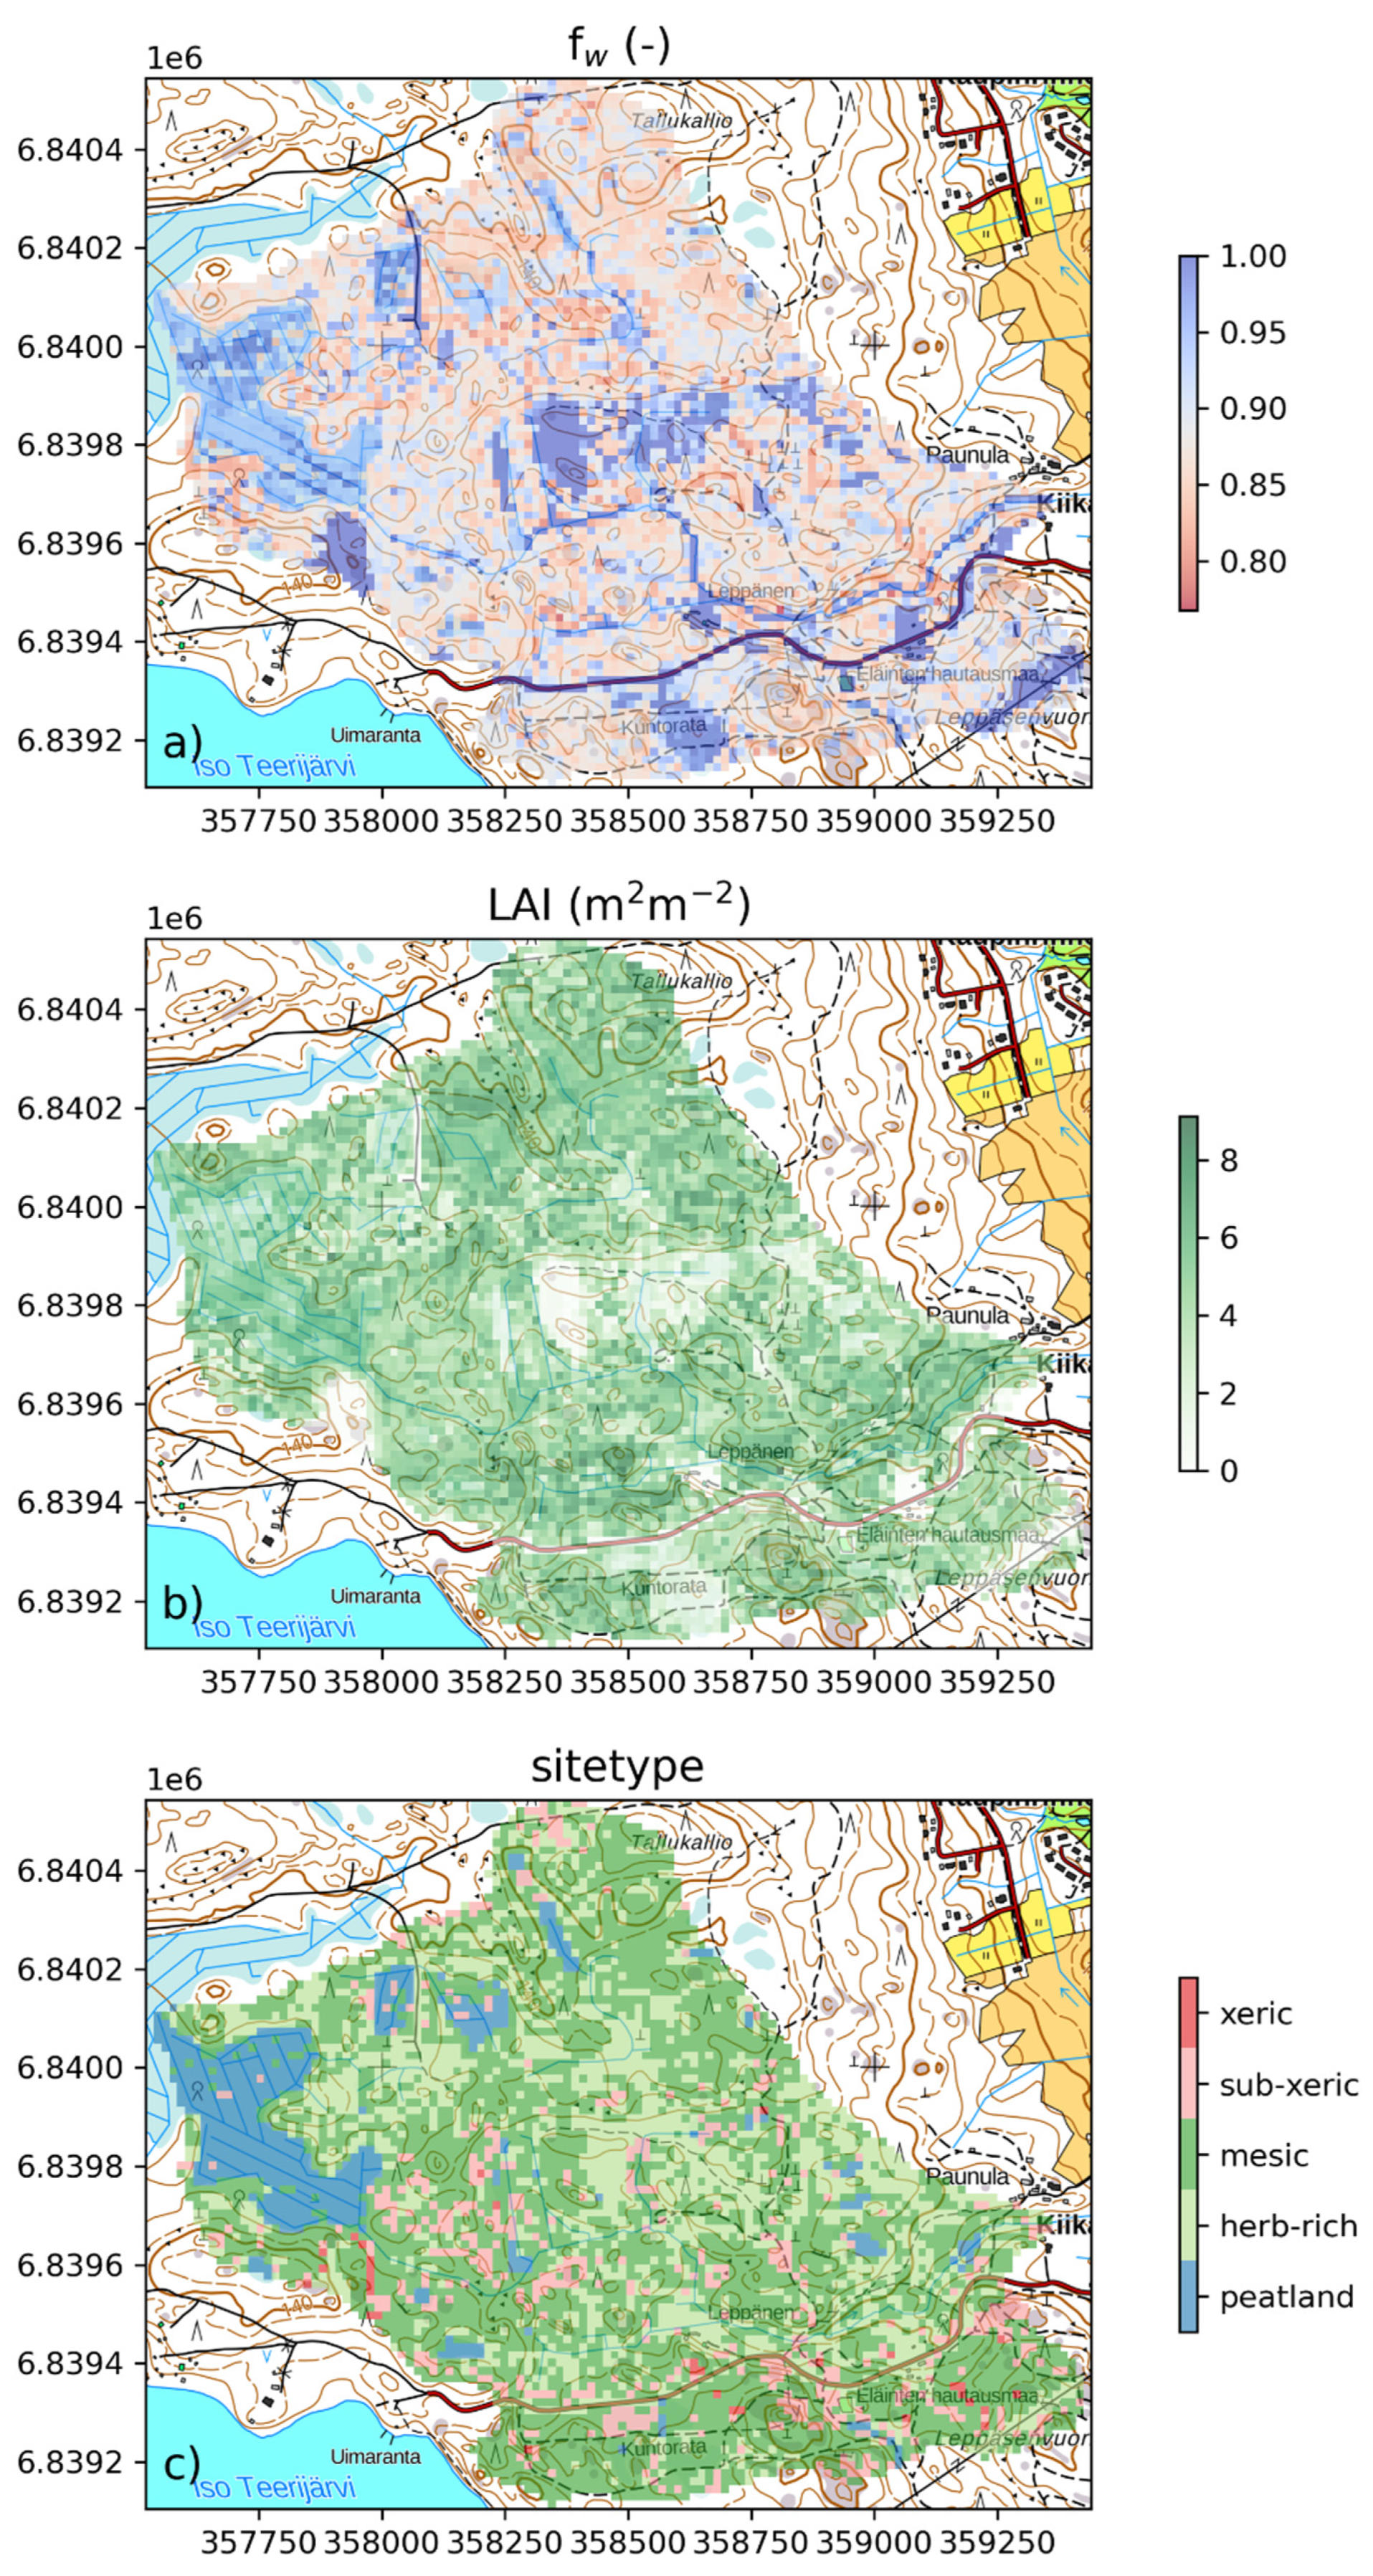
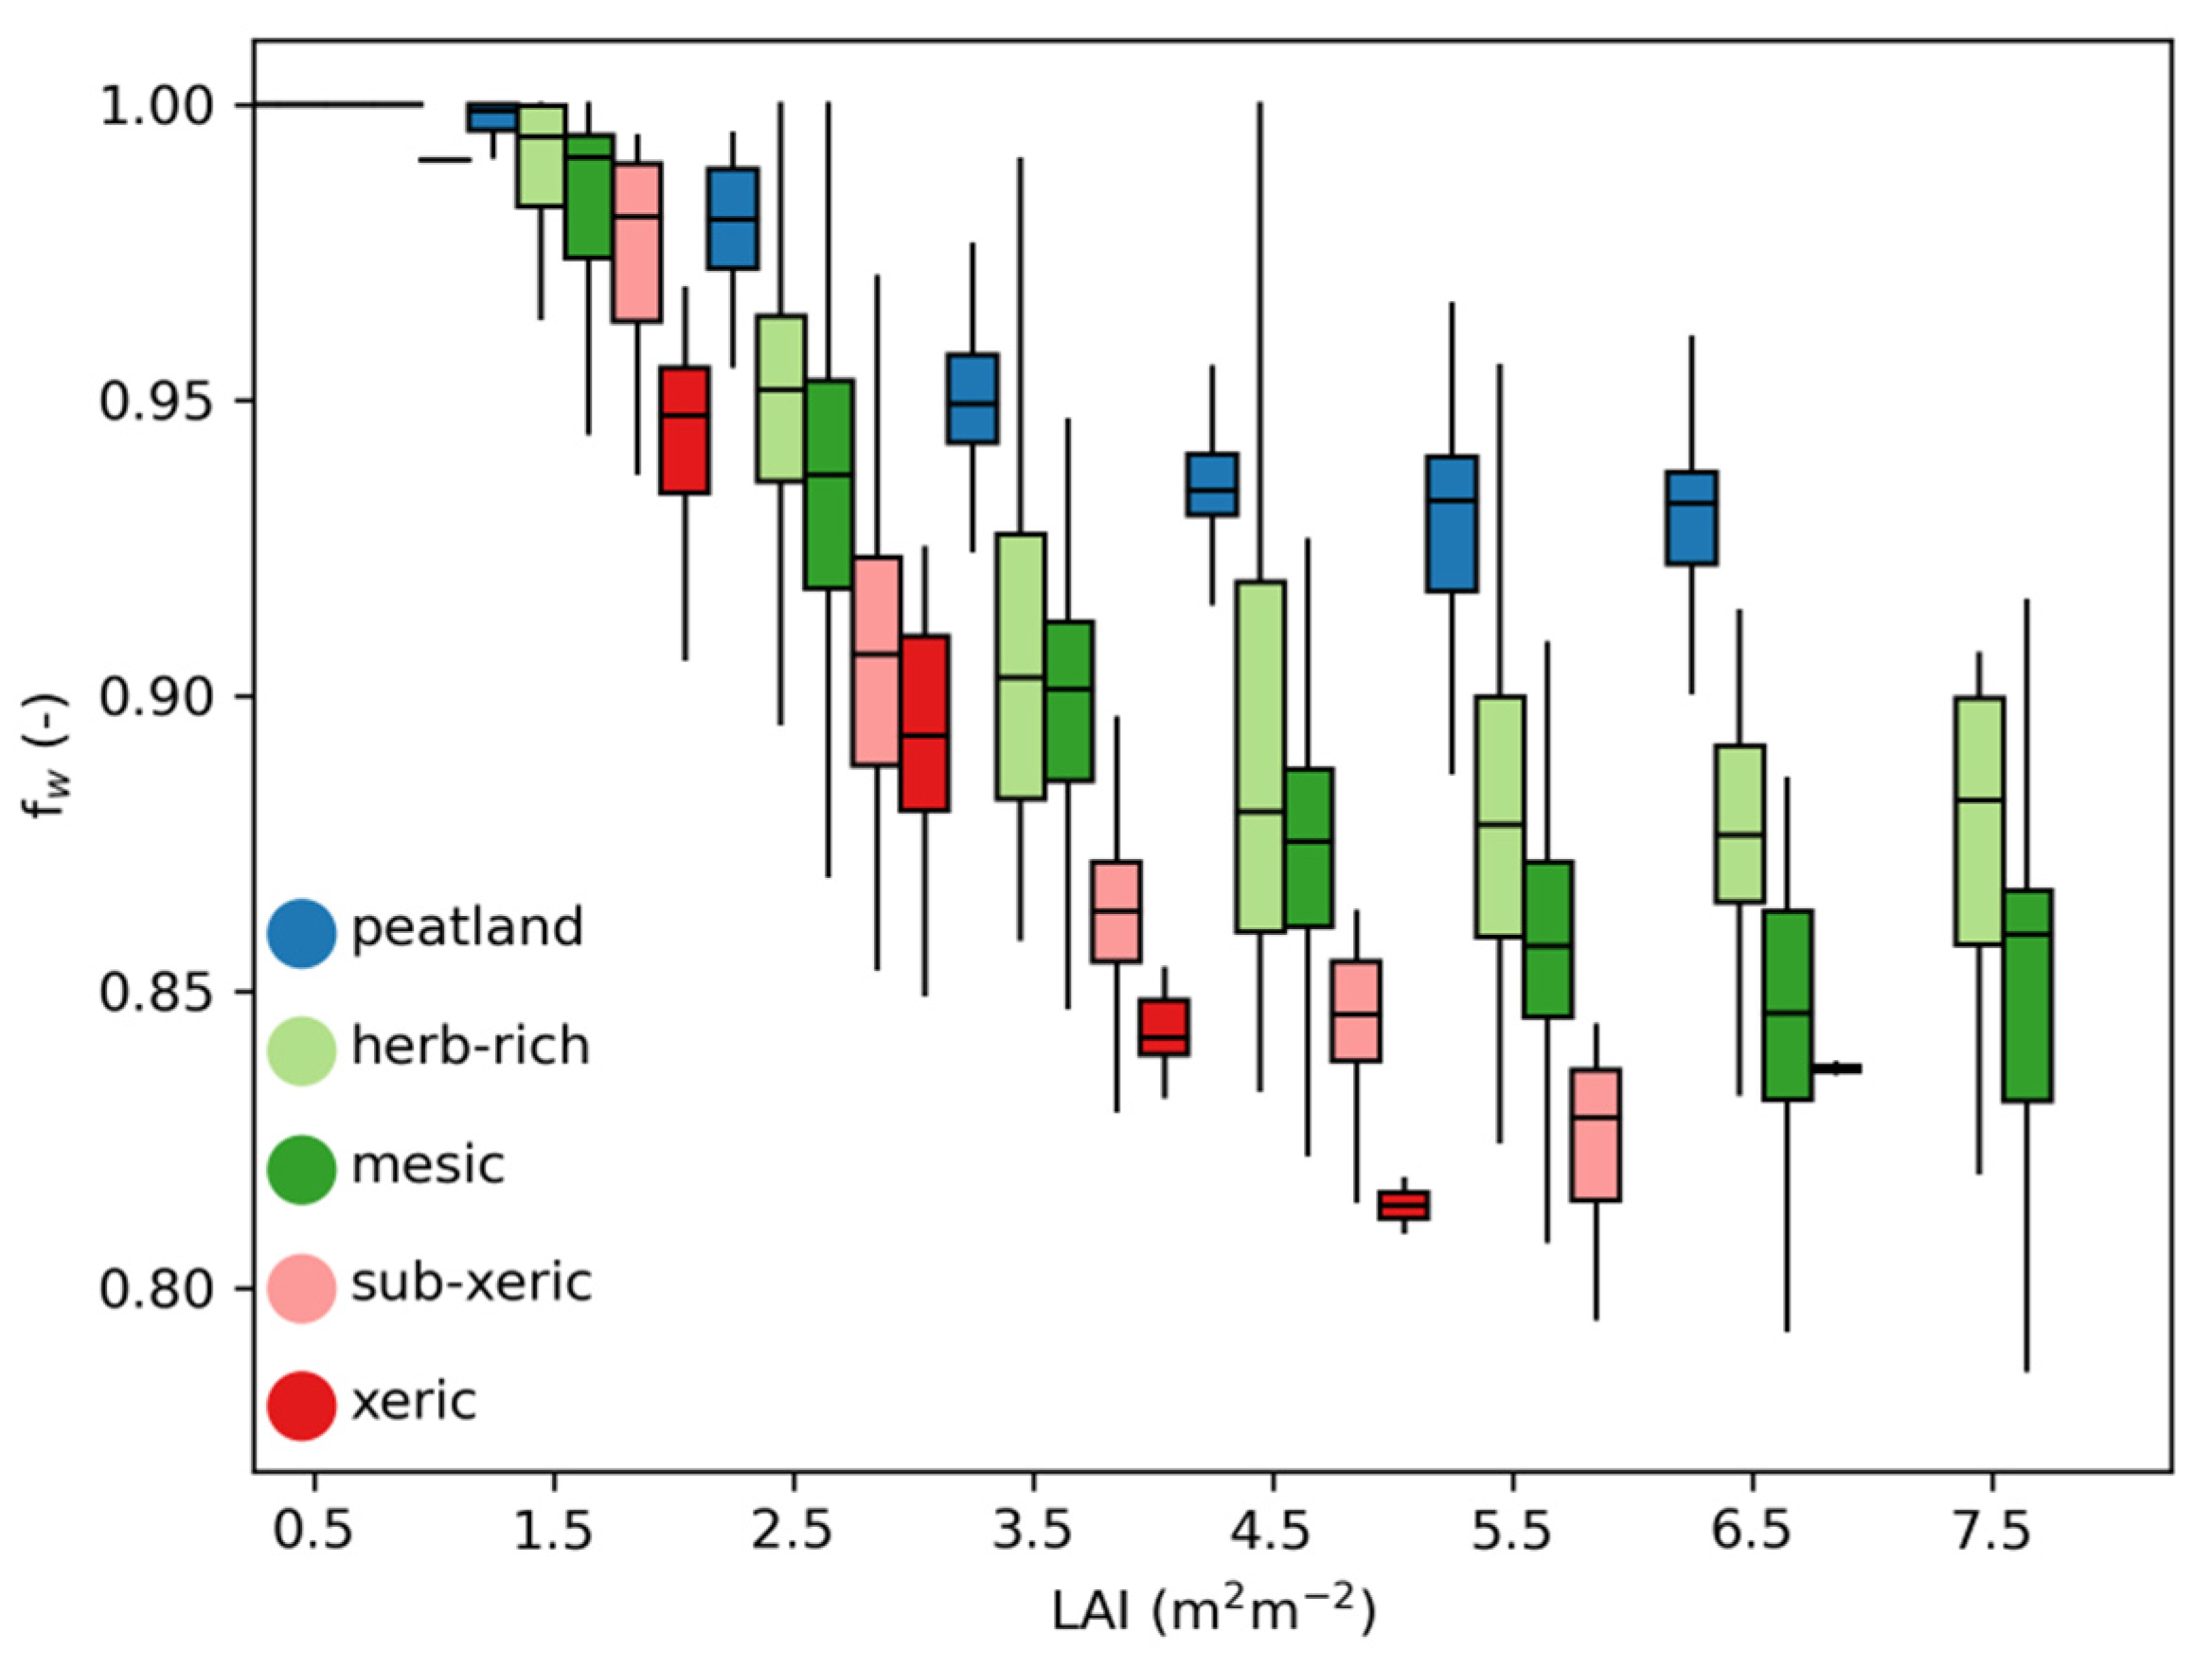
3.4. Impacts for Modeling Soil Moisture and Drought-Risks in Forests

We applied the SpaFHy model to the Paunulanpuro catchment to illustrate how derived WRC can be used in modeling daily soil moisture dynamics at high spatial resolution. To do so, we parameterized the mineral soil hydraulic properties (TP, FC, WP) based on forest site type (Table 2), while lumping all peatland forest grid cells into a single category as in [42]. Figure 7 illustrates the characteristic intra-annual variability of daily soil moisture at each site–type class. It represents the distributions of 15-year mean seasonal cycles of θ for each grid cell in respective forest site type. The inter-annual variability of soil moisture at the driest grid cells in each site type is further shown in Supplementary Figure S5. Generally, the root zone θ is around or above field capacity during Nov–April, when the ground is mostly snow covered (not shown) and precipitation exceeds that of evapotranspiration (ET). The soil moisture peaks during and after the snowmelt in April–early May and has a decreasing trend from May to July as ET > P, leading to the deployment of soil moisture storage below FC before the situation is reversed in autumn (Figure 7).
As expected, the effect of site-type dependent WRC (Table 2) is reflected in soil moisture dynamics, meaning that median daily θ remains higher at the fertile (higher FC and WP) than at the nutrient-poor site types. Moreover, the moisture variability across grid cells (shaded ranges in Figure 7) has a similar decreasing trend with site fertility, which is explained by the combination of topographic effects and vegetation heterogeneity within the site types. The peatland, herb-rich and mesic sites are more frequently found in lowlands and depressions, while nutrient-poor sites tend to cluster more on hilltops and upper slopes (Figure 8c). The lowlands represent flow accumulation areas, where local groundwater levels are closer to the surface due to reduced drainage and/or hillslope return flow [84]. Thus, particularly at peatland grid cells and herb-rich sites, root zone moisture can remain above FC for long periods (Figure 7a,b). At Paunulanpuro, some grid cells receive groundwater return flow almost year-round, which is seen as near saturated (θ ≈ TP) conditions for most of the year (Figure 7a). In mineral soils, the influence of lateral water flows and catchment topography decreases when moving to sub-xeric and xeric sites. All xeric grid cells seem well-drained and without groundwater influence, leading θ > FC only during the snowmelt period (and shortly after heavy rainfall events, not shown). The importance of topography to delay drainage/provide hillslope return flow as well as the smaller saturated hydraulic conductivity are the likely reasons why soil moisture depletes more slowly at the fertile herb-rich and mesic sites and minimum soil annual soil moisture content is reached later in the summer than at the nutrient-poor sites (Figure 7).
The model results (Figure 7 and Figure 8) demonstrate how mean soil moisture content and its temporal variability are dependent on the soil properties, such as the WRC, but also on the depth of the ground water [85,86] as well as transient water storage changes due to the weather conditions [6,36]. Landscape patterns of soil moisture are also strongly related to topography, which has given a foundation for using topographic wetness indices (TWI, DTW etc.) to approximate wetness conditions in many practical forestry applications [22,23,85,87]. These static moisture indices are, however, insensitive to weather conditions and forest management or to landscape heterogeneity beyond topography. Accounting for these factors requires process-based models.
Figure 8 shows the spatial pattern of soil moisture modifier fw for transpiration (Figure 8a), a proxy of physiological drought risk, averaged over the main growing seasons (May–Sept) in 2000–2015, forest LAI (annual maximum, Figure 8b) and site type (Figure 8c), which are both provided by the mNFI data. The data of Figure 8 are further processed in Figure 9 to better illustrate the dependency of fw on both LAI and site type. The model results suggest that drought risk can be highly variable across the landscape, driven jointly by WRC (i.e., here by site type), forest structure (LAI and species composition) and topography. In general, the peatland grid-cells and lowland areas/depressions close to streams and ditches are least prone to soil moisture limitations (Figure 8a and Figure 9). Drought risk becomes more frequent and severe on well-drained coarse textured upland soils, here the sub-xeric and particularly xeric site types, that have smaller plant available water capacity and higher hydraulic conductivity; they contribute to shallow groundwater recharge when θ > FC but do not receive moisture supply as return flow.
Increasing forest density (LAI or stem volume) has also a strong negative effect on soil moisture availability, and thus, associated drought risks increase non-linearly with LAI (Figure 8 and Figure 9). This is because both rainfall interception (less supply) and transpiration (more demand on soil water) increase with LAI, leading to stronger soil moisture depletion on denser stands [42,88,89,90]. The model results suggest that the dependency of fw on LAI is non-linear and the stronger the smaller the AWC of the site type (Figure 9, Table 2). Figure 9 further illustrates how the maximum LAI observed at the managed Paunulanpuro catchment seems to decrease with decreasing site fertility (and decreasing soil water availability).
As in our simulations, soil WRC were parameterized according to the site type means (Table 2), and the rooting depth was assumed to be constant, the variability of modeled fw within a site type (Figure 8a and Figure 9) is purely driven by LAI, species composition (different transpiration rate per unit LAI in conifer vs. deciduous trees) and groundwater influence. In reality, soil WRC, hydraulic conductivity, stoniness and rooting depth together determine the plant available water resources and their response to water supply and demand. The look-up tables or decision trees that provide the class-average hydraulic parameters developed in this study (Figure 3 and Figure 5, Table 1 and Table 2) still miss a large part of the variability of hydraulic properties within the classes or at specific sites. The class PTFs provide a simple means to characterize WRC and are generally favored in land surface and ecosystem modeling [29,30]. As shown in this study, the incapability of open data to provide features that predict soil hydraulic properties (Section 3.2) means the rather coarse site type specific WRC properties may remain our best approach, unless we have access to detailed soil properties.
Moreover, generalizations and predictive functions on how stoniness relates to site type, geomorphology and topography, as well as on bedrock or impermeable layer depths in forests, are still lacking. Knowing these factors is necessary to quantitatively and accurately model forest soil moisture and its physiological impacts on forests. As practical constraints to measure them at sufficient resolution and extent to cover the heterogeneity will persist in the future, assimilating plant stress indices [91,92,93] and forest soil hydrological state from optical and radar (e.g., SAR) remote sensing [94,95,96,97] to spatially distributed ecohydrological and forest models could offer an alternative (indirect) approach to improve forest soil moisture [98,99] and drought risk [100] predictions.

4. Conclusions

We statistically analyzed the means and variability of water retention characteristics of mineral forest soils in Finland, focusing on the humus layer and main mineral soil root zone (0–19 cm depth). We showed that based on water retention characteristics, mineral forest soils in Finland can be grouped to five distinct classes that are well predictable from measured soil bulk density, organic matter content and clay fraction. However, ca. 75% of the soil samples studied belong to classes C4 and C5, indicating that the majority of mineral forest soils in Finland are hydrologically rather similar. We found that the distinct WRC classes had no connection to topsoil maps (soil type), and the WRC could not be predicted by any combination of open geospatial data. We thus propose parameterizing water retention characteristics as a function of forest site (fertility) type as the current best approach to estimate hydraulic properties for spatially distributed hydrological and biogeochemical models. We demonstrated the use of this approach in soil moisture dynamics and drought risk modeling in a small forest headwater catchment in Southern Finland. We illustrated how soil moisture response to weather conditions is affected by soil hydraulic properties, stand attributes and topography. We also showed that drought risks are likely to be highest on mature forests on nutrient-poor sites, and lowest in young stands on peatlands and herb-rich sites on lowlands with groundwater influence. The results will enable more accurate hydrological predictions for Finnish forests, and the open dataset can contribute to larger synthesis and the further development of boreal forest soil pedo-transfer functions.

Supplementary Materials

The following supporting information can be downloaded at: https://www.mdpi.com/article/10.3390/f13111797/s1. Figure S1: Mualem-vanGenuchten water-retention curve and physical properties in 0–19 cm depth for the five clusters (C1–C5). N is the number of samples in each group. See Table 1 for summary of the physical properties; Figure S2: Mualem-van Genuchten water-retention curve (Equation (1)) and physical properties in 0–19 cm depth in mineral soil grouped by site-type. The site-type productivity decreases from herb-rich to and xeric sites. N is the number of samples in each group. See Table 2 for summary of the physical properties; Figure S3: The variability of soil physical and hydrological properties among forest site-types, and across NFI grainsize observation within a site-type. Db (g cm−3) is bulk density, LOI organic matter content (mass %) TP, FC, WP and AWC total porosity, field capacity, wilting point and plant available water (m3m−3), respectively. The lowest row shows topographic wetness (TWI) and depth-to-water index (DTW) and terrain ruggedness index (tri), respectively. The site fertility decreases from herb-rich to xeric; Figure S4: The variability of soil physical and hydrological properties among categories from the most accurate soil maps in Finland. Db (g cm−3) is bulk density, LOI organic matter content (mass %) TP, FC, WP and AWC total porosity, field capacity, wilting point and plant available water (m3m−3), respectively. The lowest row shows topographic wetness (TWI) and depth-to-water index (DTW) and terrain ruggedness index (tri), respectively; Figure S5: Inter-annual variability of soil moisture (θ) at the driest 5% of grid cells within each site type at Paunulanpuro catchment in Southern Finland. The black lines show 2000–2015 median for given day of year, the dark shade the IQR (25th/75th) and light shade 2.5th/97.5th percentiles. The site-type color is as in Figure 8c and Figure 9. The dashed horizontal lines indicate field capacity and wilting point and their difference plant available water (AWC, Table 2). Note y-axis scale in (a) is different to other panels; Table S1. Examined open geospatial data, their resolution, and source.

Author Contributions

Study conceptualization, S.L. and J.H.; methodology, S.L., A.-J.K. and J.H.; software and formal analysis, S.L., A.S. and A.-J.K.; water retention measurements and data curation, J.H., H.I., A.-J.K. and A.-J.L.; visualization, A.-J.K. and S.L.; writing—original draft preparation, S.L. and J.H. with contribution from all co-authors; writing—review and editing, S.L. with contribution from all co-authors; funding acquisition, H.I., J.H., A.-J.L. and S.L. All authors have read and agreed to the published version of the manuscript.

Funding

The soil hydrological properties were measured in EU BioSoil programme and as part of ICP forest health monitoring (EU/Life+ FutMon Programme). The work was funded by the Ministry of Agricultural and Forestry of Finland (project Maaperätiedon kehittäminen, 2021–2022). SL acknowledges financial support from the Academy of Finland (no. 296116 and 348102) and Formas (no. 2018-01820).

Data Availability Statement

The dataset on soil hydrological and physical properties, selected NFI and open data variables, and fitted water retention function parameters for each sample are available as an electronic supplement at https://doi.org/10.5281/zenodo.7197865 under the terms and conditions of the Creative Commons Attribution (CC BY) license (https://creativecommons.org/licenses/by/4.0/) or under the terms and conditions of MIT License in case of research software.

Acknowledgments

The Finnish National Forest Inventory and ICP programmes are acknowledged for providing the field plots and supplementary measurements for the data. We are grateful to field personnel who conducted the soil sampling and sample preparation.

Conflicts of Interest

The authors declare no conflict of interest.

References

  1. Burger, J.A.; Kelting, D.L. Using soil quality indicators to assess forest stand management. For. Ecol. Manag. 1999, 122, 155–166. [Google Scholar] [CrossRef]
  2. Schoenholtz, S.H.; Van Miegroet, H.; Burger, J.A. A review of chemical and physical properties as indicators of forest soil quality: Challenges and opportunities. For. Ecol. Manag. 2000, 138, 335–356. [Google Scholar] [CrossRef]
  3. Drobnik, T.; Greiner, L.; Keller, A.; Grêt-Regamey, A. Soil quality indicators—From soil functions to ecosystem services. Ecol. Indic. 2018, 94, 151–169. [Google Scholar] [CrossRef]
  4. Western, A.W.; Grayson, R.B.; Blöschl, G. Scaling of soil moisture: A hydrologic perspective. Annu. Rev. Earth Planet. Sci. 2002, 30, 149–180. [Google Scholar] [CrossRef] [Green Version]
  5. Teuling, A.J.; Troch, P.A. Improved understanding of soil moisture variability dynamics. Geophys. Res. Lett. 2005, 32, L05404. [Google Scholar] [CrossRef] [Green Version]
  6. Daly, E.; Porporato, A. A review of soil moisture dynamics: From rainfall infiltration to ecosystem response. Environ. Eng. Sci. 2005, 22, 9–24. [Google Scholar] [CrossRef]
  7. Famiglietti, J.S.; Ryu, D.; Berg, A.A.; Rodell, M.; Jackson, T.J. Field observations of soil moisture variability across scales. Water Resour. Res. 2008, 44, W01423. [Google Scholar] [CrossRef] [Green Version]
  8. Dong, J.; Ochsner, T.E. Soil texture often exerts a stronger influence than precipitation on mesoscale soil moisture patterns. Water Resour. Res. 2018, 54, 2199–2211. [Google Scholar] [CrossRef]
  9. Gholz, H.L.; Ewel, K.C.; Teskey, R.O. Water and forest productivity. For. Ecol. Manag. 1990, 30, 1–18. [Google Scholar] [CrossRef]
  10. Henttonen, H.M.; Mäkinen, H.; Heiskanen, J.; Peltoniemi, M.; Laurén, A.; Hordo, M. Response of radial increment variation of Scots pine to temperature, precipitation and soil water content along a latitudinal gradient across Finland and Estonia. Agrig. For. Meteorol. 2014, 198–199, 294–308. [Google Scholar] [CrossRef]
  11. Pastor, J.; Post, W.M. Influence of climate, soil moisture, and succession on forest carbon and nitrogen cycles. Biogeochemistry 1986, 2, 3–27. [Google Scholar] [CrossRef]
  12. Neary, D.G.; Ice, G.G.; Jackson, C.R. Linkages between forest soils and water quality and quantity. For. Ecol. Manag. 2009, 258, 2269–2281. [Google Scholar] [CrossRef]
  13. Stielstra, C.M.; Lohse, K.A.; Chorover, J.; McIntosh, J.C.; Barron-Gafford, G.A.; Perdrial, J.N.; Litvak, M.; Barnard, H.R.; Brooks, P.D. Climatic and landscape influences on soil moisture are primary determinants of soil carbon fluxes in seasonally snow-covered forest ecosystems. Biogeochemistry 2015, 123, 447–465. [Google Scholar] [CrossRef]
  14. Luk, S.H. Effect of antecedent soil moisture content on rainwash erosion. Catena 1985, 12, 129–139. [Google Scholar] [CrossRef]
  15. Wei, L.; Zhang, B.; Wang, M. Effects of antecedent soil moisture on runoff and soil erosion in alley cropping systems. Agric. Water Manag. 2007, 94, 54–62. [Google Scholar] [CrossRef]
  16. Dorman, M.; Perevolotsky, A.; Sarris, D.; Svoray, T. The effect of rainfall and competition intensity on forest response to drought: Lessons learned from a dry extreme. Oecologia 2015, 177, 1025–1038. [Google Scholar] [CrossRef]
  17. Busscher, W.J.; Bauer, P.J.; Camp, C.R.; Sojka, R.E. Correction of cone index for soil water content differences in a coastal plain soil. Soil Tillage Res. 1997, 43, 205–2137. [Google Scholar] [CrossRef]
  18. Batey, T. Soil compaction and soil management—A review. Soil Use Manag. 2009, 25, 335–345. [Google Scholar] [CrossRef]
  19. Uusitalo, J.; Ala-Ilomäki, J.; Lindeman, H.; Toivio, J.; Siren, M. Modelling soil moisture—Soil strength relationship of fine-grained upland forest soils. Silva Fenn. 2015, 53, 10050. [Google Scholar] [CrossRef]
  20. Sirén, M.; Salmivaara, A.; Ala-Ilomäki, J.; Launiainen, S.; Lindeman, H.; Uusitalo, J.; Sutinen, R.; Hänninen, P. Predicting forwarder rut formation on fine-grained mineral soils. Scand. J. For. Res. 2019, 34, 145–154. [Google Scholar] [CrossRef]
  21. Heiskanen, J.; Hallikainen, V.; Salmivaara, A.; Uusitalo, J.; Ilvesniemi, H. Predictive models to determine fine soil fractions and organic matter from readily available soil and terrain data of soils under boreal forest. Geoderma Reg. 2020, 20, e00251. [Google Scholar] [CrossRef]
  22. Vega-Nieva, D.J.; Murphy, P.N.; Castonguay, M.; Ogilvie, J.; Arp, P.A. A modular terrain model for daily variations in machine-specific forest soil trafficability. Can. J. Soil. Sci. 2009, 89, 93–109. [Google Scholar] [CrossRef]
  23. Salmivaara, A.; Launiainen, S.; Perttunen, J.; Nevalainen, P.; Pohjankukka, J.; Ala-Ilomäki, J.; Sirén, M.; Laurén, A.; Tuominen, S.; Uusitalo, J.; et al. Towards dynamic forest trafficability prediction using open spatial data, hydrological modelling and sensor technology. Forestry 2020, 93, 662–674. [Google Scholar] [CrossRef]
  24. Tavankar, F.; Picchio, R.; Nikooy, M.; Jourgholami, M.; Latterini, F.; Venanzi, R. Effect of soil moisture on soil compaction during skidding operations in poplar plantation. Int. J. For. Eng. 2021, 32, 128–139. [Google Scholar] [CrossRef]
  25. Mäkelä, A.; Landsberg, J.; Ek, A.R.; Burk, T.E.; Ter-Mikaelian, M.; Ågren, G.I.; Chadwick, D.O.; Puttonen, P. Process-based models for forest ecosystem management: Current state of the art and challenges for practical implementation. Tree Phys. 2000, 20, 289–298. [Google Scholar] [CrossRef]
  26. Nordström, E.M.; Nieuwenhuis, M.; Başkent, E.Z.; Biber, P.; Black, K.; Borges, J.G.; Bugalho, M.N.; Corradini, G.; Corrigan, E.; Eriksson, L.O.; et al. Forest decision support systems for the analysis of ecosystem services provisioning at the landscape scale under global climate and market change scenarios. Eur. J. For. Res. 2009, 138, 561–581. [Google Scholar] [CrossRef]
  27. Laurén, A.A.; Guan, M.; Salmivaara, A.; Leinonen, A.; Palviainen, M.; Launiainen, S. NutSpaFHy—A Distributed Nutrient Balance Model to Predict Nutrient Export from Managed Boreal Headwater Catchments. Forests 2021, 12, 808. [Google Scholar] [CrossRef]
  28. Goude, M.; Nilsson, U.; Mason, E.; Vico, G. Using hybrid modelling to predict basal area and evaluate effects of climate change on growth of Norway spruce and Scots pine stands. Scand. J. For. Res. 2022, 37, 59–73. [Google Scholar] [CrossRef]
  29. Wösten, J.H.M.; Pachepsky, Y.A.; Rawls, W.J. Pedotransfer functions: Bridging the gap between available basic soil data and missing soil hydraulic characteristics. J. Hydrol. 2001, 251, 123–150. [Google Scholar] [CrossRef]
  30. Van Looy, K.; Bouma, J.; Herbst, M.; Koestel, J.; Minasny, B.; Mishra, U.; Montzka, C.; Nemes, A.; Pachepsky, Y.A.; Padarian, J.; et al. Pedotransfer functions in Earth system science: Challenges and perspectives. Rev. Geophys. 2017, 55, 1199–1256. [Google Scholar] [CrossRef]
  31. Tóth, B.; Weynants, M.; Nemes, A.; Makó, A.; Bilas, G.; Tóth, G. New generation of hydraulic pedotransfer functions for Europe. Eur. J. Soil Sci. 2015, 66, 226–238. [Google Scholar] [CrossRef]
  32. Puhlmann, H.; von Wilpert, K. Pedotransfer functions for water retention and unsaturated hydraulic conductivity of forest soils. J. Plant Nutr. Soil Sci. 2012, 175, 221–235. [Google Scholar] [CrossRef]
  33. Hewelke, P.; Gnatowski, T.; Hewelke, E.; Tyszka, J.; Zakowicz, S. Analysis of Water Retention Capacity for Select Forest Soils in Poland. Pol. J. Environ. Stud. 2015, 24, 1013–1019. [Google Scholar] [CrossRef]
  34. Heiskanen, J. Metsämaan vedenpidätyskyvystä ja sen suhteista eräisiin kasvupaikasta mitattuihin tunnuksiin. Licentiate Thesis, University of Helsinki, Department of Silviculture, Helsinki, Finland, 1988; p. 92. [Google Scholar]
  35. Westman, C.J. Soil physical and physico-chemical properties of Finnish upland forest sites. Silva Fenn. 1990, 24, 141–158, (In Finnish with English summary). [Google Scholar] [CrossRef] [Green Version]
  36. Heiskanen, J.; Mäkitalo, K. Soil water-retention characteristics of Scots pine and Norway spruce forest sites in Finnish Lapland. For. Ecol. Manag. 2002, 162, 137–152. [Google Scholar] [CrossRef]
  37. Jauhiainen, M. Relationships of Particle Size Distribution Curve, Soil Water Retention Curve and Unsaturated Hydraulic Conductivity and Their Implications on Water Balance of Forested and Agricultural Hillslopes. Helsinki University of Technology Water Resources Publications. 2004, Volume 12, p. 164. Available online: http://urn.fi/urn:nbn:fi:tkk-003835 (accessed on 15 May 2022).
  38. Heiskanen, J.; Mäkitalo, K.; Hyvönen, J. Long-term influence of site preparation on water-retention characteristics of forest soil in Finnish Lapland. For. Ecol. Manag. 2007, 241, 127–133. [Google Scholar] [CrossRef]
  39. Mäkitalo, K. Soil Hydrological Properties and Conditions, Site Preparation, and the Long-Term Performance of Planted Scots Pine (Pinus sylvestris L.) on Upland Forest Sites in Finnish Lapland. Dissertationes Forestales, University of Helsinki, Helsinki, Finland, 2009. [Google Scholar] [CrossRef] [Green Version]
  40. Päivänen, J. Hydraulic conductivity and water retention in peat soils. Acta For. Fenn. 1973, 129, 7563. [Google Scholar] [CrossRef] [Green Version]
  41. Sun, N.; Wigmosta, M.; Zhou, T.; Lundquist, J.; Dickerson-Lange, S.; Cristea, N. Evaluating the functionality and streamflow impacts of explicitly modelling forest–snow interactions and canopy gaps in a distributed hydrologic model. Hydrol. Proc. 2018, 32, 2128–2140. [Google Scholar] [CrossRef]
  42. Launiainen, S.; Guan, M.; Salmivaara, A.; Kieloaho, A.J. Modeling boreal forest evapotranspiration and water balance at stand and catchment scales: A spatial approach. Hydrol. Earth Syst. Sci. 2019, 23, 3457–3480. [Google Scholar] [CrossRef]
  43. Mäkisara, K.; Katila, M.; Peräsaari, J.; Tomppo, E. The multi-source national forest inventory of Finland–methods and results 2013. Nat. Resour. Bioeconomy Stud. 2016, 10, 215. Available online: http://urn.fi/URN:ISBN:978-952-326-186-0 (accessed on 15 May 2022).
  44. Salmivaara, A. DTW-Kosteusindeksikartta, 2m. CSC—Tieteen Tietotekniikan Keskus Oy. 2020. Available online: http://urn.fi/urn:nbn:fi:att:3403a010-b9d0-4948-8f9f-2bc4ca763897 (accessed on 15 May 2022).
  45. Salmivaara, A.; Launiainen, S.; Tuominen, S.; Ala-Ilomäki, J.; Finér, L. Topographic Wetness Index for Finland. Natural Resources Institute Finland 2017, Etsin Research Data Finder, CSC (Distributor). Available online: http://urn.fi/urn:nbn:fi:csc-kata20170511113233803176 (accessed on 1 April 2022).
  46. Seibert, J.; Stendahl, J.; Sørensen, R. Topographical influences on soil properties in boreal forests. Geoderma 2007, 141, 139–148. [Google Scholar] [CrossRef]
  47. Geroy, I.J.; Gribb, M.M.; Marshall, H.P.; Chandler, D.G.; Benner, S.G.; McNamara, J.P. Aspect influences on soil water retention and storage. Hydrol. Proc. 2011, 25, 3836–3842. [Google Scholar] [CrossRef]
  48. Mualem, Y. A new model predicting the hydraulic conductivity of unsaturated porous media. Water Resour. Res. 1976, 12, 513–522. [Google Scholar] [CrossRef] [Green Version]
  49. van Genuchten, M.T. A closed-form equation for predicting the hydraulic conductivity of unsaturated soils. Soil Sci. Soc. Am. J. 1980, 44, 892–898. [Google Scholar] [CrossRef] [Green Version]
  50. Heiskanen, J.; Hallikainen, V.; Uusitalo, J.; Ilvesniemi, H. Co-variation relations of physical soil properties and site characteristics of Finnish upland forests. Silva Fenn. 2018, 52, 9948. [Google Scholar] [CrossRef]
  51. Derome, J.; Lindgren, M.; Merilä, P.; Beuker, E.; Nöjd, P. Forest Condition Monitoring under the UN/ECE and EU Pro-grammes in Finland. In For. Cond. Monit. Finl.–Natl. Rep.; 2007; Volume 45, pp. 11–20. [Google Scholar]
  52. Merilä, P.; Mustajärvi, K.; Helmisaari, H.-S.; Hilli, S.; Lindroos, A.-J.; Nieminen, T.M.; Nöjd, P.; Rautio, P.; Salemaa, M.; Ukonmaanaho, L. Above- and below-ground N stocks in coniferous boreal forests in Finland: Implications for sustainability of more intensive biomass utilization. For. Ecol. Manag. 2014, 311, 17–28. [Google Scholar] [CrossRef]
  53. Elonen, P. Particle-size analysis. Acta Agrar. Fenn. 1971, 112, 122. [Google Scholar]
  54. Dumroese, K.R.; Heiskanen, J.; Tervahauta, A.; Englund, K. Pelleted biochar: Chemical and physical properties show potential use as a substrate in container nurseries. Biomass Bioenergy 2011, 35, 2018–2027. [Google Scholar] [CrossRef]
  55. Cools, N.; De Vos, B. Part X: Sampling and Analysis of Soil. In Manual on Methods and Criteria for Harmonized Sampling, Assessment, Monitoring and Analysis of the Effects of Air Pollution on Forests; UNECE ICP Forests Programme Co-ordinating Centre, Ed.; Thunen Institute of Forest Ecosystems: Eberswalde, Germany, 2020; 29p + Annex. [Google Scholar]
  56. Heiskanen, J. Comparison of three methods for determining the particle density of soil with liquid pycnometers. Commun. Soil. Sci. Plant Anal. 1992, 23, 841–846. [Google Scholar] [CrossRef]
  57. Al Majou, H.; Bruand, A.; Duval, O. The use of in situ volumetric water content at field capacity to improve prediction of soil water retention properties. Can. J. Soil Sci. 2008, 88, 533–541. [Google Scholar] [CrossRef] [Green Version]
  58. Jackson, R.B.; Canadell, J.; Ehleringer, J.R.; Mooney, H.A.; Sala, O.E.; Schulze, E.D. A global analysis of root distributions for terrestrial biomes. Oecologia 1996, 108, 389–411. [Google Scholar] [CrossRef] [PubMed]
  59. Finér, L.; Ohashi, M.; Noguchi, K.; Hirano, Y. Factors causing variation in fine root biomass in forest ecosystems. For. Ecol. Manag. 2011, 261, 265–277. [Google Scholar] [CrossRef]
  60. Newville, M.; Stensitzki, T.; Allen, D.B.; Ingargiola, A. LMFIT: Non-Linear Least-Square Minimization and Curve-Fitting for Python (0.8.0). Zenodo 2014, 790, 93. [Google Scholar] [CrossRef]
  61. Everitt, B.S.; Landau, S.; Leese, M.; Stahl, D. An introduction to classification and clustering. In Cluster Analysis; John Wiley & Sons: Hoboken, NJ, USA, 2011; Volume 5, pp. 1–13. ISBN 978-0-470-97780-4. [Google Scholar]
  62. Sorensen, T. A Method of Establishing Groups of Equal Amplitude in Plant Sociology Based on Similarity of Species Content and Its Application to Analyses of the Vegetation on Danish Commons. Biol. Skr. K. Dan. Vidensk. Selsk. 1948, 5, 1–34. [Google Scholar]
  63. Breiman, L. (Ed.) Classification and Regression Trees; Routledge: New York, NY, USA, 2017; 368p. [Google Scholar] [CrossRef]
  64. Pedregosa, F.; Varoquaux, G.; Gramfort, A.; Michel, V.; Thirion, B.; Grisel, O.; Blondel, M.; Prettenhofer, P.; Weiss, R.; Dubourg, V.; et al. Scikit-learn: Machine learning in Python. J. Mach. Learn. Res. 2011, 12, 2825–2830. [Google Scholar]
  65. Geological Survey of Finland. Superficial Deposits 1:20,000/1:50,000/1:200,000. 2021. Available online: https://hakku.gtk.fi (accessed on 15 May 2022).
  66. Cajander, A.K. Forest types and their significance. Acta For. Fenn. 1949, 56, 7396. [Google Scholar] [CrossRef] [Green Version]
  67. Aaltonen, H.; Tuukkanen, T.; Palviainen, M.; Laurén, A.; Tattari, S.; Piirainen, S.; Mattsson, T.; Ojala, A.; Lauiainen, S.; Finér, L. Controls of Organic Carbon and Nutrient Export from Unmanaged and Managed Boreal Forested Catchments. Water 2021, 13, 2363. [Google Scholar] [CrossRef]
  68. Beven, K.; Kirkby, M.J. A physically based, variable contributing area model of basin hydrology. Hydrolog. Sci. J. 1979, 24, 43–69. [Google Scholar]
  69. Laurén, A.; Heiskanen, J. Physical properties of the mor layer in a Scots pine stand: I Hydraulic conductivity. Can. J. Soil Sci. 1997, 77, 627–634. [Google Scholar] [CrossRef]
  70. Laurén, A.; Mannerkoski, H. Hydraulic Properties of Mor Layers in Finland. Scand. J. For. Res. 2001, 16, 429–441. [Google Scholar] [CrossRef]
  71. Heiskanen, J. Variation in water retention characteristics of peat growth media used in tree nurseries. Silva Fenn. 1993, 27, 5503. [Google Scholar] [CrossRef] [Green Version]
  72. Tamminen, P.; Tomppo, E. Finnish Forest Soils. Working Papers of the Finnish Forest Research Institute. 2008, Volume 100. 21p. Available online: http://urn.fi/URN:ISBN:978-951-40-2139-8 (accessed on 15 May 2022).
  73. Kurki, M. Summary: Soil classes of Finnish agricultural soils with special reference to their mull contents and acidity. Suo 1972, 23, 57–62. Available online: http://www.suo.fi/article/9401 (accessed on 15 May 2022).
  74. Sims, R.; Baldwin, K.; Kershaw, M.; Wang, Y. Tree species relation to soil moisture regime in northwestern Ontario. Environ. Monit. Assessm. 1996, 39, 471–484. [Google Scholar] [CrossRef]
  75. Wang, G.; Klinka, K. Classification of moisture and aeration regimes in sub-boreal forest soils. Environ. Monit. Assessm. 1996, 39, 451–469. [Google Scholar] [CrossRef]
  76. Salemaa, M.; Derome, J.; Nöjd, P. Response of boreal forest vegetation to the fertility status of the organic layer along a climatic gradient. Bor. Environ. Res. 2008, 13, 48–66. Available online: http://www.borenv.net/BER/archive/pdfs/ber13/ber13-B048.pdf (accessed on 1 April 2022).
  77. Sepponen, P.; Lähde, E.; Roiko-Jokela, P. On the relationship of the forest vegetation and the soil physical properties in Finnish Lapland. Folia For. 1979, 402, 1–31. Available online: http://urn.fi/URN:ISBN:951-40-0406-X (accessed on 1 April 2022).
  78. Urvas, L.; Erviö, R. Abstract: Influence of the soil type and the chemical properties of soil on determing of the forest type. J. Sci. Agric. Soc. Finl. 1974, 46, 307–319. [Google Scholar]
  79. Tamminen, P. Expression of soil nutrient status and regional variation in soil fertility of forested sites in southern Finland. Folia For. 1991, 777, 247–260. Available online: http://urn.fi/URN:ISBN:951-40-1170-8 (accessed on 1 April 2022).
  80. Tissari, S.; Nykänen, V.; Lerssi, J.; Kolehmainen, M. Classification of Soil Groups Using Weights-of-Evidence-Method and RBFLN-Neural Nets. Nat. Resour. Res. 2007, 16, 159–169. [Google Scholar] [CrossRef]
  81. Haavisto, M. (Ed.) Maaperäkartan Käyttöopas [Manual for Superficial Deposits Maps] (in Finnish) 1:20 000, 1:50 000; Opas 10; Geologinen TutkiMuslaitos: Espoo, Finland, 1983; 80p. [Google Scholar]
  82. Pachepsky, Y.A.; Timlin, D.J.; Rawls, W.J. Soil water retention as related to topographic variables. Soil Sci. Soc. Am. J. 2001, 65, 1787–1795. [Google Scholar] [CrossRef] [Green Version]
  83. Guio Blanco, C.M.; Brito Gomez, V.M.; Patricio, C.; Mareike, L. Spatial prediction of soil water retention in a Páramo landscape: Methodological insight into machine learning using random forest. Geoderma 2018, 316, 100–114. [Google Scholar] [CrossRef]
  84. Grabs, T.; Seibert, J.; Bishop, K.; Laudon, H. Modeling spatial patterns of saturated areas: A comparison of the topographic wetness index and a dynamic distributed model. J. Hydrol. 2009, 373, 15–23. [Google Scholar] [CrossRef] [Green Version]
  85. Beldring, S.; Gottschalk, L.; Seibert, J.; Tallaksen, L.M. Distribution of soil moisture and groundwater levels at patch and catchment scales. Agric. For. Meteorol. 1999, 98, 305–324. [Google Scholar] [CrossRef]
  86. Larson, J.; Lidberg, W.; Ågren, A.M.; Laudon, H. Predicting soil moisture across a heterogeneous boreal catchment using terrain indices. Hydrol. Earth Syst. Sci. 2022, 26, 4837–4851. [Google Scholar] [CrossRef]
  87. White, B.; Ogilvie, J.; Campbell, D.M.; Hiltz, D.; Gauthier, B.; Chisholm, H.K.H.; Wen, H.K.; Murphy, P.; Arp, P.A. Using the cartographic depth-to-water index to locate small streams and associated wet areas across landscapes. Can. Water Resour. J. 2012, 37, 333–347. [Google Scholar] [CrossRef]
  88. Hoff, C.; Rambal, S. An examination of the interaction between climate, soil and leaf area index in a Quercus ilex ecosystem. Ann. For. Sci. 2003, 60, 153–161. [Google Scholar] [CrossRef] [Green Version]
  89. Andrews, C.M.; D’Amato, A.W.; Fraver, S.; Palik, B.; Battaglia, M.A.; Bradford, J.B. Low stand density moderates growth declines during hot droughts in semi-arid forests. J. Appl. Ecol. 2020, 57, 1089–1102. [Google Scholar] [CrossRef]
  90. Miralles, D.G.; Gash, J.H.; Holmes, T.R.; de Jeu, R.A.; Dolman, A.J. Global canopy interception from satellite observations. J. Geophys. Res. Atmosp. 2010, 115, D16122. [Google Scholar] [CrossRef]
  91. Rock, B.N.; Vogelmann, J.E.; Williams, D.L.; Vogelmann, A.F.; Hoshizaki, T. Remote Detection of Forest Damage: Plant responses to stress may have spectral “signatures” that could be used to map, monitor, and measure forest damage. Bioscience 1986, 36, 439–445. [Google Scholar] [CrossRef]
  92. Lausch, A.; Erasmi, S.; King, D.J.; Magdon, P.; Heurich, M. Understanding forest health with remote sensing-part I—A review of spectral traits, processes and remote-sensing characteristics. Remote Sens. 2016, 8, 1029. [Google Scholar] [CrossRef] [Green Version]
  93. Lausch, A.; Erasmi, S.; King, D.J.; Magdon, P.; Heurich, M. Understanding forest health with remote sensing-part II—A review of approaches and data models. Remote Sens. 2017, 9, 129. [Google Scholar] [CrossRef] [Green Version]
  94. Bourgeau-Chavez, L.L.; Kasischke, E.S.; Riordan, K.; Brunzell, S.; Nolan, M.; Hyer, E.; Slawski, J.; Medvecz, M.; Walters, T.; Ames, S. Remote monitoring of spatial and temporal surface soil moisture in fire disturbed boreal forest ecosystems with ERS SAR imagery. Int. J. Remote Sens. 2007, 28, 2133–2162. [Google Scholar] [CrossRef]
  95. Babaeian, E.; Sadeghi, M.; Jones, S.B.; Montzka, C.; Vereecken, H.; Tuller, M. Ground, proximal, and satellite remote sensing of soil moisture. Rev. Geophys. 2019, 57, 530–616. [Google Scholar] [CrossRef] [Green Version]
  96. Nicolai-Shaw, N.; Zscheischler, J.; Hirschi, M.; Gudmundsson, L.; Seneviratne, S.I. A drought event composite analysis using satellite remote-sensing based soil moisture. Remote Sens. Environ. 2017, 203, 216–225. [Google Scholar] [CrossRef]
  97. Manninen, T.; Jääskeläinen, E.; Lohila, A.; Korkiakoski, M.; Räsänen, A.; Virtanen, T.; Muhlic, F.; Marttila, H.; Ala-Aho, P.; Markovaara-Koivisto, M.; et al. Very High Spatial Resolution Soil Moisture Observation of Heterogeneous Subarctic Catchment Using Nonlocal Averaging and Multitemporal SAR Data. IEEE Trans. Geosci. Remote Sens. 2021, 60, 1–17. [Google Scholar] [CrossRef]
  98. Hartmann, H.; Moura, C.F.; Anderegg, W.R.; Ruehr, N.K.; Salmon, Y.; Allen, C.D.; Arndt, S.K.; Bershears, D.D.; Davi, H.; Galbraith, D.; et al. Research frontiers for improving our understanding of drought-induced tree and forest mortality. New Phytol. 2018, 218, 15–28. [Google Scholar] [CrossRef] [Green Version]
  99. Khaki, M.; Hendricks Franssen, H.J.; Han, S.C. Multi-mission satellite remote sensing data for improving land hydrological models via data assimilation. Sci. Rep. 2020, 10, 18791. [Google Scholar] [CrossRef]
  100. Ruiz-Pérez, G.; Vico, G. Effects of temperature and water availability on Northern European boreal forests. Front. For. Glob. Chang. 2020, 3, 34. [Google Scholar] [CrossRef]
Figure 1. The location of the BioSoil sites (black), ICP-L2 plots (yellow) and additional NFI sites (blue).
Forests 13 01797 g001
Figure 2. Water retention curve and mean statistics of the organic humus layer overlying the mineral soil. TP, FC and WP are the total porosity, field capacity and wilting point, and AWC is the available water capacity (mean (std), m3m−3). The boxplots show variability among samples (N = 102); the median is shown by an orange line, boxes are IQR and whiskers are 1st/99th percentiles. The MvG water retention curve was fitted to the mean (gray dots) of observations and the parameters shown in upper right corner. The rmse is the root mean squared error.
Forests 13 01797 g002
Figure 3. Correlation matrix between soil properties and hydraulic characteristics in the 0–19 cm layer. The values show bivariate Spearman rank correlation coefficients. The number of samples is 387, except for soil texture (clay, silt, sand) 144. For these sample sizes, the thresholds for statistically significant correlations (p < 0.05) are ±0.09 and ±0.14, respectively.
Forests 13 01797 g003
Figure 4. Clustering the data (0–19 cm layer) based on measured total porosity, field capacity and wilting point. The dendrogram shows groupings of the 387 samples starting from the root (bottom of y-axis). Based on interpretability and predictability (Figure 5 and Figure 6), the data can be divided into five distinct classes (C1–C5). The classes at the opposite edges of the x-axis are the most dissimilar.
Forests 13 01797 g004
Figure 5. Physical and hydraulic properties in the five identified clusters. The bar plots show median + IQR (whiskers represent 1st/99th percentiles and dots outliers). The cluster sizes (total N = 387) are shown in white.
Forests 13 01797 g005
Figure 6. Decision tree for predicting WRC class (C1–C5) based on bulk density (Db), organic matter content (LOI) and clay fraction. The accuracy score of the decision tree is 0.84. Samples show the percentage of original samples that belong to certain leaves (boxes). The smaller the Gini impurity index and the larger the spread across the split vector elements (0…1), the more accurate each branch division is. The tree branches end to WRC classes.
Forests 13 01797 g006
Figure 7. Seasonal variability of soil moisture (θ) at Paunulanpuro catchment in Southern Finland across grid cells at different site types. The figure was drawn by first computing mean soil daily moisture at each grid cell over the 2000–2015 period and then computing the PDFs over the grid cells belonging to each site type. The black lines show median, the dark shade the IQR (25th/75th) and light shade the 2.5th/97.5th percentiles. The site type color is as in Figure 8c and Figure 9. The dashed horizontal lines indicate field capacity and wilting point as well as their difference in plant available water (AWC, Table 2). Note the y-axis scale in (a) is different to other panels.
Forests 13 01797 g007
Figure 8. The mean May–Sept soil moisture modifier (fw, a) for the 2000–2015 period at Paunulanpuro; the forest one-size leaf-area index (LAI, b) and forest site type (c) based on multi-source National Forest Inventory (mNFI) data. The values fw < 1 indicate grid cells where soil-moisture limitations can be present. The rasters overlay a topographic base map of Finland.
Forests 13 01797 g008
Figure 9. Soil moisture modifier for transpiration (fw, Figure 7a), a proxy of limited soil moisture availability, as a function of site type and stand leaf-area index (LAI). The 16 × 16 m model predictions were averaged to LAI-bins of 1 m2m−2 width and shifted slightly within a bin to avoid overlap of the boxplots. The horizontal black lines show median, box boundaries the IQR and whiskers 1st/99th percentiles.
Forests 13 01797 g009
Table 1. Characteristics of the five clusters (C1–C5). Shown are the mean (std) of physical/hydrological properties and cluster-mean MvG water-retention curve (Equation (1)) parameters. Relative proportion of site-types and NFI grain-size observations within each cluster is shown, and most frequent are shown in bold. N is the number of samples in each cluster. See Supplementary Figure S1 for MvG curves.
Site-Types Grain-Sizes
Db
(g cm−3)
LOI
(mass %)
TP
(m3m−3)
FC (m3m−3)WP (m3m−3)AWC (m3m−3)θs (m3m−3)θr
(m3m−3)
α
(kPa−1)
n (-)herb-richmesicsub-xericxericfinemed.coarseN
C10.56 (0.29)0.42
(0.30)
0.75 (0.10)0.49 (0.07)0.23 (0.06)0.27 (0.11)0.7504.451.120.50.5--0.70.20.110
C20.80 (0.21)0.14
(0.15)
0.68 (0.08)0.40 (0.07)0.12 (0.05)0.27 (0.07)0.6805.921.140.470.410.12-0.50.470.0378
C31.42 (0.20)0.04
(0.02)
0.46 (0.07)0.36 (0.04)0.22 (0.04)0.14 (0.05)0.4602.021.070.50.30.2-0.80.2-10
C41.39 (0.13)0.02
(0.01)
0.47 (0.05)0.16 (0.07)0.04 (0.02)0.11 (0.06)0.470.04.491.270.120.350.350.170.080.720.2124
C51.18 (0.18)0.05
(0.03)
0.54 (0.06)0.29 (0.06)0.09 (0.03)0.21 (0.06)0.5403.351.180.270.470.230.020.20.750.05165
Table 2. Hydraulic and physical characteristics grouped by site type. Shown are the mean (std) of physical/hydrological properties and cluster-mean MvG water-retention curve parameters (See Supplementary Figure S2). Relative proportion of NFI grain-size observations within each site type is shown. N is the number of samples in each group.
Grain-sizes
Db
(g cm−3)
LOI
(mass %)
TP
(m3m−3)
FC (m3m−3)WP (m3m−3)AWC (m3m−3)θs (m3m−3)θr
(m3m−3)
α
(kPa−1)
n (-)finemed.coarseN
herb-rich1.06 (0.30)0.09 (0.11)0.58 (0.11)0.34 (0.09)0.11 (0.06)0.22 (0.07)0.5804.671.150.420.57-127
mesic1.16 (0.30)0.07 (0.14)0.55 (0.11)0.28 (0.12)0.08 (0.05)0.20 (0.09)0.5504.541.180.250.650.09183
sub-xeric1.23 (0.23)0.04 (0.04)0.53 (0.08)0.24 (0.10)0.08 (0.05)0.16 (0.08)0.5304.291.200.10.760.14114
xeric1.36 (0.16)0.02 (0.02)0.48 (0.06)0.14 (0.07)0.04 (0.03)0.09 (0.05)0.480.034.01.370.040.640.3228
Publisher’s Note: MDPI stays neutral with regard to jurisdictional claims in published maps and institutional affiliations.

