Article

Forest Burned Area Detection Using a Novel Spectral Index Based on Multi-Objective Optimization

1
School of Geography and Environment, Jiangxi Normal University, Nanchang 330022, China
2
Key Laboratory of PoYang Lake Wetland and Watershed Research, Ministry of Education, Jiangxi Normal University, Nanchang 330022, China
3
School of Environment Science and Spatial Informatics, China University of Mining and Technology, Xuzhou 221116, China
*
Author to whom correspondence should be addressed.
Forests 2022, 13(11), 1787; https://doi.org/10.3390/f13111787
Submission received: 3 October 2022 / Revised: 17 October 2022 / Accepted: 25 October 2022 / Published: 28 October 2022
(This article belongs to the Special Issue Fire Ecology and Management in Forest)

Abstract

:
Forest fires cause environmental and economic damage, destroy large areas of land and displace entire communities. Accurate extraction of fire-affected areas is of vital importance to support post-fire management strategies and account for the environmental impact of fires. In this paper, an analytical burned area index, called ABAI, was proposed to map burned areas from the newly launched Sentinel-2 images. The innovation of this method is to separate the fire scars from other typical land covers by formulating different objective functions, which involved three main components: First, spectral differences between the burned land and other land covers were characterized by analyzing the spectral features of the existing burned area indices. Then, for each type of land cover, we formed an objective function by linear combination of bands with the values of band ratios. Second, all the objective functions and possible constraints were formulated as a multi-objective optimization problem, and then it was solved using a linear programming approach. Finally, the ABAI spectral index was achieved with the optimizing coefficients derived from the multi-objective problem. To validate the effectiveness of the proposed spectral index, three experimental datasets, clipped from Sentinel-2 images at different places, were tested and compared with baseline indices, such as normalized burned area (NBR) and burned area index (BAI) methods. Experimental results demonstrated that the injection of a green band to the spectral index has led to good applicability in burned area detection, where the ABAI can avoid most of the confusion presented by shadows or shallow water. Compared to other burned area indices, the proposed ABAI achieved the best classification accuracy, with the overall accuracy being over 90%. Visually, our approach significantly outperforms other spectral indexed methods, especially in confused areas covered by water bodies and shadows.

1. Introduction

Forest fires consume forestry resources and influence trees, vegetation, forest animals and plants, soil and microbial growth. Fires also adversely influence the ecological system, atmospheric environment and global change [1,2,3]. Burned area and burn severity are the two most widely used metrics to provide crucial information for assessing fire effects and carbon consumption [4], such as fire regimes and vegetation loss. In addition, the proper characterization of fire effects can not only be useful to quantify post-fire phenomena, such as air emissions, soil erosion and vegetation recovery, but also help understand fire behavior under potential future climates at local, regional and global levels [5,6,7]. The assessment of forest fire damage and disaster levels must be objective. Therefore, accurately mapping the burned areas and monitoring the effects of fire events, including time, location and severity, are thus crucial issues in ecology and natural resource management [8,9].
After a fire, determining the total affected area, the grade of the damage and appropriate methods for vegetation rehabilitation are the primary goals of forest management. Since satellite-based remote sensing can provide synoptic and repetitive data over a large geographical area, it has long been recognized as a valuable data source to monitor biomass burning and its dynamic nature at the regional to global scale [10,11,12,13,14,15,16,17,18,19]. Therefore, the extraction of burned areas from multi-resource remote sensing data has been extensively studied, and numerous methods, including spectral band segmentation [13,14,15], spectral indices [10,19,20], image supervised classification [16,17] and deep neural network [18], have been attempted to delineate burned areas over past decades. In particular, the spectral band method applies density slicing to one or more spectral bands to identify burned areas. For instance, the use of AVHRR channel 3 data for fire detection and mapping has been successfully tested in several studies [13,14,15]. Although this method can be easy to implement, the accuracy of burned land extraction is relatively low because it is often confused with clouds, water bodies and other background noise, especially in complex environments. On the other hand, the use of image supervised classification techniques, such as support vector machines [16], random forests [17] and neural networks [18], may generally achieve a higher accuracy than spectral band methods in many ecosystems, but the spectral confusion of burned areas with cloud shadows and shades from high topography variations could be difficult to separate [16]. Moreover, they are not fully automated methods since the process has to select a large number of appropriate training samples, preventing them from being applied to a large region. By contrast, the use of spectral indices is a popular and cost-effective way to extract burned areas by combining two or more spectral bands using various algebraic operations [19,20]. In essence, the spectral indices of burned scars take advantage of reflectivity differences of each band to enhance burned areas based on the analysis of signature differences between burnt areas and other land cover surfaces. The widely accepted burned land indices are probably the normalized burn ratio (NBR) [19] and the burn area index (BAI) [20], because both of them can achieve relatively precise burned land detection accuracy with a simple algebraic algorithm on pixels [19,20]. Moreover, the spectral indices can be automatically calculated without sample collection or machine learning; therefore, it is suitable for updating and monitoring forest fire dynamics on a large scale.
Recent advancements in remote sensing image acquisition technology have facilitated new approaches to map burned areas and burn severity assessment [21]. Accordingly, specific indices for burned area detection related to the availability of bands of specific sensors have been developed and successfully applied to many satellite data, such as Sentinel-2 [21,22], Landsat [23] and MODIS [24] images. However, despite the popularity of spectral indices in mapping burned areas, it is still limited in its ability to accurately characterize burned areas across different ecosystems due to spectral confusion with shaded surfaces such as cloud shadow or topography variations [25]. It is found that among various land cover classes, burned areas and water bodies, as well as clouds and shadows, are highly likely to be confused [21]. To reduce commission errors, the integration of multiple spectral indices has been attempted as a solution by taking advantage of different spectral band combinations and optimizing the detection of burned areas [22]. However, this method involves multiple thresholds to be determined, and the index threshold choice is often not objective and flexible enough to be adapted to the local conditions.
In this paper, we proposed a novel spectral index, termed ABAI, for burned area detection with multi-objective optimization. Based on the analysis of spectral bands that were adopted in widely used burned area indices and statistically spectral differences between burned lands and other land covers, the ABAI can thus be formulated as a multi-objective optimization problem. Further, the problem was solved with a linear optimization method, ultimately generating possible coefficients for each band of the index. The proposed method has several advantages, summarized as follows: Firstly, the proposed method is flexible and universal. It is an analytic method to construct relatively complex spectral indices, which is suitable for all possible multiple-channel remotely sensed data, especially for tens and hundreds of bands. Moreover, by specifying different objective functions and parameters, we can optimize the relevant ABAI indices. Secondly, the ABAI is effective for burned area detection by the multi-objective linear optimization since it takes advantage of various spectral indices to address the combination of multiple spectral bands. In particular, since the confused materials, such as shadows and water bodies, were well separated by specific objective functions, we expected that the ABAI could avoid most of the confusions presented by water or other land covers that produce false alarms. Finally, we fix the threshold to be zero in multi-objective functions, which avoids the complexity of the threshold determination procedure and facilitates the separation of burned areas from non-burned areas.
The rest of this paper is organized as follows. Section 2 proposes the concept to form the ABAI and presents the general framework for the burned area extraction. The experimental results are shown in Section 3 with multiple experiments on Sentinel-2 images. Section 4 concludes the contributions and discusses the limitations of this study.

2. Materials and Methods

2.1. Data and Study Area

Sentinel-2 satellite was first launched on 23 June 2015, equipped with multi-spectral land surface imagery by two satellites, called Sentinel-2A and Sentinel-2B, and with a high revisit cycle of 5 days at the equator. The description of their bands with associated central wavelengths and spatial resolutions is reported in Table 1. More details can be found at https://sentinel.esa.int/web/sentinel/missions/sentinel-2, accessed on 21 April 2022.
As can be seen in Table 1, the image in a single instrument collects 13 spectral bands with spatial resolution ranging from 10 to 60 m in the visible, near-infrared (VNIR) and short-wave infrared (SWIR) spectral bands. Note that the cirrus band 10 is omitted in the subsequent process, as it does not contain surface information. The arrangement of spatial and temporal resolutions of the Sentinel-2 images ensures that differences in vegetation status over time are captured while minimizing the impact on the quality of atmospheric photography. Moreover, the Sentinel-2 datasets are provided free of charge by the European Space Agency (ESA). Therefore, the Sentinel-2 images are preferable to validate the newly developed algorithm in different scenarios. Three experimental datasets clipped from two Sentinel-2 sensors were collected to evaluate the effectiveness of the proposed method, as shown in Table 2. It should be noted that we have collected bi-temporal images (before and after the fire event) for human interpretation to provide reliable reference datasets, although only post-fire images were used for implementation. For all the images, a pre-processing procedure, including radiometric calibration and atmospheric correction has been conducted with the plugin tool ‘Sen2Cor’ which can be freely available at http://step.esa.int/main/snap-supported-plugins/sen2cor/, accessed on 9 May 2022, and then the spatial resolution of all bands were resampled into 10 m with a bilinear interpolation.
The first study area is located in Qinyuan County, the south-central part of Shanxi Province, China, with the longitude and latitude ranging from 111°58′30′′ E to 112°32′30′′ E and 36°20′20′′ N to 37°00′42′′ N, respectively. It is a warm temperate continental monsoon climate zone, and the forest coverage rate is close to 60% [26], which is mainly covered by closed evergreen needle-leaved forest, and the dominant tree species are Pinus tabuliformis Carrière, Populus alba L. and Larix decidua Mill. In addition, this area contains a relatively complex land surface, consisting of typical land-cover types, such as buildings, water, vegetation, road, and bare land. On 29 March 2019, a severe forest fire broke out near Guojiaping Village, Wangtao Township, Qinyuan County. Due to the strong winds, in addition to the flammable Pinus tabuliformis Carrière, the fire spread rapidly and covered an area of 360 ha in less than one day. The active fires were distinguished on April 4, and the burned area was estimated over 100 km2. Due to the data quality of available images, we selected the Sentinel 2 data acquisition on 10 June 2019 for burned area mapping, because it is the nearest date to having good image quality where the percentage of cloud cover is less than 5%. In light of the serious damage caused by this fire event, the disaster-affected areas with high forest coverage and typical land cover surfaces, it was selected as the test case for validating the proposed index.
The second study area is located in the Anning River Valley area in Xichang City, with the longitude and latitude ranging from 101°46′ E to 102°25′ E and 27°32′ N to 28°10′ N, respectively, located in the southwestern part of Sichuan Province. This area belongs to the tropical highland monsoon climate zone, and the tree species are dominated by closed deciduous broadleaved forest, closed evergreen needle-leaved forest and grassland. Due to its special geographical environment, forest types and climatic conditions, it has always been an area with a high incidence of forest fires. On 30 March 2020, a forest fire started at a rolling hills site with an altitude of about 1800 m in Jingjiu Township, Xichang City, and accordingly, the image acquired on 9 April 2020 was used for the experiment. The incident burned an area of 3000 ha, and a preliminary estimate of the damaged area was about 280 ha. The burned areas are mostly covered by pure forests of flammable Pinus yun-nanensis Franch., Prunus spinosa L., Acacia confusa Merr. and Quercus palustris Münchh., with shrubs and dried herbs widely distributed in the understory. Due to the special forest species and mountainous shadows, it was also selected as an experimental area to test the performances of the ABAI.
On the other hand, it has been widely accepted that the water bodies and urban areas are common types of surfaces to generate spectral confusions with burned areas [25,27]. Therefore, the final dataset was used to test the performances of different spectral indices to separate burned areas from shallow water. To this aim, the third image, covering the northeastern part of Sicily, Italy, was obtained for the experiment. The study area is located in the longitude and latitude ranging from 15°30′ E to 15°40′ E and 38°10′ N to 38°20′ N, and most of it is surrounded by the sea, except in the southwestern part. In this study area, the coastal areas are heavily inhabited and urbanized, and the inland areas are predominantly rural, characterized by the dense vegetation of the Peloritani mountains. As a result, the vegetation in this area is very diversified and particularly prone to bush fires [19]. Similar to reference [21], the Sentinel-2 image acquired on 23 August 2019, was selected to represent the post-fire scenario after a fire occurrence. Geographical locations of the three study areas are shown in Figure 1.

2.2. Methodology

This section describes the framework for constructing the analytical burned area index (ABAI) using Sentinel-2 multi-spectral images and demonstrates the performance of this index. The workflow of the methodology is shown in Figure 2. In particular, some widely used indices in the literature were first reviewed to generalize the common law from their relevant formulas and specify the bands used in these indices to build the proposed index.
Note that it is the numerator, rather than the denominator, that plays a crucial role in the extraction of burned area pixels, so only the numerator parts of those indices are listed in Figure 2. Then, the spectral characteristics of typical land covers were sampled from different images to provide statistical reflectance. Since we aim to separate the burned land from other land covers, seven typical land covers, i.e., road, water, building, vegetation, bare land, shadow and cloud, were selected for the spectral analysis in our study because their reflectance shows similar spectral characteristics to that of burned land in one or more bands. Subsequently, for each land cover, we established a linear objective function to distinguish it from burned land. A muti-objective optimization problem can thus be evolved, taking full consideration of all land covers with the possibility of being confused. Finally, the ABAI can be constructed by solving the muti-objective problem with a linear or integer programming approach. Moreover, the reasons that determined the formulation of the proposed index are explained.

2.2.1. Some Existing Spectral Indices

To distill all the possible spectral bands for delineating burned lands, some widely used indices in the literature were reviewed to generalize the common law from their relative formulas and to specify the bands used. Table 3 lists the used spectral indices and formulations. It can be found from the existed spectral indices shown in Table 3 that the common law is the adjusting coefficient of B12 (SWIR 2) is larger or equal to 0, and so the band SWIR 2 is used as the primary band for subsequent processing.
The normalized burn ratio (NBR) [19] is a widely used index in the literature combining NIR (B8A) and SWIR (B12) wavelengths to highlight burned areas, with high NBR values generally indicating healthy vegetation and low values indicating bare ground and recently burned areas. The NBR has been found to outperform the other spectral indices in some ecoregions and is also considered to be a standard for fire severity assessments. Note that we modified the normalized burn ratio (NBR) by changing its sign, such that its index value can be increased as other spectral indices if the pixel was affected by the fire. The reversed formulation of NBR if referred to as MNBR in Table 3.
The burn area index (BAI) [20] uses the reflectance in the red and NIR portion of the spectrum to identify the areas of the terrain affected by fire. This index highlights burned land in the red to near-infrared spectrum by emphasizing the charcoal signal in post-fire images. However, some studies have shown that the visible range is not very effective for discriminating burned lands, due to several common land covers, such as water bodies, wetlands, bare land and some forest types; especially, dense coniferous forests are quite dark in the visible band.
The mid-infrared reflectance (MIR) has long been identified as promising bands for detecting burns. Therefore, a mid-infrared burn index (MIRBI) [28] was designed for burned area identification by discriminating the difference between short wavelength MIR and long wavelength MIR. This index is highly sensitive to spectral changes caused by burning and relatively insensitive to noise.
The burnt area index for Sentinel-2 (BAIS2) [29] adapts the traditional BAI for Sentinel-2 image, which takes advantage of the S2 MSI spectral characteristics by using visible (B4), red-edge (B6 and B7), NIR (B8A) and SWIR (B12) bands to separate the burned areas. It has been demonstrated to be suitable for post-fire burned area detection.
The normalized burn ratio 2 (NBR2) [30] modifies the normalized burn ratio (NBR) to highlight water sensitivity in vegetation and may be useful in post-fire recovery studies, which is calculated as a ratio between the SWIR values, substituting the SWIR1 band for the NIR band used in NBR.
Table 3. List of some widely used burned area indices.
IndicesReferencesFormulations
Modified Normalized Burn Ratio (MNBR)[19] MNBR = B 12 B 8 B 12 + B 8
NDVI[31] NDVI   = B 8 A B 4 B 8 A + B 4
Burned Area Index (BAI)[20] BAI = 1 ( 0.1 + B 4 ) 2 + ( 0.06 + B 8 A ) 2
Burned Area Index for Sentinel-2 (BAIS2)[29] B A I S 2 = ( 1 B 6 B 7 B 8 A B 4 ) ( B 12 B 8 A B 12 + B 8 A + 1 )
Normalized Burn Ratio 2 (NBR2)[30] NBR 2 = B 12 B 11 N 12 + B 11
Normalized Burn Ratio Plus (NBR+)[21] N B R + = ( B 12 B 8 A B 3 B 2 ) ( B 12 + B 8 A + B 3 + B 2 )
Mid-Infrared Bispectral Index (MIRBI)[28] 10 B 12 9.8 B 11 + 2
Since the burned area detection is strictly correlated to the monitoring of vegetation, the normalized difference vegetation index (NDVI) [31] is also included, which can be defined as the normalized ratio of the difference between the near-infrared and red bands. This index allows us to investigate the relationship between the amount of vegetation consumed and fire severity.

2.2.2. Reflectance Analysis

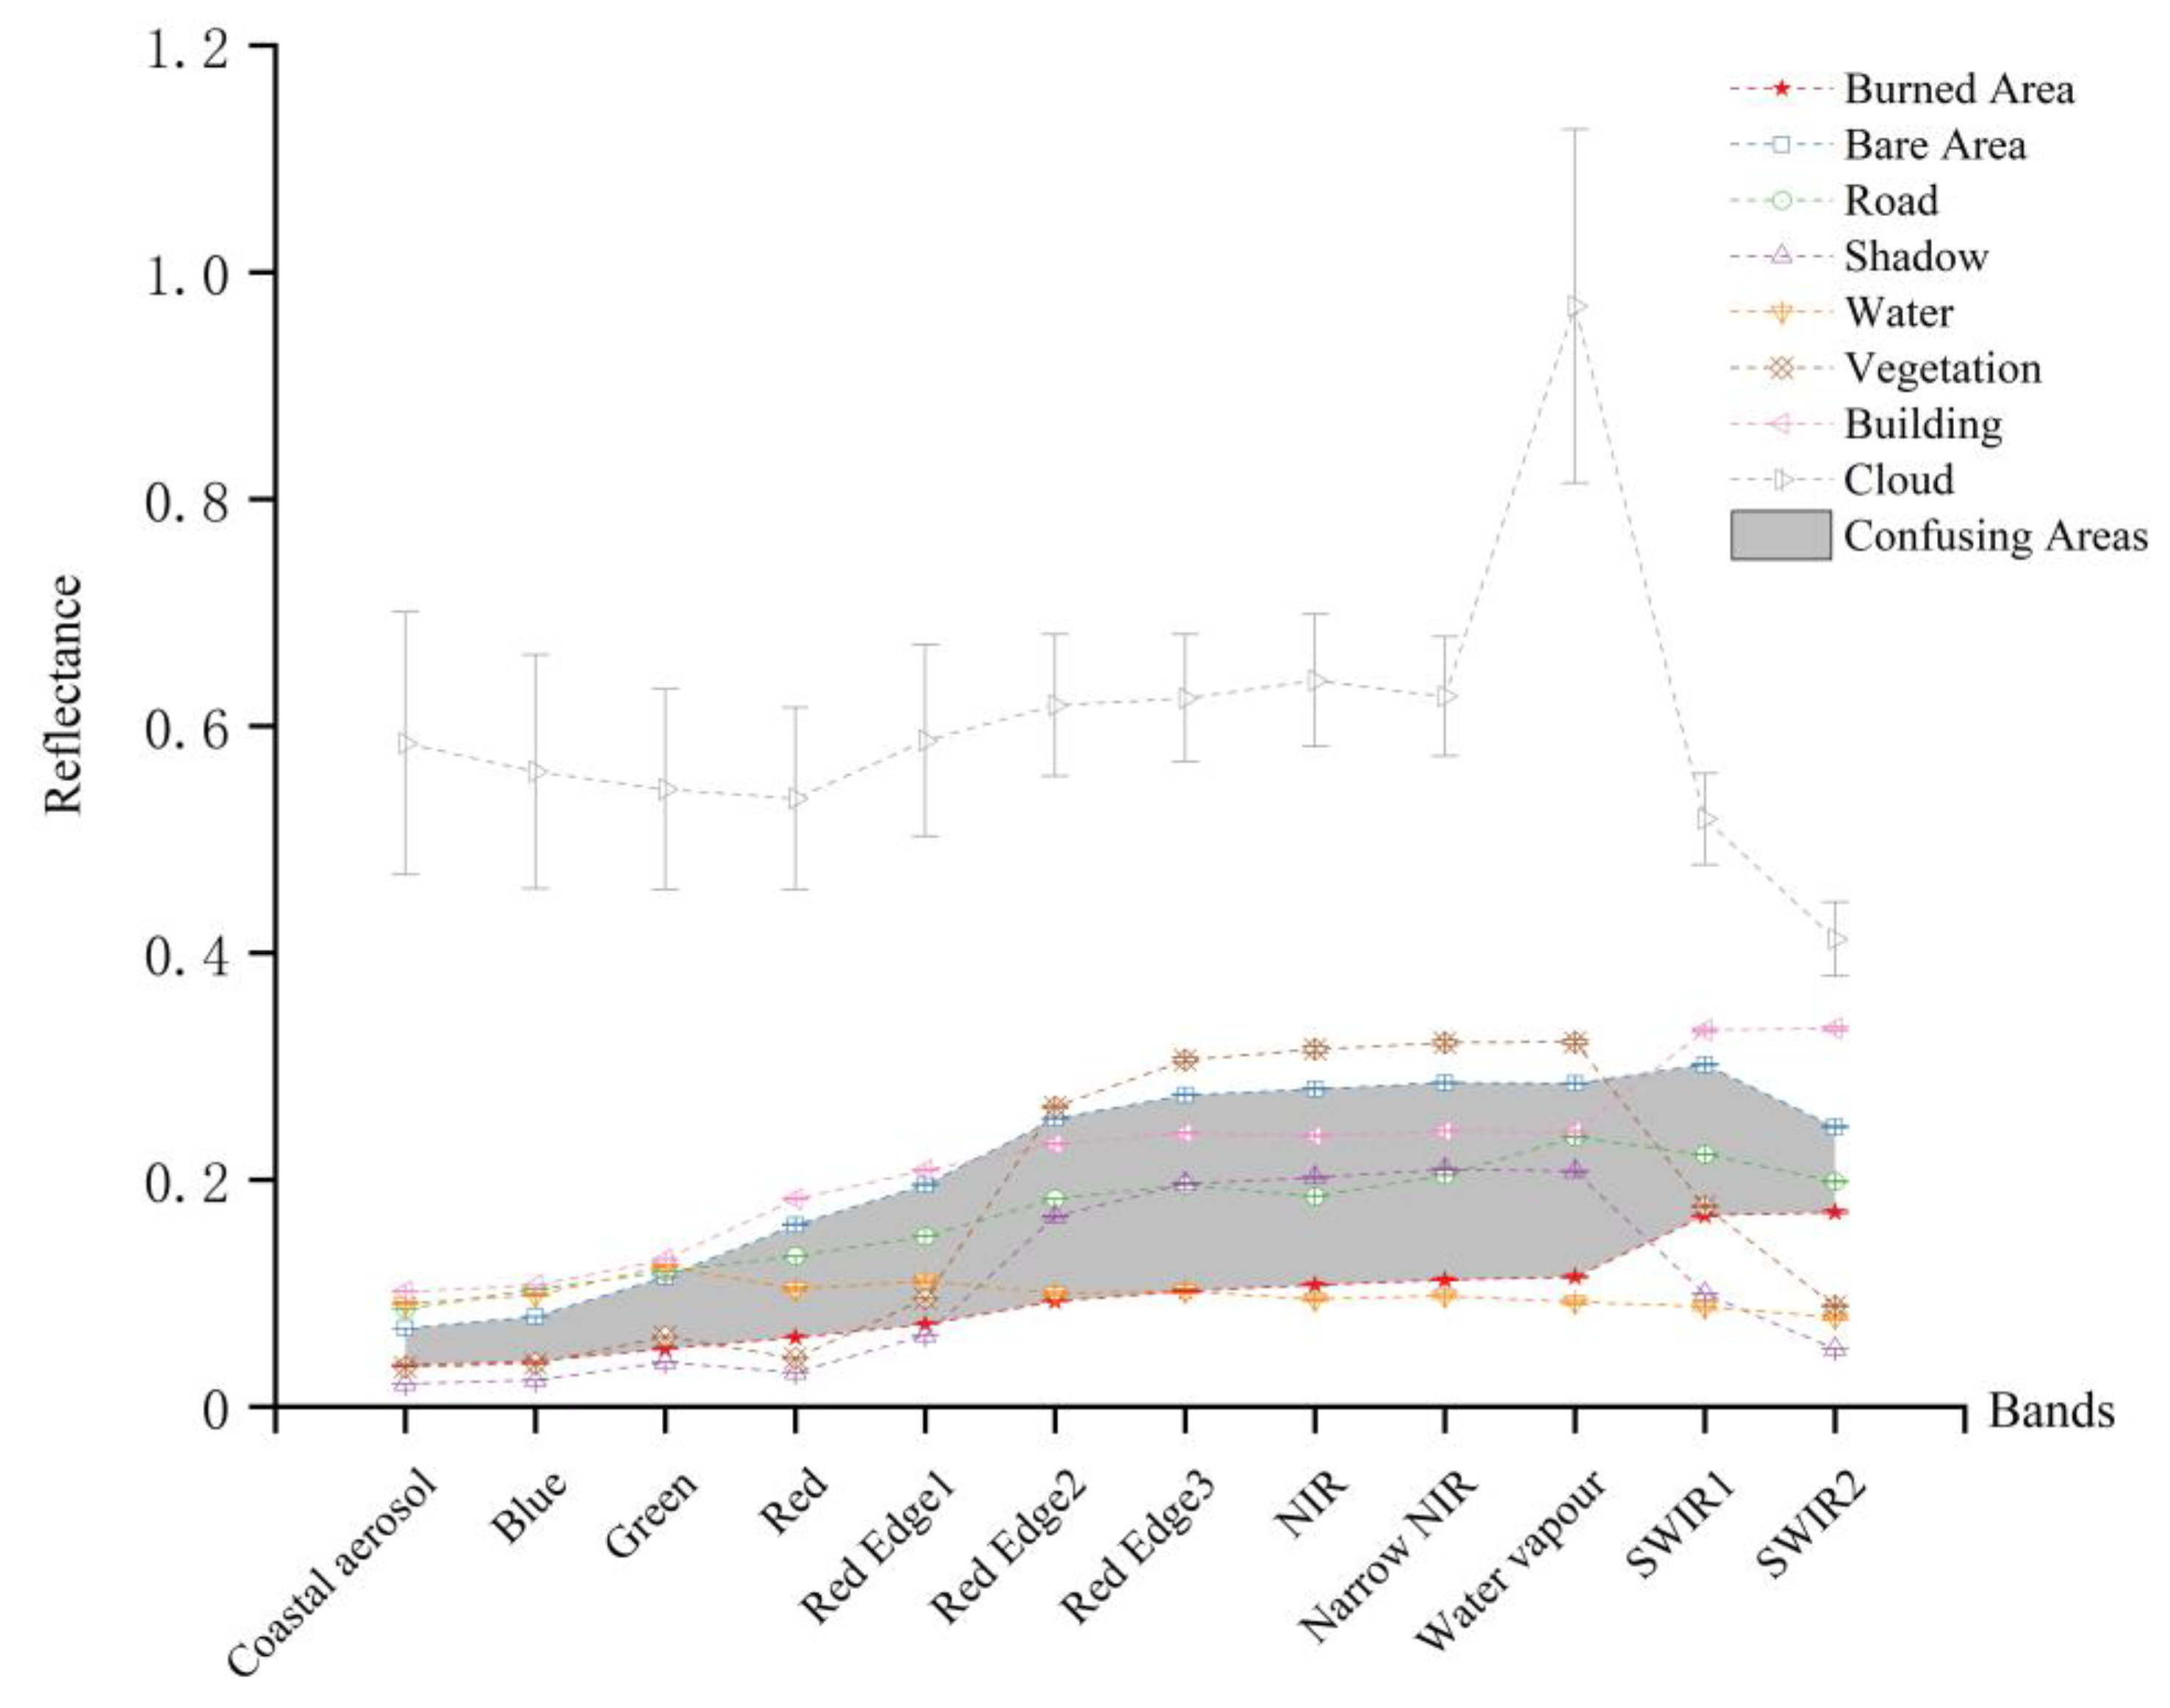
Since our basic goal is to measure the separability between burned areas with different spectral responses and other land covers by depicting the implicit spectral characteristics, we first conducted a spectral profile analysis on typical land covers to learn which bands have the maximal information volume. To this end, eight typical ground classes, i.e., burned land, water, vegetation, bare land, buildings, cloud, road and shadow, were randomly selected in the image acquired from Sentinel-2, and their average spectral profiles and their variances are plotted in Figure 3.
As shown in Figure 3, most land cover types are consistently prone to spectral confusion with burned lands, especially for water, shadows, buildings, bare land and mixed land–water pixels. For instance, the spectral signature of burned area has a strong brightness in the SWIR1 and SWIR2 bands and presents the lowest reflectance in the visible bands. In addition, similar spectral profiles can be found in bare land. On the other hand, both burned land and shadow have relatively low reflectance in the visible region of the spectrum, though they have the better discriminant ability in infrared bands. Additionally, the reflectance of buildings exhibits the same trend as those of burned lands, although the buildings’ reflected amplitudes are normally higher than that of burned land. As a result, it seems difficult to use two bands to construct an effective burned land index to separate burned areas from all possible background materials. The use of more bands appears to be more appropriate for burned area detection and mapping. From the existing spectral indices shown in Table 3, it is obvious that 9 out of the total 12 bands were used to build the burned area indices in different formats, indicating that most bands can provide useful information for the burned land identification.

2.2.3. Development of the ABAI Index

Since the burned areas may present similar reflectance characteristics as water and shadows, and even the building and bare land as reported in the literature, it is usually necessary to apply a mask to remove the water bodies and shadows for the detection of burned areas. However, it is difficult to obtain accurate templates to mask different land covers. Moreover, the results heavily rely on the extracted accuracy of the provided mask map if a particular land class was required from remotely sensed images. To accurately detect the burned area, here we developed a new burned area index, i.e., ABAI, by constructing different objective functions of different land covers, such that it can enhance the separating ability between the burned area and other land covers.
As shown in Table 3, nine bands have been found in different spectral indices, i.e., band 2, band 3, band 4, band 6, band 7, band 8, band 8A, band 11 and band 12. The central wavelength of each band varies depending on satellite sensors, resulting in the fluctuation of the threshold for the computation of various burned land indices. To sum up, the existing indices can be uniformly expressed as Equation (1).
Y = [ x 1 , x 2 , , x 9 ] [ ρ 1 ρ 9 ]
where Y represents the transforming value of burned land, and ρ 1 ~ ρ 9 represent the average reflectance of band 2, band 3, band 4, band 6, band 7, band 8, band 8A, band 11 and band 12, with reference to land cover types from images of Sentinel-2 acquired from different locations, and x 1 ~ x 9 are the associated band coefficients to be determined. As can be observed in Figure 3, the existing spectral indices show the common law that the coefficient of SWIR2 ( ρ 9 ) is larger than or equal to zero. Therefore, we use the relative band intensities with all elements divided by the SWIR2 band in Equation (1) to enhance the spectral differences between bands and reduce the possible effects of topography.
Y ρ 9 = [ x 1 , x 2 , , x 9 ] [ ρ 1 / ρ 9 1 ] = [ x 1 , x 2 , , x 9 ] [ Q 1 Q 9 ]
where Q i = ρ i / ρ 9 denotes the band ratio, and x i ( i = 1 , , 9 ) is the coefficient parameter to be optimized. It is noted that the commission and omission errors could be produced by burned land classification methods if only a fixed value was given to the parameters in Formula (3). To enhance the burned land pixels, it is expected the value of the burned land index to be much higher than the threshold α , while the other non-fire land covers are much lower than it. To be simplified, the threshold α was set to be a constant value of zero, aiming to automatically delineate burned land features with a stable threshold. Therefore, by substituting the Q i for the corresponding values in Table 4, the objective function for the burned areas can be formulated as follows.
0.23 x 1 + 0.30 x 2 + 0.36 x 3 + 0.54 x 4 + 0.59 x 5 + 0.63 x 6 + 0.65 x 7 + 0.98 x 8 + x 9 > a
It is obvious from Equation (3) that we can obtain infinite solutions to satisfy the requirement, as there are 9 parameters to be estimated, but with only one equation. In addition to the burned area, each of the most confused land covers, such as water, shadows, buildings and bare land, was also included to formulate respectively objective functions to distinguish burned areas from them. The values of band ratios for most confused land covers aere shown in Table 4. Finally, a multi-objective optimizing problem, defined by serials of inequalities to characterize burned and non-burned land covers, can be built as follows.
Obj 0.23 x 1 + 0.30 x 2 + 0.36 x 3 + 0.54 x 4 + 0.59 x 5 + 0.63 x 6 + 0.65 x 7 + 0.98 x 8 + x 9 > a 0.32 x 1 + 0.46 x 2 + 0.65 x 3 + 1.03 x 4 + 1.11 x 5 + 1.14 x 6 + 1.16 x 7 + 1.22 x 8 + x 9 < a 0.46 x 1 + 0.77 x 2 + 0.60 x 3 + 3.29 x 4 + 3.86 x 5 + 3.96 x 6 + 4.10 x 7 + 1.95 x 8 + x 9 < a 1.25 x 1 +1.57 x 2 +1.32 x 3 +1.27 x 4 +1.29 x 5 +1.21 x 6 +3.61 x 7 +1.12 x 8 + x 9 <a 0.43 x 1 +0.69 x 2 +0.48 x 3 +2.97 x 4 +3.44 x 5 +3.55 x 6 +0.73 x 7 +1.99 x 8 + x 9 <a
where a is the threshold to separate burned area and other land covers. The first to fifth lines in Equation (4) are their objective functions of burned area, bare land, shadow, water and building, respectively. Note that there are only 5 inequalities with 9 free parameters in Equation (4), which still has infinite feasible solutions if there are no other constraints. To reduce freedom, more inequalities with other land covers can be added until the number of equations is equal or larger than that of parameters, such that a unique or a least square solution can be achieved. As can be observed in existing spectral indices, however, in addition to considering the effectiveness of the spectral indices, simplicity is another important aspect of the index performance. Obviously, the solutions with the least squares cannot meet this criterion. Consequently, we adopted another strategy by reducing the area of feasible solutions with additional constraints as follows.
s . t .   X 0 S   ,   x i Z  
where s . t . is the abbreviation of subject to; X = [   x 1 , ,   x 9 ] T is the coefficient to be estimated under the l 0 -norm constraint and X 0 represents the nonzero number of the coefficients; and S is an unknown non-negative integer to control the sparsity level of the model. Moreover,   x i Z indicates that   x i is an integer. There are several merits by introducing Equation (5). First of all, an important advantage of imposing l 0 -norm constraint is that it can adaptively remove the trivial bands by shrinking their coefficients to zero [32]. As a result, model selection and coefficient optimization are performed simultaneously. Second, we can obtain different burned area indices by varying the parameters and objective function. Finally, when the x i Z is imposed on Equation (5), the integer programming algorithm [33] can be adopted to solve the formula with multiple parameters. In such a solution, the constructed spectral index has an integer value as multiplier to each used band, which is in accordance with most of the existing burned area indices. Of course, we can adjust the objective functions, or release one of the two constraints, if there happens to be no feasible solution in actual scenarios.
As the combination of (4) and (5) is a typically constrained linear programming problem [34,35,36], we can solve the multi-objective optimization problem with the support of the Matlab optimization toolbox. In our case, we obtained a feasible solution with x 2 (band 3), x 8 (band 11) and x 9   (band 12) to be −3, −2 and 3, respectively, and zeros for the other coefficients. The set of coefficients is a simplified solution from the feasible region for better applicability of the ABAI. To refine the index model, we adopt a ratio of the reflectance from those wavebands to reduce noises caused by sources presented in all bands, such as illumination differences and atmospheric attenuation. Moreover, its value ranges from -1 to 1 after normalization, which facilitates the subsequent processing of threshold segmentation. Finally, the proposed ABAI burned area index can be defined as Equation (6).
ABAI = 3 B 12 2 B 11 3 B 3   3 B 12 + 2 B 11 + 3 B 3

2.3. Accuracy Assessment Measures

To verify the applicability of the ABAI, both qualitative and quantitative methods were adopted to validate the performances of the proposed method. The qualitative method is to visually check whether the extracted burned areas are consistent with the actual locations, and the quantitative method uses the indicators to measure the discrepancy between predicted and actual burned areas. The confusion matrix and its derived indicators are adopted to denote the accuracy of burned area identification. A confusion matrix is a table that shows the correspondence between the extracted results and the ground truth, obtained by visual inspection of the images or other information layers (such as maps) or acquired in situ and recorded with a GNSS (global navigation satellite system) receiver. The numerical accuracy assessment of each classified image is summarized by the values of the indices named producer accuracy (PA), user accuracy (UA), and overall accuracy (OA), respectively. In particular, PA indicates the probability that a certain land cover of an area on the ground is classified as such. It is computed by dividing the number of pixels classified accurately in each category by the total number of reference pixels for that category. UA indicates the probability that a certain area classified into a given category actually represents that category on the ground. It is computed by dividing the number of correctly classified pixels in each category by the total number of pixels that were classified in that category. OA represents the probability that all categories are correctly classified. It is computed by dividing the total number of correctly classified pixels by the total number of reference pixels.

3. Results and Analysis

3.1. Comparison and Explanation of the ABAI

Compared with the existing burned area indices shown in Table 3, the proposed ABAI is very similar to the NBR2, NBR+ and MIRBI as they all use the SWIR1 and SWIR2 bands to construct their expressions. However, there are some substantial differences between the ABAI and the other indices. Firstly, we introduced the green band (B3) to define the ABAI, which considered the impact of water bodies in the detection of burned areas. As water typically has strong reflectance in the green band [37], smaller values of water bodies can be derived from the ABAI compared to the NBR2, which facilitates the separation of the burned area from water bodies. Differing from NBR+, it is obvious that the blue band (B2) was not included in the ABAI. Although the blue band is beneficial to separate water bodies, it seems reasonable to exclude this band in the ABAI due to the wavelength of blue ranging from 450 nm to 500 nm, which is severely scattered by the atmosphere as well-known Rayleigh scatters. Furthermore, the ABAI can use different multiplier factors to adjust the contribution of each band while the NBR+ fixes their coefficients to be one. As a result, the ABAI can adaptively increase or reduce the spectral differences among bands by optimizing the adjusting factors. Finally, compared to other spectral indices that do not include the SWIR2 band, the formula of the ABAI provides negative values for the clouds, as they have the reflectance in the SWIRS2 band significantly lower than the sum of the other two bands. Consequently, the pixels related to the clouds in the resulting ABAI image present certainly low (negative) values and therefore would not be confused with those related to the burned area, which presents high values and tends to be white.
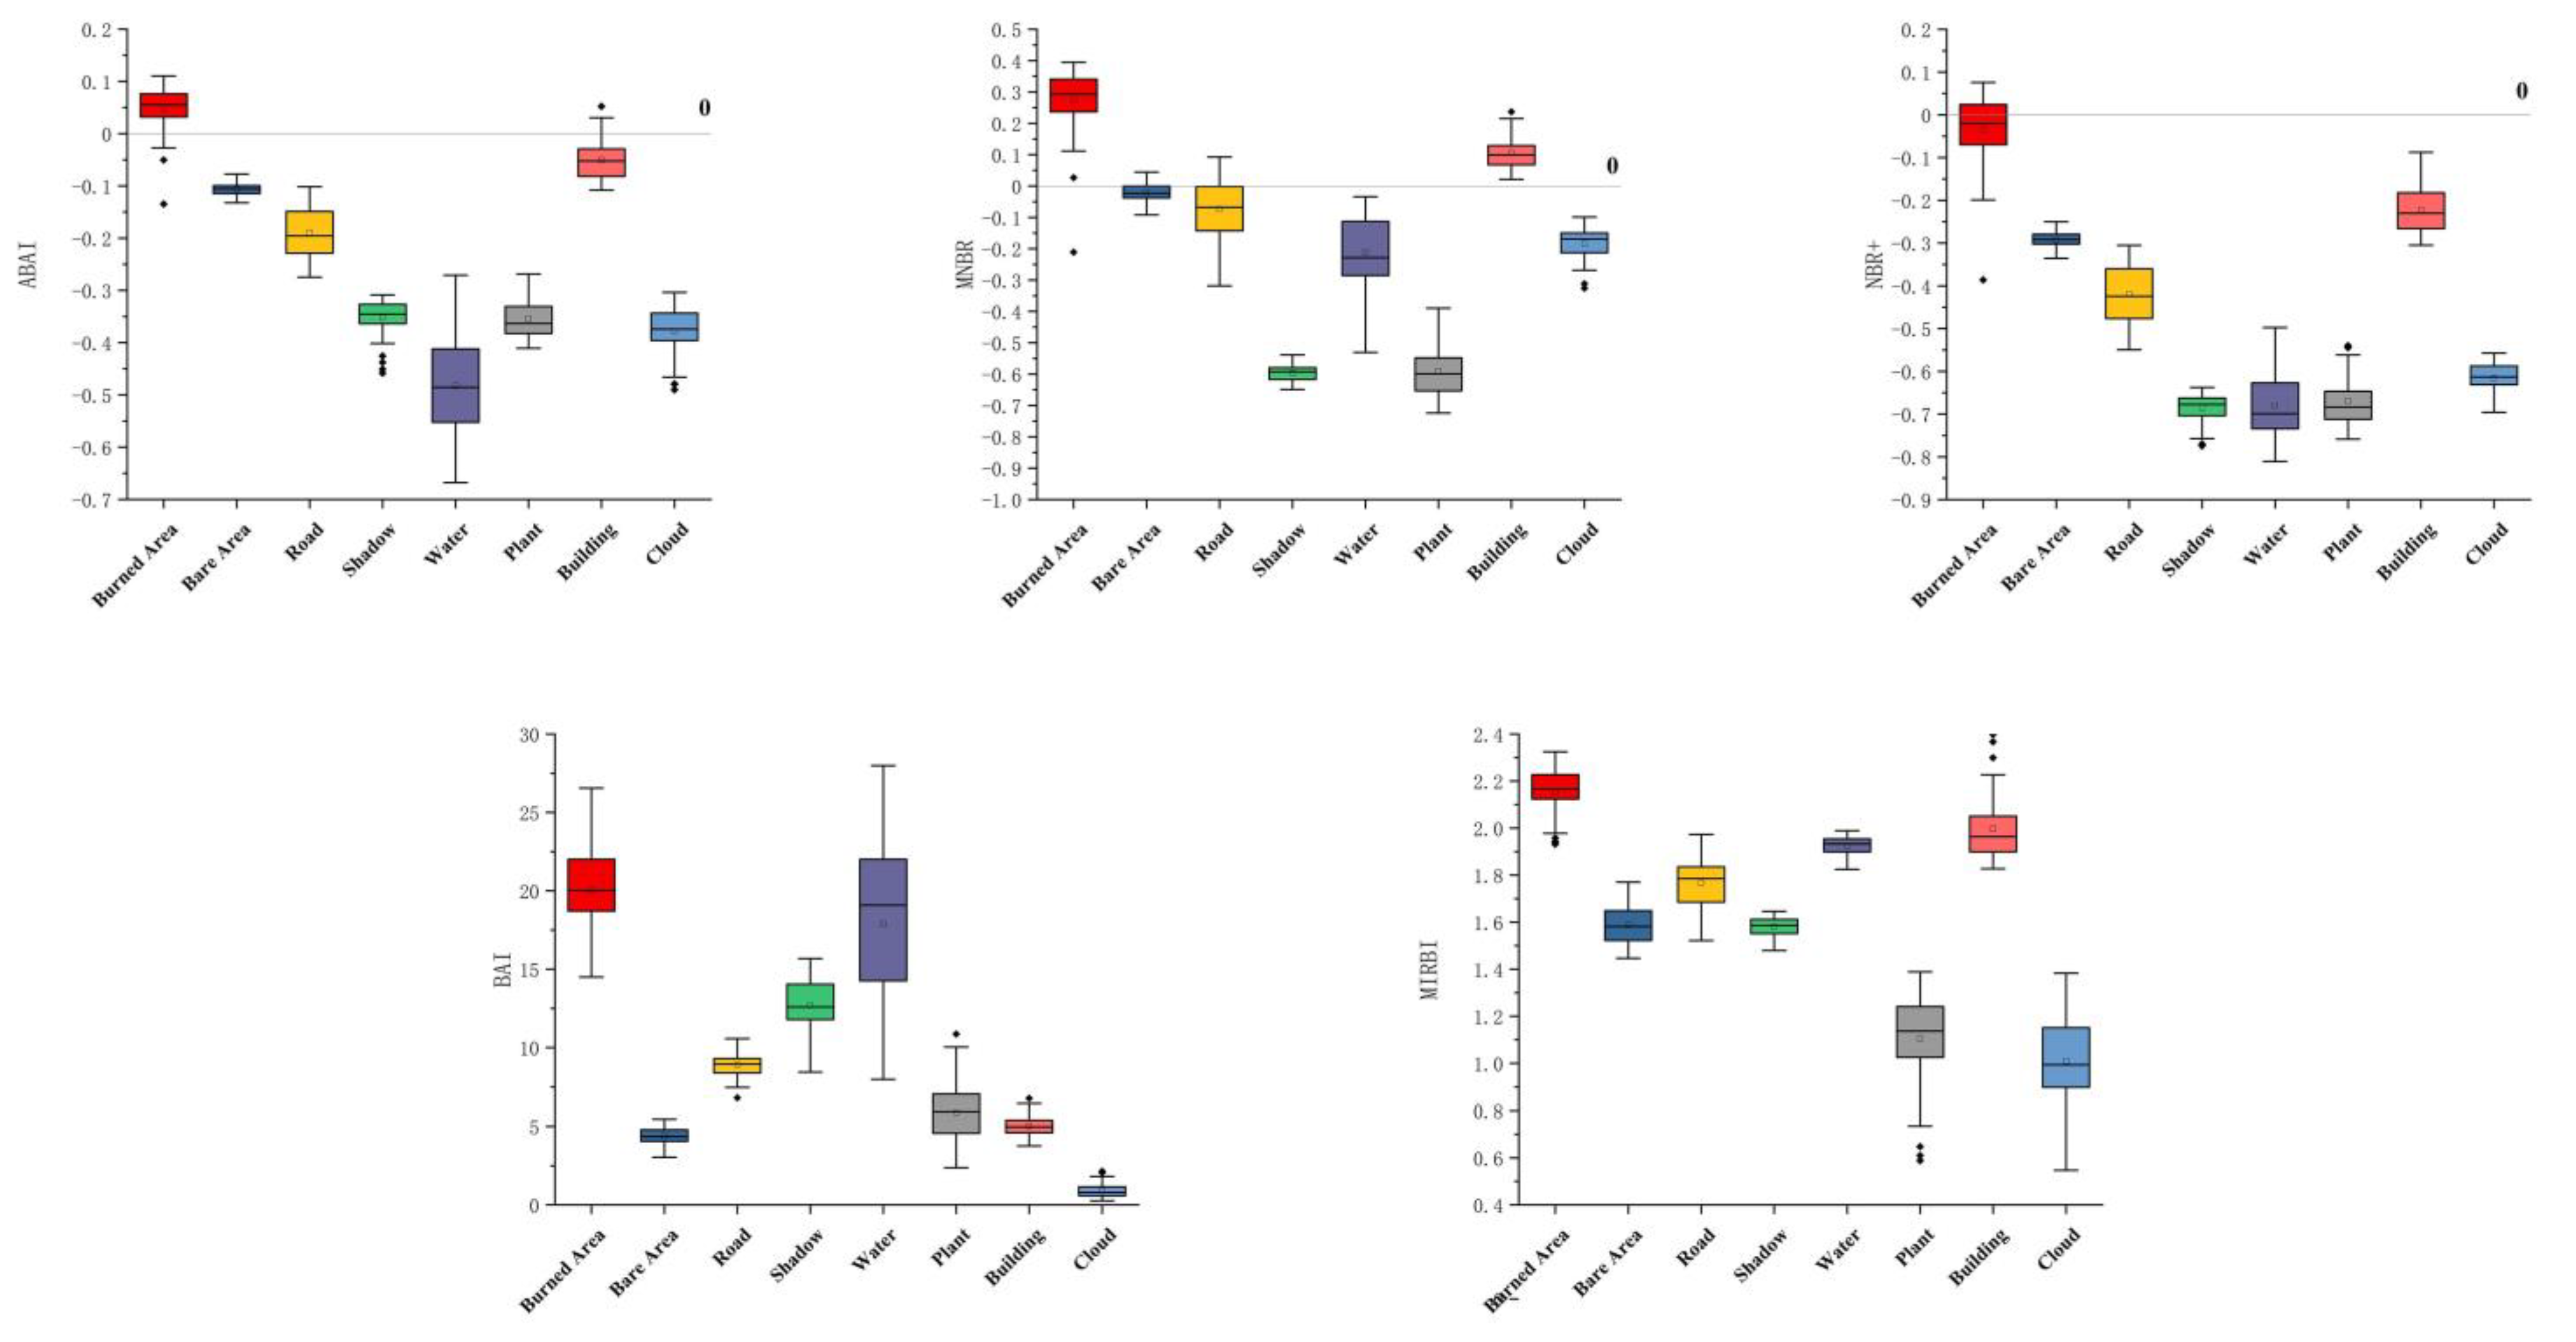
In addition to the intuitive explanations, simulated studies were conducted to test the stability and their comparisons between existing indices and the proposed ABAI. Specifically, land cover types, including water bodies, shadows, buildings, vegetation, bare land, roads and clouds, were selected as targets for the classification, and each type of land cover contains 100 samples. The result of the stability test, as shown in Figure 4, indicates that the ABAI is effective in extracting burned land when the threshold is set as 0. Moreover, all the burned area indices are able to distinguish the burned area from non-burned features, while only ABAI and NBR+ present the ability to separate burned areas from building pixels; however, the presence of omission errors can be produced by NBR+ for the classification of some burned areas, as some values in NBR+ features are obviously lower than zero, which results in the loss of accuracy of burned area mapping.

3.2. Visual Evaluation of the Indices

Figure 5 shows the original Sentinel-2 image and associated image features derived from different spectral indices.
It can be found from the image contrast among the burned lands, water and clouds (highlighted with red box in Figure 5) that the proposed index visually outperforms other spectral indices, because the cloud or water exhibits brightening color in the MNBR, NBR+, BAI, and MIRBI image features except for the ABAI feature, where the water and cloud show black or a dark color. Actually, these areas have very low radiance values compared to the high radiance values of burned areas, indicating that the greatest misclassification of clouds and shallow waters has been resolved in ABAI. A further evaluation can be assessed by inspection of the final extracted accuracy. To this aim, all the feature images derived from different spectral indices were segmented with their optimal threshold, respectively.
The ABAI used 0 as the threshold because we specified it in the multi-objective optimization functions, while the threshold for other indices was required to be determined. In our experiments, the optimal thresholds were determined by trial and correction, and the sensitive analysis to determine the optimal threshold in terms of the kappa coefficient was conducted, and the results are listed in Figure 6. It can be found that a different spectral index has its individual optimal threshold, and the segmented accuracy is generally sensitive to threshold. Therefore, how to select the optimal threshold plays an important role for the extracted accuracy of burned areas. In contrast, the proposed ABAI has an additional advantage for image segmentation without threshold election when compared to other indices.
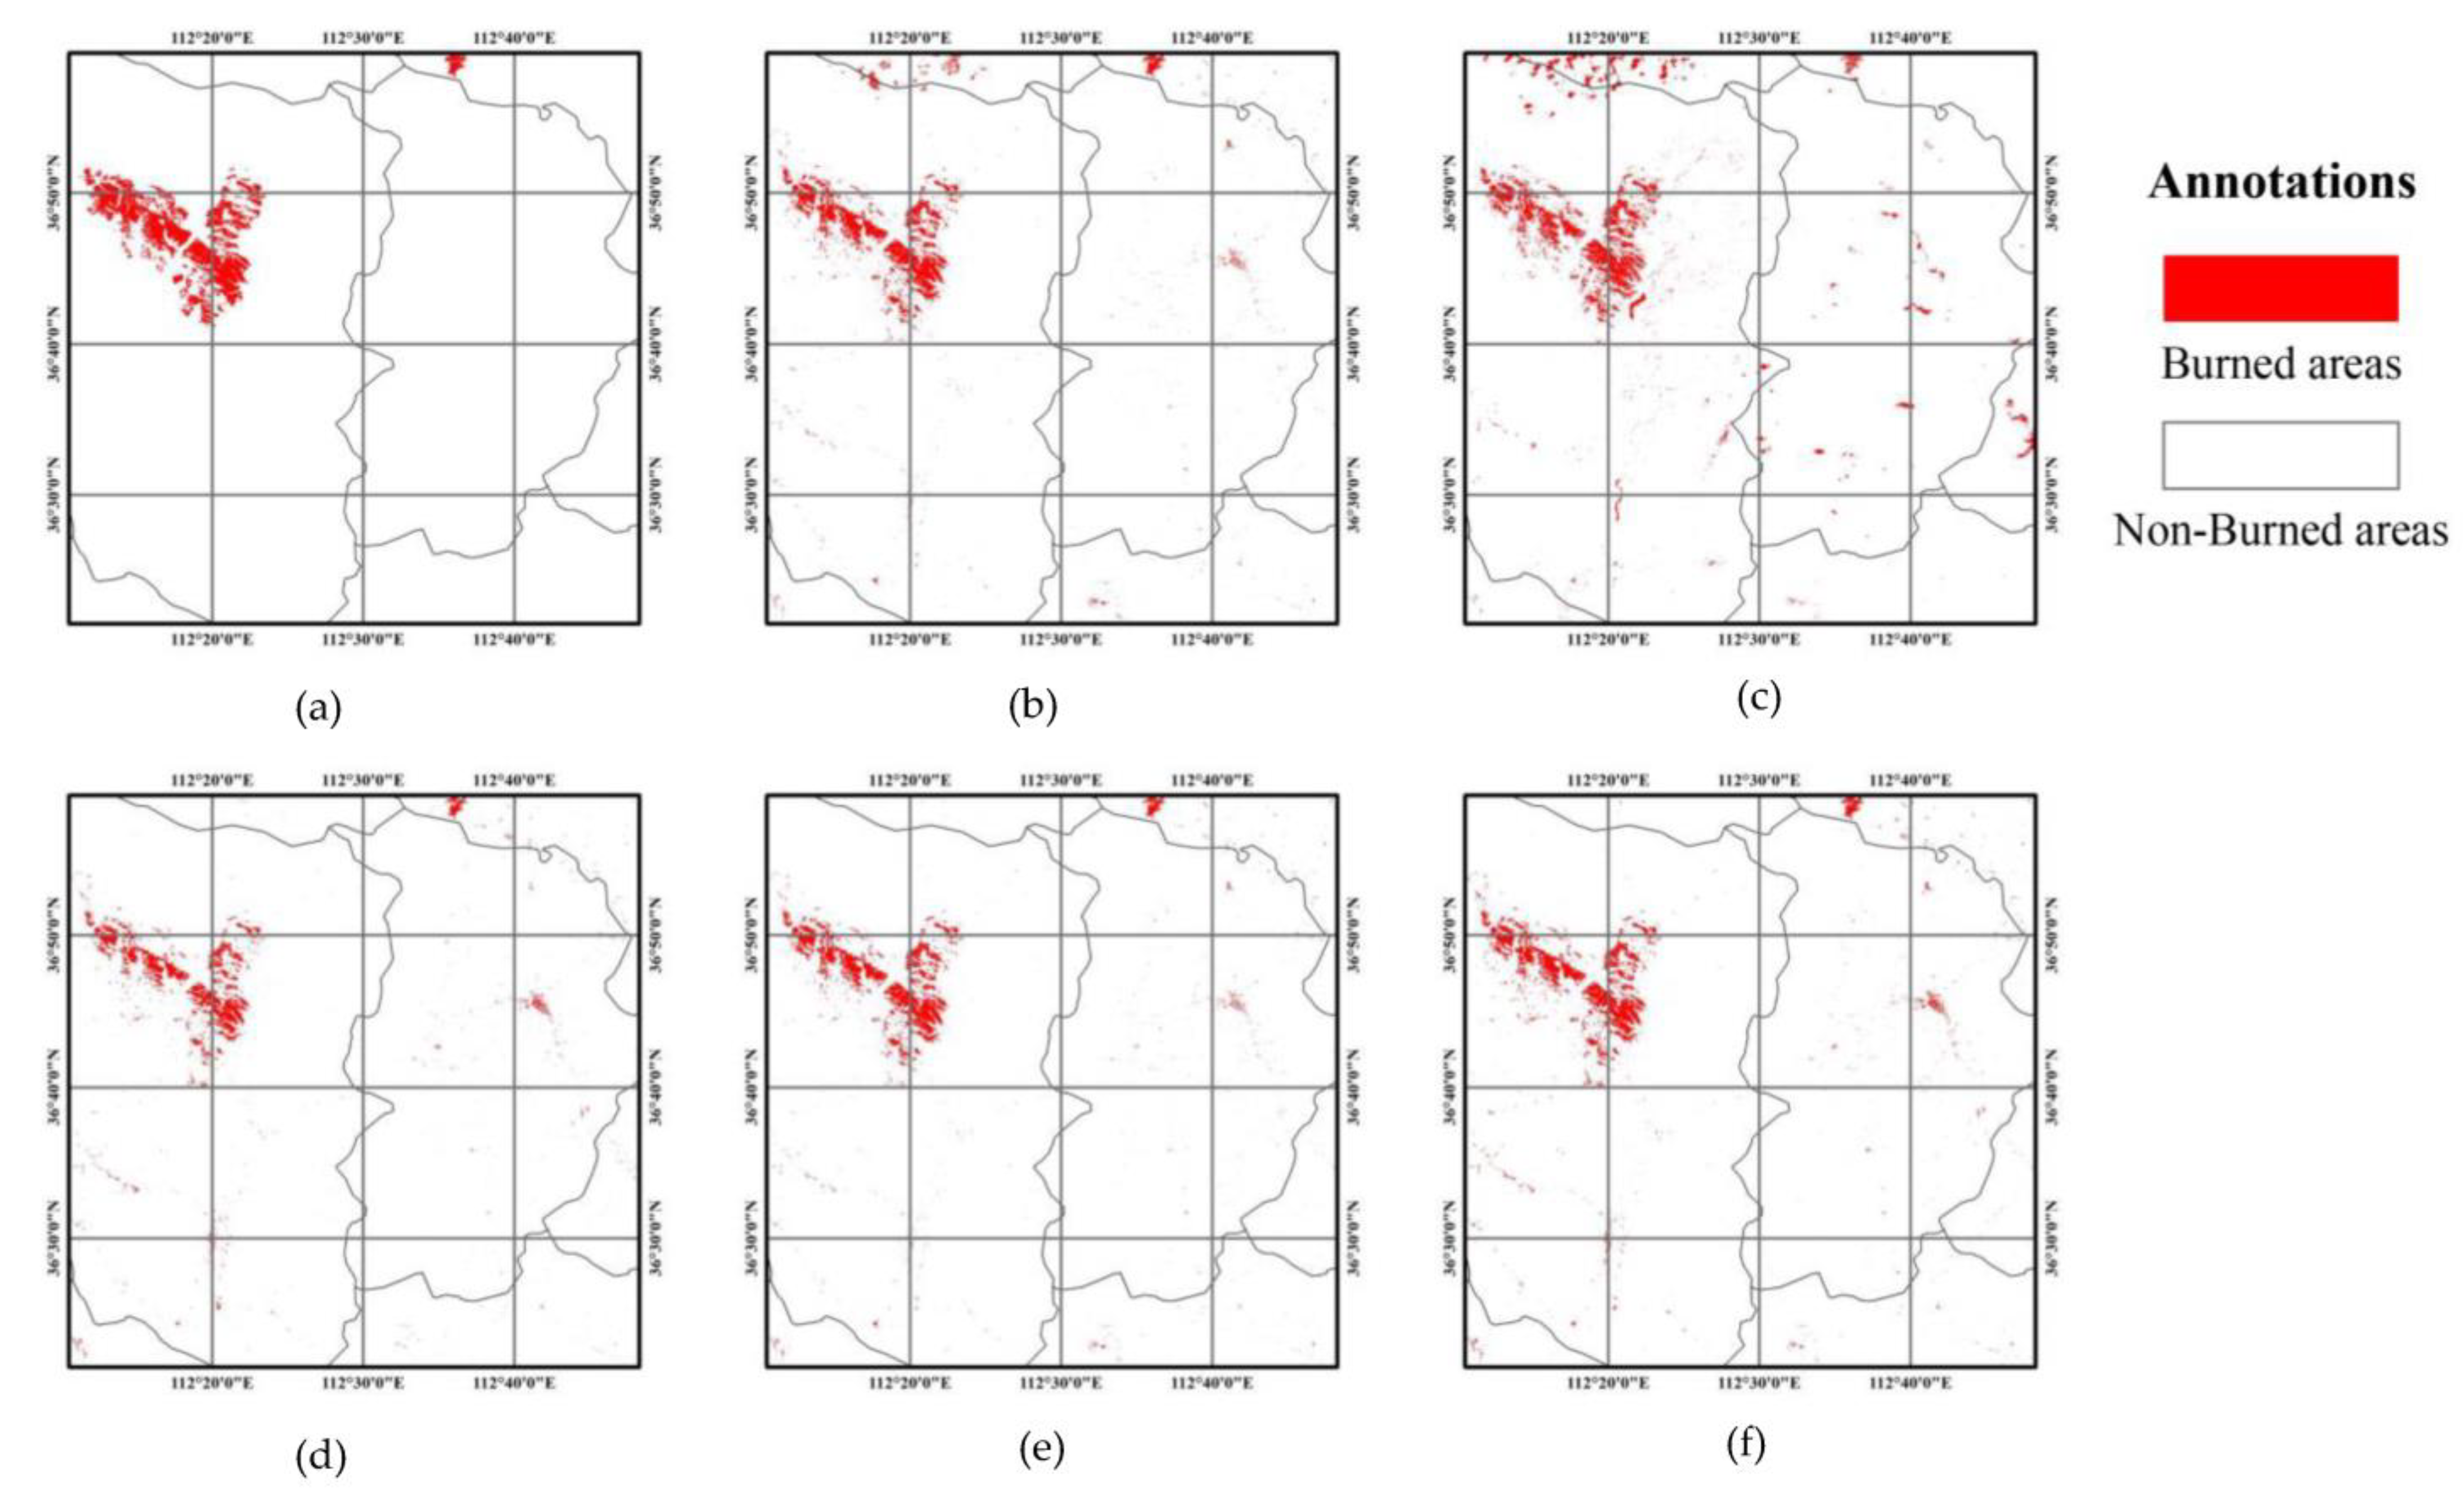
Using the optimal thresholds, the extracted results by image segmentation to distinguish the burned area and non-burned area can be obtained, as shown in Figure 7, and the assessment of each resulting burned area map can be made by means of visual inspection. Obviously, all the classification results derived from different indices are similar to the referred map, indicating all the indices are effective to burned area detection. A closer inspection shows that the proposed index achieves the highest classification accuracy due to the least noise. In comparison, some commission errors can be generated by other classification methods. It is evident that MNBR, BAI, MIRBI and NBR+ present errors around clouds and water, where part of the areas affected by this noise are incorrectly classified as burned lands. In comparison, the ABAI performs rather well on these areas.
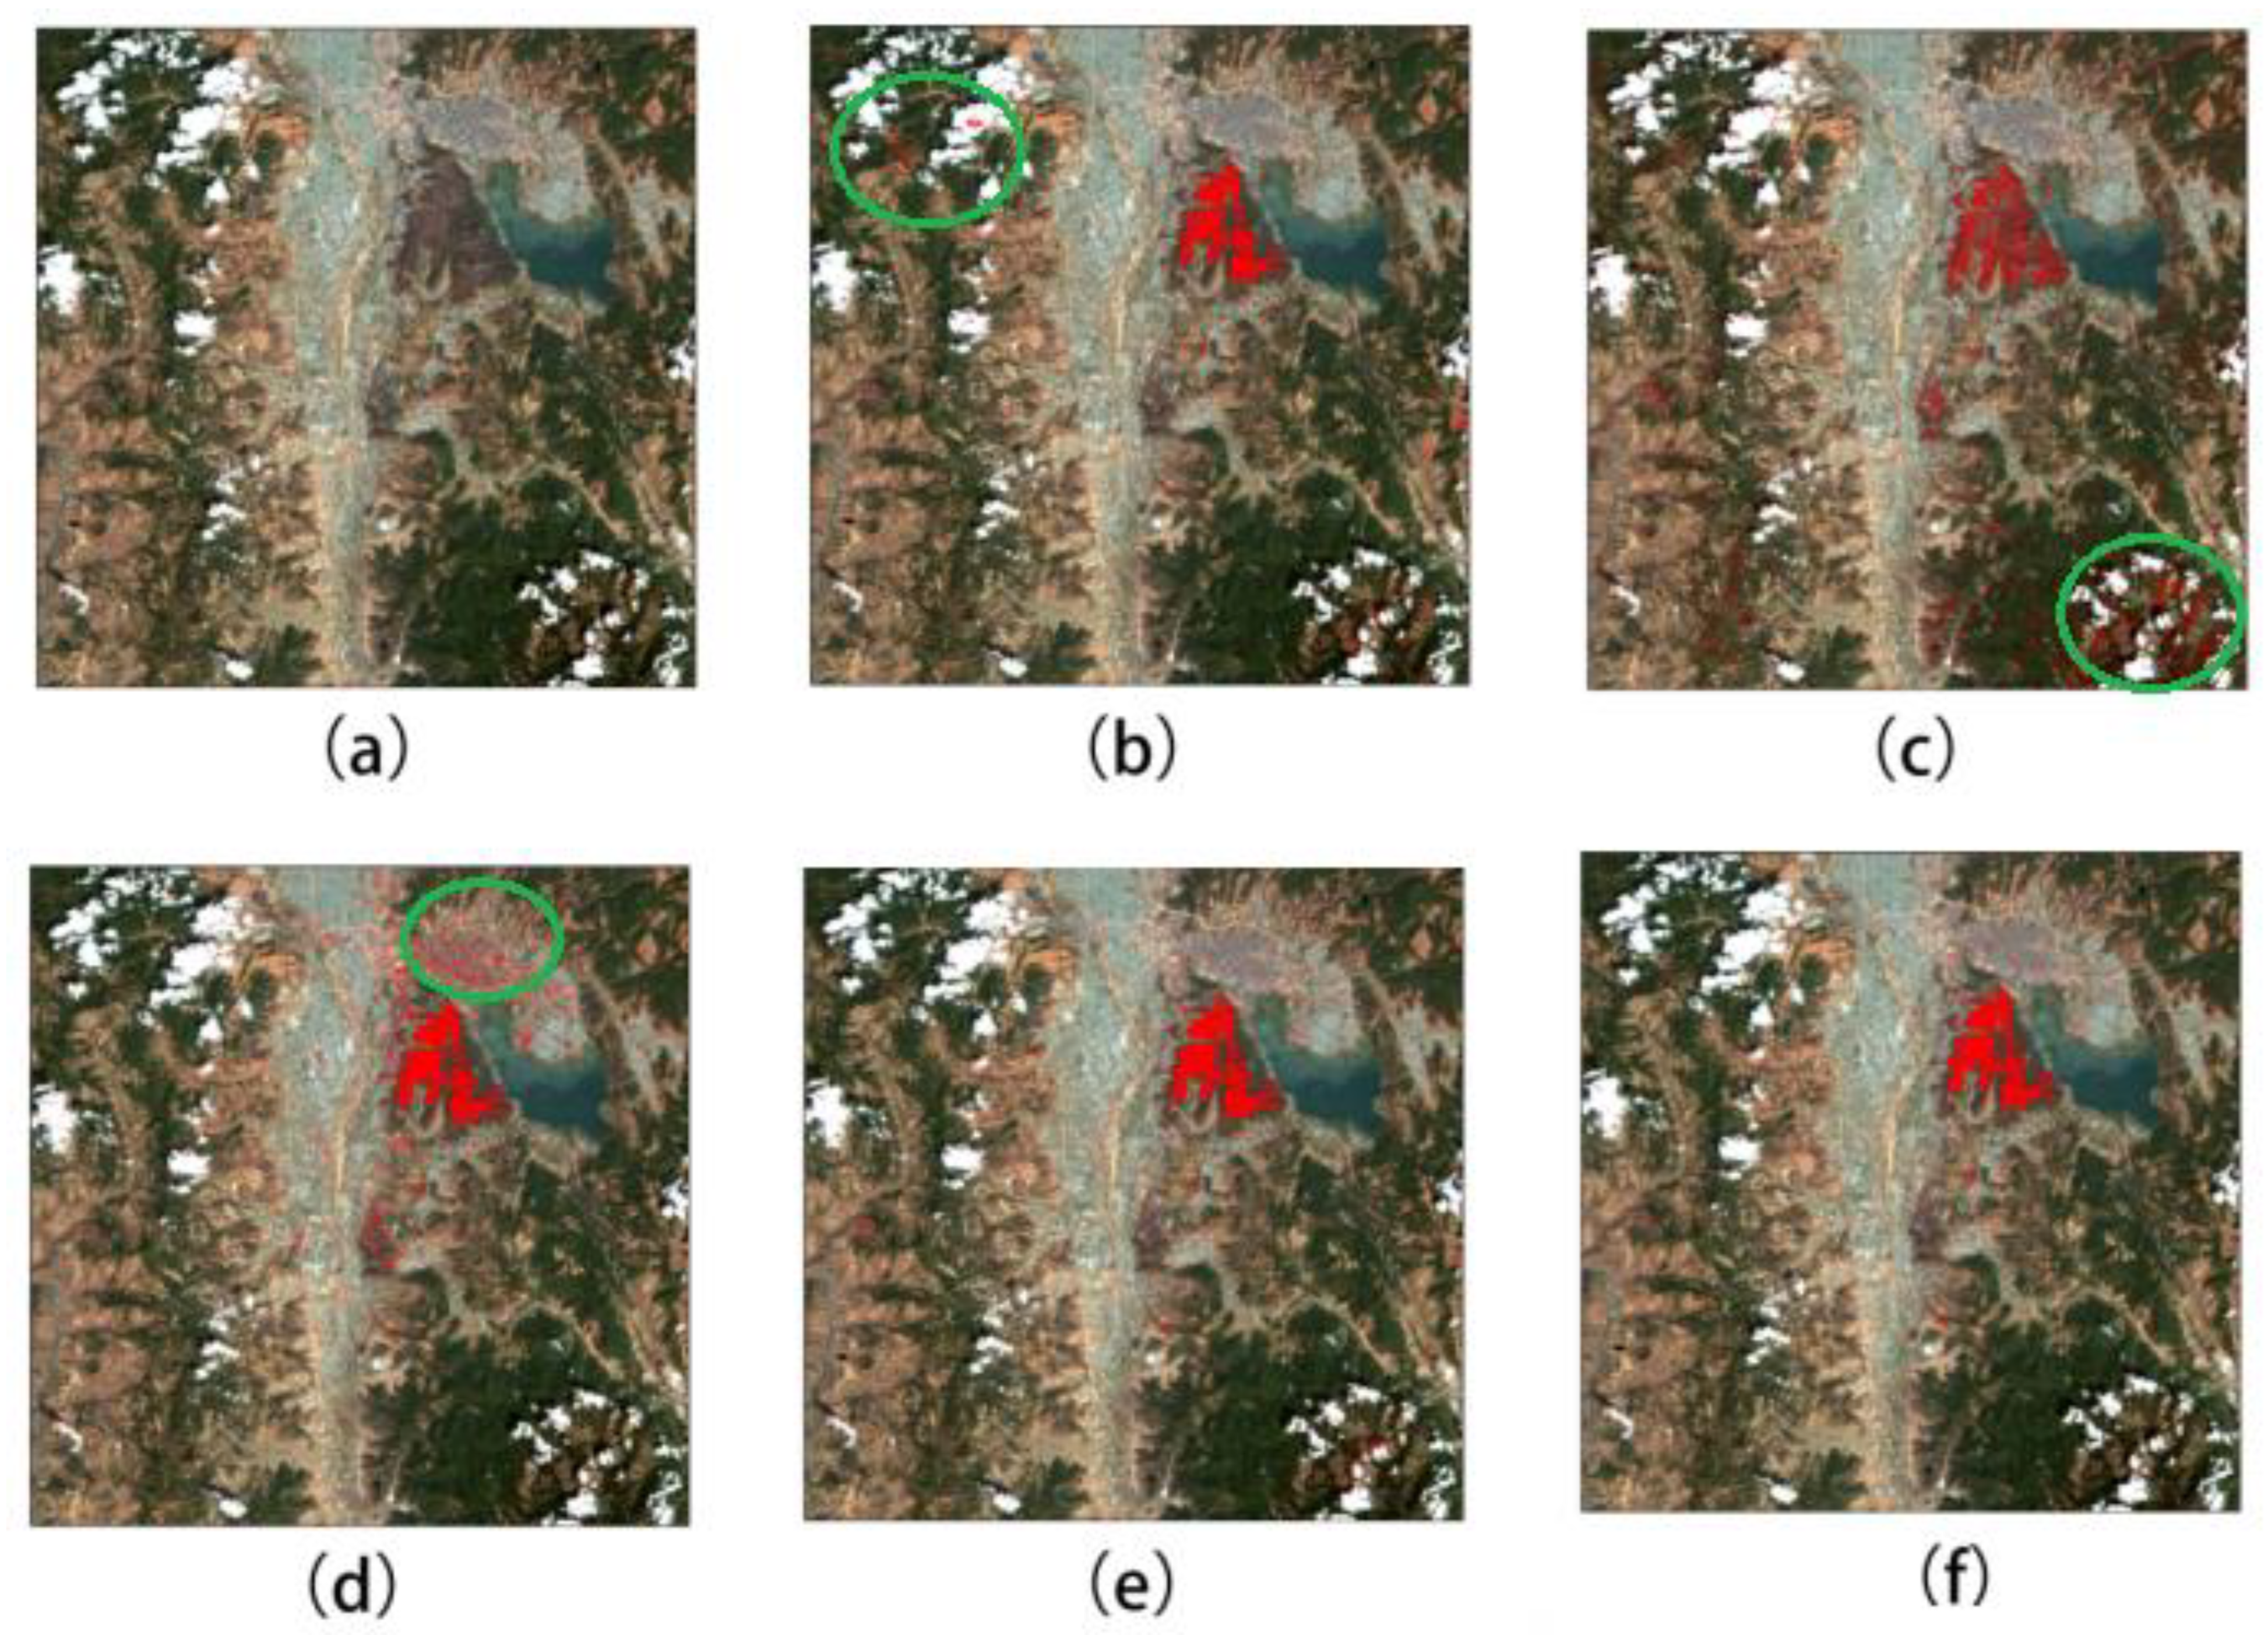
Clouds and shadows are prone to be mixed with burned areas for classification with the use of optical satellite images [38]. A commonly adopted method is to set cloud pixels as the background (i.e., no value) by using mask operation. However, the use of mask inevitably poses error accumulation due to the inaccuracy of the mask map itself. Notably, the cloud was treated as a non-burned feature for designing the proposed index, where the values of cloud pixels can be computed as negative based on the ABAI. To further verify the ability of the ABAI with cloud and shadow scenarios, the study area with higher coverage of clouds in Xichang City, Sichuan Province, was tested. Burned areas were identified and compared using various indices, as shown in Figure 8. It can be observed that all the methods can extract most of the burned areas, but some clouds and shadows are mixed to the burned area for the NBR+, and especially for BAI, as highlighted with green circles; by contrast, although the MIRBI can well separate the burned areas from clouds, it is severely confused with bare lands, as shown in Figure 8d. Again, the visual evaluation on this data demonstrated that the ABAI is superior to other methods.
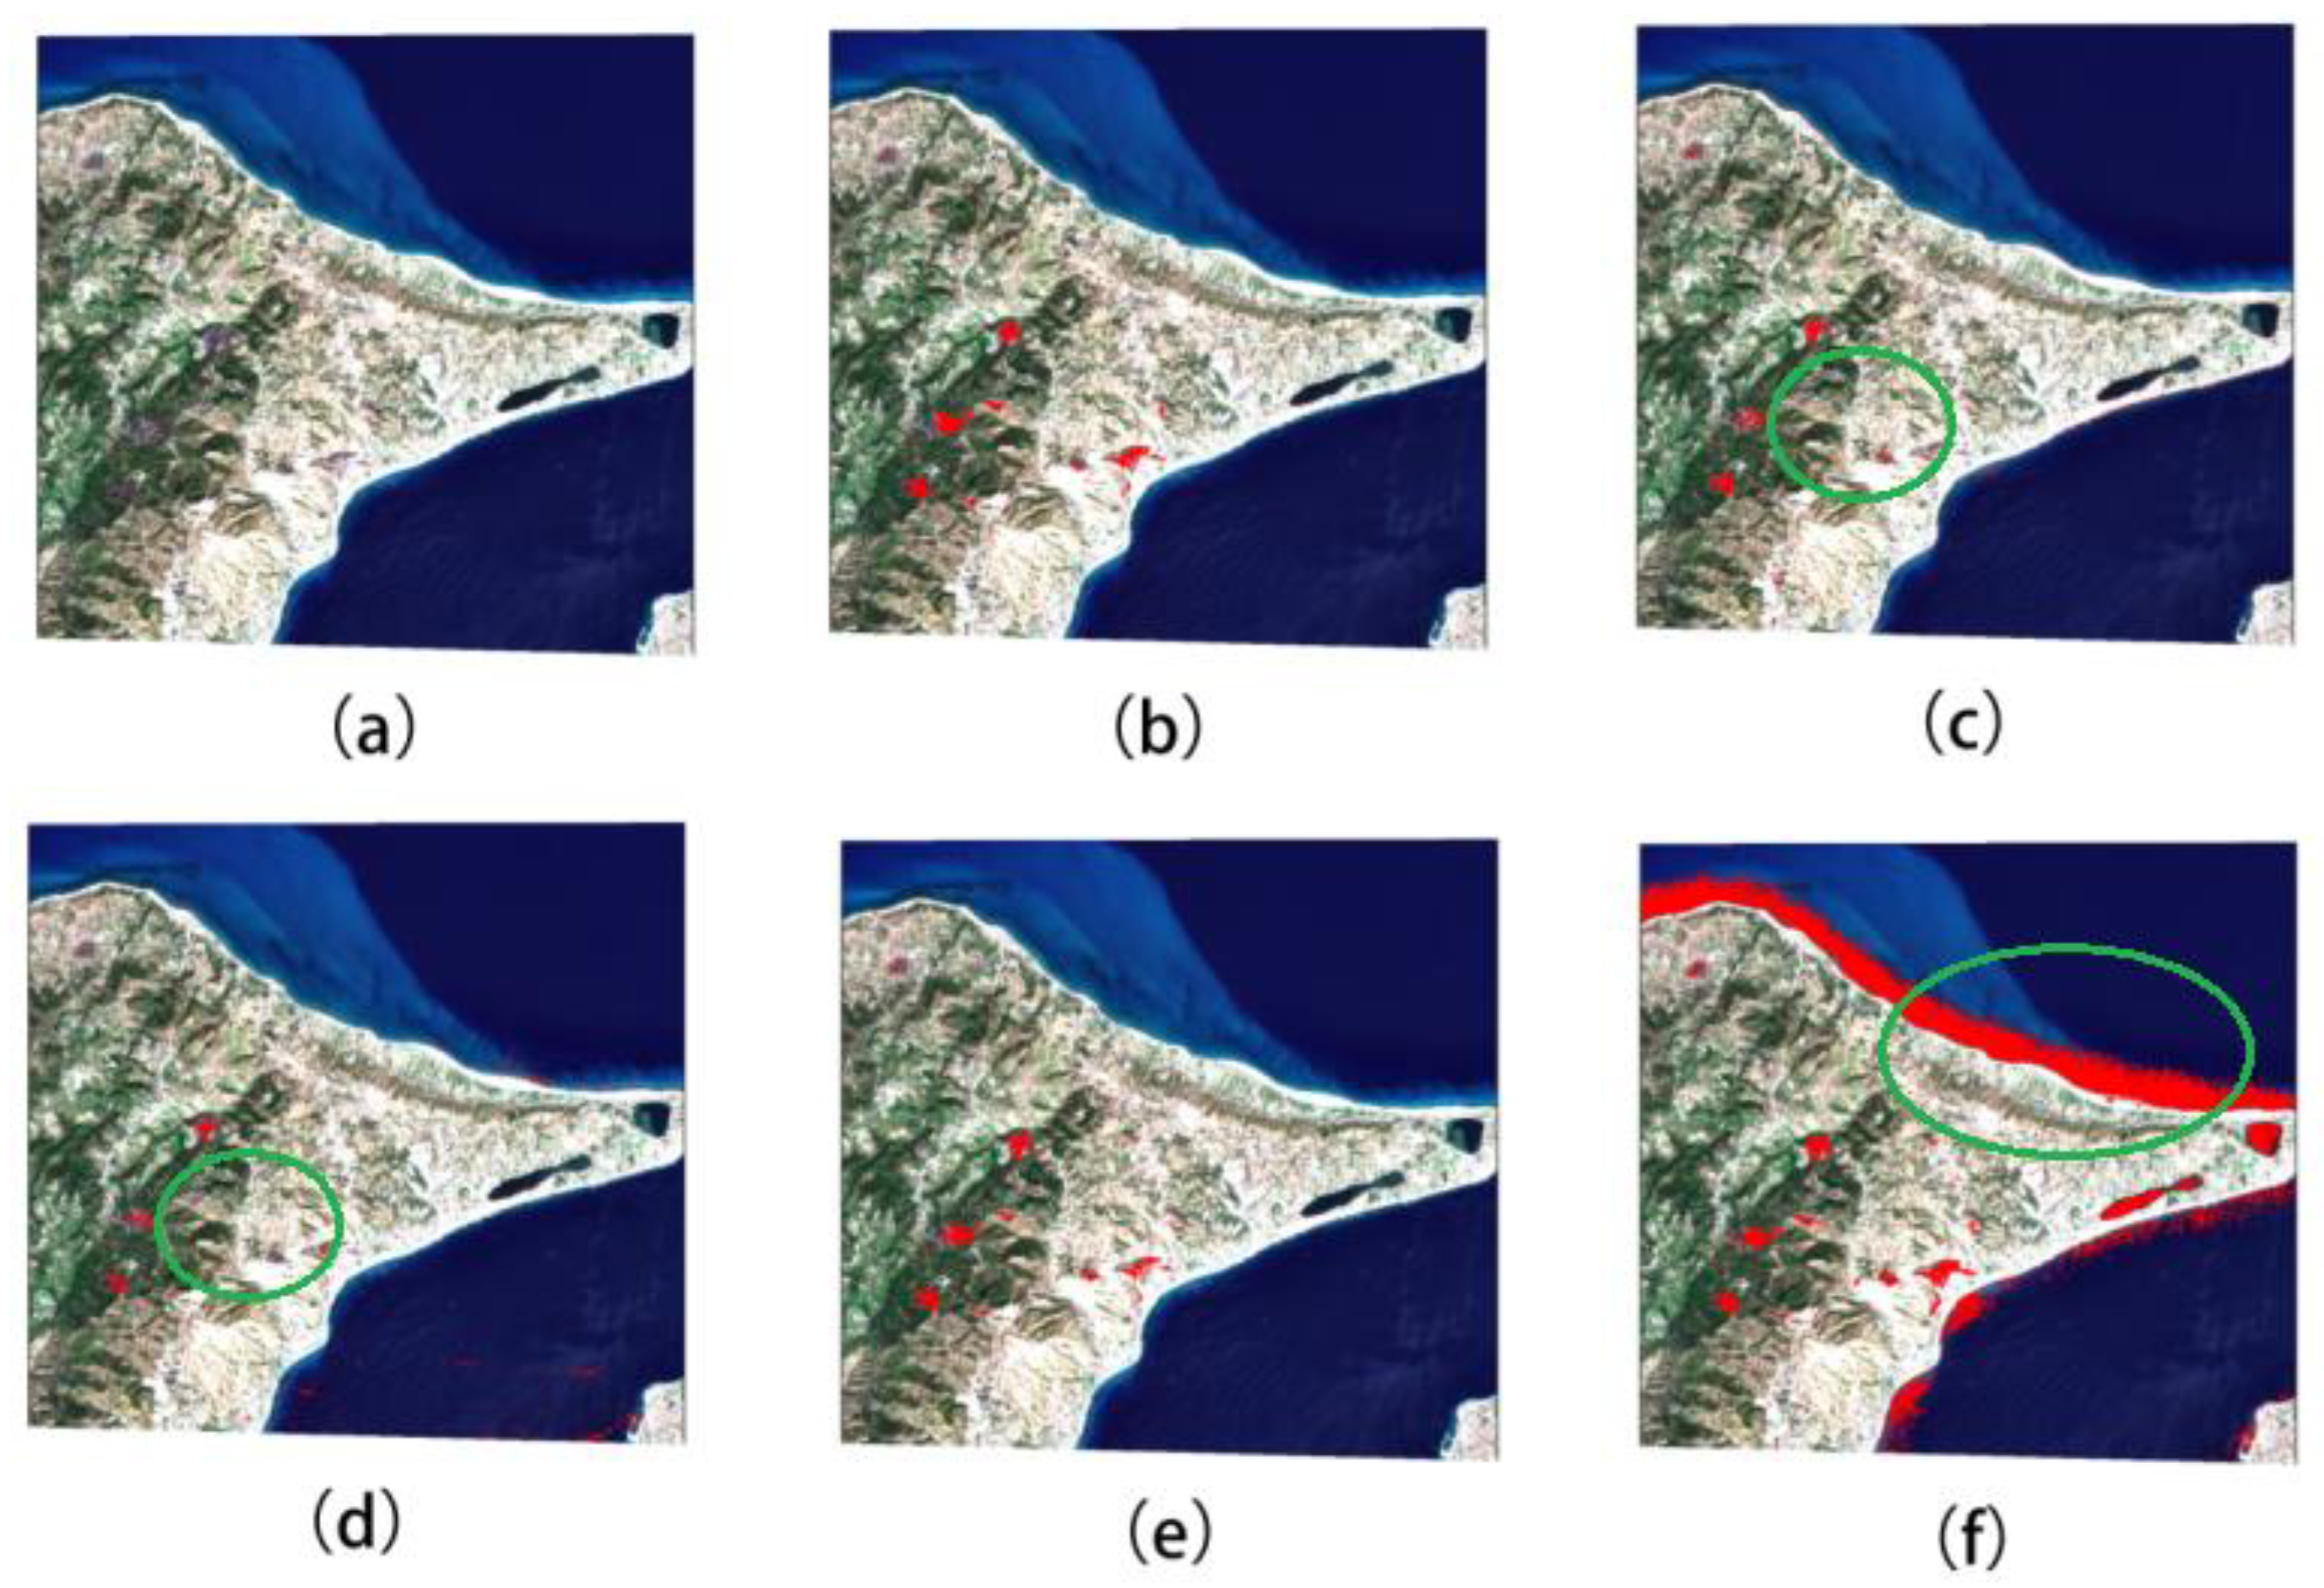
The distinction of water bodies from burned areas is also a challenge with the spectral indices and threshold segmentation methods. To verify the performance of ABAI with the impact of water bodies, a test with the image covering Sicily, Italy, collected on 23 August 2019, was also implemented. As can be seen in Figure 8a, this region is surrounded by the sea except in the southwestern part, where the inland areas are predominantly rural, characterized by the dense vegetation of the Peloritani mountains, while heavily inhabited and urbanized in the coastal area. Notably, this region is particularly prone to bushfires because of its natural environment with a great diversity of vegetation [39].
Similarly, by elaborately selecting the segmented thresholds, the extracted burned areas using various indices are listed and compared in Figure 9. It can be found from Figure 8a,b that both NBR+ and ABAI can achieve relatively high classification, as the burned lands are all well delineated. However, some detectable omission errors are generated in the classification with the MIRBI and BAI methods, as shown in the highlighted areas. In addition, MNBR produces commission errors in shallow water bodies along the coastline of the peninsula, which are severely confused with the burned areas. This is caused because the MNBR uses only the bands B12 and B8A, where water bodies tend to have high brightness values of the pixels. In comparison, the NBR+ and ABAI introduce the band B3 and subtract the amount of its energy, preventing water bodies from being confused with burned areas. Consequently, the pixels that reflect in these bands (water) tend to go dark, and only the burnt areas become light to be easily identifiable.
To sum up, the proposed method visually outperforms the other methods for all three study cases. These results are reasonable because we have fully considered the separating problem among the burned area, water, shadow and urban area in constructing the ABAI index with respective objective function.

3.3. Quantitative Evaluation of the Indices

To quantitatively evaluate the classification accuracy of the used spectral indices, 100 samples of burned areas and 300 samples of non-burned areas for each of the images are selected to form their respective confusion matrix. The classification accuracy of the burned area is assessed, as listed in Table 5, where values with the highest accuracy are highlighted in bold. It is noted that the closer the accuracy index values are to 1, the more satisfactory the results are. The results obtained from Table 5 are very encouraging for the proposed index as the overall accuracy (OA) value is close to 1, indicating the ABAI method is effective and correctly separates the burned areas from non-burned areas. In addition, the OA value generated by ABAI is always the highest compared to the results from other spectral indices, indicating that better performance of the ABAI can be achieved compared to the NBR+, BAI, MIRBI and MNBR methods. The result is consistent with the classification map shown in Figure 7 where the ABAI shows good performance of the method in suppressing the noise from clouds. Taking ABAI as an effective method, we can approximately estimate that the total fire affected areas in Qinyuan fire event are 10,227.15 ha.
The same observation can be found in study area 2, where the result obtained by NBR+ presents the lowest values of OA and kappa compared to the results by MNBR and ABAI. This is caused by the noise generated from clouds, where the cloud feature was misclassified as the burned area with the NBR+ method. By contrast, burned areas are accurately detected with MNBR and ABAI by suppressing the clouds. In both cases, ABAI performs well in distinguishing burned areas from non-burned areas in scenarios with clouds, where the highest value of OA can be obtained by ABAI. Using the ABAI method, we can then estimate that the total fire affected areas in the Xichang fire event are about 2811.96 ha, which is very close to the actual conflagration area of 3047.78 ha released by officers [40]. The detected burned area is slightly less than that of the actual field investigation. One possible reason is that the surface fires in some places may not be detectable to optical images due to dense tree crowns, which unavoidably produces the omission error. With the support of local land cover data [26], it can also be inferred that the disaster types are predominately by closed evergreen needle-leaved forest (41%) and grassland (29%).
As for the Sicily site, the results obtained by MNBR present the lowest OA value and kappa, with their values of 0.604, and 0.897, respectively. In contrast, the results generated by ABAI and NBR+ achieve the highest and second highest values, where their OA values are 0.973 and 0.953, and kappa coefficients 0.844 and 0.705, respectively. The lower accuracy is mainly caused by confusions between the burned area with water bodies, such as the beach and offshore shallow waters, by the MNBR method. By contrast, NBR+ and ABAI can be effective to detect the burned areas by suppressing the noise from water bodies. According to the performance of the three burned area indices, ABAI always presents the best results for burned area detection with the ability to suppress the impact of those land surfaces with high reflectance, such as clouds, beaches and offshore shallow waters. Moreover, ABAI can effectively distinguish burned areas from non-burned areas, which provides an optional tool for burned area mapping based on the single-temporal satellite image.

4. Discussion

This paper describes a novel spectral index for detecting burned areas from the newly launched Sentinel-2 images based on a multi-objective optimization approach. Experiments demonstrate that the proposed ABAI allows us to delineate fire scars more accurately than the other existing indices and guarantees high performance even in the presence of water bodies and clouds. This is reasonable due to some typical classes including water and clouds being considered in the optimization, where the ABAI supplies negative values for shadows and water, and therefore cannot be confused with burned area pixels. It should be noted that although we can apply masks to remove some certain land covers before the use of other indices for burned area detection, e.g., normalized difference water index (NDWI) for the water bodies and normalized difference building index (NDBI) for buildings, this strategy inevitably poses error accumulation, because totally accurate masks are impossible. Moreover, the use of NDWI or NDBI for mask increases complexity and uncertainty due to the additional threshold to be optimized [41].
Another advantage of this framework is flexibility to specify the different objective functions and constraints. For instance, if we want to detect the burned lands from forest fire and grass fire, we may subdivide them into two classes for spectral analysis to formulate different objective functions, which may introduce other bands and generate another burned area index. However, it also should be noted that containing excessive objective functions and constraints in a multi-objective optimization problem will cause infeasible solutions. As a result, it is still worthwhile to refine the objective functions and select the most informative bands in practice.
We are aware that our work is preliminary, and many works are left to be conducted in the future. First, although we have only validated its effectiveness on burned area detection for the Sentinel-2 images, as a unified approach, the other satellite sensors, such as MODIS, ETM+ and GF-1, can also be constructed and tested with the analogous procedures [42,43] with more images and different circumstances. Second, as the derived index is related to the coefficients optimized by solving the multi-objective problem, we can infer that the qualities of samples of different land covers play a crucial role in the effectiveness of the proposed method. It is unclear how the accuracy of representative samples affects the performance of the proposed method [44].
In applications, only the performance of the ABAI for burned area detection on single images has been tested in relatively small regions. However, the stability of the ABAI on a national or global scale needs to be further tested [45]. In addition, with the ABAI applied to the images collected on pre-fire and post-fire, the performance of the index can be investigated based on bi-temporal analysis [46,47]. In addition, as the ABAI is similar to the NBR, it is also interesting to investigate its sensitivity to monitor trends in burn severity [48,49,50], which will be systematically studied in the future.

5. Conclusions

Aiming at enhancing the performance of the existing spectral indices, this paper developed a novel burned area spectral index, namely ABAI, based on a multi-objective optimization approach. In contrast to MIRBI and NBR2 methods, the ABAI injected an extra green band to form the burned area index, which promotes important improvement on burned area detection. Experiments with three different Sentinel-2 images have been conducted, and the results show it is effective, especially having the superior ability of separating the water, mountainous shadows, urban areas, etc., that are prone to mix with burned areas. Compared with MNBR, NBR+, BAI and MIRBI, the ABAI is the best performing index reaching very high values of PA, UA and OA in terms of the experimental datasets. These results testify that the ABAI provides a new and effective option for single temporal post-fire burned land detection.

Author Contributions

Conceptualization, B.W.; methodology, B.W.; investigation, H.Z., B.W., Z.X. and Y.Z.; software, B.W. and Z.X.; resources, B.W. and Z.W.; writing—original draft preparation, B.W. and H.Z; writing—review and editing, B.W., H.Z. and Y.Z.; visualization, Z.X.; supervision, B.W.; funding acquisition, B.W. and Z.W. All authors have read and agreed to the published version of the manuscript.

Funding

This research was funded by National Key R&D Program “Research on forest and grassland fire early warning and prevention technology and key equipment” (Project No. 2018YFE0207800).

Acknowledgments

The authors would like to thank the anonymous reviewers and editors for their valuable comments. We thank the ESA (European Space Agency) to provide Sentinel-2 data with free access.

Conflicts of Interest

The authors declare no conflict of interest.

References

  1. Goldammer, J.G.; Statheropoulos, M.; Andreae, M.O. Impacts of vegetation fire emissions on the environment, human health, and security: A global perspective. In Developments in Environmental Science; Bytnerowicz, A., Arbaugh, M.J., Riebau, A.R., Andersen, C., Eds.; Elsevier: Amsterdam, The Netherlands, 2008; Volume 8, pp. 3–36. [Google Scholar]
  2. Giglio, L.; Randerson, J.T.; van der Werf, G.R.; Kasibhatla, P.S.; Collatz, G.J.; Morton, D.C.; DeFries, R.S. Assessing variability and long-term trends in burned area by merging multiple satellite fire products. Biogeosci. Discuss. 2009, 6, 11577–11622. [Google Scholar] [CrossRef] [Green Version]
  3. Bowman, D.M.J.S.; Balch, J.K.; Artaxo, P.; Bond, W.J.; Carlson, J.M.; Cochrane, M.A.; D’Antonio, C.M.; DeFries, R.S.; Doyle, J.C.; Harrison, S.P.; et al. Fire in the Earth System. Science 2009, 324, 481–484. [Google Scholar] [CrossRef] [PubMed]
  4. Meng, R.; Dennison, P.E.; Huang, C.; Moritz, M.A.; D’Antonio, C. Effects of fire severity and postfire climate on short-term vegetation recovery of mixed-conifer and red fir forests in the Sierra Nevada Mountains of California. Remote Sens. Environ. 2015, 171, 311–325. [Google Scholar] [CrossRef]
  5. Randerson, J.T.; Chen, Y.; van der Werf, G.R.; Rogers, B.M.; Morton, D.C. Global burned area and biomass burning emissions from small fires. J. Geophys. Res.-Biogeosci. 2012, 117, G4. [Google Scholar] [CrossRef] [Green Version]
  6. Keane, R.E.; Cary, G.J.; Parsons, R. Using simulation to map fire regimes: An evaluation of approaches, strategies, and limitations. Int. J. Wildland Fire 2003, 12, 309–322. [Google Scholar] [CrossRef]
  7. Westerling, A.L.; Hidalgo, H.G.; Cayan, D.R.; Swetnam, T.W. Warming and Earlier Spring Increase Western U.S. Forest Wildfire Activity. Science 2006, 313, 940–943. [Google Scholar] [CrossRef] [PubMed] [Green Version]
  8. Zhang, Q.; Ge, L.; Zhang, R.; Metternicht, G.I.; Du, Z.; Kuang, J.; Xu, M. Deep-learning-based burned area mapping using the synergy of Sentinel-1&2 data. Remote Sens. Environ. 2021, 264, 112575. [Google Scholar]
  9. Thompson, M.P.; MacGregor, D.G.; Dunn, C.J.; Calkin, D.E.; Phipps, J. Rethinking the wildland fire management system. J. For. 2018, 116, 382–390. [Google Scholar] [CrossRef] [Green Version]
  10. Tariq, A.; Shu, H.; Gagnon, A.S.; Li, Q.; Mumtaz, F.; Hysa, A.; Siddique, M.A.; Munir, I. Assessing burned areas in wildfires and prescribed fires with spectral indices and SAR images in the Margalla Hills of Pakistan. Forests 2021, 12, 1371. [Google Scholar] [CrossRef]
  11. Roy, D.P.; Boschetti, L.; Justice, C.O.; Ju, J. The collection 5 MODIS burned area product—Global evaluation by comparison with the MODIS active fire product. Remote Sens. Environ. 2008, 112, 3690–3707. [Google Scholar] [CrossRef]
  12. Kasischke, E.S.; Bourgeau-Chavez, L.L.; French, N.H.F. Observations of variations in ERS-1 SAR image intensity associated with forest fires in Alaska. IEEE Trans. Geosci. Remote Sens. 1994, 32, 206–210. [Google Scholar] [CrossRef]
  13. Flannigan, M.D.; Vonder Haar, T.H. Forest fire monitoring using NOAA satellite AVHRR. Can. J. For. Res 1986, 16, 975–982. [Google Scholar] [CrossRef]
  14. Chuvieco, E.; Matrin, M.P. A simple method for fire growth mapping using AVHRR channel 3 data. Int. J. Remote Sens. 1994, 15, 3141–3146. [Google Scholar] [CrossRef]
  15. Fuller, D.O.; Fulk, M. Burned area in Kalimantan, Indonesia mapped with NOAA-AVHRR and Landsat TM imagery. Int. J. Remote Sens. 2001, 22, 691–697. [Google Scholar] [CrossRef]
  16. Petropoulos, G.P.; Kontoes, C.; Keramitsoglou, I. Burnt area delineation from a uni-temporal perspective based on Landsat TM imagery classification using Support Vector Machines. Int. J. Appl. Earth Obs. Geoinf. 2011, 13, 70–80. [Google Scholar] [CrossRef]
  17. Ramo, R.; Chuvieco, E. Developing a random forest algorithm for MODIS global burned area classification. Remote Sens. 2017, 9, 1193. [Google Scholar] [CrossRef] [Green Version]
  18. Brand, A.; Manandhar, A. Semantic Segmentation of Burned Areas in Satellite Images Using a U-Net Convolutional Neural Network. ISPRS-Int. Arch. Photogramm. Remote Sens. Spat. Inf. Sci. 2021, 43, 47–53. [Google Scholar] [CrossRef]
  19. García, M.J.L.; Caselles, V. Mapping burns and natural reforestation using thematic mapper data. Geocarto Int. 1991, 6, 31–37. [Google Scholar] [CrossRef]
  20. Chuvieco, E.; Martin, M.P.; Palacios, A. Assessment of different spectral indices in the red-near-infrared spectral domain for burned land discrimination. Int. J. Remote Sens. 2002, 23, 5103–5110. [Google Scholar] [CrossRef]
  21. Alcaras, E.; Costantino, D.; Guastaferro, F.; Parente, C.; Pepe, M. Normalized Burn Ratio Plus (NBR+): A new index for Sentinel-2 imagery. Remote Sens. 2022, 14, 1727. [Google Scholar] [CrossRef]
  22. Smiraglia, D.; Filipponi, F.; Mandrone, S.; Tornato, A.; Taramelli, A. Agreement index for burned area mapping: Integration of multiple spectral indices using Sentinel-2 satellite images. Remote Sens. 2020, 12, 1862. [Google Scholar] [CrossRef]
  23. Stroppiana, D.; Bordogna, G.; Carrara, P.; Boschetti, M.; Boschetti, L.; Brivio, P.A. A method for extracting burned areas from Landsat TM/ETM+ images by soft aggregation of multiple Spectral Indices and a region growing algorithm. ISPRS J. Photogramm. Remote Sens. 2012, 69, 88–102. [Google Scholar] [CrossRef]
  24. Loboda, T.; O’Neal, K.J.; Csiszar, I. Regionally adaptable dNBR-based algorithm for burned area mapping from MODIS data. Remote Sens. Environ. 2007, 109, 429–442. [Google Scholar] [CrossRef]
  25. Schepers, L.; Haest, B.; Veraverbeke, S.; Spanhove, T.; Borre, J.V.; Goossens, R. Burned area detection and burn severity assessment of a heathland fire in Belgium using airborne imaging spectroscopy (APEX). Remote Sens. 2014, 6, 1803–1826. [Google Scholar] [CrossRef] [Green Version]
  26. Zhang, X.; Liu, L.; Wu, C.; Chen, X.; Gao, Y.; Xie, S.; Zhang, B. Development of a global 30m impervious surface map using multisource and multitemporal remote sensing datasets with the Google Earth Engine platform. Earth Syst. Sci. Data 2020, 12, 1625–1648. [Google Scholar] [CrossRef]
  27. Chuvieco, E.; Congalton, R.G. Mapping and inventory of forest fires from digital processing of TM data. Geocarto Int. 1998, 4, 41–53. [Google Scholar] [CrossRef]
  28. Trigg, S.; Flasse, S. An evaluation of different bi-spectral spaces for discriminating burned shrub savanna. Int. J. Remote Sens. 2001, 22, 2641–2647. [Google Scholar] [CrossRef]
  29. Filipponi, F. BAIS2: Burned area index for Sentinel-2. Multidiscip. Digit. Publ. Inst. Proc. 2018, 2, 364. [Google Scholar]
  30. Storey, E.A.; Stow, D.A.; O’Leary, J.F. Assessing postfire recovery of chamise chaparral using multi-temporal spectral vegetation index trajectories derived from Landsat imagery. Remote Sens. Environ. 2016, 183, 53–64. [Google Scholar] [CrossRef] [Green Version]
  31. Rouse, J.W.; Haas, R.H.; Schell, J.A.; Deering, D.W. Monitoring vegetation systems in the Great Plains with ERTS. In Proceedings of the Third ERTS Symposium, Washington, DC, USA, 10–14 December 1973; Freden, S.C., Becker, M., Eds.; NASA SP-351; National Aeronautics and Space Administration: Washington, DC, USA, 1973. [Google Scholar]
  32. Liu, Z.; Li, G. Efficient regularized regression with L0 penalty for variable selection and network construction. Comput. Math. Methods Med. 2016, 2016, 3456153. [Google Scholar] [CrossRef] [Green Version]
  33. Geoffrion, A.M.; Marsten, R. Integer programming algorithms: A framework and state-of-the-art survey. Manag. Sci. 1972, 18, 465–491. [Google Scholar] [CrossRef]
  34. Westerberg, C.H.; Bjorklund, B.; Hultman, E. An application of mixed integer programming in a swedish steel mill. Interfaces 1977, 7, 39–43. [Google Scholar] [CrossRef]
  35. Cornuéjols, G. Valid inequalities for mixed integer linear programs. Math. Program. 2008, 112, 3–44. [Google Scholar] [CrossRef] [Green Version]
  36. Nemhauser, G.L.; Wolsey, L.A. Integer and Combinatorial Optimization; Wiley-Interscience: New York, NY, USA, 1999. [Google Scholar]
  37. Ip, F.; Dohm, J.M.; Baker, V.R.; Doggett, T.; Davies, A.G.; Castano, B.; Cichy, B.; Greeley, R.; Sherwood, R. ASE floodwater classifier development for EO-1hyperion imagery. Lunar Planet. Sci. 2004, 35, 1–2. [Google Scholar]
  38. Sanchez, A.H.; Picoli, M.C.A.; Camara, G.; Andrade, P.R.; Chaves, M.E.D.; Lechler, S.; Queiroz, G.R. Comparison of cloud cover detection algorithms on sentinel–2 images of the amazon tropical forest. Remote Sens. 2020, 12, 1284. [Google Scholar] [CrossRef] [Green Version]
  39. Sciandrello, S.; D’Agostino, S.; Minissale, P. Vegetation analysis of the Taormina Region in Sicily: A plant landscape characterized by geomorphology variability and both ancient and recent anthropogenic influences. Lazaroa 2013, 34, 151. [Google Scholar] [CrossRef] [Green Version]
  40. A Report on ‘3.30’ Forest Fire in Xichang City, Liangshan Prefecture. Available online: http://scdfz.sc.gov.cn/whzh/slzc1/content_49723 (accessed on 5 September 2022). (In Chinese)
  41. Tversky, A.; Kahneman, D. Advances in prospect theory: Cumulative representation of uncertainty. J. Risk Uncertain. 1992, 5, 297–323. [Google Scholar] [CrossRef]
  42. Bastarrika, A.; Chuvieco, E.; Pilar Martín, M. Mapping burned areas from Landsat TM/ETM + data with a two-phase algorithm: Balancing omission and commission errors. Remote Sens. Environ. 2011, 115, 1003–1012. [Google Scholar] [CrossRef]
  43. Abdikan, S.; Bayik, C.; Sekertekin, A.; Bektas Balcik, F.; Karimzadeh, S.; Matsuoka, M.; Balik Sanli, F. Burned area detection using multi-sensor SAR, optical, and thermal data in Mediterranean pine forest. Forests 2022, 13, 347. [Google Scholar] [CrossRef]
  44. Mats, R.; Sander, V. How much of a pixel needs to burn to be detected by satellites? A spectral modeling experiment based on ecosystem data from Yellowstone National Park, USA. Remote Sens. 2022, 14, 2075. [Google Scholar]
  45. Hislop, S.; Jones, S.; Soto-Berelov, M.; Skidmore, A.; Haywood, A.; Nguyen, T.H. Using Landsat spectral indices in time-series to assess wildfire disturbance and recovery. Remote Sens. 2018, 10, 460. [Google Scholar] [CrossRef] [Green Version]
  46. Mashhadi, N.; Alganci, U. Determination of forest burn scar and burn severity from free satellite images: A comparative evaluation of spectral indices and machine learning classifiers. Int. J. Environ. Geoinform. 2021, 8, 488–497. [Google Scholar] [CrossRef]
  47. Itziar, A.-C.; Emilio, C. Global burned area mapping from ENVISAT-MERIS and MODIS active fire data. Remote Sens. Environ. 2015, 163, 140–152. [Google Scholar]
  48. Fernández-Manso, A.; Fernández-Manso, O.; Quintano, C. SENTINEL-2A red-edge spectral indices suitability for discriminating burn severity. Int. J. Appl. Earth Obs. Geoinf. 2016, 50, 170–175. [Google Scholar] [CrossRef]
  49. Veraverbeke, S.; Lhermitte, S.; Verstraeten, W.W.; Goossens, R. Evaluation of pre/post-fifire differenced spectral indices for assessing burn severity in a Mediterranean environment with Landsat Thematic Mapper. Int. J. Remote Sens. 2011, 32, 3521–3537. [Google Scholar] [CrossRef]
  50. Mallinis, G.; Mitsopoulos, I.; Chrysafifi, I. Evaluating and comparing sentinel 2A and landsat-8 operational land imager (OLI) spectral indices for estimating fire severity in a Mediterranean pine ecosystem of Greece. GISci. Remote Sens. 2018, 55, 1–18. [Google Scholar] [CrossRef]
Figure 1. Locations of the three study areas, from left to right, are Qinyuan County, Shanxi Province, China, Xichang City, Sichuan Province, China and Sicily Island, Italy.
Forests 13 01787 g001
Figure 2. The framework of the ABAI construction.
Forests 13 01787 g002
Figure 3. Spectral profiles represented by the mean of eight typical land covers based on the Sentinel-2 image.
Forests 13 01787 g003
Figure 4. Stability comparisons between the proposed ABAI and typical burned area indices.
Forests 13 01787 g004
Figure 5. Display of Sentinel-2 image at Qinyuan county and associated image features derived from different spectral indices. (a) False color image composited with 12-8A-4 bands; (b) NBR+; (c) BAI; (d) MIRBI; (e) ABAI; (f) MNBR. (Note that image contrasts among the burned lands, water and clouds were highlighted with red box).
Forests 13 01787 g005
Figure 6. A sensitive analysis of different threshold segmentation to the classification accuracy.
Forests 13 01787 g006
Figure 7. Burned area classification by image segmentation using respectively optimal threshold (a) visual interpretation; (b) NBR+; (c) BAI; (d) MIRBI; (e) ABAI; (f) MNBR.
Forests 13 01787 g007
Figure 8. Display of Sentinel-2 image at Xichang city and associated image features derived from different spectral indices. (a) False color image (composite bands 12-8A-4); (b) NBR+; (c) BAI; (d) MIRBI; (e) ABAI; (f) MNBR. (Note clouds and shadows are mixed to the burned area and are highlighted with green circles).
Forests 13 01787 g008
Figure 9. Display of Sentinel-2 image at Sicily Island and associated image features derived from different spectral indices. (a) False color image (composite bands 12-8A-4); (b) NBR+; (c) BAI; (d) MIRBI; (e) ABAI; (f) MNBR. (Note omission errors can be found in highlighted areas with green circles).
Forests 13 01787 g009
Table 1. Description of the band features of Sentinel-2 images.
BandsS2A Central Wavelength (nm)S2B Central Wavelength (nm)Resolution (m)
B1-Coastal Aerosol442.7442.260
B2-Blue492.4492.110
B3-Green559.8559.010
B4-Red664.6664.910
B5-Red Edge1704.1703.820
B6- Red Edge2740.5739.120
B7- Red Edge3782.8779.720
B8-NIR832.8832.910
B8A-Narrow NIR864.7864.020
B9-Water Vapor945.1943.260
B10-SWIR Cirrus1373.51376.960
B11-SWIR11613.71610.420
B12-SWIR22202.42185.720
Table 2. Data parameters and sources.
Study CaseSensorOrbitAcquisition Date
Qinyuan Sentinel-2BR11810-06-2018
Sentinel-2AR11810-06-2019
Xichang CitySentinel-2BR10430-03-2020
Sentinel-2BR10409-04-2020
Sicily IslandSentinel-2AR03624-07-2019
Sentinel-2AR03623-08-2019
Table 4. Values of band ratios of most confused land covers (9 bands divided by the SWIR2 band).
Bi/SWIR2Burned LandBare LandShadowWaterBuildings
Q10.230.320.460.430.32
Q20.300.460.770.690.39
Q30.360.650.600.480.55
Q40.541.033.292.970.69
Q50.591.113.863.440.72
Q60.631.143.963.540.72
Q70.651.164.103.610.73
Q80.981.221.951.990.99
Q911111
Table 5. Quantitative assessments and comparisons of the extraction accuracy for the different methods, where PA and UA represent the producer’s and user’s accuracy, respectively (Note values with the highest accuracy are highlighted in bold).
Study CasesMethodPA-BAPA-Non BAUA-BAUA-Non BAOAKAPPA
MNBR0.878 0.940 0.930 0.895 0.910 0.820
NBR+0.866 0.964 0.956 0.888 0.917 0.833
Qinyuan BAI0.9940.833 0.844 0.9940.910 0.820
MIRBI0.814 0.900 0.881 0.842 0.859 0.717
ABAI0.848 0.9820.9770.877 0.9180.835
MNBR0.8470.9050.7790.9370.8880.732
NBR+0.8000.8440.6700.9140.8310.608
Xichang BAI0.4130.9760.8730.8070.8160.463
MIRBI0.8670.9130.7980.9450.8990.759
ABAI0.8330.9310.8280.9340.9030.763
MNBR0.9510.8910.5030.9940.8970.604
NBR+0.6140.9920.8990.9570.9530.705
SicilyBAI0.7050.9840.7850.9450.9340.680
MIRBI0.8210.8820.7550.9180.9360.686
ABAI0.7820.9950.9520.9750.9730.844
Publisher’s Note: MDPI stays neutral with regard to jurisdictional claims in published maps and institutional affiliations.