Abstract
Bacterial biostimulants are an eco-friendly alternative to chemical fertilizers. However, before their introduction into open ecosystems, broad-scope studies need to be carried out. Paenibacillus sp. was shown to positively affect poplar root growth. It was hypothesized that alongside these improvements, the Paenibacillus sp. inoculant may affect its host’s secondary metabolism. Populus tremula × P. alba microshoots were inoculated in vitro. Microshoots were tested for chlorophyll, carotenoid, total flavonoid (TFC), total phenol content (TPC) and free radical scavenging capacity during primary growth after 4, 6 and 8 weeks. The results showed that the inoculation decreased shoot phenolics and free radical scavenging capacity after 6 and 8 weeks. Chlorophyll b amounts increased after 6 and 8 weeks. Carotenoid content decreased after 6 weeks, while chlorophyll a and carotenoid levels increased after 8 weeks. Correlation and principal component analyses showed that the inoculant changed the way in which the photosynthesis pigment content relates to TPC, TFC and radical scavenging activity. Overall, these data suggest that the inoculant does statistically significantly affect Populus tree secondary metabolism in the later stages of the initial growth period. This effect may potentially be compensatory in nature.
1. Introduction
In recent years research on bacterium-based biostimulants has been on the rise, due to the negative effects that chemical fertilization and pesticide use have on the environment [1,2,3,4]. However, most of it is directed towards food crops, and comparatively fewer studies have been carried out on biostimulant use on trees, even though, in the face of climate change and loss of biodiversity, reforestation often plays a large role.
Multiple studies have demonstrated that plant-growth-promoting bacteria (PGPB, or plant-growth-promoting rhizobacteria (PGPR)) can serve as effective biostimulants [5,6,7,8,9,10] and biocontrol agents [11,12,13], both in controlled settings and in field trials. PGPB may benefit their hosts in a variety of ways: through help with nutrient availability, phytohormone production, induced systemic resistance, antagonistic effects on plant pathogens, response to stress, etc. [1,2,3,11,12,14].
To determine the advantages of using microbial biostimulants, various variables can be taken into consideration: visually observable vegetative growth parameters [8], antagonism to pathogens [12], photosynthesis pigment content [10,14,15,16], antioxidant activity [17,18] and secondary metabolites (SMs) such as phenolics [15,19].
According to Schulz et al., “Most plants are healthy, in part due to metabolic interactions between the holobiont’s host and its microbiome...” [20]. Hence, it is obvious that the modification of the plant’s microbiome can have multifaceted outcomes for the plant. Furthermore, it has been demonstrated that modifying the plant’s environment with bacteria may have both species-specific and genotype-specific outcomes [5,8,15,21,22,23,24,25,26]. Additionally, these outcomes may also be shaped by the plant’s growth stage [25] and environmental conditions [10,14]. Thus, it is extremely important to fully comprehend the consequences that may follow the introduction of new biostimulants to the microbiome of plants and the open ecosystems, especially since microorganisms are key elements in all biogeochemical cycles and could potentially affect the condition of the entire ecosystem [27].
It is noteworthy that while the field of bacterial biostimulants is expanding, broad-ranging studies into the assorted effects that one microorganism species can have on their plant host are still necessary. To our knowledge, there are not any studies that represent bacterial-inoculant-induced time-dependent metabolite changes during the initial growth stages of woody plants.
Poplars are valuable model organisms that represent all trees and other woody plants in a variety of studies. Poplar microshoot cultures also serve as a model experimental system for woody plant–microorganism interaction research. This is due to several factors, including their relatively easy in vitro propagation and clonal tissue culture initiation, fast growth, wide habitat range and the accessible information about their whole genome [27]. Moreover this genus is grown widely for profit [28].
PGPB, Paenibacillus sp., was recently isolated from oaks (Quercus robur) and tested on two distinct model poplar (Populus spp.) microshoot cultures, resulting in the enhancement of their root system [8]. Additionally, this bacterial species was shown to have several plant-growth-promoting properties (phytohormone indole-3-acetic acid (IAA) production; both phosphate solubilization and mineralization in vitro) [8], making it a potentially effective biostimulant for trees.
Thus, we hypothesize, that Paenibacillus sp. may have an impact on poplar’s photosynthesis pigment content, antioxidative response and phenolics and hence could potentially induce systemic resistance, which would help with poplar’s stress responses during the timeframe of initial growth.
The results of the experiments showed that Paenibacillus sp. inoculation had an effect on poplar microshoot secondary metabolism that is not suggestive of induced systemic resistance, although an antioxidant compensatory mechanism was also observed.
2. Materials and Methods
The experiment was conducted using a model hybrid poplar Populus tremula × P. alba in vitro clone microshoot culture, established in the laboratory of the Forest Research Institute, Poland, from the vegetative buds of 6–7-year-old cloned trees. At the time of the experiment, the culture was kept up for 4 years via bimonthly transfers (5.25 ± 0.25 mL of solid Murashige and Skoog (MS) media, supplemented with 2% sucrose and 0.4% gelrite (gelling agent), w/v, pH 5.6 ± 0.1) to fresh media and grown under a 16/18 h 25/20 °C cycle with cool white fluorescent light (Osram, Munich, Germany, 2 × 36 W, 22 μmol m−2 s−1) in 20 mm glass tubes. All the media and other components were purchased from Duchefa Biochemie (Haarlem, The Netherlands) and used per the manufacturer’s instructions.
2.1. Inoculation and Growth Conditions
Paenibacillus sp. was used to inoculate poplar microshoots based on previously documented plant-growth-promoting abilities on this exact microshoot culture [8].
The tests were performed under previously described conditions, using Woody Plant media (WPM) (additionally 0.4% gelrite, 2% sucrose, w/v, pH 5.6 ± 0.1). In total, 30 two-month-old poplar microshoots were divided into three independent replicates per one group at one time period. For the uninoculated control groups, microshoot leaves were gently removed, and the stems were divided into 10 mm segments with 2–3 growing nodes on each stem (exempting the primary apical top). Every segment was individually placed into a ⌀20 mm glass tube with 5.25 ± 0.25 mL of WPM. The tubes were capped and placed in a growth chamber.
For groups inoculated with Paenibacillus sp., the inoculant was prepared prior to inoculation. A swab from a single bacterial colony was transferred to a fresh plate with low-salt Lysogeny broth (LB) medium (pH 7.2 ± 0.1, tryptone—10 g/L, NaCl—5 g/L, yeast extract—5 g/L) and grown at +25 ± 1 °C overnight. The next day, prior to the transfer of poplar segments, tubes were inoculated with a swab using an inoculation needle [8]. Then, poplar segments were carefully placed into the stab area.
Sample measurements were taken after 4, 6 and 8 weeks (this represents three different groups, as the measurements required the destruction of the samples). Chlorophyll a and b (CHA, CHB, respectively), carotenoids (CAR), total phenol content (TPC), total flavonoid content (TFC) and antioxidant capacities using DPPH (2,2-diphenyl-1-picryl-hydrazyl-hydrate) and ABTS (2,2′-azino-bis (3-ethylbenzothiazoline-6-sulfonic acid)) assays were measured.
2.2. Sample Collection and Preparation for Metabolic and Physiological Assays
After each growth period, samples were collected and immediately prepared for future metabolic and physiological assays.
For the photosynthesis pigment analysis, a total of 0.5 g of fresh aboveground biomass (stems as well as leaves, as at these growth stages, they still serve a purpose in photosynthesis) was collected from both the control group and the inoculated group after 4, 6 and 8 weeks at each time point. The total biomass was divided into three biological replicates per each time point. Immediately after collection and weighing, fresh biomass was stored at –20 °C until use.
For the other metabolic tests and DPPH and ABTS assays, 75% methanol (MeOH (Chempur, Piekary Śląskie, Poland)) was used for extraction. In total, 1.1 g of fresh aboveground biomass was collected from both the control group and the inoculated group after 4, 6 and 8 weeks at each time point. The total biomass was divided into seven biological replicates per each time point. Samples were homogenized by ceramic mortar and pestle and placed in inert plastic screw cap tubes; then 10 mL of 75% MeOH was added. Samples were subsequently placed in a thermal shaker for 24 h at +25 °C, 1 × g, in the dark. Next, samples were filtered using filter paper with a retention of 5–8 µm. Extracts were then stored at –20 °C until use.
2.3. Metabolic and Physiological Assays
2.3.1. Measurements of Photosynthesis Pigments
Relative amounts of CAR, CHA and CHB were measured via their absorbance. Frozen leaves were ground with mortar and pestle using pure acetone (30 mL) (Chempur) as extracting agent. This extract was then filtered as previously described and used for absorbance measurements with a UV–VIS spectrophotometer 80+ (PG Instruments, Lutterworth, UK) at 440, 662 and 664 nm (CAR, CHA and CHB, respectively). Three technical replicates were measured for each sample at each wavelength independently. For the calculation of pigment content, the following formulas were used [29] (mg g−1):
where A—absorbance, V—total extract volume (mL), P—fresh aboveground biomass (g).
2.3.2. Total Phenol Content
The methanol extracts were used to determine TPC. A modified method utilizing the Folin–Ciocalteu reagent (VWR Chemicals, Radnor, PA, USA) was applied [30]. Briefly, 0.1 mL of extract was mixed with 0.1 mL of the reagent (2 N) and 2.5 mL of distilled water (dH2O) and incubated for 6 min. Then, 0.5 mL of 20% (w/v) Na2CO3 (Molar Chemicals KFT, Hungary) was added. The mixture was then left to incubate at 22 °C for 30 min. Absorbance was measured using a Synergy HT Multi-Mode Microplate Reader (BioTek Instruments, Inc., Bad Friedrichshall, Germany) at 760 nm (75% methanol as blank). Three technical replicates were measured for each sample. TPC was expressed as chlorogenic acid (TCI, Tokyo, Japan) per gram of fresh weight (mg CAE g−1). The standard calibration curve equation used was y = 5.5358x − 0.0423 (R2 = 0.9975).
2.3.3. Total Flavonoid Content
TFC was determined using a modified method [19,31]. The methanol extract (1 mL) was mixed with 0.3 mL of 5% (w/v) NaNO2 (VWR Chemicals) and incubated for 5 min. Next, 0.5 mL of 2% (w/v) AlCl3 (Alfa Aesar, Haverhill, MA, USA) was added and incubated for 6 min. Subsequently, 0.5 mL of NaOH (Merck, Darmstadt, Germany) (1 M) was added. The absorbance of the mixture was measured at 470 nm (75% methanol as blank) on the Synergy HT Multi-Mode Microplate Reader. Three technical replicates were measured for each sample. TFC was expressed in milligrams of catechin (Merck) per gram of fresh weight (mg CE g−1). The standard calibration curve equation used for TFC was y = 11.616x + 0.0634 (R2 = 0.9983).
2.3.4. DPPH Assay
The total free radical scavenging capacity of the extracts was determined using a modified method [19,32]. The methanol extract (0.1 mL) was mixed with 1 mL of DPPH (TCI) solution (0.1 mM; in 75% methanol) and incubated in the dark (+22 °C) for 16 min. Absorbance was measured at 515 nm on a Synergy HT Multi-Mode Microplate Reader (0.1 mL of 75% MeOH and 1 mL of DPPH solution as a blank). Three technical replicates were measured for each sample. The standard calibration curve equation used was y = 0.2074x − 0.004 (R2 = 0.9907). The radical scavenging capacity was expressed as antioxidant Trolox (vitamin E analogue) (Merck) equivalent per gram of fresh weight (mM TE g−1):
where c—Trolox equivalent concentration (mM mL−1), V—total extract volume (mL), m—fresh aboveground biomass (g).
2.3.5. ABTS Assay
The free radical scavenging capacity was also determined using the ABTS radical cation decolorization assay [19]. One day before the measurements were taken, the ABTS solution was prepared; 0.056 g of ABTS (>99% purity, Alfa Aesar) was dissolved in 50 mL of dH2O. All of the ABTS stock solution was mixed with 200 µL of 70 nM K2S2O8 (0.1982 g K2S2O8 (Molar Chemicals KFT, Halásztelek, Hungary) dissolved in 10 mL dH2O). The mixture was held in the dark at +4 °C for 16 h before it was used. Next, if necessary, the mixture was diluted with dH2O until it reached 0.700 ± 0.2 absorbance (734 nm) (dH2O as a blank); otherwise, 50 µL of the sample methanol extract was mixed with 2 mL of ABTS solution and placed in the dark for 10 min. Subsequently, the absorbance was measured on a Synergy HT Multi-Mode Microplate Reader (50 µL of 75% methanol and 2 mL of ABTS solution were used as a blank). Three technical replicates were measured for each sample. Trolox was used as the standard. The radical scavenging capacity was expressed as antioxidant Trolox equivalent per gram of fresh weight (mM TE g−1), Formula no. 4 was used for calculations.
2.4. Statistical Analysis of the Data
Pooled data from three independent experiments were used for statistical analysis, which was performed using the open access R software (version 4.0.5; accessed on 7 January 2022) [33]. All the data points stemmed from three technical replicates and 3–7 biological replicates, depending on the metabolite group. Thirty poplar microshoots were used for each inoculated and control group at each time point divided into three independent replicates. Data were tested for normal distribution of residuals (Shapiro-Wilk test) and homogeneity of variance (Levene’s Test) with “car” package functions [34]. ANOVA was then performed using the aov from the “stats” function. For data that showed a significant deviation from the normal distribution of residuals, a non-parametric analog of ANOVA, Kruskal–Wallis test, was performed. Tukey Honest Significant Differences tests (HSDs) were performed for multiple pairwise comparisons between the means of groups using the TukeyHSD function from the “stats” package.
To build the correlation matrix, the average for each group was calculated. For log-transformed data, the Pearson correlation coefficient was calculated using the rcorr function from the “Hmisc” package [35]. To visualize the correlation matrix, the corrplot function from the “corrplot” package was used [36]. Visualization of feature distribution (principal component analysis, PCA) was carried out using the “ggplot2” package [37].
The 7 measured bioactive compounds were simplified and classified into components through PCA with prcomp from the “Factoextra” package [38].
3. Results
ANOVA data on the seven tested poplar secondary metabolism and physiological parameters are displayed in Figure 1. After 6 weeks, all the data were statistically significant except the amount of CHA (p > 0.05), and all the data after 8 weeks were statistically significant. TPC (−8.2%), TFC (−13.7%), CAR (−15.3%), ABTS (−22.7%) (this abbreviation will henceforth be used for free radical scavenging capacity measured using the ABTS assay) and DPPH (−7.7%) (this abbreviation will henceforth be used for free radical scavenging capacity measured using the DPPH assay) metrics were lower in the inoculated group, namely, the poplar microshoots inoculated with Paenibacillus sp., after 6-week incubation, while CHB metrics were higher by 32.9% in regard to their respective control groups.
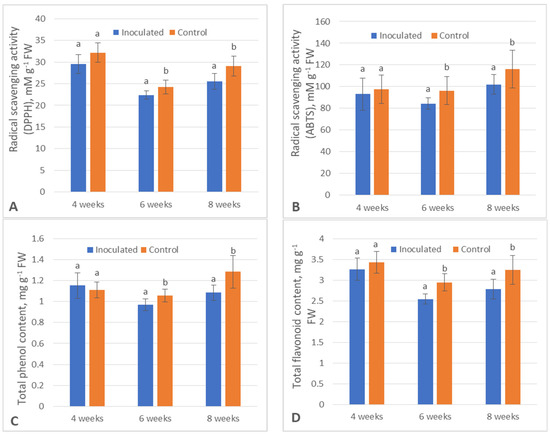
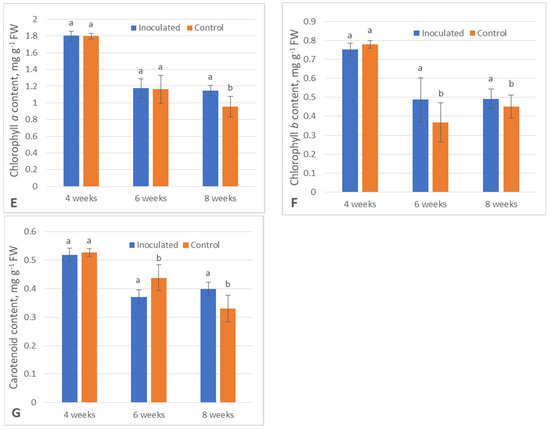
Figure 1.
The concentrations of tested bioactive compounds in the control (uninoculated) and Paenibacillus sp. inoculated groups throughout the experiment: (A)—antioxidant scavenging (DPPH), (B)—antioxidant scavenging (ABTS), (C)—total phenolic content (TPC), (D)—total flavonoid content (TFC), (E)—chlorophyll a (CHA), (F)—chlorophyll b (CHB), (G)—carotenoids (CAR). Different letters above data from each week indicate significantly different results between control and inoculated groups, p ≤ 0.05.
Comparatively, TPC, TFC, ABTS and DPPH were lower after 8 weeks by 15.6%, 14.4%, 21.4% and 12.4%, respectively, and all photosynthesis pigment contents were higher (CHA—+20.2%, CHB—+9.2%, CAR—+21.1%) in the inoculated plants in regard to their respective control groups.
There was a clear upward trend regarding the amounts of plant phenolics (TPC and TFC) as well as free radical scavenging capacity (ABTS and DPPH) over the duration of the experiment in both control and experimental groups; however, a significant divergence occurred between the two after the initial incubation period of 4 weeks.
On the other hand, the photosynthesis pigment content did not present a clear trend either way in either of the groups. After 6 weeks, the amounts of CAR decreased in the inoculated plants compared to the control, while CHB increased, and after 8 weeks, all the photosynthesis pigment contents significantly increased in the experimental group.
Correlation analysis allows for statistically significant relationships to be observed between different variables and shows whether that relationship is directly proportional or directly opposite, which, in this case, allowed for assumptions to be made regarding the varied mechanisms that regulate poplar’s metabolism. Figure 2 shows the correlation between the amount of bioactive compounds in the control and experimental groups after the 8th week of incubation. In both the experimental and control groups, the amounts of TPC–TFC, TPC–ABTS, DPPH–CHB, CHA–CHB, CHA–CAR and CHB–CAR displayed moderate to strong positive correlations. Simultaneously, a moderately positive correlation between TFC and ABTS, and a moderately negative correlation between TPC and CAR and ABTS–CAR were observed in the control group, and moderately positive correlations in TFC–CHA, TFC–CHB, TFC–CAR, DPPH–CHA and DPPH–CAR were noted in the experimental group. Specifically, inoculation lowered the correlation between TFC, TPC, ABTS and DPPH and the pigments.
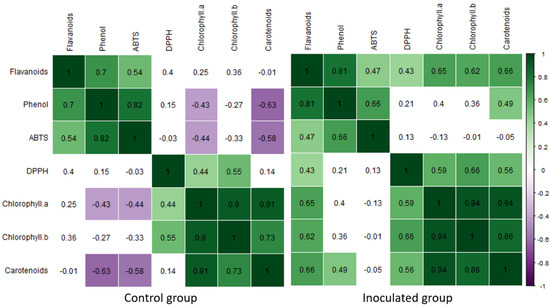
Figure 2.
Correlation matrix for the data acquired after the 8th incubation week with Paenibacillus sp. (right) and their respective control groups (left), based on the Pearson correlation coefficient. Significant (p ≤ 0.05) correlation coefficients are colored.
Principal component analysis is a technique used to simplify data when multiple complex data points and variables are available. This group’s data, based on multivariate similarities, and similarly to correlation analysis, allows one to gauge the relationships between variables and how much they influence the grouping results and total variance. In this work, PCA analysis was performed to evaluate overall relationships between the levels of bioactive compounds after the eight experimental weeks (Figure 3). The results complimented the correlation analysis, showing some overlap between the two groups; however, there were diverging group mean values, which corresponded with the ANOVA results.
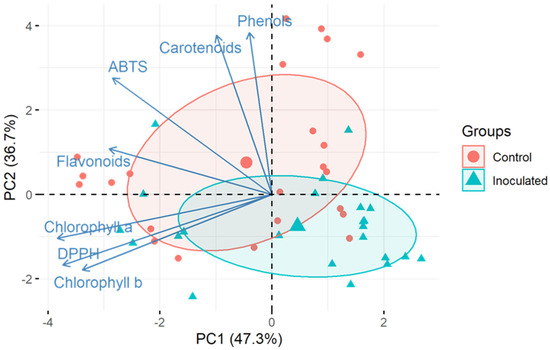
Figure 3.
Concentration of tested metabolic and physiological parameters throughout the experiment via principal component analysis (PCA) displaying the main principal components (PCs), which represent 84.41% of cumulative variance. Loading vectors show the correlation between tested variables.
The seven principal components explained the total variance and three explained 92.3% of the total variance of the parameters (Table 1).

Table 1.
Total variance of the cumulative data gathered throughout the experiment explained by principal components.
Loading vector analysis showed that TPC, CAR and ABTS were all highly positively linked with principal component 2 (PC2), as was TFC, but to a lesser extent. CHA, CHB and DPPH were all negatively linked with PC1. Further relationships between the PCs and measurements can be seen in the rotated component matrix (Table 2), which suggests a possible meaning of these three principal components, as follows: PC1—pigments; PC2—ABTS and phenolics; and PC3—DPPH.
Table 2.
Rotated principal component matrix and individual proportion of variance for each measured metric.
The results showed that the first two principal components (PCs) accounted for 84.41% of the total variation (Figure 3). PC1 (47.3%) was mainly explained by the chlorophyll and CAR content. In turn, PC2 (36.7%) was mainly explained by the ABTS activity and phenolics (although TFC to a lesser extent). PC3 could mainly be linked to DPPH data, although the total input of PC3 was only ~8.2%.
4. Discussion
Changes within a plant’s metabolome illuminate how a specific plant may react to new conditions [39]. Bacterial inoculants have been shown to affect plant metabolism in previous studies [15,21,40,41,42]. The latest research suggests that they often act in a regulatory role [43].
Plant SMs are often linked with the plant’s resistance to environmental stressors [26,44,45,46,47,48]. Phenols, flavonoids specifically, can act in various roles: as antioxidants [44,45], antimicrobials [45], etc. Studies pointing to the increases in SM production due to microbial inoculation posit that such a response creates induced systemic resistance (ISR) and will likely help with future responses to pathogen attacks [49,50] or abiotic stress [51]. The data of our experiment showed that the SMs and free radical scavenging activity decreased within the studied timeframe; thus, it could be assumed that the tested bacteria did not induce systemic resistance during initial growth in the tested plants.
Wallis and Galarneau conducted a meta-analysis on this subject (data from 2008 to 2017). In contrast with our own results, they confirmed that total phenolics increase when colonized by both bacteria and fungi. More importantly, their results demonstrated that the type of bacteria (beneficial or not) did not merit different reactions, but the type of fungi did (TPC increased after introduction to beneficial fungi) [52]. Other research demonstrated that SM production decreased after fungal pathogen attack [26,53] or increased after inoculation with PGPB Bacillus subtilis [19], seemingly confirming these findings.
In comparison with our study, Lolium perenne grass inoculated with different strains of beneficial fungal endophyte Neotyphodium lolii expressed variations of both decreases and increases in phenolics and antioxidants that were endophyte strain dependent [54]. During our studies, both TPC and TFC were affected in a similar manner, with a significant decrease in the inoculated group after 6 and 8 weeks. Additionally, a strong positive correlation (R > 0.7) was observed between these effects after 8 weeks in the inoculated group as well as in the control group. This suggests that TFC is likely a large contributor to changes in TPC in our study.
In plants, flavonoids act in an antioxidative capacity, but they may also modulate plant–microorganism interactions [45]. A similar decrease in poplar phenolics, and flavonoids specifically, was noted in a study in which poplars faced a water shortage [55], showing that this type of reaction may not necessarily be unique to our studied bacteria and may potentially be indicative of stress. Consequently, the experimental design using microshoots could be the reason behind similar trends in TFC and TPC in both inoculated and control groups and provide a potential explanation as to why TFC and TPC were relatively lower in the inoculated group as a response to bacteria inoculation, indicating that they were perceived as an additional stressor.
DPPH and ABTS assays are both used to determine the total antioxidant capacity within the sample and thus are indicative of the oxidative stress level [56]. In our study, after 6 and 8 weeks of incubation, inoculated microshoot extracts exhibited a significant decrease in DPPH and ABTS metrics, suggestive of reduced free radical scavenging activity within inoculated poplars. Data on ABTS and TPC/TFC were shown to correlate irrespective of poplar inoculation status and, as phenolic compounds have been reported to act in an antioxidative capacity [44], the drop in phenolics and free radical scavenging activity could stem from the same biochemical changes.
In various studies, plant photosynthesis pigment content can be linked to the general health and vigor of the plant [10,57,58,59]. However, CHA, CHB and CAR have secondary functions within plants.
CAR act as secondary agents within photosynthesis; however, they also participate in antioxidative stress management and operate as precursors to phytohormones (e.g., abscisic acid, ABA) and other molecules [39,60]. Phenolics and antioxidant activity followed similar trends over the duration of our experiment, even between groups. CAR content was inconsistent throughout, with a relative decrease in the inoculated group after 6 weeks, but a complete opposite reaction after 8 weeks. Within the scope of analogue studies, the increase in CAR can be deemed to be beneficial when this increase can correlate with enhanced plant growth, as was shown in a study using an arbuscular mycorrhizal fungi–grape model [59].
The chlorophyll content within the plant is primarily linked to plant vitality [59,61]. Secondarily, chlorophylls can also work as antioxidants [62]. CHB is considered an accessory to CHA [57]. In this experiment, CHB in inoculated plants was enhanced after 6 and 8 weeks, but CHA was only significantly affected after 8 weeks, with increases post-inoculation. Just as with CAR, analogous conclusions were drawn regarding the increase in chlorophyll content for grape [59], avocado [10], cotton [7], peanut [58], eucalyptus [63] and bean [14].
A correlation analysis, performed after 8 weeks of incubation, uncovered some illuminating information. It showed that the inoculation changed the way in which photosynthesis pigments related to four other tested parameters between the control and inoculated groups. Specifically, inoculation seemed to affect TPC, TFC and free radical scavenging activity in relation to photosynthesis pigment content (see Figure 2).
Post inoculation, a moderate negative correlation emerged between ABTS and CAR, as well as between TPC and CAR. This potentially revealed a compensatory mechanism, whereby the inoculation negatively impacts TPC, which correlates with lower free radical scavenging activity (ABTS), which, in turn, raises CAR levels to, at least in part, compensate for the antioxidant level drop. A similar compensation was observed in several studies [64,65,66,67,68]. In a 2020 study, the authors revealed a compensatory mechanism between the plastid prenyllipid antioxidants tocopherol and plastoquinol and ascorbate peroxidase (APX) enzyme [64]. In a study with tomatoes, researchers observed a negative correlation between lycopene and chlorophyll (–0.6209), also suggestive of a compensatory mechanism. This relates to results from our study, whereby after inoculation, carotenoid content was negatively linked with ABTS (−0.58) and TPC (−0.63) (p ≤ 0.05). Thus, it can be inferred that TFC, TPC, ABTS and pigment amounts correspondingly organize in relation to each other to ensure homeostasis, as noted by Sarker and Oba [68].
PCA uncovered that the inoculated group and control group diverged based on their secondary metabolite levels, and most of this was due to changes in pigments, phenolics and ABTS, while DPPH data strongly determined a small fraction of all variation (~8.2%).
Moreover, a long-term effect on plant growth and secondary metabolism was observed after one-time inoculation, as similar results were achieved using mutant Paeniabacillus polymyxa on western red cedar [69] and pine [70] after a 12-month period, corn after a 3 month period [24] and Caballeronia sordidicola on pine and spruce after a year-long period [71]. This is potentially indicative that further changes might occur during a longer growth period, hence boosting the possibility of using Paenibacillus sp. as a long-acting agent. Long-term benefits would be advantageous in tree nurseries, the wood industry, or orchards, where plants are grown for years before harvest, or in cases where periodical fertilization is not feasible.
5. Conclusions
This research contains a more thorough look into Populus sp. metabolic and physiological changes post Paenibacillus sp. bacterial inoculation during the timeframe of initial growth. This is a necessary input into comprehensive studies to create biofertilizers that could be used in tree nurseries and other forestry related enterprises. These data add to the knowledge regarding the mechanisms that infer plant growth and health. It shows that bacteria may affect different aspects of secondary metabolism in different ways at the same time, i.e., different photosynthesis pigment contents as opposed to phenolic contents and antioxidant capacity. However, additional data need to be collected to further understand Populus tree–Paenibacillus interactions and pinpoint the exact compounds responsible for these changes. Overall, the data gathered here, alongside previous studies of these bacteria, provide a good example of how microbial inoculants can have complex impacts on their hosts’ growth and health.
Author Contributions
Conceptualization—D.V.; Methodology—D.V. and V.S.-Š.; Software—V.M.; Validation—D.V.; Formal analysis—D.V., G.S. and V.M.; Investigation—D.V. and G.S.; Resources—D.V., G.S. and V.S.-Š.; Data Curation—D.V. and V.M.; Writing—Original Draft—D.V., G.S., V.M. and V.S.-Š.; Writing—Review and Editing—D.V., G.S., V.M. and V.S.-Š.; Visualization—V.M. and D.V.; Supervision—V.S.-Š. and D.V.; Project administration—D.V. and V.S.-Š. All authors have read and agreed to the published version of the manuscript.
Funding
This research received no external funding.
Data Availability Statement
Data concerning this article is available upon request.
Conflicts of Interest
The authors declare no conflict of interest.
References
- Kour, D.; Rana, K.L.; Yadav, A.N.; Yadav, N.; Kumar, M.; Kumar, V.; Vyas, P.; Dhaliwal, H.S.; Saxena, A.K. Microbial Biofertilizers: Bioresources and Eco-Friendly Technologies for Agricultural and Environmental Sustainability. Biocatal. Agric. Biotechnol. 2020, 23, 101487. [Google Scholar] [CrossRef]
- Kalayu, G. Phosphate Solubilizing Microorganisms: Promising Approach as Biofertilizers. Int. J. Agron. 2019, 2019, 4917256. [Google Scholar] [CrossRef]
- Pirttilä, A.M.; Mohammad Parast Tabas, H.; Baruah, N.; Koskimäki, J.J. Biofertilizers and Biocontrol Agents for Agriculture: How to Identify and Develop New Potent Microbial Strains and Traits. Microorganisms 2021, 9, 817. [Google Scholar] [CrossRef]
- Suhag, M. Potential of Biofertilizers to Replace Chemical Fertilizers. Int. Adv. Res. J. Sci. Eng. Technol. 2016, 3, 163–167. [Google Scholar] [CrossRef]
- Puri, A.; Padda, K.P.; Chanway, C.P. In Vitro and in Vivo Analyses of Plant-Growth-Promoting Potential of Bacteria Naturally Associated with Spruce Trees Growing on Nutrient-Poor Soils. Appl. Soil Ecol. 2020, 149, 103538. [Google Scholar] [CrossRef]
- Park, Y.G.; Mun, B.G.; Kang, S.M.; Hussain, A.; Shahzad, R.; Seo, C.W.; Kim, A.Y.; Lee, S.U.; Oh, K.Y.; Lee, D.Y.; et al. Bacillus aryabhattai SRB02 Tolerates Oxidative and Nitrosative Stress and Promotes the Growth of Soybean by Modulating the Production of Phytohormones. PLoS ONE 2017, 12, e0173203. [Google Scholar] [CrossRef]
- Kumari, M.; Thakur, I.S. Biochemical and Proteomic Characterization of Paenibacillus sp. ISTP10 for Its Role in Plant Growth Promotion and in Rhizostabilization of Cadmium. Bioresour. Technol. Rep. 2018, 3, 59–66. [Google Scholar] [CrossRef]
- Vaitiekūnaitė, D.; Kuusienė, S.; Beniušytė, E. Oak (Quercus robur) Associated Endophytic Paenibacillus sp. Promotes Poplar (Populus spp.) Root Growth In Vitro. Microorganisms 2021, 9, 1151. [Google Scholar] [CrossRef] [PubMed]
- Ferchichi, N.; Toukabri, W.; Boularess, M.; Smaoui, A.; Mhamdi, R.; Trabelsi, D. Isolation, Identification and Plant Growth Promotion Ability of Endophytic Bacteria Associated with Lupine Root Nodule Grown in Tunisian Soil. Arch. Microbiol. 2019, 201, 1333–1349. [Google Scholar] [CrossRef] [PubMed]
- Barra, P.J.; Inostroza, N.G.; Mora, M.L.; Crowley, D.E.; Jorquera, M.A. Bacterial Consortia Inoculation Mitigates the Water Shortage and Salt Stress in an Avocado (Persea americana Mill.) Nursery. Appl. Soil Ecol. 2017, 111, 39–47. [Google Scholar] [CrossRef]
- Sahu, P.K.; Singh, S.; Gupta, A.R.; Gupta, A.; Singh, U.B.; Manzar, N.; Bhowmik, A.; Singh, H.V.; Saxena, A.K. Endophytic Bacilli from Medicinal-Aromatic Perennial Holy Basil (Ocimum tenuiflorum L.) Modulate Plant Growth Promotion and Induced Systemic Resistance against Rhizoctonia solani in Rice (Oryza sativa L.). Biol. Control 2020, 150, 104353. [Google Scholar] [CrossRef]
- Ren, J.H.; Li, H.; Wang, Y.F.; Ye, J.R.; Yan, A.Q.; Wu, X.Q. Biocontrol Potential of an Endophytic Bacillus pumilus JK-SX001 against Poplar Canker. Biol. Control 2013, 67, 421–430. [Google Scholar] [CrossRef]
- Castaldi, S.; Petrillo, C.; Donadio, G.; Piaz, F.D.; Cimmino, A.; Masi, M.; Evidente, A.; Isticato, R. Plant Growth Promotion Function of Bacillus sp. Strains Isolated from Salt-Pan Rhizosphere and Their Biocontrol Potential against Macrophomina phaseolina. Int. J. Mol. Sci. 2021, 22, 3324. [Google Scholar] [CrossRef]
- Gupta, S.; Pandey, S. ACC Deaminase Producing Bacteria with Multifarious Plant Growth Promoting Traits Alleviates Salinity Stress in French Bean (Phaseolus vulgaris) Plants. Front. Microbiol. 2019, 10, 1506. [Google Scholar] [CrossRef]
- Striganavičiūtė, G.; Žiauka, J.; Sirgedaitė-Šėžienė, V.; Vaitiekūnaitė, D. Priming of Resistance-Related Phenolics: A Study of Plant-Associated Bacteria and Hymenoscyphus fraxineus. Microorganisms 2021, 9, 2504. [Google Scholar] [CrossRef] [PubMed]
- Jiménez-Gómez, A.; Celador-Lera, L.; Fradejas-Bayón, M.; Rivas, R. Plant Probiotic Bacteria Enhance the Quality of Fruit and Horticultural Crops. AIMS Microbiol. 2017, 3, 483–501. [Google Scholar] [CrossRef]
- Martin, L.J.; Matar, C. Increase of Antioxidant Capacity of the Lowbush Blueberry (Vaccinium angustifolium) during Fermentation by a Novel Bacterium from the Fruit Microflora. J. Sci. Food Agric. 2005, 85, 1477–1484. [Google Scholar] [CrossRef]
- Pan, F.; Su, T.J.; Cai, S.M.; Wu, W. Fungal Endophyte-Derived Fritillaria unibracteata Var. Wabuensis: Diversity, Antioxidant Capacities in Vitro and Relations to Phenolic, Flavonoid or Saponin Compounds. Sci. Rep. 2017, 7, 42008. [Google Scholar] [CrossRef]
- Chandrasekaran, M.; Chun, S.C.; Oh, J.W.; Paramasivan, M.; Saini, R.K.; Sahayarayan, J.J. Bacillus subtilis CBR05 for Tomato (Solanum lycopersicum) Fruits in South Korea as a Novel Plant Probiotic Bacterium (PPB): Implications from Total Phenolics, Flavonoids, and Carotenoids Content for Fruit Quality. Agronomy 2019, 9, 838. [Google Scholar] [CrossRef]
- Schulz, B.J.; Rabsch, L.; Junker, C. Chemical Warfare in the Plant Microbiome Leads to a Balance of Antagonisms and a Healthy Plant. In Seed Endophytes: Biology and Biotechnology; Verma, S.K., White, J.F., Jr., Eds.; Springer Nature Switzerland AG: Berlin/Heidelberg, Germany, 2019; pp. 171–189. [Google Scholar] [CrossRef]
- Striganavičiūtė, G.; Žiauka, J.; Sirgedaitė-Šėžienė, V.; Vaitiekūnaitė, D. Impact of Plant-Associated Bacteria on the In Vitro Growth and Pathogenic Resistance against Phellinus tremulae of Different Aspen (Populus) Genotypes. Microorganisms 2021, 9, 1901. [Google Scholar] [CrossRef] [PubMed]
- Tang, Q.; Puri, A.; Padda, K.P.; Chanway, C.P. Biological Nitrogen Fixation and Plant Growth Promotion of Lodgepole Pine by an Endophytic Diazotroph Paenibacillus polymyxa and Its GFP-Tagged Derivative. Botany 2017, 95, 611–619. [Google Scholar] [CrossRef]
- Puri, A.; Padda, K.P.; Chanway, C.P. Evidence of Nitrogen Fixation and Growth Promotion in Canola (Brassica napus L.) by an Endophytic Diazotroph Paenibacillus polymyxa P2b-2R. Biol. Fertil. Soils 2016, 52, 119–125. [Google Scholar] [CrossRef]
- Puri, A.; Padda, K.P.; Chanway, C.P. Seedling Growth Promotion and Nitrogen Fixation by a Bacterial Endophyte Paenibacillus polymyxa P2b-2R and Its GFP Derivative in Corn in a Long-Term Trial. Symbiosis 2016, 69, 123–129. [Google Scholar] [CrossRef]
- Puri, A.; Padda, K.P.; Chanway, C.P. Evaluating Lodgepole Pine Endophytes for Their Ability to Fix Nitrogen and Support Tree Growth under Nitrogen-Limited Conditions. Plant Soil 2020, 455, 271–287. [Google Scholar] [CrossRef]
- Tsers, I.; Meshcherov, A.; Gogoleva, O.; Petrova, O.; Gogoleva, N.; Ponomareva, M.; Gogolev, Y.; Korzun, V.; Gorshkov, V. Alterations in the Transcriptome of Rye Plants Following the Microdochium nivale Infection: Identification of Resistance/Susceptibility-Related Reactions Based on RNA-Seq Analysis. Plants 2021, 10, 2723. [Google Scholar] [CrossRef]
- Cregger, M.A.; Carper, D.L.; Christel, S.; Doktycz, M.J.; Labbé, J.; Michener, J.K.; Dove, N.C.; Johnston, E.R.; Moore, J.A.M.; Vélez, J.M.; et al. Plant-Microbe Interactions: From Genes to Ecosystems Using Populus as a Model System. Phytobiomes J. 2021, 5, 29–38. [Google Scholar] [CrossRef]
- Tullus, A.; Tullus, H.; Vares, A.; Kanal, A. Early Growth of Hybrid Aspen (Populus × wettsteinii Hämet-Ahti) Plantations on Former Agricultural Lands in Estonia. For. Ecol. Manag. 2007, 245, 118–129. [Google Scholar] [CrossRef]
- Wettstein, D. Chlorophyll-Letale Und Der Submikroskopische Formwechsel Der Plastiden. Exp. Cell Res. 1957, 12, 427–506. [Google Scholar] [CrossRef]
- Singleton, V.L.; Orthhofer, R.; Lamuela-Raventos, R.M. Analysis of Total Phenols and Other Oxidation Substrates and Antioxidants by Means of Folin-Ciocalteu Reagent. Methods Enzymol. 1974, 299, 152–178. [Google Scholar] [CrossRef]
- Drózdz, P.; Šėžienė, V.; Wójcik, J.; Pyrzyńska, K. Evaluation of Bioactive Compounds, Minerals and Antioxidant Activity of Lingonberry (Vaccinium vitis-idaea L.) Fruits. Molecules 2018, 23, 53. [Google Scholar] [CrossRef]
- Ragaee, S.; Abdel-Aal, E.S.M.; Noaman, M. Antioxidant Activity and Nutrient Composition of Selected Cereals for Food Use. Food Chem. 2006, 98, 32–38. [Google Scholar] [CrossRef]
- R Foundation for Statistical Computing. R: A Language and Environment for Statistical Computing; R Foundation for Statistical Computing: Vienna, Austria, 2013. [Google Scholar]
- Fox, J.; Weisberg, S. An R Companion to Applied Regression, 3rd ed.; Sage: Thousand Oaks, CA, USA, 2019. [Google Scholar]
- Harrell, F.E., Jr.; Dupont, C. Hmisc Package for R. 2021. Available online: https://cran.r-project.org/web/packages/Hmisc/Hmisc.pdf (accessed on 13 August 2022).
- Wei, T.; Simko, V. R Package “Corrplot”: Visualization of a Correlation Matrix. 2021. Available online: https://cran.r-project.org/web/packages/corrplot/index.html (accessed on 18 November 2021).
- Wickham, H. Ggplot2: Elegant Graphics for Data Analysis; Springer: New York, NY, USA, 2016. [Google Scholar]
- Kassambara, A.; Mundt, F. Extract and Visualize the Results of Multivariate Data Analyses. 2016. Available online: https://rpkgs.datanovia.com/factoextra/ (accessed on 15 October 2022).
- Daskalchuk, T.; Ahiahonu, P.; Heath, D.; Yamazaki, Y. The Use of Non-Targeted Metabolomics in Plant Science. In Biotechnology in Agriculture and Forestry, Plant Metabolomics; Nagata, T., Loerz, H., Widholm, J.M., Saito, K., Dixon, R.A., Willmitzer, L., Eds.; Springer: Berlin/Heidelberg, Germany, 2006; pp. 311–313. [Google Scholar]
- Maggini, V.; De Leo, M.; Mengoni, A.; Gallo, E.R.; Miceli, E.; Reidel, R.V.B.; Biffi, S.; Pistelli, L.; Fani, R.; Firenzuoli, F.; et al. Plant-Endophytes Interaction Influences the Secondary Metabolism in Echinacea purpurea (L.) Moench: An in Vitro Model. Sci. Rep. 2017, 7, 16924. [Google Scholar] [CrossRef]
- Yu, M.; Chen, J.C.; Qu, J.Z.; Liu, F.; Zhou, M.; Ma, Y.M.; Xiang, S.Y.; Pan, X.X.; Zhang, H.B.; Yang, M.Z. Exposure to Endophytic Fungi Quantitatively and Compositionally Alters Anthocyanins in Grape Cells. Plant Physiol. Biochem. 2020, 149, 144–152. [Google Scholar] [CrossRef] [PubMed]
- Ludwig-Müller, J. Plants and Endophytes: Equal Partners in Secondary Metabolite Production? Biotechnol. Lett. 2015, 37, 1325–1334. [Google Scholar] [CrossRef] [PubMed]
- Pang, Z.; Chen, J.; Wang, T.; Gao, C.; Li, Z.; Guo, L. Linking Plant Secondary Metabolites and Plant Microbiomes: A Review. Front. Plant Sci. 2021, 12, 621276. [Google Scholar] [CrossRef]
- Erb, M.; Kliebenstein, D.J. Plant Secondary Metabolites as Defenses, Regulators, and Primary Metabolites: The Blurred Functional Trichotomy. Plant Physiol. 2020, 184, 39–52. [Google Scholar] [CrossRef] [PubMed]
- Mierziak, J.; Kostyn, K.; Kulma, A. Flavonoids as Important Molecules of Plant Interactions with the Environment. Molecules 2014, 19, 16240–16265. [Google Scholar] [CrossRef]
- Perincherry, L.; Stepien, L.; Vasudevan, S.E. Cross-Tolerance and Autoimmunity as Missing Links in Abiotic and Biotic Stress Responses in Plants: A Perspective toward Secondary Metabolic Engineering. Int. J. Mol. Sci. 2021, 22, 11945. [Google Scholar] [CrossRef]
- Goyal, S.; Lambert, C.; Cluzet, S.; Merillon, J.M.; Ramawat, K.G. Secondary Metabolites and Plant Defence. In Plant Defence: Biological Control, Progress in Biological Control; Springer: Dordrecht, The Netherlands, 2012; pp. 109–130. [Google Scholar] [CrossRef]
- Isah, T. Stress and Defense Responses in Plant Secondary Metabolites Production. Biol. Res. 2019, 52, 39. [Google Scholar] [CrossRef]
- Nunes da Silva, M.; Pintado, M.E.; Sarmento, B.; Stamford, N.P.; Vasconcelos, M.W. A Biofertilizer with Diazotrophic Bacteria and a Filamentous Fungus Increases Pinus pinaster Tolerance to the Pinewood Nematode (Bursaphelenchus xylophilus). Biol. Control 2019, 132, 72–80. [Google Scholar] [CrossRef]
- Luzzatto, T.; Golan, A.; Yishay, M.; Bilkis, I.; Ben-Ari, J.; Yedidia, I. Priming of Antimicrobial Phenolics during Induced Resistance Response towards Pectobacterium carotovorum in the Ornamental Monocot Calla Lily. J. Agric. Food Chem. 2007, 55, 10315–10322. [Google Scholar] [CrossRef] [PubMed]
- Ait Barka, E.; Nowak, J.; Clément, C. Enhancement of Chilling Resistance of Inoculated Grapevine Plantlets with a Plant Growth-Promoting Rhizobacterium, Burkholderia phytofirmans Strain PsJN. Appl. Environ. Microbiol. 2006, 72, 7246–7252. [Google Scholar] [CrossRef] [PubMed]
- Wallis, C.M.; Galarneau, E.R.A. Phenolic Compound Induction in Plant-Microbe and Plant-Insect Interactions: A Meta-Analysis. Front. Plant Sci. 2020, 11, 580753. [Google Scholar] [CrossRef]
- Pfabel, C.; Eckhardt, K.U.; Baum, C.; Struck, C.; Frey, P.; Weih, M. Impact of Ectomycorrhizal Colonization and Rust Infection on the Secondary Metabolism of Poplar (Populus trichocarpa × deltoides). Tree Physiol. 2012, 32, 1357–1364. [Google Scholar] [CrossRef] [PubMed]
- Qawasmeh, A.; Obied, H.K.; Raman, A.; Wheatley, W. Influence of Fungal Endophyte Infection on Phenolic Content and Antioxidant Activity in Grasses: Interaction between Lolium perenne and Different Strains of Neotyphodium lolii. J. Agric. Food Chem. 2012, 60, 3381–3388. [Google Scholar] [CrossRef] [PubMed]
- Popović, B.M.; Štajner, D.; Ždero-Pavlović, R.; Tumbas-Šaponjac, V.; Čanadanović-Brunet, J.; Orlović, S. Water Stress Induces Changes in Polyphenol Profile and Antioxidant Capacity in Poplar Plants (Populus spp.). Plant Physiol. Biochem. 2016, 105, 242–250. [Google Scholar] [CrossRef]
- Ilyasov, I.R.; Beloborodov, V.L.; Selivanova, I.A.; Terekhov, R.P. ABTS/PP Decolorization Assay of Antioxidant Capacity Reaction Pathways. Int. J. Mol. Sci. 2020, 21, 1131. [Google Scholar] [CrossRef]
- Nguyen, M.K.; Yang, C.M.; Shih, T.H.; Lin, S.H.; Pham, G.T.; Nguyen, H.C. Chlorophyll Biosynthesis and Transcriptome Profiles of Chlorophyll B-Deficient Type 2b Rice (Oryza sativa L.). Not. Bot. Horti Agrobot. Cluj-Napoca 2021, 49, 12380. [Google Scholar] [CrossRef]
- Liu, D.; Yang, Q.; Ge, K.; Hu, X.; Qi, G.; Du, B.; Liu, K.; Ding, Y. Promotion of Iron Nutrition and Growth on Peanut by Paenibacillus illinoisensis and Bacillus sp. Strains in Calcareous Soil. Braz. J. Microbiol. 2017, 48, 656–670. [Google Scholar] [CrossRef]
- Krishna, H.; Singh, S.K.; Sharma, R.R.; Khawale, R.N.; Grover, M.; Patel, V.B. Biochemical Changes in Micropropagated Grape (Vitis vinifera L.) Plantlets Due to Arbuscular-Mycorrhizal Fungi (AMF) Inoculation during Ex Vitro Acclimatization. Sci. Hortic. 2005, 106, 554–567. [Google Scholar] [CrossRef]
- Swapnil, P.; Meena, M.; Singh, S.K.; Dhuldhaj, U.P.; Harish; Marwal, A. Vital Roles of Carotenoids in Plants and Humans to Deteriorate Stress with Its Structure, Biosynthesis, Metabolic Engineering and Functional Aspects. Curr. Plant Biol. 2021, 26, 100203. [Google Scholar] [CrossRef]
- Li, Y.; He, N.; Hou, J.; Xu, L.; Liu, C.; Zhang, J.; Wang, Q.; Zhang, X.; Wu, X. Factors Influencing Leaf Chlorophyll Content in Natural Forests at the Biome Scale. Front. Ecol. Evol. 2018, 6, 64. [Google Scholar] [CrossRef]
- Roca, M.; Chen, K.; Pérez-Gálvez, A. Chlorophylls. In Handbook on Natural Pigments in Food and Beverages: Industrial Applications for Improving Food Color; Elsevier Ltd.: Amsterdam, The Netherlands, 2016; pp. 125–158. [Google Scholar] [CrossRef]
- Ren, H.; Qin, X.; Huang, B.; Fernández-García, V.; Lv, C. Responses of Soil Enzyme Activities and Plant Growth in a Eucalyptus Seedling Plantation Amended with Bacterial Fertilizers. Arch. Microbiol. 2020, 202, 1381–1396. [Google Scholar] [CrossRef] [PubMed]
- Nowicka, B.; Fesenko, T.; Walczak, J.; Kruk, J. The Inhibitor-Evoked Shortage of Tocopherol and Plastoquinol Is Compensated by Other Antioxidant Mechanisms in Chlamydomonas reinhardtii Exposed to Toxic Concentrations of Cadmium and Chromium Ions. Ecotoxicol. Environ. Saf. 2020, 191, 110241. [Google Scholar] [CrossRef] [PubMed]
- Vela-Hinojosa, C.; Escalona-Buendía, H.B.; Mendoza-Espinoza, J.A.; Villa-Hernández, J.M.; Lobato-Ortíz, R.; Rodríguez-Pérez, J.E.; Pérez-Flores, L.J. Antioxidant Balance and Regulation in Tomato Genotypes of Different Color. J. Am. Soc. Hortic. Sci. 2019, 144, 45–54. [Google Scholar] [CrossRef]
- Chen, J.W.; Bai, K.D.; Cao, K.F. Inhibition of Monoterpene Biosynthesis Accelerates Oxidative Stress and Leads to Enhancement of Antioxidant Defenses in Leaves of Rubber Tree (Hevea brasiliensis). Acta Physiol. Plant. 2009, 31, 95–101. [Google Scholar] [CrossRef]
- Zheng, X.T.; Yu, Z.C.; Tang, J.W.; Cai, M.L.; Chen, Y.L.; Yang, C.W.; Chow, W.S.; Peng, C.L. The Major Photoprotective Role of Anthocyanins in Leaves of Arabidopsis thaliana under Long-Term High Light Treatment: Antioxidant or Light Attenuator? Photosynth. Res. 2021, 149, 25–40. [Google Scholar] [CrossRef]
- Sarker, U.; Oba, S. Drought Stress Effects on Growth, ROS Markers, Compatible Solutes, Phenolics, Flavonoids, and Antioxidant Activity in Amaranthus tricolor. Appl. Biochem. Biotechnol. 2018, 186, 999–1016. [Google Scholar] [CrossRef]
- Anand, R.; Chanway, C. N2-Fixation and Growth Promotion in Cedar Colonized by an Endophytic Strain of Paenibacillus polymyxa. Biol. Fertil. Soils 2013, 49, 235–239. [Google Scholar] [CrossRef]
- Anand, R.; Grayston, S.; Chanway, C. N2-Fixation and Seedling Growth Promotion of Lodgepole Pine by Endophytic Paenibacillus polymyxa. Microb. Ecol. 2013, 66, 369–374. [Google Scholar] [CrossRef] [PubMed]
- Puri, A.; Padda, K.P.; Chanway, C.P. Can Naturally-Occurring Endophytic Nitrogen-Fixing Bacteria of Hybrid White Spruce Sustain Boreal Forest Tree Growth on Extremely Nutrient-Poor Soils? Soil Biol. Biochem. 2020, 140, 107642. [Google Scholar] [CrossRef]
Publisher’s Note: MDPI stays neutral with regard to jurisdictional claims in published maps and institutional affiliations. |
© 2022 by the authors. Licensee MDPI, Basel, Switzerland. This article is an open access article distributed under the terms and conditions of the Creative Commons Attribution (CC BY) license (https://creativecommons.org/licenses/by/4.0/).