Abstract
Forest-based destinations rely on quality forest landscapes as a critical resource, and recently the use of psychophysiological techniques that monitor the electrophysiological responses of the brain has gained research attention in forest landscape assessment. This study innovatively employed a mobile EEG methodology to investigate 130 participants’ attentional changes as they walked through the tourist tracks of a national park, and adopted a multi-method design triangulating the findings of a psychometric experiment, self-report measures, and expert assessments of forest landscapes. Results demonstrated a strong correlation between visitors’ attentional changes over time and on different tourist tracks, based on test–retest and alternate-form reliability testing. Moreover, the brain attention values showed some correspondence with the perceived visual quality of forest landscapes as rated by experts, and the consistency between the EEG and expert approaches was particularly evident in relation to landscapes of high and low aesthetic quality. Results provided persuasive evidence for the use of mobile EEG devices as a supplementary or alternative measure of visual quality assessment of forest landscape, and to inform landscape planning and experience design in forest-based destinations.
1. Introduction
High-quality forest landscape plays a critical role in ecosystem service, and positively influences human health and well-being. How to scientifically and objectively evaluate forest landscape quality is not only a research hotspot of forest recreation, but also an important mission of forest resource management implemented by forestry authorities [1]. Forest-based destinations are usually evaluated on the basis of landscapes from the perspective of visual quality assessment, using approaches such as the expert method and public perception-based method [2]. Such assessments allow destination planners and authorities to better understand the status of forest resources, understand the dynamic changes of forest landscapes, evaluate the effects of visual changes on resource management planning, and propose appropriate management strategies for sustainable development [3]. One challenge of visual quality assessment is to comprehensively capture relevant landscape features. These not only include the biophysical features of a forest landscape, but the subjective perceptions and aesthetic preferences of those who evaluate the landscape, which must also be understood [4]. An essential requirement is a scientific, effective, and holistic assessment method bridging physical aspects of forest landscape and social-psychological dimensions [5].
Research on visual quality assessment of forest landscape has primarily taken four theoretical approaches, namely expert, psychophysical, cognitive, and experiential [6], resulting in the implementation of a substantial range of assessment methods in environmental management practice [7,8,9,10,11]. With the development of technology and a multidisciplinary approach to research in the late 1960s, experts in the fields of psychology, aesthetics, geology, ecology, and landscape architecture began systematic research on visual quality assessments of forest landscape, and both experimental and practical techniques have greatly progressed [12]. Meanwhile, in response to demands for more scientific and knowledge-based forest resources management, visual quality assessment research has become more quantitative and more technical with the applications of psychophysiological approaches [13]. Over the last half-century, visual quality assessments of forest landscapes have been characterized by a theoretical and validity contest between the expert approach and the psychophysical approach [14].
Electroencephalogram (EEG) is the principal neurophysiological technique used to measure the electrical activity of the brain [15,16]. By assessing the brainwaves and bioelectricity signals human brains constantly produce, researchers have analyzed respondents’ cognitive or affective processes in response to prepared stimuli. The frequency of these spontaneous bioelectricity signals usually lies between 0.1 Hz and 30 Hz, and can be divided into five spectral bands: delta (<4 Hz), theta (4–7 Hz), alpha (8–12 Hz), low beta (13–15 Hz), midrange beta (16–20 Hz), and high beta (21–30 Hz) [17]. EEG is a relatively inexpensive and non-invasive measurement. Therefore, it permits experiments with large groups of nonclinical participants. Numerous studies have demonstrated the ability of EEGs to detect emotional states, as well as the reliability and validity of its performance, mainly in the field of consumer neuroscience, which combines neuroscience, psychology, and economics [18,19,20,21,22]. The main goal of such research is to study how the brain is physiologically affected by advertising and marketing strategies, and to evaluate the effectiveness of these strategies [23]. Moreover, the study of landscape architecture pays close attention to the interaction between psychology and the landscape environment [24], and landscape attention has become an important evaluation index of psychological reaction of the environment [25]. EEG technology can be used as a novel research method in landscape design and environmental psychology [26]. By recording human observations of the landscape environment and quantifying the visual attention and cognitive process of brain activities, the subjective feeling of the evaluators can be objectively reflected based on the brainwave index.
Recently, the EEG technique has been employed within the visual quality assessment domain, with most assessments conducted by having respondents view environmental scenes (e.g., photography, digital images, and virtual landscape) in a laboratory [27,28,29,30] or museum setting [31,32,33]. Results suggest that individuals have more intensive emotional responses when viewing images of premium landscapes than when looking at mediocre or low-quality landscapes [34]. However, there has been an absence of research using the EEG method to record and analyze emotional responses to the natural environment in non-laboratory settings. To our knowledge, the only study was to utilize the EEG method to investigate visitors’ emotional experiences in three types of outdoor environments (shopping streets, green spaces, and residential areas), and identified “systematic differences of brain values between the three areas”, consistent with restoration theory [35]. Therefore, a reasonable assumption is that the variations in users’ EEG brain activities in an outdoor setting, and having the influence of other factors controlled, are caused by differences in the perceived visual quality of the landscape.
Unlike previous studies conducted in a laboratory setting, this study innovatively introduces the mobile EEG technology into the research field of landscape quality assessment. Based on real-time recognition of visitor attention, the objective of the study was to verify the reliability and validity of cortical brain signals in a forest setting, and evaluate the usability of mobile EEG technology for visual quality assessments of forest landscapes. More specifically, the study attempts to develop an assessment method for data collection and analysis of brain signals for future use of EEG technology in visual quality assessment. Therefore, this study enriches the existing assessment system for forest landscape quality, especially exploring a new application in psychophysical approaches. Moreover, findings from this study also provide insights into the exploration, planning, and management of forest resources.
Non-laboratory experiments are easily influenced by many external factors [36], so we need to examine the repeatability and stability of the experimental results across several design variants. Furthermore, the paper aims to investigate whether a correlation exists between variations in users’ EEG brain activities and forest landscape quality. To achieve these objectives, this study adopted a multi-method approach incorporating the EEG, self-report, and expert assessment to address the following research questions:
- (1)
- Is the EEG test adequately stable for measuring visitors’ attentional changes to forest landscapes across time and space in specific outdoor settings?
- (2)
- Does the EEG test of visitors’ attentional changes produce results consistent with expert evaluations and visitors’ self-reports of the visual quality of forest landscapes?
- (3)
- Do visitors’ attentional changes vary systematically with the visual quality of the forest landscape?
2. Materials and Methods
This study adopted a multi-method design triangulating the findings of a psychometric experiment, self-report measures, and expert assessments of corresponding landscapes.
2.1. EEG Method
2.1.1. Experimental Devices
This study used ten Neurosky MindWave Mobile Kits and ten smartphones of Samsung GT-S6818 Galaxy Fame (all smartphones with bluetooth function are compatible with the EEG device) for data collection. The Neurosky MindWave Mobile Kit is a popular headset device for collecting and analyzing brainwave data. It is able to separately output two custom values (attention and meditation). Due to the advantages of low cost, ease of use (mobile, gel-free), and single-channel acquisition, the device has been employed in many prior studies [37,38,39]. The data acquisition process of the MindWave EEG system is shown in Figure 1.
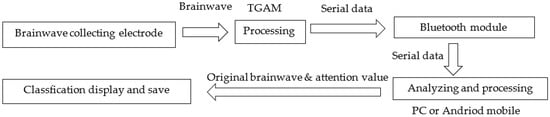
Figure 1.
Data acquisition process of MindWave EEG headset.
The device acquires brain biological signals by using a single contact sensor on the user’s forehead and transmits the raw signals to the ThinkGear™ chipset, which can filter the noise mixed into the signals, as well as motion-induced interferences. The processed signals are then calculated by the eSense™ algorithm to obtain the Attention eSense Meter results of a user, reflective of the intensity of the user’s level of mental state. Values ranged from 1 to 100, with lower scores representing low levels of attention (Table 1). Distractions, wandering thoughts, lack of focus, or anxiety may lower attention meter levels. Finally, these values are outputted into intelligent devices (e.g., computers and smartphones) using Bluetooth technology.

Table 1.
Category of Attention eSenseTM Meters.
2.1.2. Pre-Test
To measure the preparedness and performance of the devices before the large-scale experiments, we conducted a preliminary test. The chosen test area was a 1 km hiking track inside Hunan Tianjiling National Forest Park, China, with twelve scenic spots and dense vegetation on both sides of the track. Four randomly selected tourists were recruited to walk through the track, each wearing a set of devices. The four participants varied in age, profession, and educational background. Two were first-time visitors and the other two had been to the track previously. To identify the accurate arrival time at each of the twelve scenic spots along the track, one researcher recorded the entire test process with a digital video camera. An analysis of the experimental data identified some problems needing to be addressed before the large-scale test (see Supplementary Materials). According to the results of the pre-test, we adjusted our study area, participant recruitment criteria, and experimental procedure.
2.1.3. Study Area
The study was conducted in the Zhangjiejie National Forest Park of China, a UNESCO World Heritage Site, listed in 1990. The park is famous for its spectacular scenery and important ecological functions, and is a popular tourist destination. Over four million visitors travel to the park every year (http://lww.zjj.gov.cn/ (accessed on 2 May 2022)), of which more than 95% are estimated to be tourists [40].
The selected experiment sites are located along the three main tourist tracks of Huangshizhai, Yuanjiajie, and Jinbianxi. These all have abundant forests, as well as biological and geological landscapes within popular sightseeing regions of Zhangjiejie National Forest Park. To reduce participants’ physical exertion, we chose only hilltop, streamside, or flat tracks. Scenic spots consisted of 20 along the Huangshizhai track (labeled A1–A20), 18 along the Jinbianxi track (B1–B18), and 12 along the Yuanjiajie track (C1–C12) (Figure 2). These scenic spots are regularly distributed alongside the tracks, most of which are key and iconic attractions in the forest park, with different types of landscape including woodlands, mountains, cliffs, wild animals, streams, sites, and ruins.
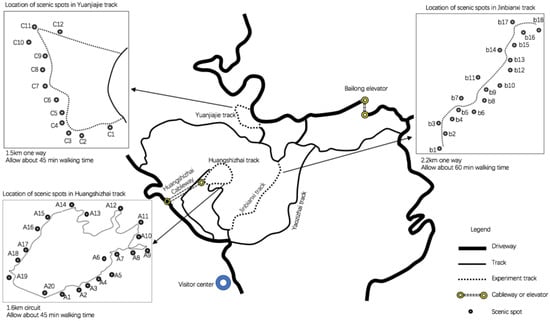
Figure 2.
Experiment sites in Zhangjiajie National Forest Park of China.
2.1.4. Participants
Previous studies have demonstrated that landscape evaluators with different demographic characteristics had significant consistency in aesthetic attitudes and preferences, although they had certain differences in the description and understanding of the landscape environment [41]. Since the purpose of this study did not focus on analyzing the cognitive differences of different groups, a single group of similar age and education level was selected for evaluation. Participants consisted of 130 students (56 males and 74 females) who each received a small incentive for participation. To eliminate the potential influence of demographic and attitudinal characteristics (e.g., age, cultural background, life environment, and physical condition; see Supplementary Materials) on the experiment results, we recruited a homogeneous group of participants for the experiment. The participants were college or university students aged between 17 and 25 years, who had never been to Zhangjiajie National Forest Park and did not have any physical injuries or health issues at the time.
2.1.5. Experimental Procedure
The experimental procedure comprised the following steps: (1) The participants put on MindWave EEG equipment outside the experiment tracks and confirmed the connection with the smartphone. The device then began to record attention values indicative of brainwaves. (2) The note-takers (two for each group) guided participants to the experimental area, purposefully controlled the tour time, and recorded the exact arrival time at each scenic spot. (3) The experimental data were exported from MindWave EEG to the smartphone after the participants finished their tour.
2.1.6. Data Processing
Attention values were generated every second within the range of 1 to 100, with higher values indicating higher attention. The total number of attention values recorded for each participant in any one track varied between 2400 and 3600. To process the data, we first imported the raw txt. data into the SPSS analysis software for reorganizing and testing data reliability. The EEG data indicated that there was a significant and irregular fluctuation during the first 20 s of recorded data from each scenic spot, possibly because the participants needed some time to settle down before attending to the scenery. Moreover, over 95% of the attention value of participants distinctly reduced after 50 s due to diminishing interest. For the sake of brevity, we chose to analyze only attention values from the 20th to 50th second of the arrival time in each spot for test–retest reliability. Participants’ average scores of attention values between the 20th and 50th seconds were used in alternative-form reliability and validity tests. The principle applied to data filtering was that the 30-second attention values must be consecutive and not constant, even if the data outside the thirty-second interval were incomplete.
2.2. Self-Report Assessment
At the conclusion of the track, all participants were asked to complete a questionnaire to rate the visual quality of each of the scenic spots on the track on a 5-point semantic scale (Excellent = 100, Good = 80, Average = 60, Poor = 40 and Very poor = 20). A total of 120 valid questionnaires were received, yielding a return rate of 92.3%.
2.3. Expert Assessment
For the expert assessment component, we invited 21 influential experts from a forestry university and a variety of disciplines, such as forestry, tourism, geology, and biology, who served on a voluntary basis. These experts were all familiar with the Zhangjiajie National Forest Park and its various tracks. A total of 15 experts agreed to participate, and each completed a questionnaire that recorded their scoring of the aesthetic values of the study site on the basis of China’s national standard for classification, investigation, and evaluation of landscapes. We applied the evaluation method of multi-factor index system to assess the scenic spots in the questionnaire. According to the method, assessment factors fall into three categories (value of resource attributes, the influence of resource, and added value), with a total score of 100 for the first two categories, plus additional scores of 5 for the third. However, several indicators such as suitable tourist days and added value are not relevant to the present study since participants’ scores would not vary on these indicators given that all participants visited the same national park. Accordingly, we made a slight adjustment to the assessment method (Table 2).
Table 2.
Index System of Multi-factor Evaluation on Tourism Resources.
3. Results
Reliability and validity tests help inform the degree to which evidence supports measurements of scores resulting from the proposed uses of tests [42]. For reliability, we used test–retest and alternate-form reliability tests. To validate the results of the EEG method, we compared them with those of the self-reports and expert evaluations of the natural landscapes of Zhangjiajie National Forest Park.
3.1. Reliability Testing
Test–retest reliability measures “the closeness of the agreement between the results of successive measurements of the same measure” conducted in the same conditions of measurement [42]. As mentioned, one group of participants visited the Jinbianxi track twice. The data of this group (18 scenic spots in total) were used in the test–retest reliability testing. The result should be 540 values (i.e., 30 s at each of the 18 scenic spots) for each participant from each visit. However, technical issues prevented recording of some values, which were treated as missing data points in the reliability analysis.
Using SPSS software, we compared the datasets from the two visits and calculated the Pearson correlation coefficient (PCC) [42]. The PCC measures the strength of the correlation between the two sets of data. As shown in Table 3, all PCCs were significant, ranging from 0.626 to 0.802 (p < 0.01).
Table 3.
Results of Test-retest Reliability Testing of Ten Participants.
According to the proposed guidelines for interpreting PCC, the coefficient lies between 0.6 to 1.0, which indicates a strong positive correlation between the two variables [42]. The test–retest coefficient is also referred to as the coefficient of stability, measuring a method’s ability to produce consistent results. Our results demonstrated that the EEG experiment was a stable test, with participants’ attentional changes being very similar in repeated test sessions.
Alternate-form reliability refers to the consistency of the results obtained by testing the same group of subjects twice with the same scale at different times [43]. We used the EEG data of the Huangshizhai and Yuanjiajie tracks to test the alternate-form reliability, as the two tracks are both flat mountain-top circuits with similar walking distance, track difficulty, and landscape features, and could be regarded as comparable samples. All 130 participants visited these two tracks during the experiment period. We calculated each participant’s average attention value of all scenic spots on each of the two tracks, and compared participants’ average attention values on the two tracks. The PCC value was 0.833, indicating a high correlation. Taken together, good test–retest and alternate-form reliability test results signified the internal validity of the EEG results, and suggested that the measurements were both reliable and stable over time.
3.2. Validity Testing
Validity was approached through a comparison of the EEG measured with the experts’ average ratings. Table 4 displays the average scores for the experts’ evaluations (ranging between 37.6 and 98.2), EEG values (ranging between 48.6 and 65.6), and self-report scores (ranging between 57.8 and 92.4) for each spot. None of the EEG values fell below 40, the cut-off between “low attention” and “distraction” (see Table 1). Seven scenic spots returned an average EEG score above 60, indicating “heightened attention.” Overall, the EEG scores indicated that participants concentrated their attention throughout the scenic spots along the three tracks.
Table 4.
Results of the Expert Approach, the Self-report Method, and the EEG Method.
The EEG, expert, and self-report rankings are also provided in Table 4. The top eight scenic spots, as judged by experts, also had the highest EEG values (although in slightly different orders), demonstrating high consistency between the two methods in relation to high-quality natural landscapes. Consistency was also evident in the lower ranked scenic spots. Nine of the ten scenic spots scored lowest by experts also appeared in the lowest ten spots in the EEG ranking. However, there is a significant difference in the rankings between the self-report scores and EEG values. Only four and three scenic spots in the self-report ranking fell into the list of the top and lowest ten spots in the EEG ranking, respectively.
As Figure 3 illustrates, although expert and EEG scores on the same scenic spot greatly differ, owing to the different measurement schemes, the overall patterns are similar, where a spike or drop in expert rating often corresponds to a spike or drop in EEG measurement.
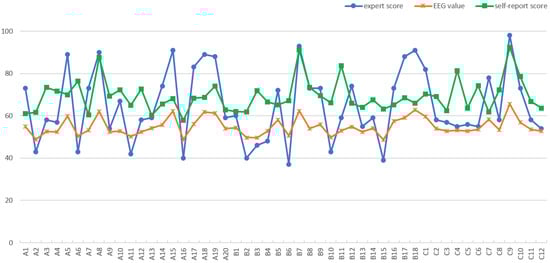
Figure 3.
Line chart of the results of the expert approach and EEG method.
To compare the results of the three assessment methods more intuitively, we imported the data into the SPSS 20.0 software package that allows a data analyst to plot the relationships between two (Correspondence Analysis) or more variables (Optimal Scaling) [44]. The Correspondence Analysis visually displays data classification, using horizontal and vertical segmentation lines to divide the chart area into four quadrants (Figure 4). The EEG measurements of the expert scores and the self-reports are depicted in Figure 4a and Figure 4b, respectively.
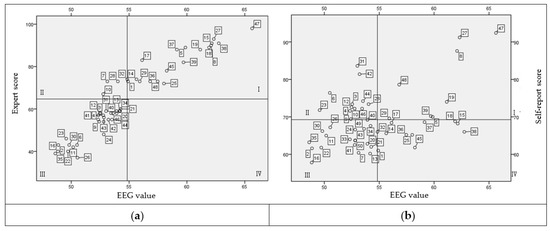
Figure 4.
Four-quadrant chart of the results of the EEG, expert (a) and self-report (b) methods (No. 1–20 refer to A1–A20 spot, No. 21–38 indicate B1–B18 spot, and No. 39–50 mean C1–C12 spot. The reference lines are set at the mean values of the EEG, expert, and self-report scores.).
As Figure 4a shows, the findings indicate little difference between the two measurement methods. Seventeen scenic spots (C9, B7, A15, B18, A8, A5, A18, A19, B17, A17, C1, C7, A14, B9, B16, C10, and B5) lie in Quadrant I, accounting for 34% of the total experiment samples, which indicate the scores of these spots were higher than the mean values of the EEG and expert scores. Moreover, twenty-eight scenic spots (56% of all spots) are distributed in Quadrant III, and only five scenic spots (A7, A10, B8, A1, and B12) are classified into Quadrant II. It is worth noting that these five cases are closely located to the two reference lines. Overall, the high consistency between the two measurements in Figure 4a demonstrates that the EEG method could be an alternative to the expert method in the evaluation of natural landscape resources. However, as shown in Figure 4b, nearly 40% of the total scenic spots are scattered in Quadrant II and Quadrant IV, indicating a low level of consistency between the EEG values and self-report scores. A probable reason for this is the time lag between when attentions were elicited and when participants evaluated the scenic spots, which led to recall inaccuracy.
Hierarchical clustering analysis is an algorithm that groups similar objects into groups called clusters. The endpoint is a set of clusters where each cluster is distinct from every other cluster, and the objects within each cluster are broadly similar to each other [45]. In order to identify the correlation between scores and forest landscape type, we used SPSS software to conduct hierarchical clustering analysis of the three datasets. The hierarchical clustering dendrogram is provided in Figure 5.
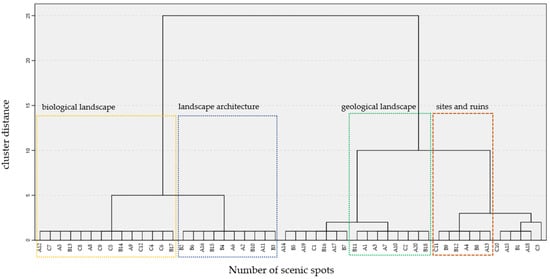
Figure 5.
Hierarchical clustering dendrogram of the three measurements.
According to China’s national standard for classification, investigation, and evaluation of landscapes, landscape types can be divided into six categories: geological landscape, water landscape, biological landscape (plants and wild animals), sites and ruins, astronomical landscape, and landscape architecture. As Figure 5 shows, the five scenic spots which are listed in Quadrant II of Figure 4a were classified into “geological landscape” or “sites and ruins”. A closer examination reveals extraordinary historical or scientific values, or rarities in geology, at these spots. As such, expert knowledge or professional interpretation may be required to allow appreciation. Moreover, biological landscapes and landscape architecture generally have higher scores than other kinds of landscapes. Biological landscapes are the most representative tourism resources in the Zhangjiajie National Forest Park, which are effective in attracting visitor attention. Different from original landscapes in a natural setting, landscape architecture and facilities have a strong visual appeal because of the combination of religious, artistic, and cultural elements.
4. Discussion
4.1. EEG-Based Methodology in Visual Quality Assessment of Forest Landscape
Different from previous EEG-based studies conducted in a laboratory [34,36], this study employed a mobile methodology to investigate visitors’ attentional changes in a national park, and yielded a number of interesting and innovative results.
First, the findings support the idea that external influences can affect the EEG measurements of prior work [20]. Through the pre-test and data process, we identified those factors, including prior experience, track difficulty, weather, crowdedness, and interpretation, that need to be controlled in field studies employing EEG methods. The EEG method may not be suitable for natural environments that present little diversity in features, or are small in size or short in distance, because these changes in scenery may not provide sufficient changes in stimuli to trigger different physiological responses in participants.
Second, to ensure a sufficient sample size for analysis, a significant number of participants must be recruited. The EEG method is likely to return considerable missing data owing to technical issues, such as loss of or interrupted connectivity. We noticed that around 20% of the attention values were either invariant or not consecutive. Less than 30% of participants registered valid data across all spots of the three tracks. Therefore, for multiple-site and longitudinal experimental designs, the sample size needs to be expanded substantially to ensure adequate valid data for analysis.
Third, we chose to only analyze attention values between the 20th to 50th seconds of participants’ stay at each scenic spot, as the values in this period are relatively free from external disturbance and reflect the true response of brain activity to landscape viewing. After the 50th second, attention values quickly dropped as participants became de-sensitized to the landscape. We therefore recommend that future applications of EEG in landscape assessment take these issues into account.
4.2. Implications
By testing EEG as a measure of cognitive response to environmental stimuli, this study sought a methodological and practical method for visual quality assessment research by conducting an innovative field experiment.
Currently, EEG-based landscape research mainly focuses on health and rehabilitation landscapes [46], as well as landscape psychological fatigue and visual fatigue [47]. Landscape attention and landscape preference, and especially the corresponding relationship between EEG data and landscape quality, has been less studied. Based on a “stimulus-response” analysis mechanism of psychophysical paradigm [14], this study proposes a new methodology for landscape quality assessment with the combination of EEG technology and mathematical analysis, which provides a new perspective for application of psychophysiological approaches in landscape studies. Results demonstrate some evidence preliminarily supporting the EEG method, as a means to gather objective measurements of visitors’ attention. This shows promise for use as a supplementary or alternative method for assessing the visual quality of landscapes. Interestingly, the brain attention values show some correspondence with the perceived visual quality of forest landscapes as rated by experts. The consistency between the two approaches is particularly evident in relation to landscapes of high and low aesthetic quality. We also proposed a method for converting EEG data for comparison with the official quality grading system, which may be adopted in future studies. A scenic spot with an EEG score of less than 40 can be considered as a mediocre- or low-quality forest landscape, and the spot which scored over 60 usually has high aesthetic and recreational values. Furthermore, different landscape types show distinct attention values, and scenes with typical visual guidance and focus are easier to get visitor attention. The landscape visual characteristics are clearly displayed through the quantification and visualization of EEG data.
The application of cutting edge psychophysiological techniques provides a new avenue for landscape assessment research [16]. A series of studies in cognitive psychology demonstrated the coherent effects of emotion on attention [48,49,50], and provided accrued evidence that the attention-emotion connection is robust, reliable, and important [51]. Therefore, the findings not only support previous laboratory-based research that visitors’ emotion varies dramatically with the environmental stimuli of varying degrees of visual quality [52], but also validate the stability of the wearable EEG equipment outside the laboratory environment; offering a reliable alternative to emotion measures for future studies. Furthermore, the results offer some evidence that real-time psychophysiological measurement methods may more objectively reflect visitors’ emotional responses than the post hoc self-report method [53], due to the subconscious and non-discrete nature of visitor emotions.
Despite these issues, we believe the EEG method should be particularly beneficial in managing and exploring the landscape resources of forest destinations, and should be developed for practice. For instance, park management authorities could use the EEG method to identify locations that trigger the strongest physiological responses of visitors, providing useful insights regarding site selection for lookouts and walking tracks.
4.3. Limitations
As the experiment was conducted in a natural mountain landscape, the findings may be limited to the particular experimental setting and the type of scenic spots participants visited. Only college students were selected as experimental participants in this study. However, groups with different demographic characteristics have different preferences on landscape perception; a homogeneous group of participants may not fully represent the overall visitor demographic. Furthermore, more sophisticated and sensitive EGG devices are available, although they tend to be more intrusive, requiring participants to attach a large number of sensors to their head and body, and making the recruitment of participants difficult. In following the data cleaning procedure set out by the EEG device manufacturer, this study excluded the interferences of other external factors (e.g., noises) as much as possible. Results attributable to attentional changes, possibly related to the attractiveness of natural landscapes, were measured in the study. Nevertheless, we acknowledge the difficulty of completely isolating the influence of physical activities, such as muscle activity, eye blinks, and physical movement, owing to the forest setting of the experiment. Furthermore, the EEG data showed when and where visitors reacted to the environment, but did not enable identification of the exact attributes of the environment that triggered attentional responses. We therefore recommend that EEG data collection incorporate a qualitative data collection component to solicit further explanatory insights.
4.4. Further Research
Further research is also needed to develop standard protocols for using mobile EEG devices to assess the visual quality of forest landscapes. Such protocols should set basic experiment requirements in terms of physical distance, landscape pattern, number of participants, and other factors. An examination of visitor markets with different ages, occupations, cultural background, and visiting times would also be useful to determine whether differences exist in aesthetic perceptions, as measured by EEG. In addition, future research could extend the use of the EEG method to other types of natural landscapes, such as lakes, and geological or rural sites. While cultural sites can also be investigated, appropriate interpretation of the site by participants may be required to enable an understanding and appreciation of each site’s cultural and historical significance. Such an interpretation may need to take place prior to data collection to minimize its influence on participants’ physiological responses attributable to visual stimuli. Overall, we believe the physiological approach to landscape evaluation has a significant role to play in future research as technologies evolve, and more advanced EEG devices and software packages become available.
5. Conclusions
This study conducted an exploratory investigation to assess the usability of the mobile EEG method in visual quality assessment, and presented, for the first time, a psychophysiological methodology for quantization analysis of forest landscape attention. From the findings, the following conclusions were obtained: Firstly, a significant correlation exists through good test–retest and alternate-form reliability test results, implying high stability of the EEG data over time and on different tourist tracks. Secondly, the EEG data, however, do not align with participants’ self-reports. The results offer additional evidence that real-time psychophysiological methods could more objectively reflect visitors’ emotional responses than the post hoc self-report method, due to the subconscious and non-discrete nature of visitor emotions. Thirdly, the brain’s attention values are roughly in line with the perceived visual quality of forest landscapes as rated by landscape experts. The consistency between the two approaches is particularly evident in relation only to forest landscapes of high and low visual quality. Additionally, the EEG method, a means to gather objective measurements of visitors’ emotions, may be useful as a supplementary or an alternative method for assessing the visual quality of forest landscapes.
Supplementary Materials
The following supporting information can be downloaded at: https://www.mdpi.com/article/10.3390/f13101668/s1, Figure S1: Raw EEG data of one participant in the Yuanjiajie track; Table S1: Processed EEG Data of Yuanjiajie Track for One Group of Participants.
Author Contributions
Conceptualization, J.W. and Y.Z.; methodology, Y.Z.; formal analysis, C.G.; investigation, J.W. and C.G.; Writing–original draft, J.W. and Y.W.; Writing–review and editing, J.W. and Y.W.; Funding acquisition, Y.Z. All authors have read and agreed to the published version of the manuscript.
Funding
This research was funded by the National Key Research and Development Program of China (Grant No. 2019YFD1100404).
Institutional Review Board Statement
Not applicable.
Informed Consent Statement
Informed consent was obtained from all subjects involved in the study.
Data Availability Statement
Data are available from the authors upon request.
Acknowledgments
The author thank Susanne Becken from Griffith Institute for Tourism for her good comments on the paper, and Qiong Xiao and Qing Zhang for their assistance with data collection.
Conflicts of Interest
The authors declare no conflict of interest. The funders had no role in the design of the study; in the collection, analyses, or interpretation of the data; in the writing of the manuscript, or in the decision to publish the results.
References
- Eggers, J.; Lindhagen, A.; Lind, T.; Lämås, T.; Öhman, K. Balancing landscape-level forest management between recreation and wood production. Urban For. Urban Green. 2018, 33, 1–11. [Google Scholar] [CrossRef]
- Gobster, P.H.; Ribe, R.G.; Palmer, J.F. Themes and trends in visual assessment research: Introduction to the Landscape and Urban Planning special collection on the visual assessment of landscapes. Landsc. Urban Plan. 2019, 191, 103635. [Google Scholar] [CrossRef]
- Cheng, A.S.; Mattor, K.M. Place-based planning as a platform for social learning: Insights from a national forest landscape assessment process in Western Colorado. Soc. Nat. Resour. 2010, 23, 385–400. [Google Scholar] [CrossRef]
- Kangas, J.; Store, R.; Leskinen, P.; MehtaÈtalo, L. Improving the quality of landscape ecological forest planning by utilising advanced decision-support tools. For. Ecol. Manag. 2000, 132, 157–171. [Google Scholar] [CrossRef]
- Geneletti, D. Expert panel-based assessment of forest landscapes for land use planning. Mt. Res. Dev. 2007, 27, 220–223. [Google Scholar] [CrossRef]
- Zube, E.H.; Sell, J.L.; Taylor, J.G. Landscape perception: Research, application and theory. Landsc. Plan. 1982, 9, 1–33. [Google Scholar] [CrossRef]
- Daniel, T.C.; Vining, J. Methodological issues in the assessment of landscape quality. In Behavior and the Natural Environment; Irwin, A., Wohlwill, J.F., Eds.; Springer: Boston, MA, USA, 1983; pp. 39–84. [Google Scholar]
- Gobster, P.H.; Chenoweth, R.E. The dimensions of aesthetic preference: A quantitative analysis. J. Environ. Manag. 1989, 29, 47–72. [Google Scholar]
- Lothian, A. Landscape and the philosophy of aesthetics: Is landscape quality inherent in the landscape or in the eye of the beholder? Landsc. Urban Plan. 1999, 44, 177–198. [Google Scholar] [CrossRef]
- Frank, S.; Fürst, C.; Koschke, L.; Witt, A.; Makeschin, F. Assessment of landscape aesthetics—Validation of a landscape metrics-based assessment by visual estimation of the scenic beauty. Ecol Indic. 2013, 32, 222–231. [Google Scholar] [CrossRef]
- Zellweger, F.; Morsdorf, F.; Purves, R.S.; Braunisch, V.; Bollmann, K. Improved methods for measuring forest landscape structure: LiDAR complements field-based habitat assessment. Biodivers. Conserv. 2014, 23, 289–307. [Google Scholar] [CrossRef]
- Xiaofeng, L.; Chunyang, Z. Forest landscape quality evaluation in Maoer Mountain. J. Northeast. For. Univ. 1991, 35, 91–95. [Google Scholar]
- Wang, C.; Zhai, M.; Jin, Y.; Ma, R. Current research and prospects on forest landscape quality assessment. World For. Res. 2006, 19, 18–22. [Google Scholar]
- Daniel, T.C. Whither scenic beauty? Visual landscape quality assessment in the 21st century. Landsc. Urban Plan. 2001, 54, 267–281. [Google Scholar] [CrossRef]
- Notaro, S.; Grilli, G.; Paletto, A. The role of emotions on tourists’ willingness to pay for the Alpine landscape: A latent class approach. Landsc. Res. 2018, 43, 1–14. [Google Scholar] [CrossRef]
- Moyle, B.D.; Moyle, C.-l.; Bec, A.; Scott, N. The next frontier in tourism emotion research. Curr. Issues Tour. 2019, 22, 1393–1399. [Google Scholar] [CrossRef]
- Spinney, J. Close encounters? Mobile methods,(post) phenomenology and affect. Cult. Geogr. 2015, 22, 231–246. [Google Scholar] [CrossRef]
- Ohme, R.; Reykowska, D.; Wiener, D.; Choromanska, A. Analysis of neurophysiological reactions to advertising stimuli by means of EEG and galvanic skin response measures. J. Neurosci. Psychol. Econ. 2009, 2, 21–31. [Google Scholar] [CrossRef]
- Lin, M.-H.J.; Cross, S.N.; Jones, W.J.; Childers, T.L. Applying EEG in consumer neuroscience. Eur. J. Mark. 2018, 52, 66–91. [Google Scholar] [CrossRef]
- Khushaba, R.N.; Wise, C.; Kodagoda, S.; Louviere, J.; Kahn, B.E.; Townsend, C. Consumer neuroscience: Assessing the brain response to marketing stimuli using electroencephalogram (EEG) and eye tracking. Expert Syst. Appl. 2013, 40, 3803–3812. [Google Scholar] [CrossRef]
- Babiloni, F.; Cincotti, F.; Mattia, D.; Mattiocco, M.; Bufalari, S.; Fallani, F.D.V.; Tocci, A.; Bianchi, L.; Marciani, M.G.; Meroni, V. Neural basis for the brain responses to the marketing messages: An high resolution EEG study. In Proceedings of the 2006 International Conference of the IEEE Engineering in Medicine and Biology Society, New York, NY, USA, 30 August–3 September 2006. [Google Scholar]
- Vecchiato, G.; Astolfi, L.; De Vico Fallani, F.; Toppi, J.; Aloise, F.; Bez, F.; Wei, D.; Kong, W.; Dai, J.; Cincotti, F. On the use of EEG or MEG brain imaging tools in neuromarketing research. Comput. Intell. Neurosci. 2011, 2011, 643489. [Google Scholar] [CrossRef]
- Atik, M.; Işıklı, R.C.; Ortaçeşme, V.; Yıldırım, E. Exploring a combination of objective and subjective assessment in landscape classification: Side case from Turkey. Appl. Geogr. 2017, 83, 130–140. [Google Scholar] [CrossRef]
- Wang, R.; Zhao, J. Effects of evergreen trees on landscape preference and perceived restorativeness across seasons. Landsc. Res. 2020, 45, 649–661. [Google Scholar] [CrossRef]
- Arriaza, M.; Cañas-Ortega, J.F.; Cañas-Madueño, J.A.; Ruiz-Aviles, P. Assessing the visual quality of rural landscapes. Landsc. Urban Plan. 2004, 69, 115–125. [Google Scholar] [CrossRef]
- Tang, I.-C.; Tsai, Y.-P.; Lin, Y.-J.; Chen, J.-H.; Hsieh, C.-H.; Hung, S.-H.; Sullivan, W.C.; Tang, H.-F.; Chang, C.-Y. Using functional Magnetic Resonance Imaging (fMRI) to analyze brain region activity when viewing landscapes. Landsc. Urban Plan. 2017, 162, 137–144. [Google Scholar] [CrossRef]
- Herbert, B.M.; Pollatos, O.; Schandry, R. Interoceptive sensitivity and emotion processing: An EEG study. Inter. J. Psychol. 2007, 65, 214–227. [Google Scholar] [CrossRef] [PubMed]
- Baumgartner, T.; Esslen, M.; Jäncke, L. From emotion perception to emotion experience: Emotions evoked by pictures and classical music. Inter. J. Psychol. 2006, 60, 34–43. [Google Scholar] [CrossRef] [PubMed]
- Gerger, G.; Leder, H.; Kremer, A. Context effects on emotional and aesthetic evaluations of artworks and IAPS pictures. Acta Psychol. 2014, 151, 174–183. [Google Scholar] [CrossRef]
- Ulrich, R.S. Natural versus urban scenes: Some psychophysiological effects. Environ. Behav. 1981, 13, 523–556. [Google Scholar] [CrossRef]
- Acedo, J.; Soria-Frisch, A.; Ibáñez, D.; Castellano, M.; Dunne, S. Affective BCI for characterizing museum visitors response. In Proceedings of the 49th Asilomar Conference on Signals, Systems and Computers, Asiloma, Pacific Grove, CA, USA, 8–11 November 2015. [Google Scholar]
- Cruz-Garza, J.G.; Brantley, J.A.; Nakagome, S.; Kontson, K.; Megjhani, M.; Robleto, D.; Contreras-Vidal, J.L. Deployment of mobile EEG technology in an art museum setting: Evaluation of signal quality and usability. Front. Hum. Neurosci. 2017, 11, 527. [Google Scholar] [CrossRef]
- Banzi, A.; Folgieri, R. EEG-based BCI data analysis on visual-priming In the context of a museum of fine arts. In Proceedings of the International Conference on Distributed Multimedia Systems, Miami Beach, FL, USA, 9–11 August 2012; Knowledge Systems Institute: Skokie, IL, USA, 2012; pp. 75–78. [Google Scholar]
- Lengen, C. The effects of colours, shapes and boundaries of landscapes on perception, emotion and mentalising processes promoting health and well-being. Health Place 2015, 35, 166–177. [Google Scholar] [CrossRef]
- Aspinall, P.; Mavros, P.; Coyne, R.; Roe, J. The urban brain: Analysing outdoor physical activity with mobile EEG. Br. J. Sports Med. 2015, 49, 272–276. [Google Scholar] [CrossRef]
- Khushaba, R.N.; Greenacre, L.; Kodagoda, S.; Louviere, J.; Burke, S.; Dissanayake, G. Choice modeling and the brain: A study on the Electroencephalogram (EEG) of preferences. Expert Syst. Appl. 2012, 39, 12378–12388. [Google Scholar] [CrossRef]
- Crowley, K.; Sliney, A.; Pitt, I.; Murphy, D. Evaluating a brain-computer interface to categorise human emotional response. In Proceedings of the 10th IEEE International Conference on Advanced Learning Technologies, Sousse, Tunisia, 5–7 July 2010; IEEE: Piscataway, NJ, USA, 2010; pp. 276–278. [Google Scholar]
- Katona, J.; Ujbanyi, T.; Sziladi, G.; Kovari, A. Speed control of Festo Robotino mobile robot using NeuroSky MindWave EEG headset based brain-computer interface. In Proceedings of the 7th IEEE International Conference on Cognitive Infocommunications, Wroclaw, Poland, 16–18 October 2016; IEEE: Piscataway, NJ, USA, 2016; pp. 000251–000256. [Google Scholar]
- Suprihadi, T.; Karyono, K. DROWTION: Driver drowsiness detection software using MINDWAVE. In Proceedings of the 2014 International Conference on Industrial Automation, Information and Communications Technology, Bali, Indonesia, 28–30 August 2014; IEEE: Piscataway, NJ, USA, 2014; pp. 141–144. [Google Scholar]
- Zhang, Q.; Wu, J.; Wang, M.; Chen, L. Visitor Survey Report of Zhangjiajie National Forest Park; Central South University of Forestry and Technology: Changsha, China, 2015; in press. [Google Scholar]
- Hull IV, R.B.; Buhyoff, G.J.; Daniel, T.C. Measurement of scenic beauty: The law of comparative judgment and scenic beauty estimation procedures. For. Sci. 1984, 30, 1084–1096. [Google Scholar]
- Holmefur, M.; Aarts, P.; Hoare, B.; Krumlinde-Sundholm, L. Test-retest and alternate forms reliability of the assisting hand assessment. J. Rehabil. Med. 2009, 41, 886–891. [Google Scholar] [CrossRef]
- Saa, J.P.; Doherty, M.; Young, A.; Spiers, M.; Leary, E.; Wolf, T.J. Development and Alternate Form Reliability of the Complex Task Performance Assessment (CTPA) for People With Mild Stroke. Am. J. Occup. Ther. 2017, 71, 1–7. [Google Scholar] [CrossRef]
- Funnell, B.; Bryer, F.; Grimbeek, P.; Davies, M. Demographic profiling for educational researchers: Using SPSS optimal scaling to identify distinct groups of participants. Educ. Wea. Res. Prac. 2004, 2, 94–103. [Google Scholar]
- Yim, O.; Ramdeen, K.T. Hierarchical cluster analysis: Comparison of three linkage measures and application to psychological data. Quant. Method Psychol. 2015, 11, 8–21. [Google Scholar] [CrossRef]
- Li, Z.; Cheng, Y.; Yuan, Y. Research on the application of virtual reality technology in landscape design teaching. Edu. Sci. 2018, 18, 1400–1410. [Google Scholar]
- Goto, S.; Park, B.-J.; Tsunetsugu, Y.; Herrup, K.; Miyazaki, Y. The effect of garden designs on mood and heart output in older adults residing in an assisted living facility. Health Environ. Res. Design J. 2013, 6, 27–42. [Google Scholar] [CrossRef]
- Lundqvist, D.; Ohman, A. Emotion regulates attention: The relation between facial configurations, facial emotion, and visual attention. Vis. Cogn. 2005, 12, 51–84. [Google Scholar] [CrossRef]
- Bradley, M.M. Natural selective attention: Orienting and emotion. Psychophysiology 2009, 46, 1–11. [Google Scholar] [CrossRef] [PubMed]
- MacKay, D.G.; Shafto, M.; Taylor, J.K.; Marian, D.E.; Abrams, L.; Dyer, J.R. Relations between emotion, memory, and attention: Evidence from taboo Stroop, lexical decision, and immediate memory tasks. Mem. Cogn. 2004, 32, 474–488. [Google Scholar] [CrossRef] [PubMed]
- Yiend, J. The effects of emotion on attention: A review of attentional processing of emotional information. Cogn. Emot. 2010, 24, 3–47. [Google Scholar] [CrossRef]
- Shoval, N.; Schvimer, Y.; Tamir, M. Real-time measurement of tourists’ objective and subjective emotions in time and space. J. Travel Res. 2018, 57, 3–16. [Google Scholar] [CrossRef]
- Ravaja, N. Contributions of psychophysiology to media research: Review and recommendations. Media Psychol. 2004, 6, 193–235. [Google Scholar] [CrossRef]
Publisher’s Note: MDPI stays neutral with regard to jurisdictional claims in published maps and institutional affiliations. |
© 2022 by the authors. Licensee MDPI, Basel, Switzerland. This article is an open access article distributed under the terms and conditions of the Creative Commons Attribution (CC BY) license (https://creativecommons.org/licenses/by/4.0/).