Article

Effect of Different Peat Substitute Substrates on the Growth and Quality of Seedlings of Handroanthus chrysanthus (Jacq.) S.O. Grose

Research Institute of Fast-Growing Trees, CAF, 30 Mid Renmin Dadao, Zhanjiang 524022, China
*
Author to whom correspondence should be addressed.
Forests 2022, 13(10), 1626; https://doi.org/10.3390/f13101626
Submission received: 19 August 2022 / Revised: 25 September 2022 / Accepted: 30 September 2022 / Published: 3 October 2022
(This article belongs to the Section Forest Ecophysiology and Biology)

Abstract

:
With the depletion of peat resources, local agricultural and forestry wastes represent potential seedling substrate materials. We investigated the effects of mixed substrates supplemented with peat replacements, such as decomposed eucalyptus bark, coconut bran, and carbonized rice husk, on the growth of Handroanthus chrysanthus (Jacq.). We screened suitable organic substrates for the production of seedlings of H. chrysanthus to provide a theoretical basis for its scientific cultivation. The proportions of 15 types of substrates were determined by using simplex center-of-gravity mixing. The physical properties of different mixed substrates were studied, and the growth, biomass, root development, and photosynthesis of seedlings were analyzed. The quality of seedlings was comprehensively evaluated, and the optimal substrate ratio was obtained through regression analysis. Substrate compositions had significantly different effects on growth, biomass, root morphology, and photosynthesis. The results of these single-index analyses were corroborated by using principal component analysis. Adding decomposed eucalyptus bark was beneficial to the growth of seedlings, whereas coconut bran and perlite restricted growth. The results show that decomposed eucalyptus bark can replace peat as a container seedling substrate. The substrate formula can be used to provide technical support and a theoretical basis for the scientific cultivation of high-quality light matrix seedlings of H. chrysanthus.

1. Introduction

Handroanthus chrysanthus (Jacq.) belongs to the family Bignoniaceae and produces famously colorful and woody flowers with a high ornamental value [1,2]. H. chrysanthus is native to the tropical and subtropical regions of America, spanning from Mexico and the Caribbean to Argentina, with most species being native to Cuba and Haiti [3,4]. This species was first introduced to Taiwan during the 1960s, [5] and specimens from the American Los Angeles Arboretum were sent to the South China Botanical Garden in Guangzhou during the 1970s [6]. Because of its beautiful visual effect on the garden landscape, it has been gradually applied to the afforestation of garden, street, and landscape areas [7]. The trees have been planted in Guangdong, Guangxi, Hainan, and other provinces (regions) in South China and the southwest tropical region of China. These trees are ideal for garden landscaping, with broad prospects for development and utilization [8]. At present, the development of the seedling industry of H. chrysanthus is relatively slow, and primarily, mud bag seedlings are available on the market with poor quality and low water- and fertilizer-utilization efficiencies at high transportation costs. Therefore, suitable cultivation substrates must be urgently found to reduce the scarcity of high-quality seedlings.
Container seedlings are widely used in various seedling industries due to their short raising cycles, excellent quality, high afforestation survival rate, and easy-to-control specifications [9,10]. The seedling substrate forms the basis for providing water and fertilizer for the growth, development, and quality of seedlings. The selection and preparation of appropriate substrates play decisive roles in determining their quality and survival rate [11,12,13]. Studies have shown that peat is an ideal substrate for the cultivation of container seedlings [14,15,16]. Huang [17] studied the effects of peat soil, garden soil, nutrient soil, and peat:coconut bran (1:1) on the growth and physiological characteristics of H. chrysanthus seedlings, and selected peat soil as the best seedling substrate. However, the excessive exploitation of peat has harmed the environment and aggravated climate change. With the depletion of peat resources, its use has gradually become highly restricted [18,19,20,21]. Therefore, the modern seedling industry must consider matrix performance and economic cost, along with environmental-protection factors. It is now necessary to find an alternative resource to replace peat. Many studies have shown that local agricultural and forestry wastes such as rock wool, dead branches and leaves, and bacterial and vinegar residues can be used as seedling substrate materials for container seedling culture after a series of treatments [22,23,24,25,26,27]. Studies have shown that the physical and chemical properties of decomposed eucalyptus bark and peat are similar, and they can promote the growth of seedlings, save production costs, and replace peat in the cultivation of seedlings [28]. Research has shown that using coconut bran instead of peat as growth substrates can significantly improve the quality of subtropical ornamental plant seedlings [29,30]. The effect of coconut bran as a single substrate is poor; however, when it is combined with other substrates in reasonable proportions, it affects the cultivation of strong seedlings with an increase in production and enhanced efficiency [31]. Carbonized rice husk exhibits favorable aeration and nutrient composition and slow decomposition, making it a good cultivation substrate [32]. Agricultural and forestry wastes can be used as seedling substrates to protect non-renewable resources and save costs, but these may not suit the matrix seedlings of H. chrysanthus.
Mixture test design is widely employed for formula screening by analyzing the relationships between different proportions of various test factors and reaction variables. Therefore, mixture test design is widely used for matrix formula screening and optimization, owing to its advantages of fewer tests, adequate generation of information, and high prediction accuracy [33]. In this study, decomposed eucalyptus bark, coconut bran, carbonized rice husk, and perlite were used as substitute substrate materials. The matrix formula was designed by using the simplex gravity center mixture, and the commonly used flower cultivation substrate (peat content exceeding 50%) in the market was selected as the control. The effects of different substrates on the growth, biomass, root system, and photosynthesis of H. chrysanthus were analyzed, and the seedling quality of different substrates was comprehensively evaluated by using the principal component analysis (PCA). A stepwise regression model was also established. Screening for and optimization of the substrate formula provides the theoretical basis and technical support for the scientific cultivation of container seedlings of H. chrysanthus. The findings of this study present a method to promote the recycling of agricultural and forestry wastes.

2. Materials and Methods

2.1. Plant Materials and Treatments

Experiments were conducted in the greenhouse of the Southern National Forest Seedling Demonstration Base (SNFS), from 5 December 2021 to 15 June 2022. Test materials mainly included decomposed eucalyptus bark, coconut bran, carbonized rice husk, and perlite. The rice husk was purchased from Suixi Lingbei Yinfeng grain processing plant and carbonized at the SNFS. The decomposed eucalyptus bark was obtained from the SNFS, and coconut bran and perlite were purchased from Mazhang Nanguo Flower Industrial Park. Data processing system (DPS) software was used to optimize four types of raw materials: decomposed eucalyptus bark, coconut bran, carbonized rice husk, and perlite, using the mixture design M {4, 4} and the simplex center-of-gravity design method. Fifteen substrate treatment groups were created, and all raw materials were mixed by volume ratio (Table 1). Commonly used flower seedling substrates in the market were selected as the control (CK), and 15 × 20 cm non-woven seedling bags were used to grow 30 seedlings each. The mixed substrate was disinfected with 0.5% potassium permanganate solution for 2 h and then fully rinsed with clean water and kept on standby. H. chrysanthus seeds from the current year were then collected and raised till the seedling stage. Seedlings with a height of approximately 5 cm and uniform size were selected and transplanted into sterile seedling bags. Water was sprayed once a day, and foliar spraying with a compound fertilizer was conducted once after two months. The amount of fertilizer used was constant.

2.2. Determination of Physical Properties of Matrix

Sixteen seedling substrates were mixed evenly according to formula proportions, and three replicates of each substrate were taken back to the laboratory to determine their physical indices [34]. The substrate was air-dried in a 100 cm3 cutting ring covered by filter paper of a known weight, W0. After recording the dry weight (W1), the cutting ring filled with the substrate was immersed in water for 48 h, and its saturated weight (W2) was recorded. After fully controlling the water, the aeration weight (W3) was recorded. The volume weight, total porosity, water-holding porosity, aeration porosity, maximum water capacity, and water–air ratio were then calculated according to Equations (1)–(6), respectively:
Bulk density (g/cm3) = (W1 − W0)/100
Total porosity (%) = [(W2 − W1)/100] × 100%
Aeration porosity (%) = [(W2 − W3)/V] × 100%
Water holding porosity (%) = Total porosity (%) − Aeration porosity (%)
Maximum water holding capacity (%) = (W2 − W1)/W0
Water–air ratio = Water holding porosity/Aeration porosity

2.3. Determination of Growth Characters and Biomass

Seedling height (H) was measured with a straight ruler from the base of the stem to the highest stalk (accurate to 0.1 cm). The ground diameter (D) was measured with a vernier caliper (accurate to 0.01 mm) around the thickest part of the stem base. Branch number was defined as the number of all branches of the plant. The height–diameter ratio (H/D) is the ratio of seedling height to ground diameter. All growth indices were examined per plant. Three seedlings with roughly the same growth were selected for each treatment, and the whole plant was excavated. The aboveground and underground parts were separated, and the root was rinsed once with clean water and three times with distilled water. Samples were placed in the oven and dried to constant weight, at 70 °C. The whole-plant dry weight (WDW), aboveground dry weight (ADW), and underground dry weight (UDW) were then determined, and the strong seedling index was calculated. The formulae for the root stem ratio (R/S) and strong seedling index are as follows: R/S = UDW/ADW; strong seedling index = [stem diameter (mm)/seedling height (cm) + strong seedling index (g)/ADW (g)] × whole-seedling dry weight (g) [35,36].

2.4. Determination of Root Parameters

The root morphological indices of the samples measured in Section 2.3 were determined. Root morphological characteristics were determined by using the WinRHIZO root analysis system (WinRHIZO Pro 2007D, Regent Instruments Inc., Québec City, QC, Canada). The root was placed in a resin glass tank and fully expanded. Plants with developed roots were divided into several parts. The Expression 12000XL image scanner was used to scan the root to obtain images. The root was cleaned and placed in a tray for scanning. To prevent wet roots from clumping together, water was added to the root-containing dish, and the roots were spread with plastic tweezers. Covers were removed during scanning. The WinRHIZO software was used to obtain the characteristic parameters of the root system through digital processing. Quantitative analyses of total root length (RL), total root projected area (PA), total root surface area (SA), root average diameter (AD), root length per cubic centimeter (VS), root volume (RV), and root tip number (Ntips) were performed.

2.5. Determination of Photosynthetic Parameters and Relative Chlorophyll Content

Relative chlorophyll content was measured by using a chlorophyll-content analyzer (SPAD-502; Spectrum Technologies, Tokyo, Japan). Five leaves were selected from the second branch above the bottom for measurement. Three seedlings for each treatment with the same growth were selected and moved outdoors, in advance, for seedling refining, and 7 days later, photosynthesis was measured in clear weather. The gas-exchange parameters of seedlings were measured by using the Li-6400 photosynthetic measurement system (Li-COR, Lincoln, NE, USA), between 09:00 and 11:00, under natural light. The illumination intensity was 1200 mol m−2·s−1, and the gas flow rate was 500 umol·s−1. The net photosynthetic rate (Pn, μmol CO2·m−2·s−1), stomatal conductance (Gs, mmol H2O·m−2·s−1), intercellular carbon dioxide concentration (Ci, μmol·CO2 m−2·s−1), and transpiration rate (Tr, mmol H2O·m−2·s−1) were recorded. Three plants were analyzed for each treatment, and the average of the three leaves was used as the determining value for the plant.

2.6. Optimization of Substrate Formulation

PCA was used to analyze 23 indices of 15 substrate formulae from T1 to T15 and CK. Corresponding principal components were selected when the contribution rate of the cumulative variance of principal components reached 85% to construct the trait index system, and the mathematical model for the evaluation of the scores of principal components was established. The comprehensive score is the cumulative value of each main component. Using the goal of the maximum comprehensive score (Yi), the corresponding trait expression value (theoretical value) was calculated by using the Scheffe expression model with DPS 7.05 software.

2.7. Data Processing and Statistical Analysis

Excel 2010 was used for data collation; SPSS 24.0 was used for one-way analysis of variance (ANOVA), PCA, and Duncan’s multiple comparisons. DPS 7.05 software was used to perform Scheffe mixing analysis on original data.

3. Results

3.1. Analysis of Variance of Physical Properties of Mixed Substrates

Descriptive statistics and a variance analysis were carried out on six physical properties of 16 mixed matrices, including bulk density, total porosity, aeration porosity, water holding porosity, water–air ratio, and maximum water holding capacity (Table 2 and Table 3). The results showed that the physical properties of different substrates were significantly different (p < 0.01), indicating that it was feasible to identify an excellent matrix formula. The bulk density of different substrates varied significantly; the maximum was 0.57 g/cm3, and the minimum was 0.08 g/cm3. The ranges of total porosity, aeration porosity, and water-holding porosity were 56.10–82.00%, 8.30–61.25%, and 12.70–58.30%, respectively, indicating that the aeration porosity and water-holding porosity varied significantly for different treatments. The minimum value of the maximum water-holding capacity was 1.04, and the maximum value was 8.38. The minimum value of the gas water–air ratio was 0.14 and the maximum value was 4.52. The kurtosis of total porosity, aeration porosity, and maximum water-holding capacity was less than 0, indicating that the data distribution of these three indicators was not significant compared to their normal distributions, which were flat peaks. The other three characteristics also had flat peaks. The skewness indexes showed that the total porosity, aeration porosity, water-holding porosity, and maximum water-holding capacity had near-normal distributions.

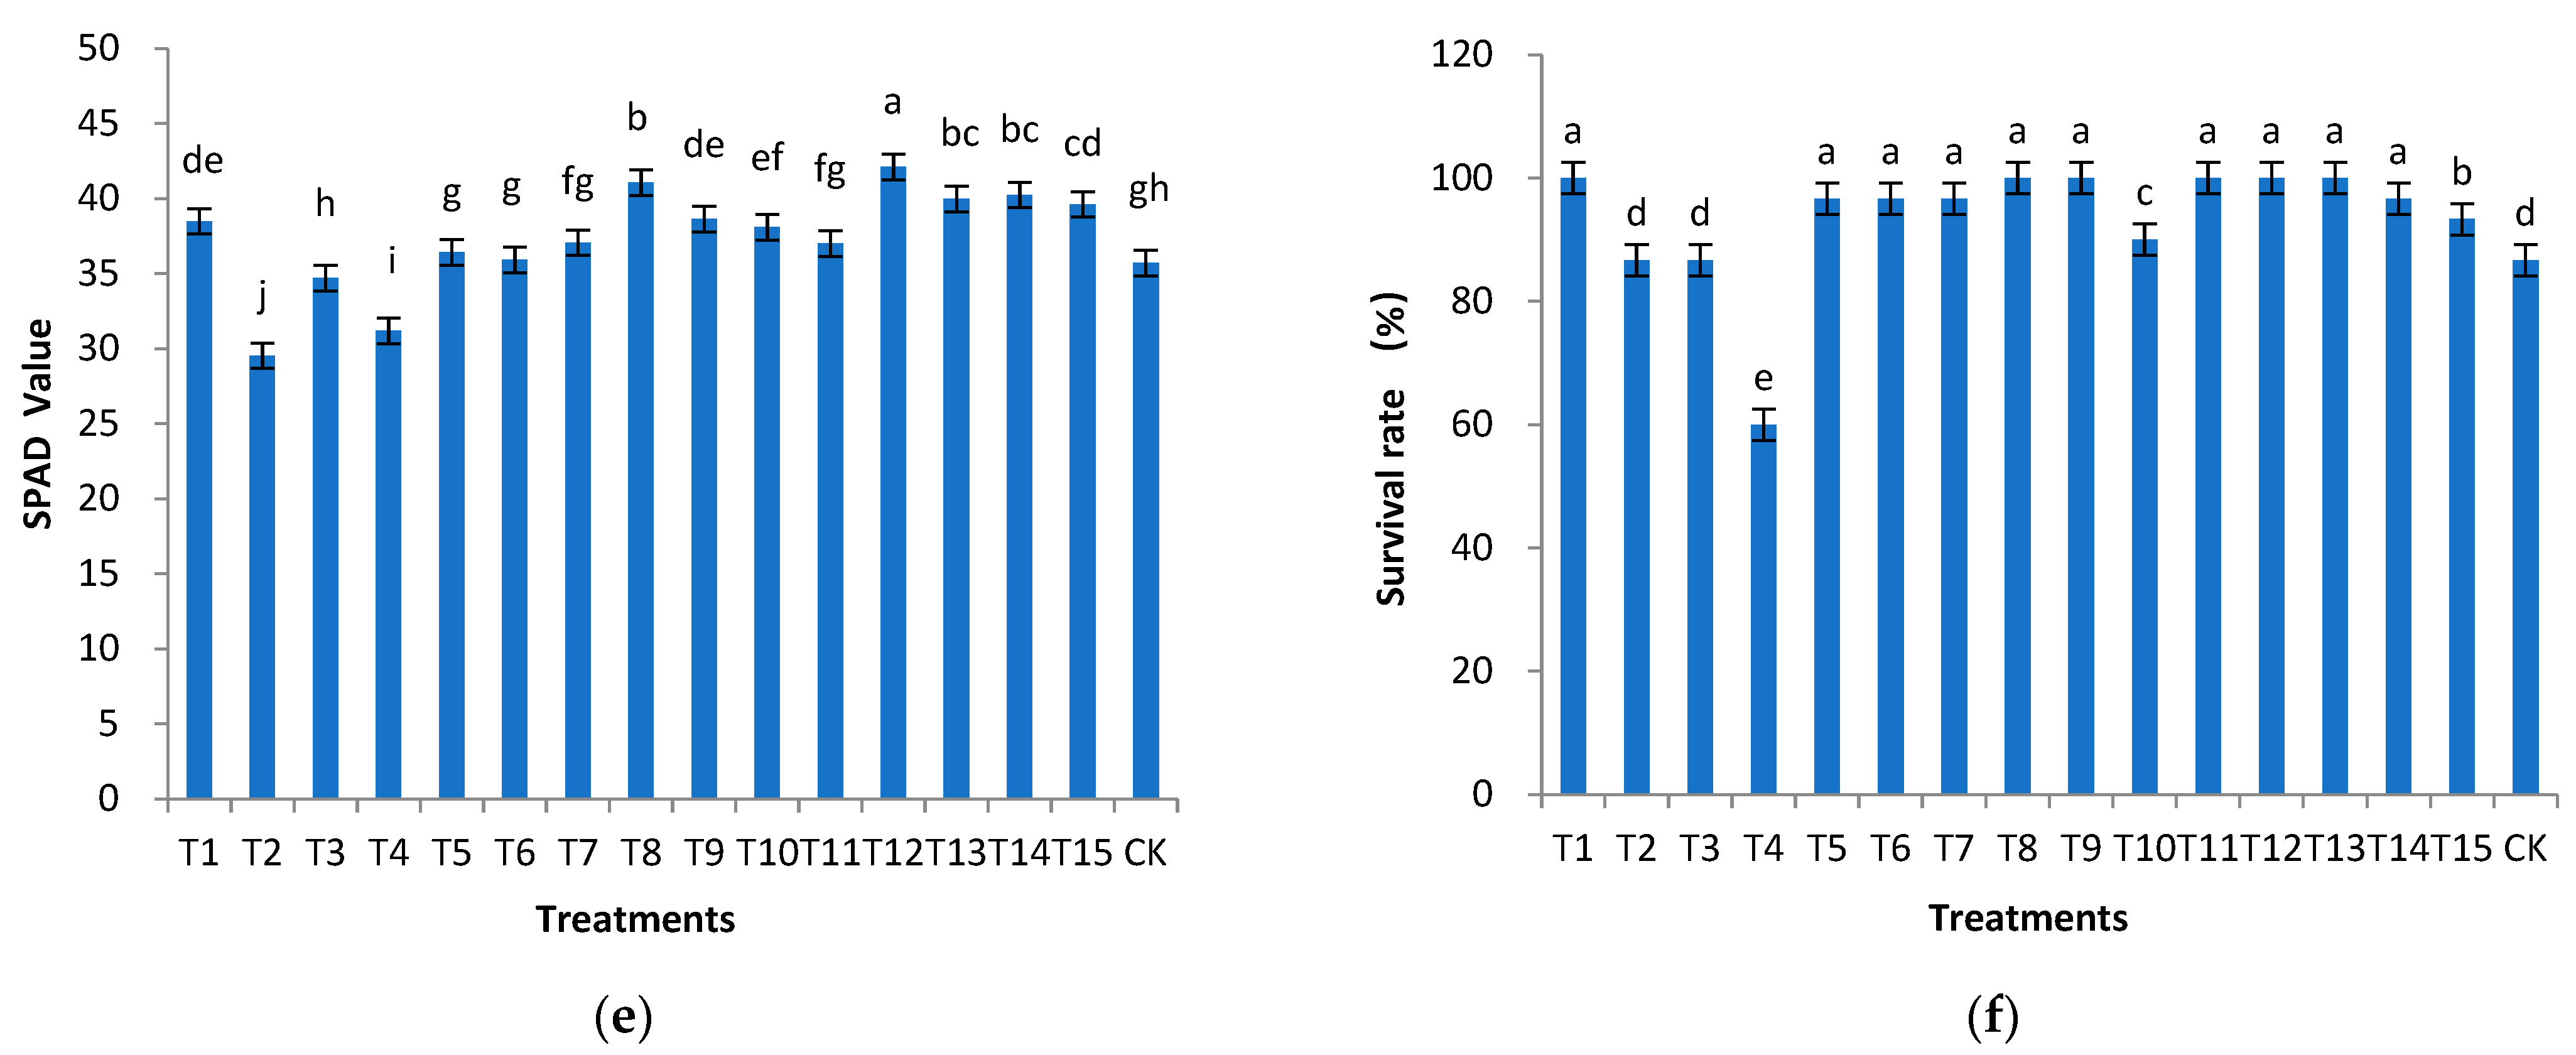
3.2. Effects of Different Substrates on Growth Characteristics and Chlorophyll Content of H. chrysanthus

Significant differences were observed in the seedling height, ground diameter, branch number, and chlorophyll content of different substrates (Figure 1). The results of the multiple comparative analyses showed that T8 had the highest seedling height (27.34 cm), followed by T1 and T12, at 24.9 cm and 19.58 cm, respectively. T4 had the lowest seedling height, followed by T2, CK, and T6 (Figure 1a). T8 had the maximum ground diameter, followed by T1 and T12, measuring 4.93, 4.34, and 4.33 mm, respectively. T2 had the minimum ground diameter, followed by T4, T6, CK, and T7 (Figure 1b). T8 had the highest number of branches, followed by T1 and T10, with 7.60, 7.00, and 7.00 branches, respectively (Figure 1d). T12 had the highest chlorophyll content, whereas T2 had the lowest amount of chlorophyll. The results indicated that different substrate ratios had significant effects on the seedling growth and SPAD value of H. chrysanthus (Figure 1e). The height–diameter ratio was significantly different for different substrates. The height–diameter ratios of T8, T1, and T12 with good growth were 54.20, 61.34, and 44.03, respectively. T8 and T12 seedlings had balanced growth and strong resistance (Figure 1c). There were significant differences in the seedling survival rates of different substrates, with the highest being at 100% and the lowest at 60% (Figure 1f).

3.3. Effects of Different Substrates on the Biomass of H. chrysanthus

Biomass is an important index that reflects the material accumulation of seedlings. The variance analysis of biomass indexes such as the dry weight (aboveground, underground, and whole plant) of seedlings in various treatments showed that the difference in each index of different substrates was significant (p < 0.01; Figure 2), indicating that a different substrate had a significant impact on the quality of seedlings. Treatments T1, T15, T8, T9, and T3 ranked the highest in terms of the whole-plant dry-weight index, and their values were 14.17, 12.91, 12.54, 12.33, and 9.66 g, respectively (Figure 2a). Figure 2b shows that the R/S values of T2, T3, T11, and T15 were high. T15, T3, T1, T8, and T9 had a high seedling index and quality.

3.4. Effects of Different Substrates on the Root Indices of H. chrysanthus

As shown in Figure 3, different substrates had a significant impact on the seedling root. Treatments T1, T3, T8, T9, T10, T12, and T15 showed relatively developed roots, while T2, T4, T6, and CK yielded poor root growth. The results of the ANOVA showed that there were some differences in various indices of seedling roots of different substrates (Table 4). The total root length of T1 was the highest, followed by T15, T3, and T10, which had significantly higher root lengths compared to other treatments. Root projection and total root-surface areas were the highest in T15, followed by T3, T1, and T10. The root length per cubic centimeter of soil was the highest in T1, followed by T15, T3, and T10. Total root volume and total apical number were the highest for T15, followed by T3 and T10. In conclusion, the roots of T15 were the most developed, followed by those of T1, T3, and T10.

3.5. Effects of Different Substrates on the Photosynthesis of H. chrysanthus

Different substrate ratios had significant effects on photosynthetic parameters, such as Pn, Gs, Ci, and Tr, (Figure 4). The Pn of T13 was the highest, followed by T1, T12, and T14, with values of 5.034, 4.023, 3.573, and 3.341 μmol m−2·s−1, respectively, and the lowest was T4, followed by T2, CK, and T6, with values of 1.343, 1.371, 1.384, and 1.397 μmol m−2·s−1, respectively (Figure 4a). The Gs of T13 was the highest, followed by that of T2 and T1, at 0.060, 0.056, and 0.056 mmol m−2·s−1, respectively (Figure 4b). The Ci was the highest in T2, T6, and CK, and it was the lowest was T10, T14, T13, and T3 (Figure 4c). The Tr of T13 was the highest at 1.602 mmol m−2·s−1, followed by that of T2 and T1, which were 1.523 and 1.445 mmol m−2·s−1, respectively (Figure 4d). In short, the photosynthetic capacities of T13 and T1 were the strongest, while those of T2, T6, and CK were the weakest.

3.6. Comprehensive Evaluation of Different Substrates on the Seedlings of H. chrysanthus

A PCA was performed after standardizing 23 indices, such as growth, biomass, root system, and photosynthesis. The first three principal components were extracted, and the cumulative contribution rate was 92.533%. Among them, the contribution rate of the first principal component (PC1) was 73.586%, and it consisted of biomass and root index, and the contribution rates of the second (PC2) and third (PC3) principal components were 11.459% and 7.487%, respectively, which corresponded to photosynthesis and growth indicators. According to the results of the PCA, the relative contribution rate of variance corresponding to each PC was taken as its weight for the weighted summation, and the comprehensive evaluation model of seedlings with different mixed substrates was constructed as follows: P = 0.73586 PC1 + 0.11459 PC2 + 0.07487 PC3. According to the comprehensive evaluation (Table 5), the treatments with good seedling growth were T15, T1, and T8, while the treatments with poor seedling growth were T2, CK, and T4, which are consistent with the results of the single-index analysis.

3.7. Optimization and Analysis of Substrate Ratio

According to the results of the variance analysis (Table 6) of the regression model with Y as the dependent variable, the regression equation reached a significant level, indicating that the matrix ratio had a significant impact on the seedling quality of H. chrysanthus. As shown in Table 7, the theoretical values of each point of the regression equation were very close to the actual values, with a low error and an accuracy of more than 93%, indicating that the Scheffe regression mathematical model has a good fitting effect on the comprehensive traits and that it can be used for further analysis and optimization.
The Scheffe regression model equation of comprehensive index Y is as follows:
Y = 0.7668X1 − 1.2228X2 + 0.5228X3 − 1.0121X4 + 3.6492X1X2 + 0.0100X1X3 + 3.6397X1X4 + 0.0720X2X3 + 1.0535X2X4 + 0.0405X3X4
R2 = 0.9360,
where X1 is the content of decomposed eucalyptus bark (%), X2 is the content of coconut bark (%), X3 is the content of carbonized rice husk (%), and X4 is the content of perlite (%).
The R2 of the regression model was >0.9, indicating a good fit between the main material and Y value, and it need not be further fitted by other means, which could reflect the changed relationship between the comprehensive quality of seedlings and the ratio of the different substrates. The coefficient K of the independent variable of variance reflects the contribution degree of each variable. Equation (7) shows that K (X1) 0.7668 > K (X3) 0.5–28 > K (X4) − 1.0121 > K (X2) − 1.2228. That is, the contribution of each main material to the Y value was X1 (decomposed eucalyptus bark) > X3 (carbonized rice husk) > X4 (perlite) > X2 (coconut bran). The interaction of the mixing substrate is K (X1X2) 3.6492 > K (X1X4) 3.6397 > K (X2X4) 1.0535 > K (X2X3) 0.0720 > K (X3X4) 0.0405 > K (X1X3) 0.0100, of which X1 and X2 contribute the most, followed by X1 and X4. These results indicate that the interaction between decomposed eucalyptus bark and coconut bran and between decomposed eucalyptus bark and perlite contributed significantly, thus further indicating that the growth quality of seedlings was better with the increase of putrefied-eucalyptus-bark content. Therefore, the reasonable proportion of the four substrates had an important impact on the quality of the seedlings. Through a further regression analysis, we finally obtained the best formula (Y) conducive to the cultivation of H. chrysanthus seedlings: 0.7401 (decomposed eucalyptus bark) + 0.0309 (coconut bran) + 0.0000 (carbonized rice husk) + 0.2290 (perlite). Because of the low content of coconut bran, for the convenience of proportioning in future production, the decomposed eucalyptus bark (0.75) + perlite (0.25) = 3:1 can be used as the seedling substrate for the growth of H. chrysanthus.

4. Discussion

Seedling substrates are an important part of soilless culture techniques, which have been widely used in the modern seedling industry, owing to their high yields, good quality, and high water- and fertilizer-utilization efficiencies compared to traditional cultivation [37]. Given the current situation that the nursery stock industry of H. chrysanthus still operates via traditional mud-bag seedlings, this study used four light substrate raw materials composed of decomposed eucalyptus bark, coconut bran, carbonized rice hull, and perlite as the cultivation substrate for H. chrysanthus for the first time. The differences in growth, biomass, root, and photosynthesis were analyzed by using a simplex barycentric mixture design. The effect of different substrate proportions on seedling quality was comprehensively evaluated by using PCA, and the regression model between different substrate proportions and the comprehensive index (Y: principal component score) was established to optimize the formula for the seedling substrate.

4.1. Effects of Different Substrates on the Growth of H. chrysanthus

The quality of the matrix formula directly affects the growth and development of seedlings [38]. A good substrate ratio can provide coordinated and stable water, fertilizer, and gas for seedlings, which are necessities for the healthy growth of seedling roots [39]. In this study, the four-factor and four-order simplex center of gravity design were used to mix 15 types of substrates with four types of main materials according to volume ratio and using the flower seedling substrate commonly used in the market as the control. The results of the analysis of variance showed that physical indices such as bulk density and porosity of 16 types of substrates were significantly different (p < 0.01), indicating that the proportion of different raw materials had a significant impact on the physical properties of the seedling substrate. Therefore, it is feasible to screen and select an excellent seedling-matrix formula. Different substrates affect the survival rate of H. chrysanthus seedlings, with the highest survival rate of 100%, the lowest of 60.00%, and the average of 93.13%. Although the survival rate of seedlings in some substrates was high, the growth of the seedlings was poor. The H/D ratio reflects the balanced relationship between seedling height and coarseness, and this can be used as an index to reflect the resistance of seedlings and the survival rate of afforestation. The higher the H/D value, the higher the seedling, the weaker the resistance, and the lower the survival rate of seedling afforestation [40]. Although the seedling height and ground diameter of T1 (decomposed eucalyptus bark = 1) in this study were good, the H/D was as high as 61.83, indicating that T1 seedlings were not robust and had low resistance. It also indicates that the physical and chemical properties of a single substrate were not adequate to meet the needs of seedling growth and that it needs to be mixed with other substrates [41,42]. The chlorophyll mass fraction is an important reference index for the nutritional status of plants, and the higher the chlorophyll content, the better the photosynthesis [43]. T12 and T8 had higher chlorophyll contents. The comprehensive growth index showed that T8 (decomposed eucalyptus bark:perlite = 0.5:0.5) and T12 (decomposed eucalyptus bark:carbonized rice husk:perlite = 0.33:0.33:0.33) had the best substrate ratios, whereas T4 (perlite = 1), T2 (coconut bran = 1), and T6 (coconut bran:perlite = 0.5:0.5) had the worst ratios, indicating that decomposed eucalyptus bark is suitable for the growth of H. chrysanthus seedlings. This is probably because decomposed eucalyptus bark contains a high quantity of organic matter and trace elements, which can meet the growth requirements of container seedlings. Single substrates of coconut bran and perlite are not suitable as the nursery substrate for H. chrysanthus. Although coconut bran has a good pore structure and high water-retention capacity, its nutrient content is low, and the growth of seedlings cultivated by using it as the substrate is poor [44]. Therefore, it must be mixed with other substrate materials because they improve the overall physical and chemical properties, thus promoting the growth of seedlings and increasing their survival rate to achieve overall cultivation efficiency [45].

4.2. Effects of Different Substrates on the Biomass and Root of H. chrysanthus

The biomass of plants is an important index for the evaluation of the growth status of seedlings. The difference in the distribution of biomass in various organs is the direct embodiment of the growth strategy of plants to adapt to the environment [46,47]. The biomass of the aboveground part reflects the adaptability of the seedlings to the environment, and the biomass of the underground part reflects the nutritional growth of the seedlings [48,49]. Significant differences in the biomass of seedlings of different substrates were observed, indicating that different substrate formulations cause biomass differences. In this study, we found that the addition of decomposed eucalyptus bark contributed to the biomass accumulation of the seedlings of H. chrysanthus. The biomass value of T3 (rice husk = 1) as a single substrate was relatively high, which may be due to its higher nutritional content, which is conducive to seedling growth. Root growth and distribution are the result of the interaction between plant growth and the environment and determine the ability of plants to absorb and transmit water and nutrients [50]. Different substrate ratios have a significant effect on the root morphology of H. chrysanthus. Among them, T15 has the most developed root, followed by T1, T3, and T10, indicating that its cultivation substrate had good aeration and ability to conduct water and nutrients, which provided ideal conditions for root growth. At the same time, the underground biomass values of these treatments were higher, and the accumulation of underground biomass promoted root growth. The developed root was conducive to water storage and fertilizer conservation, which was beneficial for the growth of the whole plant. The root growth of T2, T4, T6, and CK was poor, indicating that these substrates were not suitable for the seedling growth of H. chrysanthus.

4.3. Effects of Different Substrates on the Photosynthesis of H. chrysanthus

Photosynthesis is the basis of the material and energy metabolism of seedlings, and it provides more than 95% of the dry matter required for plant growth [51]. The Pn, GS, CI, and Tr values of seedlings with different substrate ratios were significantly different. The Pn value of T13 was the highest; those of T1, T12, and T14 were relatively high; and those of T2, T4, T6, and CK were relatively low. This trend was consistent with growth and biomass indices, indicating that the growth and development of H. chrysanthus were closely related to photosynthesis. Factors such as the number of stomata, pore size, photosynthetic enzyme activity, light, and pigment content can lead to the decline of Pn [52,53]. T2, T4, T6, and CK substrate seedlings underwent accumulation of intercellular CO2 due to the reduction of CO2 utilization, resulting in the increase of Ci, and thus indicating that stomatal factors are not the main contributors to the decline of Pn. Chlorophyll is a material that absorbs light energy; it directly affects the utilization and absorption of light energy by plants [54]. The chlorophyll contents of seedlings in T2, T4, T6, and CK substrates were significantly lower than those in other treatments, indicating that insufficient chlorophyll content led to a decrease in the photosynthetic rate of seedlings.

4.4. Effects of Different Substrates on the Comprehensive Evaluation and Matrix Formula Optimization for H. chrysanthus

Many indices of seedling growth potential were measured in this study, and the advantages and disadvantages of different indices in the same substrate were different. It is difficult to reflect the growth and development status of seedlings accurately and comprehensively in each matrix combination by using a single index. Therefore, many indices were simplified into three principal components, and the seedling quality of H. chrysanthus was comprehensively evaluated by using the comprehensive evaluation model P = 0.73586 PC1 + 0.11459 PC2 + 0.07487 PC3. The results show that T1, T15, and T3 are the best treatments for seedling growth; and T2, CK, and T6 are the worst treatments, which are consistent with the results of the single index analysis for seedling quality of different matrix proportions. Using the regression analysis, we established the regression model between different matrix proportions and comprehensive indices (Y: principal component score). The results showed that the decomposed eucalyptus bark had the greatest impact on Y, and the optimal proportion of the cultivation matrix for H. chrysanthus seedlings was obtained as follows: decomposed eucalyptus bark:coconut bran:carbonized rice husk:perlite = 0.7401:0.0309:0.000:0.290. To facilitate the proportioning in future production, the decomposed eucalyptus bark (0.75) + coconut bran (0.25) can be used as the seedling substrate for the growth of H. chrysanthus.

5. Conclusions

In this study, the formulation characteristics of seedling substrates containing decomposed eucalyptus bark, coconut bran, carbonized rice husk, and other waste as peat substitute and their effects on the growth, biomass, and root photosynthesis of H. chrysanthus seedlings were analyzed. This work aimed to identify an economically and environmentally friendly seedling substrate with suitable efficiency, high accessibility, low cost, and recyclability and to provide a scientific basis for cultivating high-quality container seedlings of H. chrysanthus. The results highlighted decomposed eucalyptus bark as the ideal peat-replacement choice for the cultivation of H. chrysanthus seedlings. To facilitate proportioning in future production, decomposed eucalyptus bark (75%) with coconut bran (25%) can be used as the seedling medium for the growth of H. chrysanthus. This natural alternative to peat not only protects the environment and saves costs, but also makes use of agricultural and forestry wastes.

Author Contributions

X.S. and P.Z. conceived of and designed the experiments; P.Z. and G.Z. performed the experiments; X.S. analyzed data; P.Z. and X.S. wrote the manuscript. All authors have read and agreed to the published version of the manuscript.

Funding

This work was supported by the Guang Dong Basic and Applied Basic Research Foundation (Project Number: 2019A1515110299) and the Scientific and Technological Achievements in Forestry and Grassland National Promotion Project (Project Number: 2020133108).

Institutional Review Board Statement

Not applicable.

Informed Consent Statement

Not applicable.

Data Availability Statement

Not applicable.

Acknowledgments

We are grateful to Xiaoyu Pan and Rongqiang Chen for biomass and photosynthesis measurements.

Conflicts of Interest

The authors declare no conflict of interests.

References

  1. Alwyn, H. Bignoniaceae: Part II (Tribe Tecomeae). Flora Neotrop. Monogr. 1992, 25, 1–373. [Google Scholar] [CrossRef]
  2. Grose, S.O.; Olmstead, R.G. Evolution of a charismatic neotropical clade: Molecular phylogeny of Tabebuia S.L. Crescentieae, and allied genera (Bignoniaceae). Syst. Bot. 2007, 32, 650–659. [Google Scholar] [CrossRef]
  3. Grose, S.O.; Olmstead, R.G. Taxonomic revisions in the polyphyletic genus Tabebuia S. I. (Bignoniaceae). Syst. Bot. 2009, 32, 660–670. [Google Scholar] [CrossRef]
  4. George, W.; Derra, L.R. A Tropical Garden Flora; Bishop Museum Press: Honolulu, HI, USA, 2005. [Google Scholar]
  5. Wang, X. Botanical Garden tree species of Tabebuia chrysanthus. Guangdong For. Sci. Technol. 2007, 23, 115–116. [Google Scholar] [CrossRef]
  6. Yuan, L.L.; Wang, S.P.; Liu, N.; Zhang, Q.M.; Ren, H.; Lei, Z.X.; Pan, G.B.; Luo, J. The ecological and biological characteristics and sowing propagation techniques of Tabebuia chrysanthus. Ecol. Sci. 2014, 33, 984–990. [Google Scholar] [CrossRef]
  7. Joselin, J.; Brintha, T.S.S.; Florence, A.R.; Jeeva, S. Phytochemical evaluation of Bignoniaceae flowers. J. Chem. Pharm. Res. 2013, 5, 106–111. [Google Scholar]
  8. Cai, D.C.; Fang, L.; Shang, X.H.; Zhang, P.J. Research status and development prospects of Tabebuia. Eucalyptus Sci. Technol. 2016, 33, 46–50. [Google Scholar] [CrossRef]
  9. Pinto, J.R.; Marshall, J.D.; Dumroese, R.k.; Davis, A.S.; Cobos, D.R. Establishment and growth of container seedlings for reforestation: A function of stocktype and edaphic conditions. Forest Ecol. Manag. 2011, 261, 1876–1884. [Google Scholar] [CrossRef]
  10. South, D.B.; Harris, S.W.; Barnett, J.P.; Hainds, M.J.; Gjerstad, D.H. Effect of container type and seedling size on survival and early height growth of Pinus palustris seedlings in Alabama, U.S.A. Forest Ecol. Manag. 2005, 204, 385–398. [Google Scholar] [CrossRef]
  11. Caron, J.; Nkongolo, V.K.N. Aeration in growing media: Recent developments. Acta Hortic. 1999, 481, 545–552. [Google Scholar] [CrossRef]
  12. Fonteno, W.C. Problems & considerations in determining physical properties of horticultural substrates. Acta Hortic. 1993, 342, 197–204. [Google Scholar] [CrossRef]
  13. Raviv, M.; Wallach, R.; Silber, A.; Bar-Tal, A. Substrates and their analysis. In Hydroponic Production of Vegetables and Ornamentals; Savvas, D., Passam, H., Eds.; Embryo Publications: Athens, Greece, 2002; pp. 25–102. [Google Scholar]
  14. Bragg, N. A Review of Peat Reserves and Peat Usage in Horticulture and Alternative Materials–Report for the Horticultural Development Company (HDC); HDC: Petersfield, UK, 1990. [Google Scholar]
  15. Yamani, A.; Achmad, B. Peat soil as an alternative soil substrate and its effect on balangeran (Shorea belangeran) seedling growth. Int. J. Biosci. 2019, 14, 188–196. [Google Scholar] [CrossRef]
  16. Schmilewski, G. The Role of Peat in Assuring the Quality of Growing Media. Mires Peat 2008, 3, 2. Available online: http://www.mires-and-peat.net/pages/volumes/map03/map0302.php (accessed on 3 August 2022).
  17. Huang, B.H. Substrate optimization for plug seedlings of Tabebuia chrysanthus. J. Minnan Normal Univ. (Nat. Sci.) 2016, 94, 29–32. [Google Scholar]
  18. Alexander, P.D.; Bragg, N.C.; Meade, R.; Padelopoulos, G.; Watts, O. Peat in horticulture and conservation: The UK response to a changing world. Mires Peat 2008, 3, 8. Available online: http://www.mires-and-peat.net/pages/volumes/map03/map0308.php (accessed on 3 August 2022).
  19. Cleary, J.; Roulet, N.T.; Moore, T.R. Greenhouse gas emissions from Canadian peat extraction, 1990–2000: A life cycle analysis. Ambio 2005, 34, 456–461. [Google Scholar] [CrossRef]
  20. Silber, A.; Bar-Tal, A. Nutrition of substrate-grown plants. In Soilless Culture: Theory and Practice; Raviv, M., Lieth, J.H., Eds.; Academic Press: San Diego, CA, USA, 2008; pp. 291–339. [Google Scholar] [CrossRef]
  21. Alexander, P.D.; Bragg, N.C. Defining sustainable growing media for sustainable UK horticulture. Acta Hortic. 2014, 1034, 219–224. [Google Scholar] [CrossRef]
  22. Wood, B.W. Pecan production in North America. Southwest. Entomol. 2003, 51, 1–19. [Google Scholar]
  23. Chen, L.H.; Yang, X.M.; Raza, W.; Luo, J.; Zhang, F.G.; Shen, Q.R. Solid-state fermentation of agro-industrial wastes to produce bioorganic fertilizer for the biocontrol of Fusarium wilt of cucumber in continuously cropped soil. Bioresour. Technol. 2011, 102, 3900–3910. [Google Scholar] [CrossRef]
  24. Medina, E.; Paredes, C.; Pérez-Murcia, M.D.; Bustamante, M.A.; Moral, R. Spent mushroom substrates as component of growing media for germination and growth of horticultural plants. Bioresour. Technol. 2009, 100, 4227–4232. [Google Scholar] [CrossRef]
  25. Ostos, J.C.; López-Garrido, R.; Murillo, J.M.; López, R. Substitution of peat for municipal solid waste- and sewage sludge-based composts in nursery growing media: Effects on growth and nutrition of the native shrub Pistacia lentiscus L. Bioresour. Technol. 2008, 99, 1793–1800. [Google Scholar] [CrossRef]
  26. Teng, F.; Liu, Y.; Hu, J.W.; Sun, Q.Y.; Wan, F.F.; Yang, C.; Zhang, J. Effect of different mushroom slag compost on growth and nutrient accumulation of Pinus tabulaeformis containerized transplantings. J. Nanjing For. Univ. (Nat. Sci. Ed.) 2016, 40, 184–190. [Google Scholar] [CrossRef]
  27. He, S.M.; Zhou, P.H.; Xin, G.M.; Zhao, Q.Z.; Yang, H.; Fu, M.J. Study on the selection of tomato seedling medium based on fungus residue. Agric. Sci. J. Yanbian Univ. 2020, 42, 43–50. [Google Scholar] [CrossRef]
  28. Shang, X.H.; Xie, Y.J.; Peng, Y.; Zhang, P.J. The effect of matured compost eucalyptus-bark media on Eucalyptus seedlings. J. Cent. South Univ. For. Technol. 2011, 31, 33–38. [Google Scholar] [CrossRef]
  29. Meerow, A.W. Growth of two subtropical ornamentals using coir (coconut mesocarp pith) as a peat substitute. HortScience 1994, 29, 1484–1486. [Google Scholar] [CrossRef] [Green Version]
  30. Meerow, A.W. Growth of two tropical foliage plants using coir dust as a container medium amendment. Hortic. Technol. 1995, 5, 237–239. [Google Scholar] [CrossRef] [Green Version]
  31. Zhang, M.W. Study on the effect of new cocoon matrix and peat substrate on pakchoi cultivation. Mod. Agric. Sci. Technol. 2019, 1, 73. [Google Scholar] [CrossRef]
  32. Nicolas, J.S. Biomass utilization of rice wastes and by-products: A rapid rural appraisal in selected Philippine farming villages. Energy Sustain. Dev. 1994, 1, 30–31. [Google Scholar] [CrossRef]
  33. Petrovic, A.; Cvetkoviae, N.; Trajkovic, S.; Ibric, S.; Popadic, D.; Djuric, Z. Mixture design evaluation of drug release from matrix tablets containing carbomer and HPMC. J. Control Release 2006, 16, e104–e106. [Google Scholar] [CrossRef]
  34. Lian, Z.H. Principles and Techniques of Soilless Culture; China Agriculture Press: Beijing, China, 1994. [Google Scholar]
  35. Hou, J.W.; Dong, L.H. Evaluation of growing medium composition on marigold (Tagetes erecta L.) seedling quality. Acta Hort. 2011, 891, 237–240. [Google Scholar] [CrossRef]
  36. Wang, C.N.; Du, C.; Yang, Z.M.; Wang, H.L.; Shang, L.J.; Liu, L.L.; Yang, Z.Y.; Song, S.Y.; Amanullah, S. Study on the cultivation of seedlings using buds of potato (Solanum tuberosum L.). Peer J. 2022, 10, e13804. [Google Scholar] [CrossRef] [PubMed]
  37. Guo, S.R. Soilless Culture, 2nd ed.; China Agriculture Press: Beijing, China, 2011. [Google Scholar]
  38. Barretta, G.E.; Alexandera, P.D.; Robinsonb, J.S.; Bragg, N.C. Achieving environmentally sustainable growing media for soilless plant cultivation systems—A review. Sci. Hortic. 2016, 212, 220–234. [Google Scholar] [CrossRef] [Green Version]
  39. Landis, T.D.; Tinus, R.W.; Mcdonald, S.E. Containers and growing media//LANDIS T D. In The Container Tree Nursery Manual; Department of Agriculture: Washington, DC, USA, 1990. [Google Scholar]
  40. Liu, Y. Principles and Methodology for Seedling Quality Modification and Control; China Forestry Press: Beijing, China, 1999. [Google Scholar]
  41. Liu, L.M. Brief analysis of container seedling medium. J. South China Agric. Univ. 2015, 24, 68–69. [Google Scholar] [CrossRef]
  42. Guo, S.R. Research Progress, Current Exploitations and Developing Trends of Solid Cultivation Medium. Trans. CSAE 2005, 12, 1–4, (In Chinese with English Abstract). Available online: https://www.doc88.com/p-1955427437060.html (accessed on 10 August 2022).
  43. Guo, J. Studies on the Differences in Biological Characters of Seeds, Seedlings and Salt-Tolerance of Melia azedarach L. from Different Provenances. Master’s Thesis, Nanjing Forestry University, Nanjing, China, 2008. [Google Scholar]
  44. Sun, C.X.; Feng, M.L.; Liu, L.Y.; Chen, H.; Chen, W.J. Effects of different coir culture media on growth and physiological characteristics of watermelon seedlings. Chin. J. Trop. Agri. 2011, 31, 6–11. [Google Scholar]
  45. Liu, W.J.; Li, Z.S.; Xin, F.M. Effects of different substrates on growth and root morphology of Sophora moorcroftiana seedlings. Southwest China J. Agric. Sci. 2021, 34, 1668–1674. [Google Scholar] [CrossRef]
  46. Bonifas, K.D.; Lindquist, J.L. Predicting biomass partitioning to root versus shoot in corn and velvetleaf (Abutilon theophrasti). Weed Sci. 2006, 54, 133–137. [Google Scholar] [CrossRef] [Green Version]
  47. Wang, S.S.; Cai, J.; Liu, J.P.; Wang, D.W.; Fan, X. Effect of soil substrate and shade on the seedling components and biomass allocation of Zoysia japonica in the winter. Acta Agrestia Sin. 2016, 24, 1296–1303. [Google Scholar] [CrossRef]
  48. Rebecca, M. Relative importance of photosynthetic physiology and biomass allocation for tree seedling growth across a broad light gradient. Tree Physiol. 2004, 24, 155–167. [Google Scholar] [CrossRef] [Green Version]
  49. Tilman, D. The resource-ratio hypothesis of plant succession. Am. Nat. 1985, 125, 827–852. [Google Scholar] [CrossRef]
  50. Cahill, J.F.; Casper, B.B. Investigating the relationship between neighbor root biomass and belowground competition: Field evidence for symmetric competition belowground. Oikos 2000, 90, 311–320. [Google Scholar] [CrossRef] [Green Version]
  51. Lin, X.; Zheng, J.; Liu, H.J.; Qian, R.J.; Wang, J.W. Effects of different media on growth and leaf physiological characteristics of Ficus concinna var. subsessilis container seedlings. Sci. Silvae Sin. 2010, 46, 62–70. [Google Scholar] [CrossRef]
  52. Sheehy, J.E.; Hardy, B.; Mitchell, P.L. Redesigning rice photosynthesis to increase yield. Crop Sci. 2002, 42, 2227–2228. [Google Scholar] [CrossRef] [Green Version]
  53. Cornic, G.; Briantais, J.M. Partitioning of photosynthetic electron flow between CO2 and O2 reduction in a C3 leaf (Phaseolus vulgaris L.) at different CO2 concentrations and during drought stress. Planta 1991, 183, 178–184. [Google Scholar] [CrossRef]
  54. Filella, I.; Penuelas, J. The red edge position and shape as indicators of plant chlorophyll content, biomass and hydric status. Int. J. Remote Sens. 1994, 15, 1459–1470. [Google Scholar] [CrossRef]
Figure 1. Growth characteristics and relative chlorophyll content of H. chrysanthus with different mixed substrates: (a) height (H, cm), (b) ground diameter (D, mm), (c) height–diameter ratio (H/D), (d) branch number, (e) relative chlorophyll content (SPAD value), and (f) survival rate (%). Significant differences between treatments are indicated by different lowercase letters (Tukey’s HSD test; p < 0.05; mean ± SE).
Forests 13 01626 g001aForests 13 01626 g001b
Figure 2. Biomass of H. chrysanthus with different mixed substrates: (a) aboveground dry weight (ADW, g), underground dry weight (UDW, g), and whole-plant dry weight (WDW, g); (b) root stem ratio (R/S) and strong seedling index. Significant differences between treatments are indicated by different lowercase letters (Tukey’s HSD test; p < 0.05; mean ± SE).
Forests 13 01626 g002aForests 13 01626 g002b
Figure 3. Images of roots of H. chrysanthus that were developed in different mixed substrates. T1, T2, T3, and CK refer to the numbers of various mixed substrates.
Forests 13 01626 g003
Figure 4. Photosynthetic parameters of H. chrysanthus seedlings with different mixed substrates: (a) net photosynthetic rate (Pn, μmol m−2 s−1), (b) stomatal conductance (Gs, mmol m−2 s−1), (c) intercellular carbon dioxide concentration (Ci, μmol m−2 s−1), and (d) transpiration rate (Tr, μmol m−2 s−1). Significant differences between treatments are indicated by different lowercase letters (Tukey’s HSD test; p < 0.05; mean ± SE).
Forests 13 01626 g004
Table 1. Substrate mixture design.
TreatmentComposted
Eucalyptus Bark
Coconut BranCarbonized Rice HuskPerliteTreatmentComposted
Eucalyptus Bark
Coconut BranCarbonized Rice HuskPerlite
T11000T90.500.50
T20100T100.50.500
T30010T1100.330.330.33
T40001T120.3300.330.33
T5000.50.5T130.330.3300.33
T600.500.5T140.330.330.330
T700.50.50T150.250.250.250.25
T80.5000.5CK
Table 2. Analysis of variance of physical properties of mixed substrates.
TraitMeanSDMinMaxSkewnessKurtosisp
Bulk density0.180.120.080.571.954.13<0.000
Total porosity68.976.3556.1082.00−0.01−0.51<0.000
Aeration porosity37.9712.168.3061.250.00−0.38<0.000
Water-holding porosity30.999.9412.7058.300.450.36<0.000
Maximum water-holding capacity4.992.301.048.38−0.05−1.46<0.000
Water–air ratio1.501.010.144.521.492.07<0.000
Table 3. Physical characteristics of H. chrysanthus in different mixed substrates.
TreatmentBulk
Density
(g/cm−3)
Total
Porosity
(%)
Aeration
Porosity
(%)
Water-Holding
Porosity
(%)
Maximum Water
-Holding Capacity
Water–Air
Ratio
T10.11 ± 0.01266.17 ± 1.53143.80 ± 1.27722.37 ± 0.7575.81 ± 0.6271.96 ± 0.085
T20.56 ± 0.01262.54 ± 3.68523.79 ± 4.19438.75 ± 0.5461.11 ± 0.0820.62 ± 0.115
T30.09 ± 0.00673.07 ± 2.5759.37 ± 1.73913.70 ± 0.9177.70 ± 0.4784.34 ± 0.191
T40.11 ± 0.00669.63 ± 3.52515.77 ± 6.46953.87 ± 4.6096.63 ± 0.2950.30 ± 0.140
T50.08 ± 0.00668.6 ± 1.38626.03 ± 1.15542.57 ± 0.2318.27 ± 0.1730.61 ± 0.029
T60.10 ± 0.01065.73 ± 4.19626.47 ± 2.98739.27 ± 2.5586.58 ± 0.7970.67 ± 0.086
T70.09 ± 0.01069.03 ± 2.13940.73 ± 2.06528.30 ± 0.3617.67 ± 0.6441.44 ± 0.075
T80.11 ± 0.00673.13 ± 5.18742.27 ± 4.64930.87 ± 0.7236.90 ± 0.4151.37 ± 0.127
T90.22 ± 0.02557.43 ± 1.35030.10 ± 1.31127.33 ± 2.4012.67 ± 0.3561.11 ± 0.137
T100.29 ± 0.03163.34 ± 1.75240.33 ± 0.72223.00 ± 2.4152.21 ± 0.1821.77 ± 0.208
T110.27 ± 0.01072.17 ± 1.01053.71 ± 1.73618.46 ± 0.7302.68 ± 0.0822.92 ± 0.215
T120.10 ± 0.00071.23 ± 3.36236.37 ± 2.56634.87 ± 1.0027.22 ± 0.2721.04 ± 0.056
T130.22 ± 0.01276.00 ± 3.80340.75 ± 5.51735.25 ± 2.3793.54 ± 0.2361.16 ± 0.221
T140.23 ± 0.00677.00 ± 5.13043.29 ± 5.15633.71 ± 1.2793.41 ± 0.3201.29 ± 0.171
T150.22 ± 0.01077.46 ± 3.74154.67 ± 5.7222.79 ± 2.1973.52 ± 0.0972.43 ± 0.493
CK0.16 ± 0.01560.93 ± 1.45730.13 ± 2.01130.80 ± 1.9923.92 ± 0.4290.98 ± 0.127
Table 4. Statistical analysis of root morphological traits of H. chrysanthus with different mixed substrates. RL, root length; PA, projected area; SA, surface area; AD, average diameter; VS, length per cubic centimeter; RV, root volume; NTips, root tip number.
TreatmentRL (cm)PA (cm2)SA (cm2)AD (mm)VS (cm/m3)RV (cm3)NTips
T14549.73 a371.26 a1166.33 a1.63 ab4549.73 a23.98 abc8574.00 ab
T2477.30 c37.46 c117.69 c0.81 b477.30 c2.33 e1307.00 c
T33864.07 a375.42 a1179.42 a1.94 a3864.07 a28.90 ab9445.33 a
T4409.86 c62.01 c194.81 c1.43 ab409.86 c7.96 de1888.00 c
T51633.65 bc162.80 bc511.44 bc1.01 ab1633.65 bc12.76 cde4572.67 bc
T6833.46 c70.84 c222.56 c0.84 b833.46 c4.76 e2261.67 c
T71736.59 bc150.48 bc472.75 bc0.88 b1736.59 bc10.62 de4503.00 bc
T83001.88 ab330.54 a1038.41 a1.48 ab3001.88 ab28.62 ab7459.00 ab
T93494.05 ab328.40 a1031.71 a1.56 ab3494.05 ab24.48 abc8356.67 ab
T103835.65 a360.47 a1132.46 a1.57 ab3835.65 a27.10 ab9406.67 a
T111841.35 bc176.76 bc555.30 bc0.96 ab1841.35 bc13.49 cde5702.67 abc
T123356.07 ab318.97 a1002.09 a1.59 ab3356.07 ab24.59 abc8693.33 ab
T133188.09 ab270.94 ab851.18 ab1.13 ab3188.09 ab18.18 bcd9012.67 ab
T143554.03 ab301.01 a945.64 a1.11 ab3554.03 ab20.22 abcd8730.67 ab
T154261.76 a417.87 a1312.78 a1.64 ab4261.76 a32.45 a10475.67 a
CK751.04 c55.57 c174.59 c0.74 b751.04 c3.25 e2441.67 c
Note: Different lowercase letters after data in the same column represent significant differences between them (p < 0.05).
Table 5. Comprehensive scores of principal components (PC) of H. chrysanthus with different mixed substrates.
TreatmentPC1PC2PC3Comprehensive
Assessment p
Sequence
T11.117371.13470−0.128260.820982
T2−1.594050.363350.17058−1.1724716
T30.80811−0.473422.458830.584685
T4−1.28365−0.873300.91704−0.9514514
T5−0.507530.266700.54267−0.3722310
T6−1.284080.08469−0.56264−0.9453113
T7−0.58905−0.54412−1.09420−0.4283611
T80.925610.07797−0.847520.680553
T90.70705−1.69929−1.039930.535446
T100.83394−0.74261−0.826260.618924
T11−0.644230.246511.12319−0.4716912
T120.692110.53705−0.562170.506717
T130.453352.656690.157590.337199
T140.474840.20960−0.790750.348008
T151.22437−1.146021.087400.890281
CK−1.33416−0.09848−0.60556−0.9812415
Table 6. Analysis of variance of the regression equation.
SourceSum of SquaresDfMean SquareF Valuep-Value
Model6.633190.73708.12280.0164
Error0.453750.0907
Total7.088814
Table 7. Observed and predicted values of the comprehensive evaluation index.
TreatmentObserved ValueFitting ValueFitting ErrorTreatmentObserved ValueFitting ValueFitting Error
T10.82100.76680.0542T90.53540.6473−0.1118
T2−1.1725−1.22280.0503T100.61890.6843−0.0654
T30.58470.52280.0619T11−0.4717−0.4411−0.0306
T4−0.9515−1.01210.0606T120.50670.50240.0043
T5−0.3722−0.2345−0.1377T130.33720.4374−0.1003
T6−0.9453−0.8541−0.0912T140.34800.4368−0.0888
T7−0.4284−0.3320−0.0964T150.89030.29270.5975
T80.68060.7873−0.1067
Publisher’s Note: MDPI stays neutral with regard to jurisdictional claims in published maps and institutional affiliations.

