Article

Spatiotemporal Changes in Leaf Area and Carbon Sequestration of Terrestrial Vegetation in China over the Last Two Decades

1
College of Surveying and Geo-Informatics, North China University of Water Resources and Electric Power, Zhengzhou 450046, China
2
Key Laboratory of Soil and Water Conservation on the Loess Plateau of Ministry of Water Resources, Yellow River Institute of Hydraulic Research, Yellow River Conservancy Commission, Zhengzhou 450003, China
3
Henan Key Laboratory of Ecological Environment Protection and Restoration of the Yellow River Basin, Zhengzhou 450003, China
4
School of Geological Engineering and Geomatics, Chang’an University, Xi’an 710054, China
5
Yellow River Conservancy Technical Institute, Kaifeng 475004, China
*
Author to whom correspondence should be addressed.
Forests 2022, 13(10), 1623; https://doi.org/10.3390/f13101623
Submission received: 3 July 2022 / Revised: 20 September 2022 / Accepted: 30 September 2022 / Published: 3 October 2022
(This article belongs to the Special Issue Advances in Monitoring and Assessment of Forest Carbon Storage)

Abstract

:
Spatio-temporal change characteristic in leaf area index (LAI), gross primary productivity (GPP), total leaf area and total carbon sequestration of terrestrial vegetation at different geographic regions, provinces and land cover change types over China during 2000–2018 were clarified, respectively. The net increase in total leaf area and carbon sequestration over China from 2000 to 2018 is 1.7491 × 10⁶ km2 and 1957.36 TgC, and Southwestern part contributes the most with a contribution of 25.3% for leaf area and 20.1% for carbon sequestration, respectively. The overall contribution of northern provinces to enhanced carbon sequestration capacity is greater than that of southern provinces, with a maximum for Inner Mongolia, even though southern provinces have a much higher leaf area increase. The annual increase rates of LAI and GPP in returning cropland to forest–grassland and artificial restoration of forest–grassland are higher than that of self-rehabilitation of rapid growth stage for planted young vegetation. However, due to self-rehabilitation of forest–grassland has the largest area percentage of 59%, it contributes the most to the increases of leaf area and carbon sequestration among different land cover change types, except for northeastern China, where improved farmland productivity is a dominant factor. It should be noted that the leaf area and carbon sequestration exhibit upward trends in urbanized areas over China. whereas slight increasing and even negative trends are also observed in southwestern, southern, and eastern China (e.g., Shanghai), where artificial surface construction occupied more cropland during urbanization processing. Compared with climatic factors, LAI is the dominant factor influencing GPP increases over China since 2000, and gradually weakened coupling relationship between LAI and GPP is observed from north to south. For climatic factors, GPP is dominantly affected by precipitation in northern parts and by solar radiation in southern parts.

1. Introduction

Terrestrial plants fix carbon dioxide into the total amount of organic compounds through photosynthesis, which is called the total vegetation primary productivity or gross primary productivity (GPP). Terrestrial ecosystems are the largest carbon sink and the basis of food, fiber, and wood production [1]. The blade is an important medium for carbon sequestration in the atmosphere and on land. The terrestrial carbon sequestration capacity depends primarily on vegetation type, coverage, leaf area, and abundance. Leaf area index (LAI) is defined as the total leaf surface area per unit area. It is related to climate and plant function types and reflects the growth status of vegetation in the natural environment. LAI is sensitive to fertility, tree age, and management and is an important vegetation structure parameter [2]. Long-term monitoring of LAI and GPP can provide reference on the growth status of vegetation and the fixation capacity of the organic carbon in the natural environment in a study area.
Regarding the methods of monitoring ecosystems, field sampling is a more accurate ecological detection method. Through in-depth field investigations, the regional and national ecological parameters can be better estimated [3]. The eddy covariance (EC) technique provides the CO2 flux within a few kilometers of the flux tower. It is the best method for continuous measurement of the net ecosystem exchange, which can be used to calculate the GPP by subtracting the simulated ecosystem respiration components [4,5]. The rapid development of remote sensing techniques has resulted in the ability to obtain continuous and consistent observations of large areas of vegetation, which has facilitated their broad application in monitoring and predicting vegetation dynamics [6,7]. Multiple long-term vegetation remote sensing products have been developed using different methods, for example, the Advanced Very High Resolution Radiometer (AVHRR) series [8], Global Land Surface Satellite (GLASS) series [9], and Moderate Resolution Imaging Spectroradiometer (MODIS) series [10]. These remote sensing products can represent the spatiotemporal variation characteristics of vegetation well and have become an important tool for studying the human living environment and the Earth.
China has a diverse ecological composition with a complex relationship between man and land [11]. Since the 2000s, to cope with the loss and degradation of natural ecosystems and strengthen the construction of ecological civilization, several large-scale ecosystem restoration projects have been implemented in China [12,13]. Moreover, China has set the goal of reaching its carbon peak by 2030 and becoming carbon neutral by 2060. Therefore, in the field of sustainable development, the clarification of the ecological change pattern of the related system services has become an important issue in addition to achieving carbon neutrality and carbon peak on schedule.
In recent years, scholars have extensively researched the spatio-temporal variation characteristics of LAI and GPP and their influencing factors. Hu et al. show that LAI in China’s Three Norths region has increased significantly in recent years [14]. Ding et al. found that urban expansion in southwestern China partially offset afforestation-driven GPP growth [15]. Hu et al. found that the project of returning cropland to forest–grassland has enabled southern China to achieve carbon benefits [16]. However, these studies in China have mostly focused on a certain region, and the contribution of different regions and provinces to changes in LAI and GPP at the national level has not been reported.
The results of previous research show that changes in vegetation structure and function are mainly affected by two aspects: human activities [17] and climate change [18]. By changing the land surface conditions, people have achieved comprehensive management of various factors, including forests, water bodies, and roads; this has not only led to visual changes in the land microenvironment but also caused differences in the contribution of LUCC to the growth of the carbon sink [19,20]. For example, net gains in carbon stocks can be realized by moving from low biomass land use systems (e.g., grasslands, agricultural parks, and shrublands) to tree-based systems [21]. Therefore, land cover type changes significantly impact terrestrial ecosystems, whereas the analysis of the contribution of LAI and GPP changes in different land cover change areas to the whole country is currently less. In addition, temperature (TEMP), precipitation (PRCP), and solar radiation (SR) also play an important role in influencing the carbon sequestration of ecosystems by altering surface conditions and hydrological cycles [22]. However, previous studies mostly focused on a given geographic region; hence the insights into the correlation between GPP and LAI, TEMP, PRCP, and SR in different regions and land cover change types are limited.
Therefore, the goals of this study were (1) to clarify the spatiotemporal patterns of the LAI, GPP, and LUCCs in China from 2000 to 2018, (2) to explore the contributions of partial changes in LAI and GPP in different regions, provinces and land cover change types to total changes in LAI and GPP over China, respectively, (3) to compare the partial correlation between GPP and LAI, TEMP, PRCP, and SR in different regions and land cover change types, respectively.

2. Materials and Methods
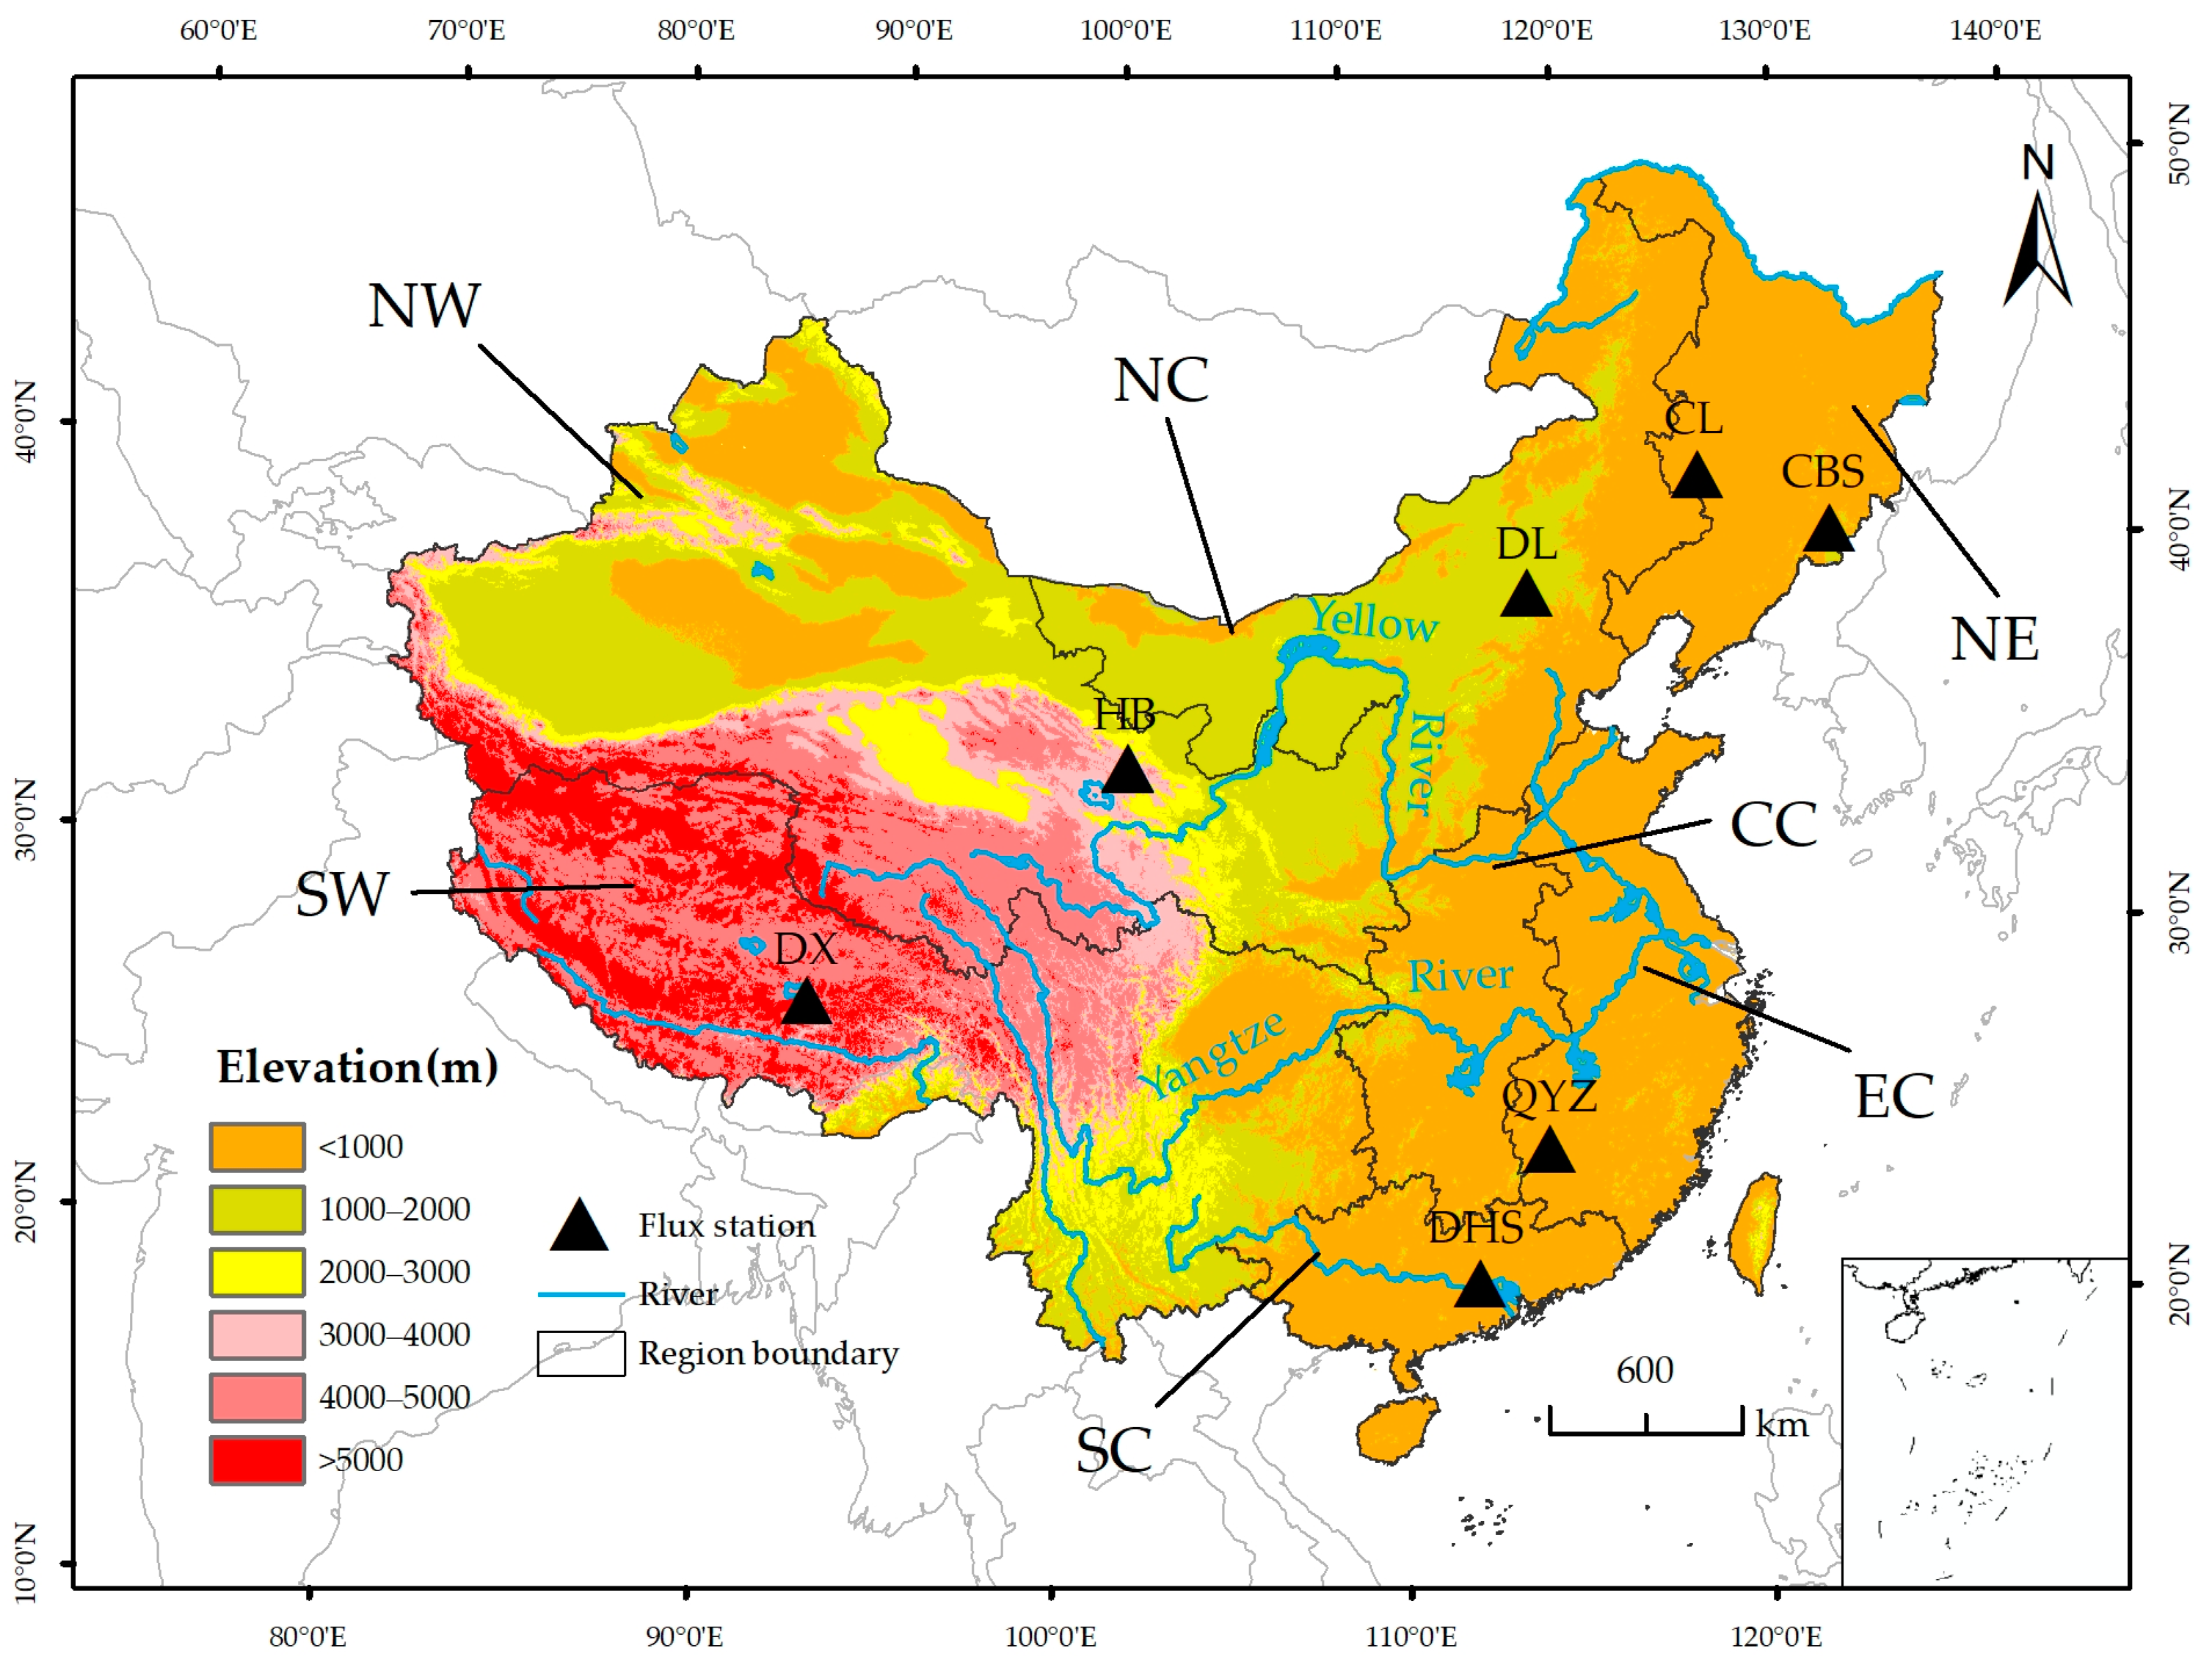
2.1. Study Area

China is characterized by complex and diverse terrain, various land use types, and a range of climates and ecosystems. Mountains, plateaus, and hills account for about 67% of the land area, while the basins and plains account for only about 33% of the land area [23]. The Qinling-Huaihe Line geographically divides China into southern and northern sections, which have pronounced differences in natural conditions, farming practices, and habitats. The annual precipitation in China gradually decreases from more than 2000 mm·yr−1 along the southeast coast to less than 100 mm·yr−1 in the northwest inland area. A series of ecological restoration projects were implemented in different regions during the last few decades to improve the ecological environment, especially in northern China. These projects significantly affected the vegetation type and growth conditions, ultimately leading to geographical zonation of the leaf area and carbon sequestration of the terrestrial vegetation across China. To demonstrate the spatial heterogeneity of the vegetation dynamics, we divided China into seven regions: northeastern China (NE), northern China (NC), northwestern China (NW), central China (CC), eastern China (EC), southwestern China (SW), and southern China (SC) (Figure 1).

2.2. Data and Pre-Processing

The data information used in this article is shown in Table 1. The LAI time-series data, with a spatial resolution of 500 m and temporal resolution of 8 days, from 2000 to 2018 were accessed from the GLASS product [24] (http://glass-product.bnu.edu.cn/) on 20 October 2021, which has been validated using a large number of in-situ observations and has been successfully applied in eco-hydrological research around the world [25]. The 8-day GPP time series from 2000 to 2018 was obtained from the Penman-Monteith-Leuning (PML_V2) product, with the same resolution as the LAI data [26] (https://data.tpdc.ac.cn). This product has been proven to be noticeably better than most globe GPP products through comparison with field observations from flux stations [27] throughout the world. The land use data for 2000 and 2020 were obtained from the GlobeLand30 maps (30 m) produced by the National Geomatics Centers of China (http://www.globallandcover.com), accessed on 8 January 2022. The land cover in 2020 was regarded as that in 2018 to match the period of the LAI and GPP data. While there was a small time difference between 2018 and 2020, the land cover was nearly temporally stable during this short period. The GlobeLand30 consists of forest, shrubland, grassland, cropland, tundra, water bodies, wetlands, artificial surfaces, bare land, and permanent snow and ice. In this study, the tundra category was merged with the grassland category, and we further combined the water body, wetlands, and permanent snow and ice categories into a new category. Then, we obtained the hourly TEMP, PRCP, and SR at a 0.25° resolution from the ERA5 reanalysis product for 2000–2018 (https://cds.climate.copernicus.eu), accessed on 2 May 2022. All of the time-series datasets for the LAI, GPP, and climate variables were temporally aggregated at the annual scale for use in the subsequent analysis.
We collected carbon flux observation data from eight flux stations of the FLUXNET2015 Observation and Research Network (https://fluxnet.org/) to evaluate the accuracies of the GPP estimates of the PML_V2 product across China on the 8-day and annual scales. The flux stations used in this study are listed in Table 2.

2.3. Methods

2.3.1. Overall Methodology

The overall flow scheme of this paper is shown in Figure 2. It includes the following main steps: (1) Resampling the GlobeLand30 and ERA−5 data to 500 m using a majority filter and bilinear interpolation in ArcGIS, respectively; (2) Exploring the average annual trend of GPP and LAI using the linear regression equation; (3) Quantifying each land type change using a transfer matrix; (4) Discussing the net changes of LAI and GPP in regions and provinces; (5) Using the partial correlation equation to analyze the correlation pattern of the correlation GPP and the other variables.

2.3.2. Accuracy Assessment of PML_V2 GPP

While the PML_V2 product has been validated at the global scale in previous studies [28,29], we further assessed the overall accuracies of the GPP estimates on the 8-day and annual scales using daily GPP observations from six flux stations in China to demonstrate its reliability and the acceptability of its use in the subsequent analysis. The accuracy metrics used were the determination coefficient (R2), the root mean square error (RMSE), and the mean relative error (MRE) [30].

2.3.3. Trend Analysis

The slope of the linear regression model was used to characterize the annual rates of change of the LAI and GPP from 2000 to 2018. The calculation formula is as follows:
S l o p e = n × i = 1 n i × X i i = 1 n i i = 1 n X i n × i = 1 n i 2 ( i = 1 n i ) 2 ,
where i denotes the year, varying from 1 to 19; Xi is the mean LAI or GPP value in the ith year; and n is 19, representing the total number of years. Slope is the rate of change of the LAI or GPP. When slope > 0, X is increasing; when slope < 0, X is decreasing.
Then, we used the t-test to examine the statistical significance of the annual change trends of the LAI and GPP. p-value < 0.05 indicates that the interannual trend is considered statistically significant.

2.3.4. Net Change in Total Leaf Area and Carbon Sequestration

The trends in the annual average LAI and GPP were considered to be linear when we calculated the net changes in the leaf area and carbon sequestration during 2000–2018. The net changes in the leaf area and carbon sequestration in a specific region should consider the effect of the statistical significance level, and the areas with statistically insignificant trends should be set to a contribution of zero.
Δ t o t a l = i = 1 n T r i A i N y r ,
where Δ t o t a l is the net change in the total leaf area and carbon sequestration, i represents a pixel with a statistically significant trend, n is the total number of such pixels in the region, T r i is the linear slope of a pixel, A i is the area of a pixel varying with latitude, and N y r is the length of the study period, which was set to 19.

2.3.5. Land Cover Change Patterns Derived from the Transition Matrix

According to the land cover data for 2000 and 2020, a transition matrix was developed to analyze the areas of mutual conversion between the seven different land cover types:
S i j = S 11 S 12 S 1 n S 21 S 22 S 2 n S n 1 S n 2 S n n ,
where, S i j is the area in which land cover type i was converted to type j during the study period, and n is the total number of land cover types, which was set to seven in this study.
For the 49 land cover change types, we then reclassified these change types into six main categories. Urbanization (artificial surface converted from other types), returning cropland to forest–grassland (cropland was converted into forest and grassland), artificial restoration of forest–grassland (non-cropland was converted into forest and grassland), self-rehabilitation of forest-grassland (unchanged forest, shrubland, grassland, and bare land), cropland maintenance (unchanged cropland), and cropland reclamation (other land use types were converted into cropland).

2.3.6. Partial Correlation Analysis

A partial correlation analysis was conducted to explore the effects of the LAI, TEMP, PRCP, and SR on the GPP. This method measures the strength and direction of a linear relationship between two variables when the effect of one or more other variables is controlled. In this way, the individual roles of the influencing factors in the GPP dynamics can be determined. The partial correlation coefficient was calculated as follows:
r i , j l 1 l 2 l n = r i , j l 1 l 2 l n 1 r i , l n l 1 l 2 l n 1 r j , l n l 1 l 2 l n 1 ( 1 r i , l n l 1 l 2 l n 1 2 ) ( 1 r j , l n l 1 l 2 l n 1 2 ) ,
where r i , j · l 1 l 2 l n is the nth (n = k − 2) order partial correlation coefficient between i and j when l 1 , l 2 , l n are controlled, and k is the total number of variables. r i , l n · l 1 l 2 l n 1 2 and r j , l n · l 1 l 2 l n 1 2 are the (n−1)th order partial correlation coefficients. When r i , j · l 1 l 2 l n > 0, the correlation between i and j is positive, and vice versa.
We also examined the significance of this correlation by performing hypothesis testing.
t = m k 2 r i , j l 1 l 2 l n 1 r i , j l 1 l 2 l n 2 ,
where t is the t-test value; and m is the sample size (here m = 19). When t < 0.05, the partial correlation is statistically significant at the 95% significance level.

3. Results

3.1. Accuracies of PML-V2 GPP Estimates

The observations from eight flux stations (Figure 3) were compared with the average GPP estimates within 3 × 3 neighboring pixels centered at the geographical locations of the flux stations. As can be seen from Figure 3a, the R2, RMSE, and MRE values of the GPP estimates on the 8-day scale were calculated to be 0.89, 7.92, and 11.35%, respectively. It can also be seen from Figure 3b that the R2, RMSE, and MRE values of the GPP estimates on the annual scale were 0.92, 161.93, and 10.37%, respectively. The validation results for both the 8-day and annual scales indicate that the PML_V2 GPP estimates generally performed well in China and are a reliable data resource for exploring the spatiotemporal changes in the GPP across China.

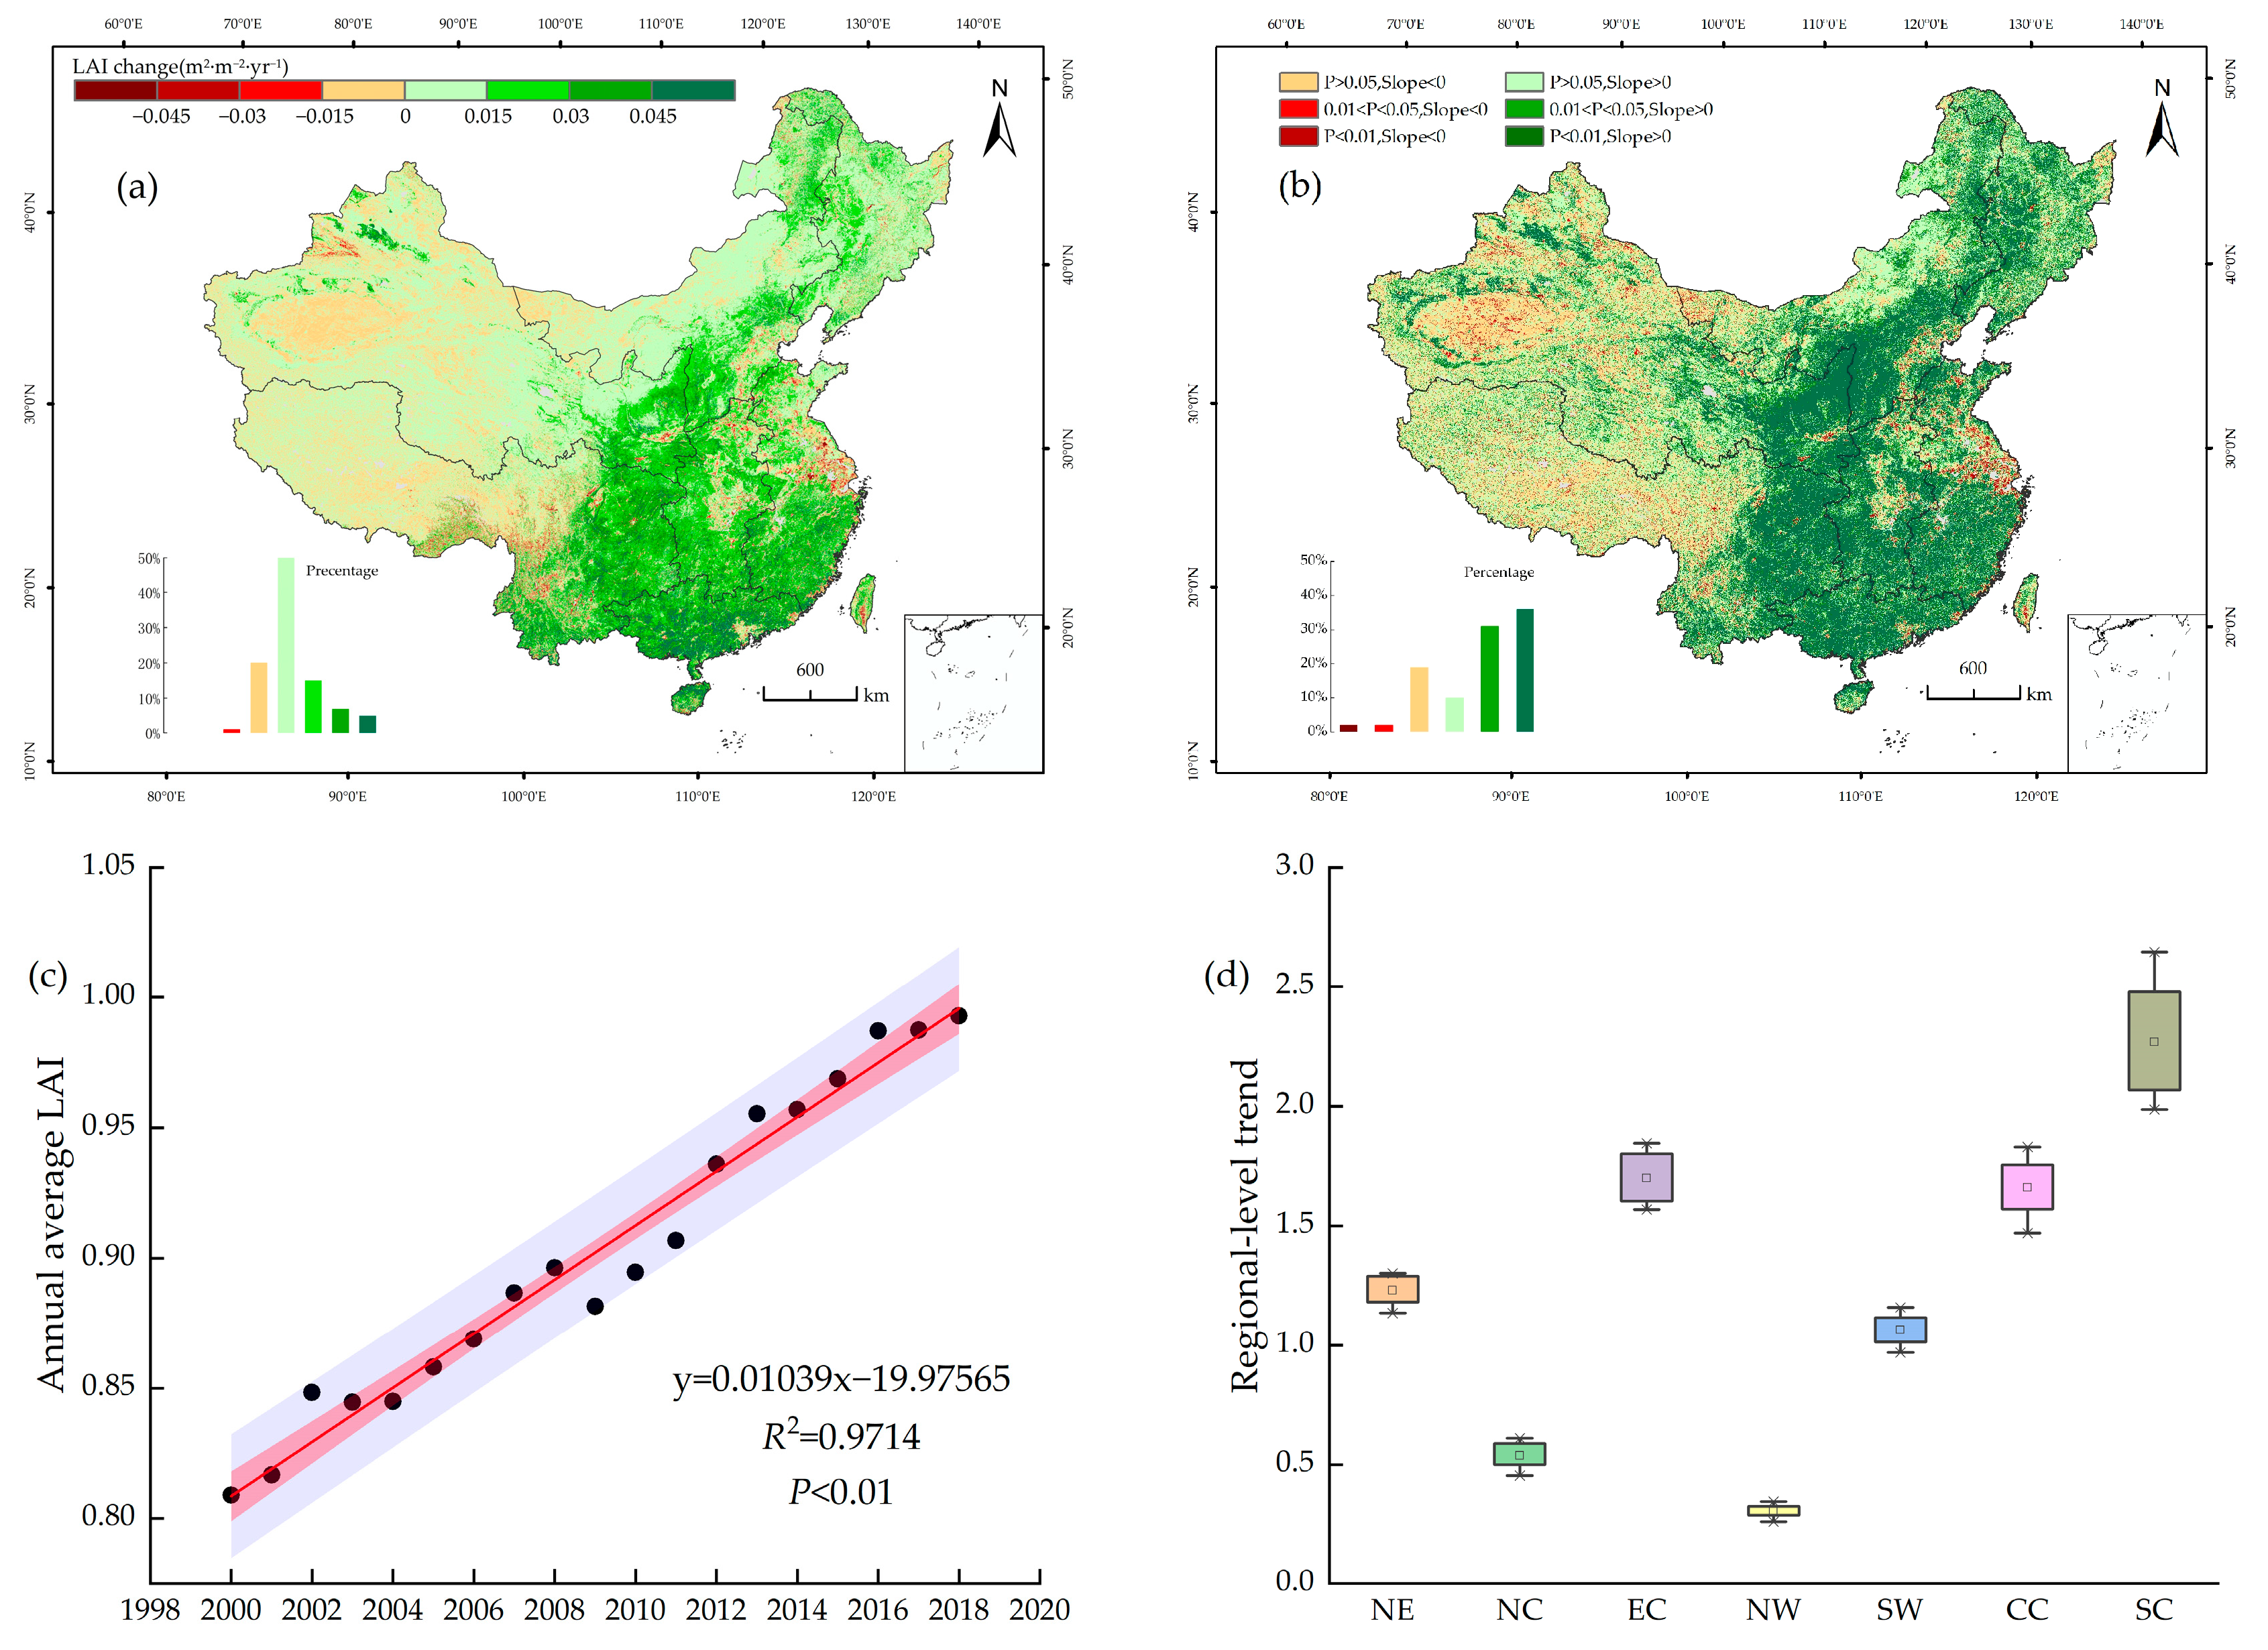
3.2. Spatiotemporal Changes in Leaf Area

Figure 4a shows the spatial pattern of the changes in the annual mean LAI, which is characterized by an obvious spatial gradient from southeast to northwest, with the maximum area percentage of the LAI change rate ranging from 0 to 0.015 m2·m−2·yr−1. The area in which a significant increase (p > 0.05 and Slope > 0) in the LAI occurred accounted for 31.59% of China, and there were extremely significant increasing trends (p < 0.01 and Slope > 0) in 35.79% of the country. Whereas the LAI significantly decreased in only 3.59% of the land area, these areas were mainly distributed in northwestern and eastern China (Figure 4b). The overall change in the annual average LAI in China during 2000–2018 was 0.01 m2·m−2·yr−1 (Figure 4c). According to the explicit statistics of the changes in the LAI in the different regions (Figure 4d), the overall changes in the LAI in the different regions were ranked as follows: SC > EC > CC > NE > SW > NC > NW.
The net changes in the total leaf area from 2000 to 2018 in each province and each region were calculated (Figure 5). For the entirety of China, the total leaf area change during 2000–2018 was 174.91 × 10⁴ km2, among which Guangxi, Yunnan, and Sichuan had net leaf area increases of 16.11 × 10⁴ km2, 14.46 × 10⁴ km2, and 13.35 × 10⁴ km2, contributing 9.21%, 8.26%, and 7.63% to the increase in the total leaf area in China, respectively. The decrease in the leaf area was only observed in Shanghai. The magnitudes of the increases in the total leaf area in the seven different regions exhibited the following order: SW > SC > NW > NC > EC > CC > NE. Thus, the SW contributed the most to the increase in the total leaf area in China, with a total area of 44.27 × 10⁴ km2 and a contribution of 25.31%. It should be noted that the magnitudes of the increases in the total leaf area in NE and NW were greater than those in EC and CC, which may be due to the intensive ecological restoration projects implemented in the Three-North area of China.

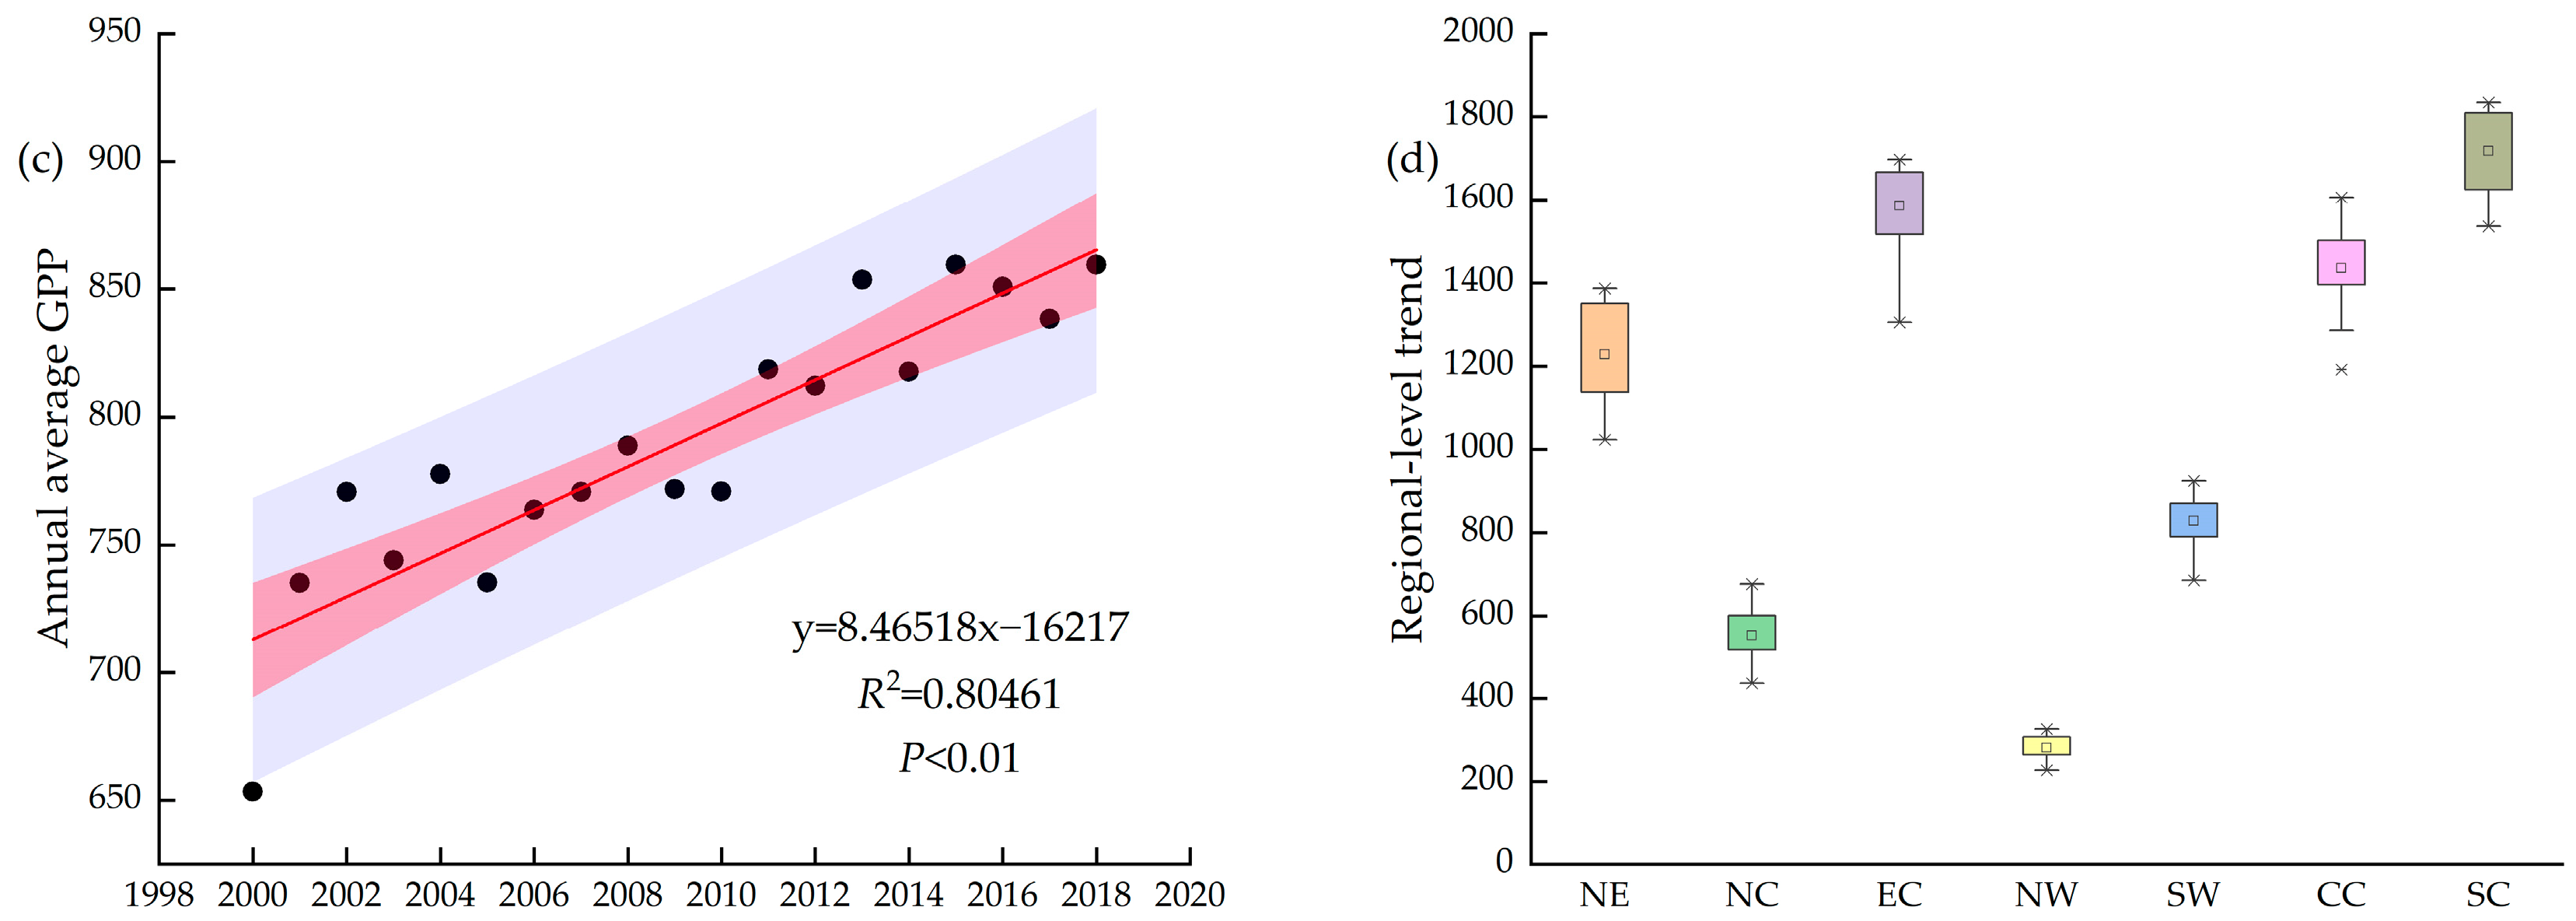
3.3. Spatiotemporal Changes in Carbon Sequestration

Figure 6a shows the spatial pattern of the changes in the annual GPP. The maximum area percentage of the rate of change of the GPP was 0 to 15 gc·m−2·yr−1. The area with a significant increasing GPP trend (p > 0.05 and Slope > 0) accounted for 31.47% of China, and there were extremely significant increasing trends (p < 0.01 and Slope > 0) in 41.62% of the country, mainly in the Three-North region. Nevertheless, the GPP significantly decreased in 2.36% of the land area, mainly in the urban areas (Figure 6b). The overall change in the annual GPP in China during 2000–2018 was 8.46 gc·m−2·yr−1 (Figure 6c). According to the explicit statistics of the GPP changes in the different regions (Figure 6d), the overall GPP changes in the different regions were ranked as follows: SC > EC > CC > NE > SW > NC > NW, which is consistent with the spatial pattern of the changes in the LAI.
The net changes in the total carbon sequestration from 2000 to 2018 in each province and each region were calculated (Figure 7). For the entirety of China, the total amount of carbon sequestration during 2000–2018 was 1957.36 TgC, among which Inner Mongolia, Heilongjiang, and Yunnan had net carbon sequestrations of 221.85 TgC, 166.14 TgC, and 169.22 TgC, contributing 11.33%, 8.49%, and 8.65% to the total carbon sequestration in China, respectively. The terrestrial vegetation carbon sequestration only decreased in Shanghai. The magnitudes of the total carbon sequestration in terrestrial vegetation in the seven different regions exhibited the following order: SW > NC > EC > NW > NE > CC > SC. It can be concluded that SW contributed the most to the increase in the total carbon sequestration in vegetation in China, with a total area of 393.79 TgC and a contribution rate of 20.12%. It should be noted that SC contributed the least (129.94 TgC) to the total carbon sequestration, even though the contribution of SC to the increase of the total leaf area was prominent.

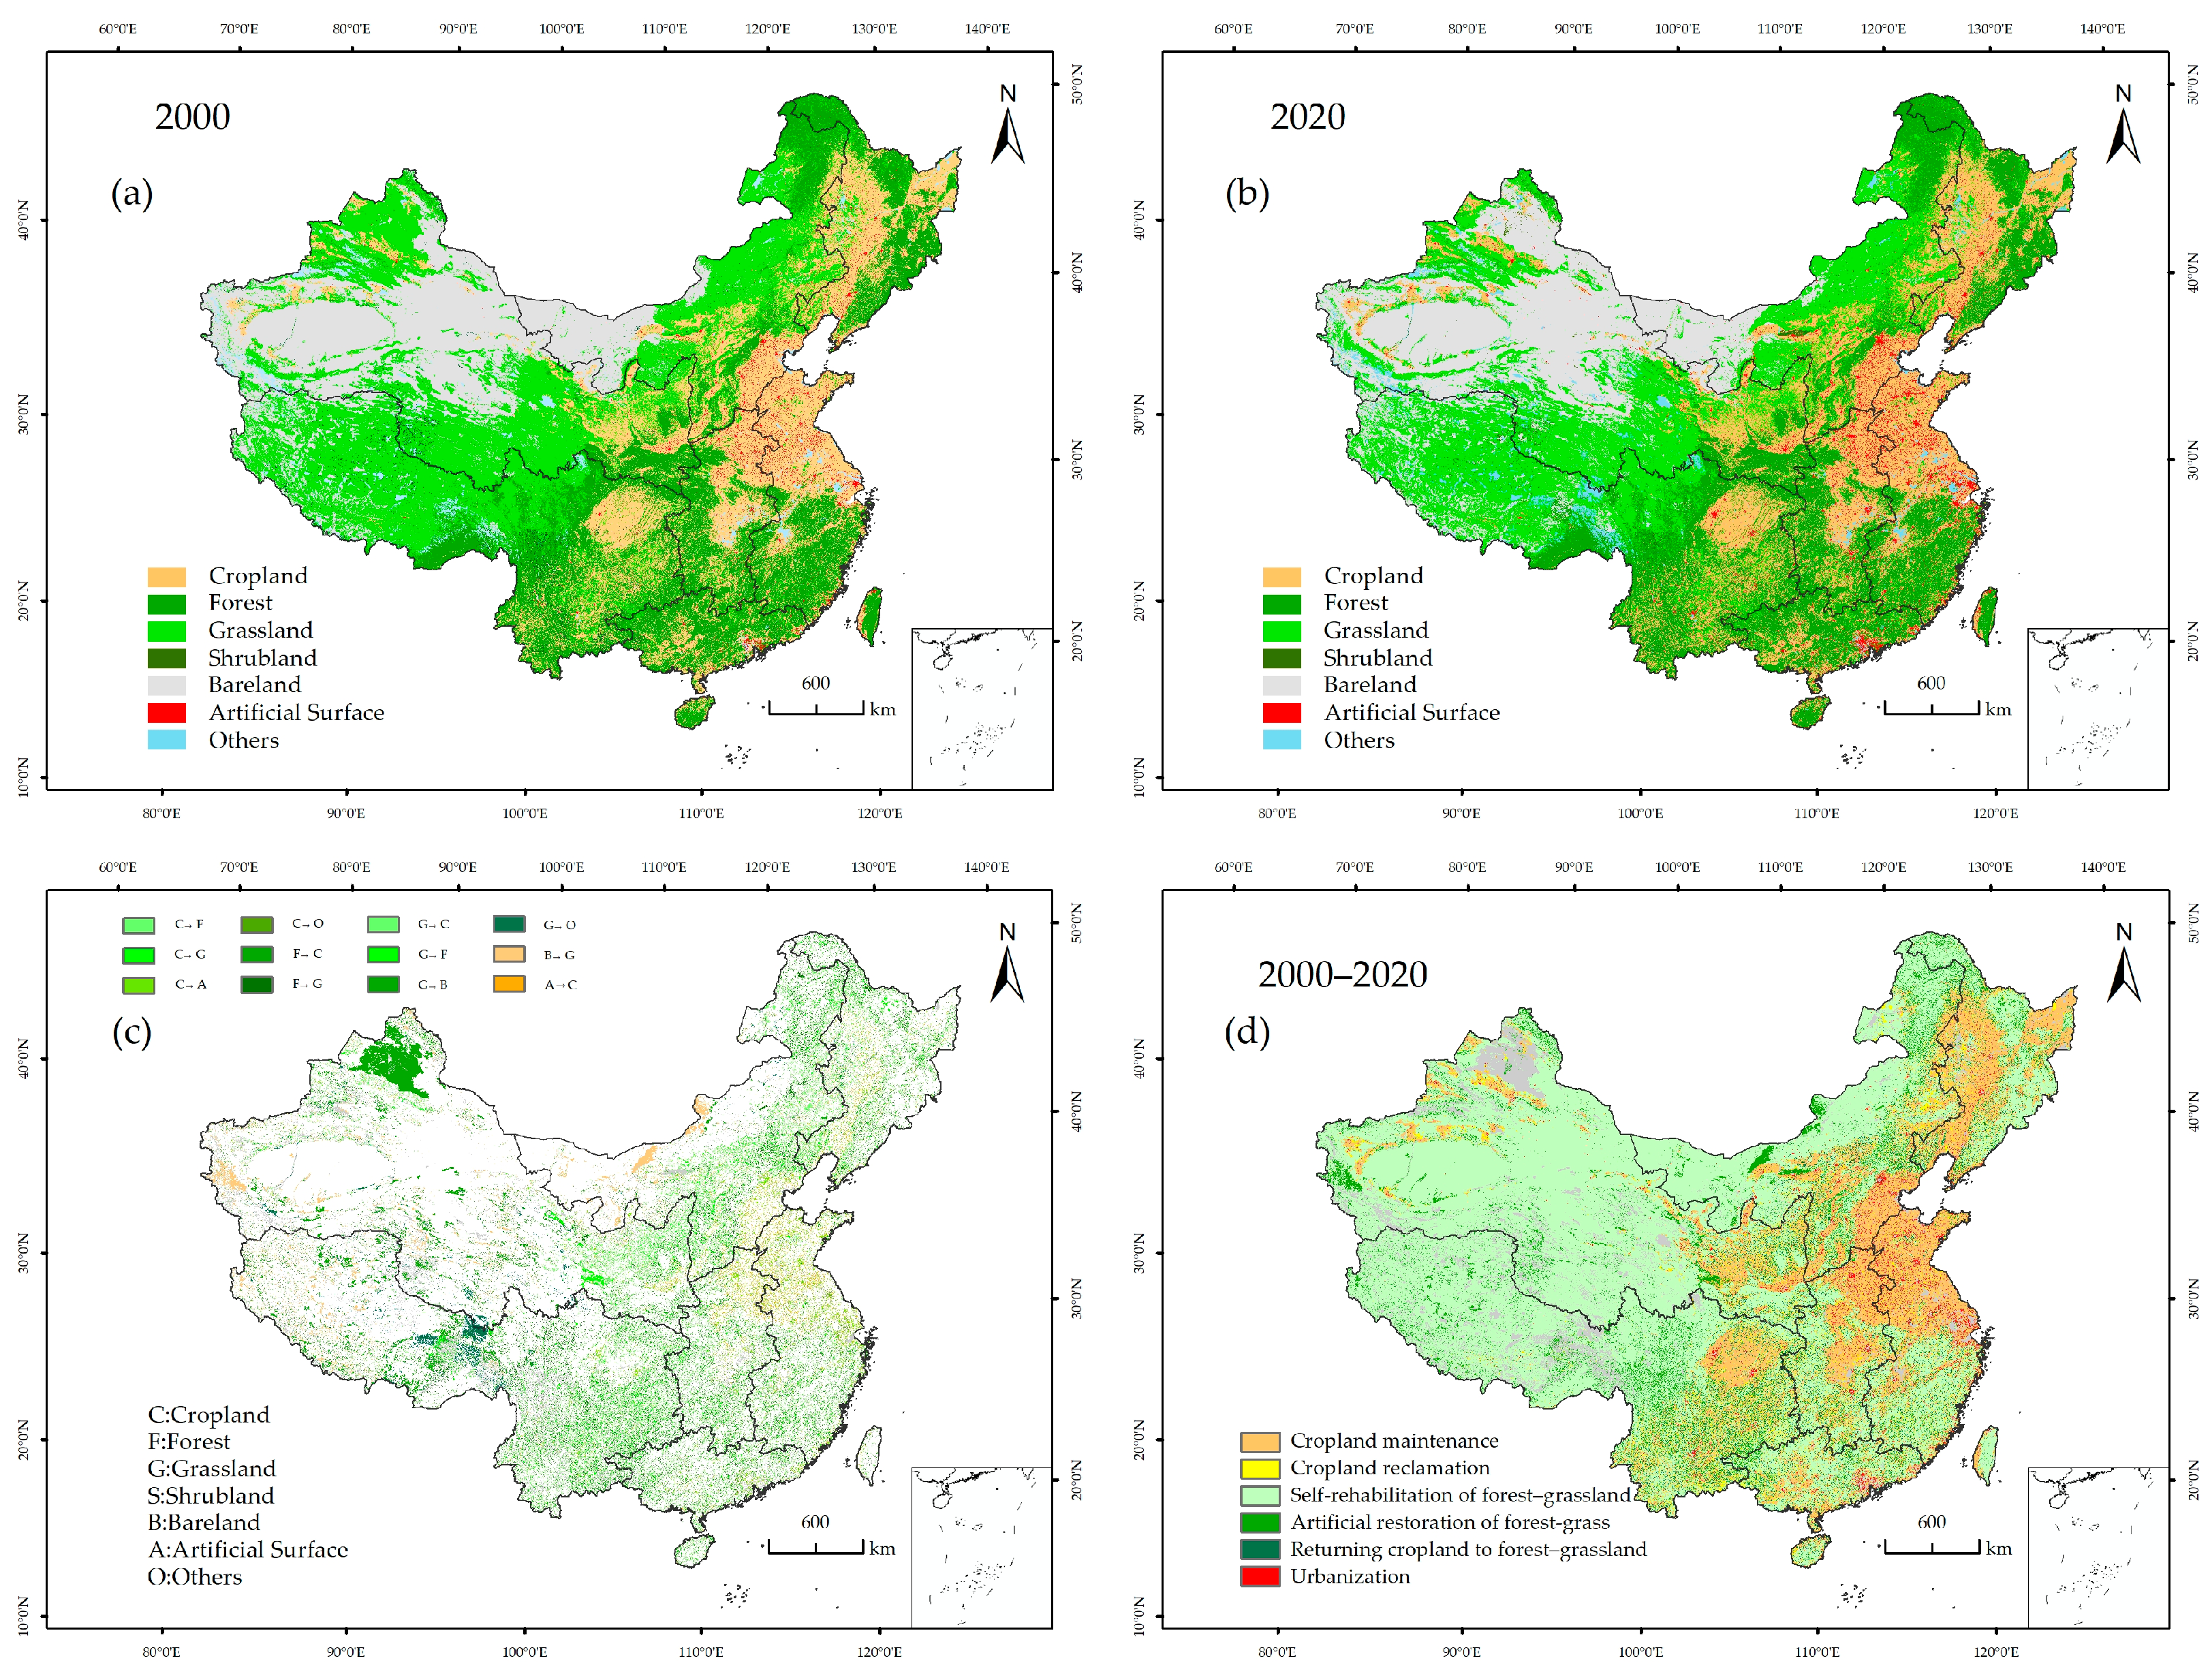
3.4. Spatiotemporal Variations in the Different Land Cover Change Types

To explore the spatiotemporal variations in the different land cover types, we counted transfer matrices from 2000 to 2020 (Table 3). The areas of the different unchanged and changed land cover types were calculated via spatial overlay analysis based on the land cover maps for 2000 (Figure 8a) and 2020 (Figure 8b).
In 2000, the area of the cropland was 209.73 × 10⁴ km2, but it decreased to 204.63 × 10⁴ km2 in 2020, with a relative change of −2.43%. The dominant change types causing cropland shrinkage were the conversion of cropland to forest and grassland. These areas were mainly scattered in SW, NC, and NW. In addition, cropland was eliminated by artificial surface construction (15.61 × 10⁴ km2), and such areas were mainly distributed in EC, NC, and CC (Figure 8c). From 2000 to 2020, the net decrease in the grassland area was 26.16 × 10⁴ km2, and the relative change was up to −9%. The conversion of grassland to bare land (29.54 × 10⁴ km2) was mostly responsible for the decrease in grassland area, which mostly occurred in NW, SW, and NC.
In contrast, the areas of the forest, shrubland, bare land, artificial surfaces, and other types increased from 2000 to 2020. The area of artificial surfaces significantly increased from 13.85 × 10⁴ km2 in 2000 to 26.62 × 10⁴ km2 in 2020, with the largest net increase rate of 92.3% among the five increased land cover types. This indicates that the significant urbanization process gradually has occupied the cropland in China during the last two decades (Figure 8a–c). The expansion of bare land was also primarily attributed to land cover conversion from grassland to bare land. Although the increases in the forest (0.37 × 10⁴ km2) and shrubland (0.49 × 10⁴ km2) offset part of the decrease in the grassland area, the land covered by natural vegetation still exhibited a decreasing trend during 2000–2020, which deserves the attention of local governments and policymakers.
We reclassified the 49 types of land cover change into two unchanged and four changed types (Table 4, where the different colors represent different categories). The spatial patterns of these six main land cover categories are shown in Figure 8d. The results reveal that the land use pattern in China changed significantly from 2000 to 2020. The self-rehabilitation of forest–grassland vegetation reached 5.59 × 10⁶ km2, accounting for 58.96%, making this the most extensive covering layer, which was scattered in NW, NC, and SW. The area of cropland maintenance was 1.58 × 10⁶ km2, accounting for 16.61%, and it was mainly distributed in EC, NE, and CC. In terms of the four changed types, the area of artificial restoration of forest–grassland was 0.59 × 10⁶ km2, accounting for 6.23%. The areas of the cropland reclamation, return of cropland to forest–grassland, and urbanization were 4.70 × 10⁵ km2, 3.30 × 10⁵ km2, and 1.94 × 10⁵ km2, accounting for 4.96%, 3.48%, and 2.04% of the total area of all of the change types, respectively.
From 2000 to 2020, the proportions of the different vegetation types were different in each region (Figure 9). Self-rehabilitation of forest–grassland occupied the largest proportion in the seven regions. This was particularly significant in SC, where it accounted for 65.51%, i.e., more than half of all the vegetation types. The high proportion of cropland maintenance in CC was also noteworthy, accounting for 29.54%. Compared with the other regions, the significant proportion of urbanization in EC suggests that this region developed rapidly from 2000 to 2020, which deserves more attention.

3.5. Divergent Leaf Area and Carbon Sequestration Changes Associated with the Main Land Cover Change Types

There were distinct differences in the leaf area and carbon sequestration among the different LUCC types (Table 4). Among the LUCC types, the self-rehabilitation of forest–grassland contributed the most to leaf area change in China (8.81 × 10⁵ km2, 51.15%). Cropland maintenance, cropland reclamation, return of cropland to forest–grassland, artificial restoration of forest–grassland vegetation, and urbanization accounted for approximately 4.27 × 10⁵ km2 (24.78%), 1.62 × 10⁵ km2 (9.38%), 1.33 × 10⁵ km2 (7.75%), 1.10 × 10⁵ km2 (6.38%), and 9743.71 km2 (0.57%), respectively. The largest contribution to the total carbon sequestration was the self-rehabilitation of forest–grassland 857.56 TgC (44.77%). Cropland maintenance, cropland reclamation, return of cropland to forest–grassland, artificial restoration of forest–grassland vegetation, and urbanization accounted for approximately 634.48 TgC (33.12%), 162.51 TgC (8.48%), 125.85 TgC (6.57%), 108.81 TgC (5.68%), and 26.24 TgC (1.37%), respectively. This phenomenon may be related to the area of each LUCC type in China.
However, the results of the mean LAI per unit area show that there were positive changes in the LAI in each land use type. Among them, returning cropland to forest–grassland and cropland reclamation increased significantly to 0.02 m2·m−2·yr−1, followed by self-rehabilitation of forest–grassland, artificial restoration of forest–grassland, and cropland maintenance (0.01 m2·m−2·yr−1). In contrast, the average annual growth rate of urbanization was not significant. The results of the carbon sequestration per unit area exhibited the following order: cropland maintenance (18.72 TgC·yr−1) > returning cropland to forest–grassland (15.45 TgC·yr−1) > cropland reclamation (14.74 TgC·yr−1) > artificial restoration of forest–grassland vegetation (8.16 TgC·yr−1) > self-rehabilitation of forest–grassland vegetation (5.69 TgC·yr−1) > urbanization (4.24 TgC·yr−1).
In conclusion, the LAI and GPP of the six main land cover types increased from 2000 to 2018, while the LAI and GPP of the urbanization areas increased, but the impact was insignificant. Regarding their contributions to the LAI and GPP, the self-rehabilitation of forest–grassland was the most effective LUCC type.
Based on Figure 9, Table 5 presents the statistics of the total changes in the LAI and GPP in the different land cover areas in the different regions. Although the NW had the largest proportion of self-rehabilitation of forest–grassland vegetation compared with the other regions, the total changes in the LAI and GPP were not the largest in this area, which may be because there was a large area of grassland (31.68%) and bare land (48.43%) in NW China. The vegetation structure of bare land and grassland was singular, and the carbon sequestration capacity was limited. Under the urbanization process in China, the LAI and GPP of the urbanization area decreased. However, it is noteworthy that the urbanization process in SC decreased the GPP by 0.69 TgC, and the LAI of the urbanized areas in EC decreased by 2.78 × 10⁵ km2. This shows that these two regions should strengthen ecological development in the process of urban development.

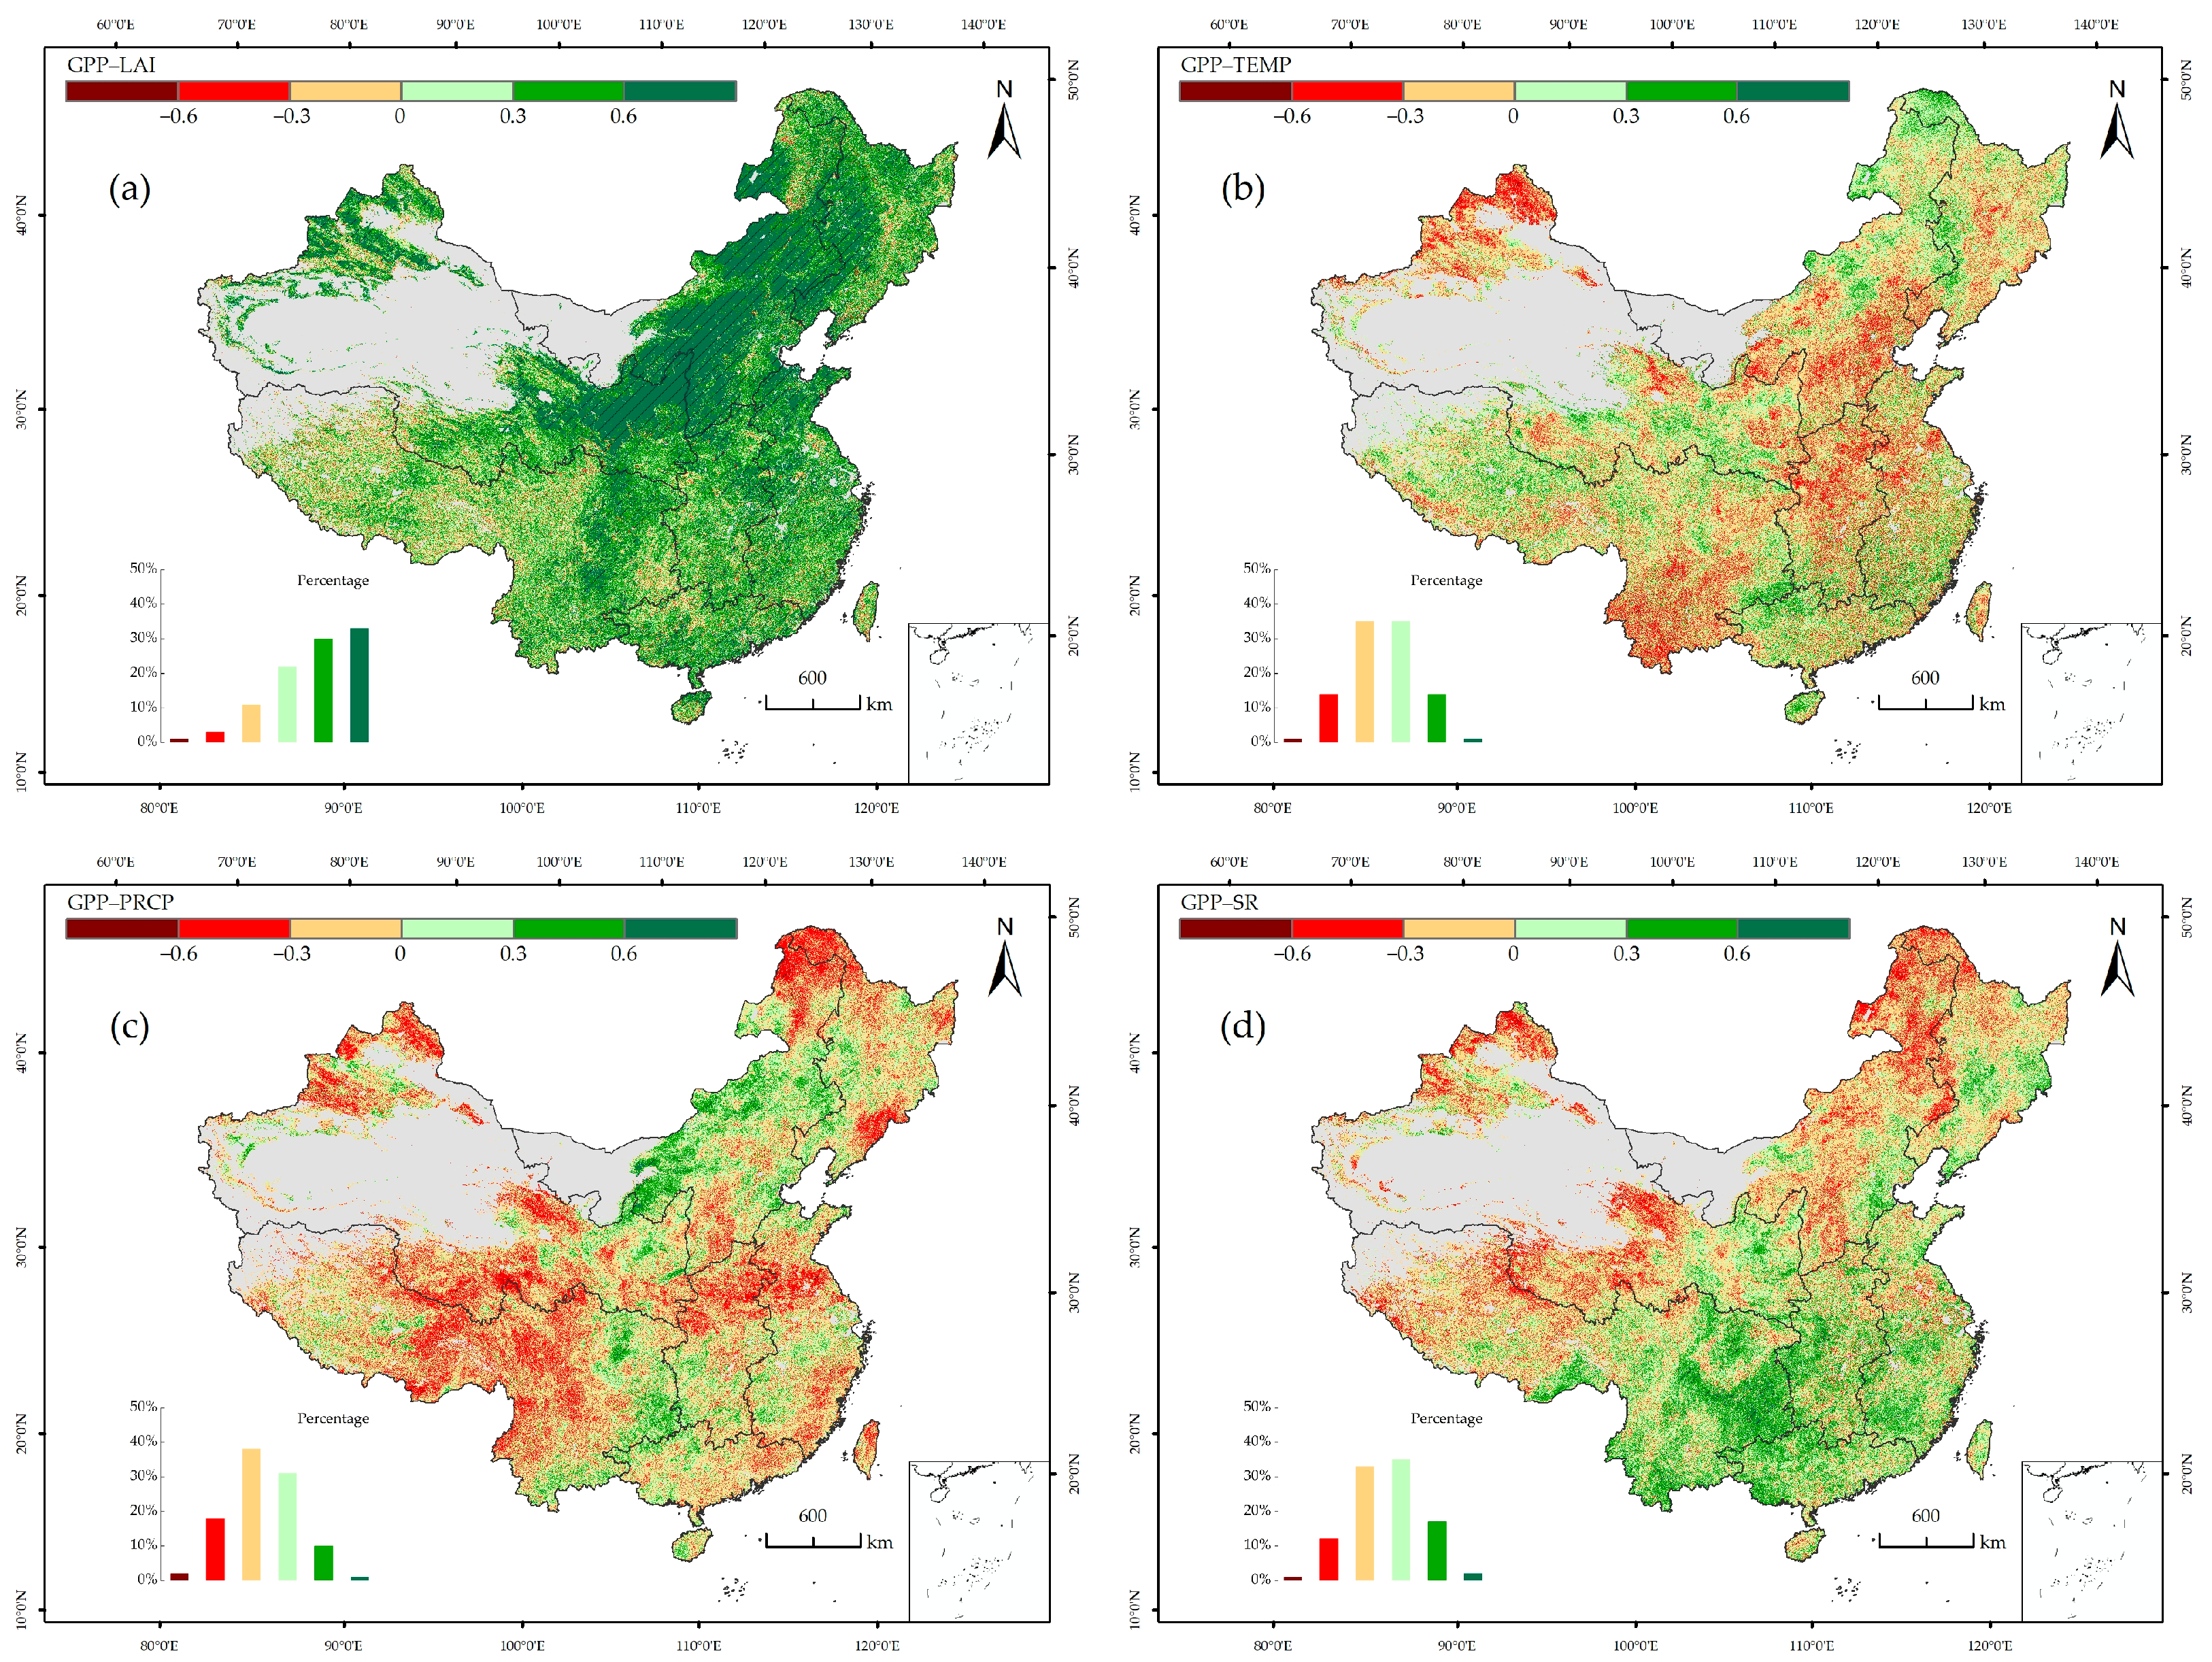
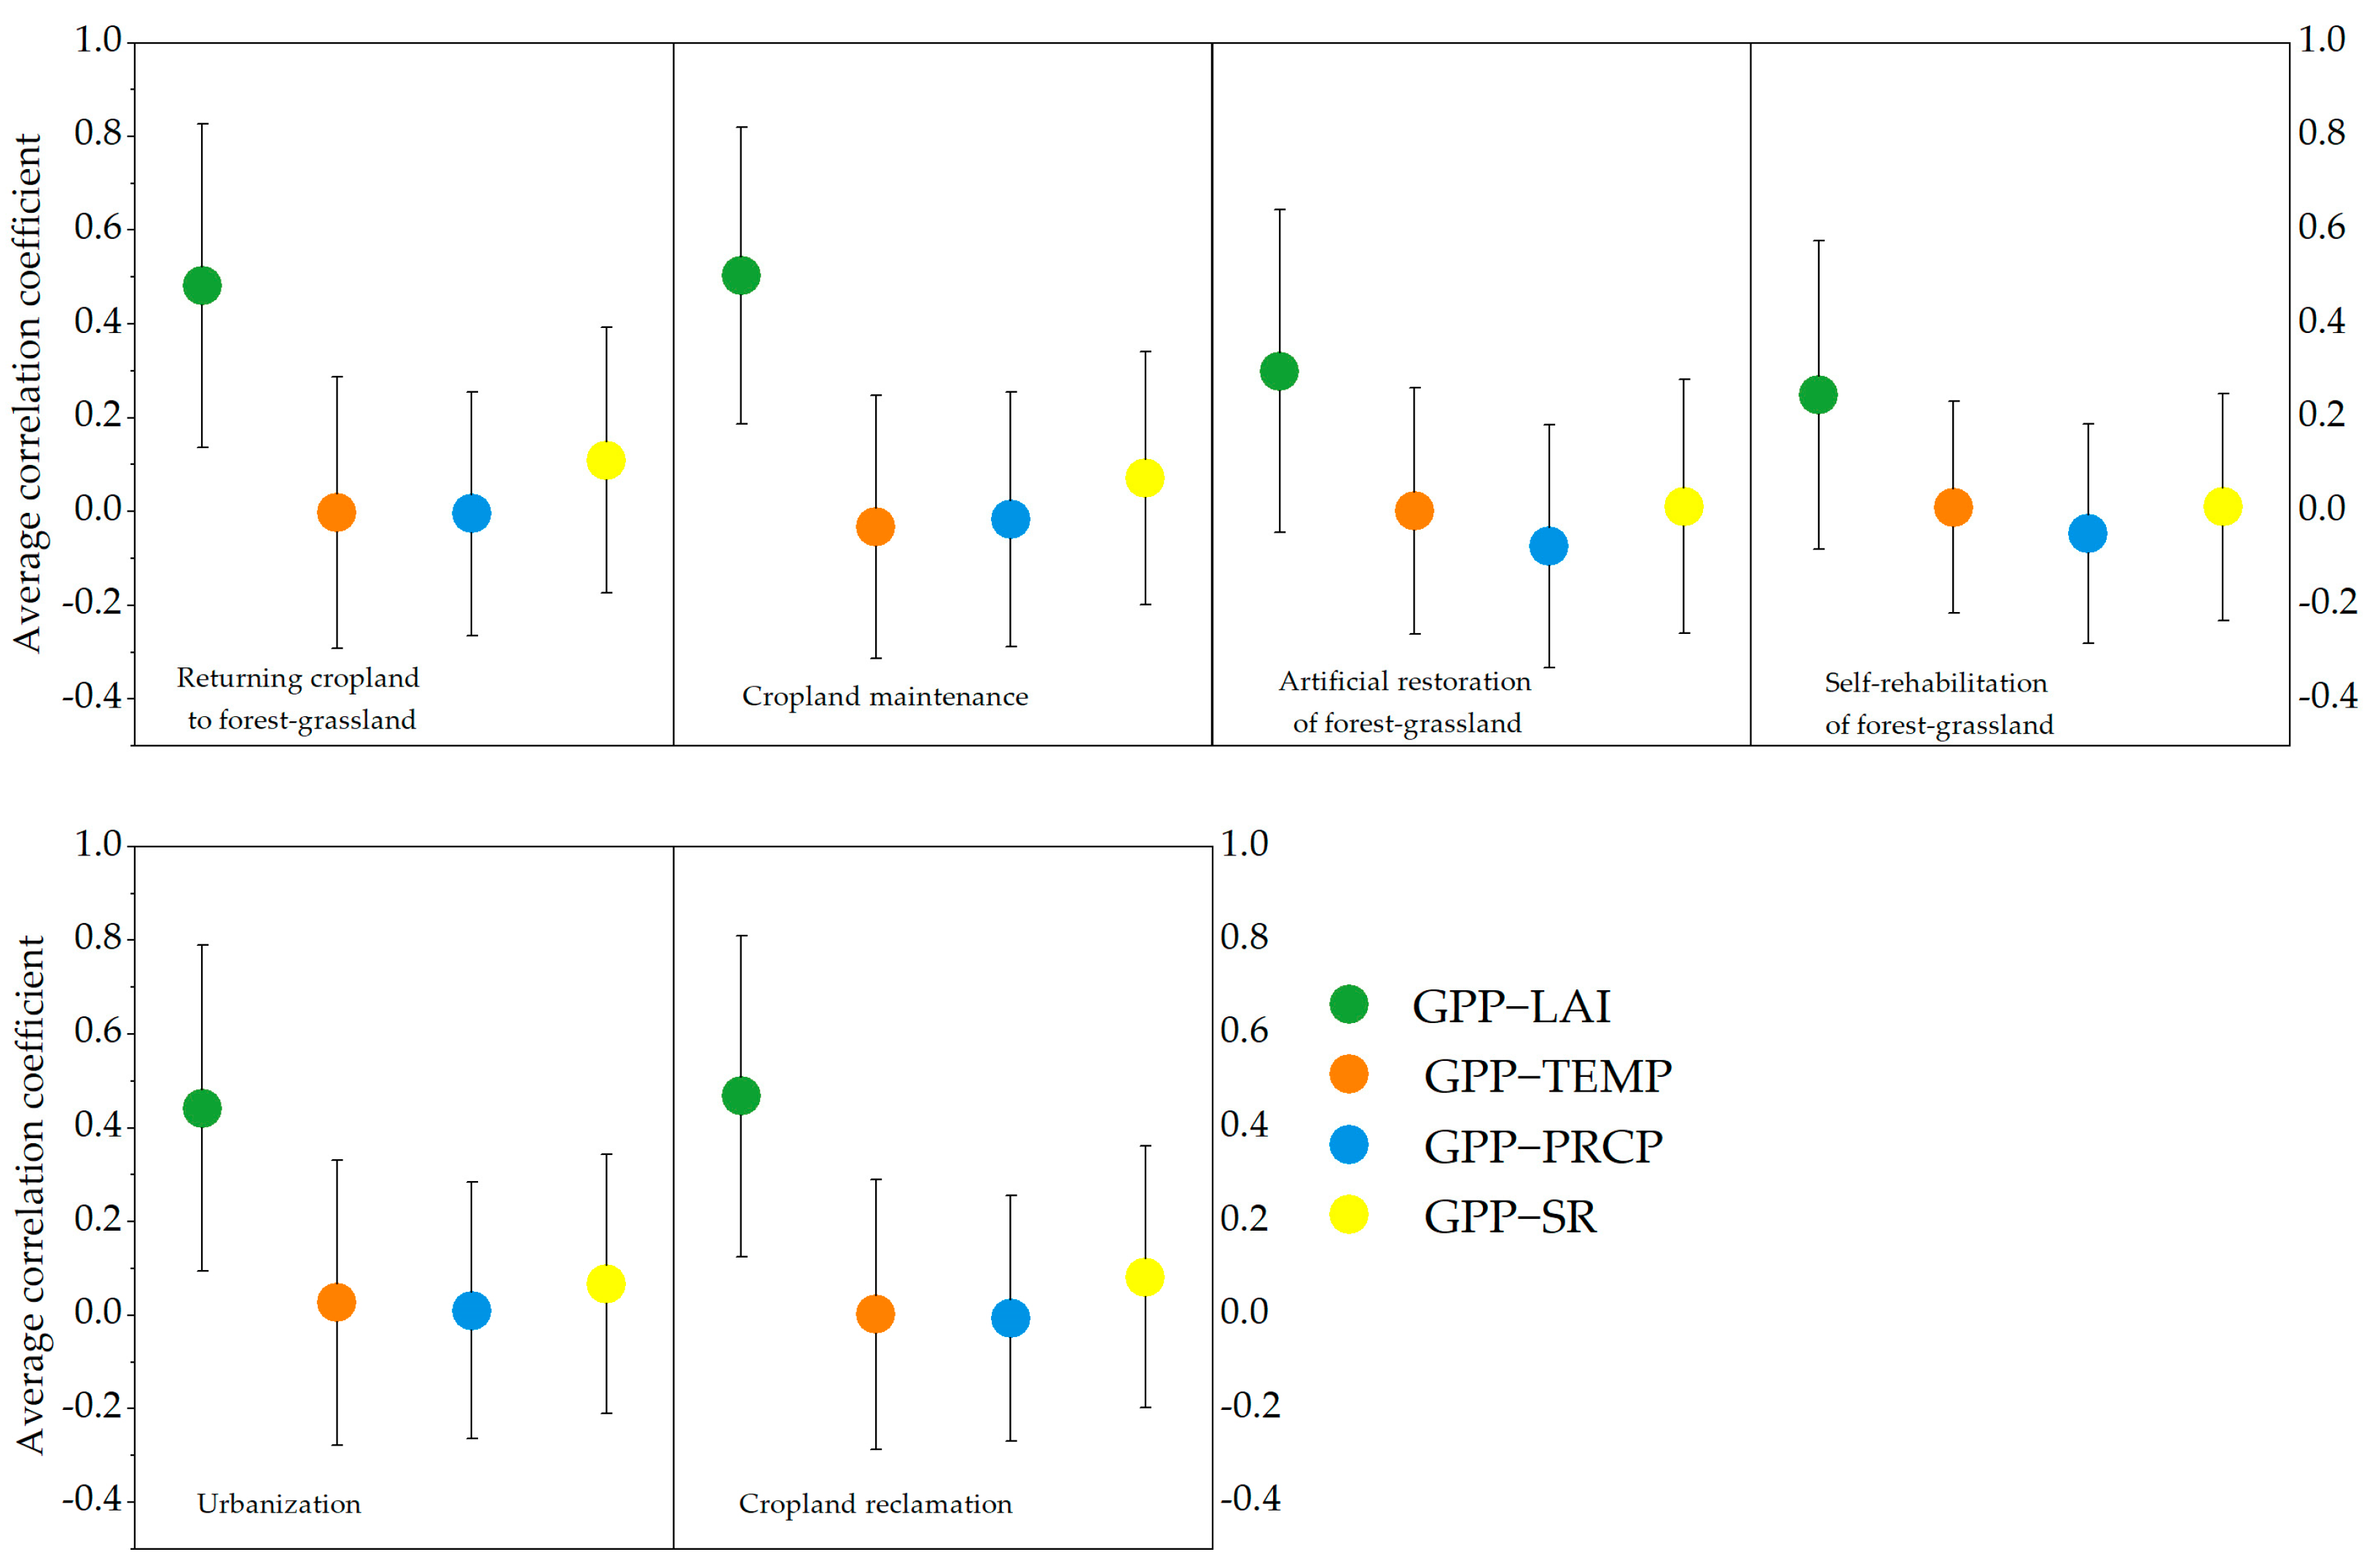
3.6. Correlations between GPP and LAI and Climate Variables

We explored the relationships between the GPP and the other variables in each pixel through partial correlation analysis (Figure 10). The results revealed that the correlations between the GPP and the different variables exhibited an obvious spatial distribution. Among them, the LAI was more strongly correlated with the GPP, with a positive correlation in 86% of the areas (p < 0.05), which mainly occurred in SW (157.51 × 10⁴ km2), NW (132.56 × 10⁴ km2), and NC (116.32 × 10⁴ km2). In most of the regions, the correlation coefficient between the GPP and precipitation (PRCP) was negative (58%), and the areas with positive correlations were mainly concentrated in SW (74.36 × 10⁴ km2) and NC (73.14 × 10⁴ km2). The GPP was positively correlated with temperature (TEMP) in 50% of the areas, mainly in SW (106.19 × 10⁴ km2). The degree of correlation between the GPP and solar radiation (SR) had a spatial distribution similar to that of the correlation between the GPP and TEMP. The regions with positive correlations were mainly concentrated in SC (54%).
The statistics of the average correlation coefficients and standard deviations of the GPP with LAI, TEMP, PRCP, and SR correlations in the different regions are presented in Figure 11. Compared with the other correlations, GPP-LAI exhibited a stronger correlation in all of the regions, especially NW, NC, and NE. The average correlation coefficient of GPP-TEMP was negative in NC, CC, and NW, indicating that the increase in TEMP inhibited the carbon sequestration capacity of the three regions. It should be noted that the average correlation coefficient of GPP-PRCP was only positive in NC. The average correlation coefficients of GPP-SR in the different regions ranked as follows: SC > CC > EC > SW > NW > NC > NE. Moreover, the regions with positive correlations were all located in southern China.
The average correlation coefficients and standard deviations of the GPP with LAI, TEMP, PRCP, and SR correlations in the different main land cover change types are illustrated in Figure 12. As was expected, the correlation coefficient of GPP-LAI was the highest among the different land cover change types. The average correlation coefficient of GPP-PRCP was generally low, and the only type with a positive value was urbanization. The other land cover change types had negative values.

4. Discussion

4.1. LAI and GPP Trend and Correlation Analysis

Chen et al. [31] used satellite remote sensing data to determine that from 2000 to 2016, the world was becoming greener. Most notably, in China, which accounted for 25% of the total global increase in leaf area, human land use was the key to greening the Earth. The results of this study support this thesis, and a more detailed analysis of the Chinese region was conducted. The LAI and GPP exhibited increasing trends after 2000. This pattern was mainly due to the combined effects of the initiation of national-scale plantation projects (external forcing) and the physiological conditions of the vegetation (intrinsic factor) [32].
In recent years, forestry projects implemented in China have played a key role in the sequestration of carbon dioxide from land greening and the atmosphere. From 1982 to 2014, the LAI of the plantation area increased from 22% to 23.4%, and there was a major growth trend after 2000 [33]. The carbon sequestration capacity of the Grain for Project could offset about 3%–5% of China’s annual carbon emissions (based on emissions in 2010) and about 1% of global emissions. Regarding the global carbon sink, from 2000 to 2010, the projects of returning cropland to forest–grassland have contributed 25% [34]. All these studies indicate that since 2000, with the launch of large-scale national projects, land use management has had a great impact on surface energy allocation, and the LAI and GPP have increased rapidly.
The surface energy partitioning propagates the changes in the land surface properties into the atmosphere by regulating land-atmosphere feedback effects and influencing the global water and energy cycles [35]. With the change in the LAI, the related vegetation structure and physiological changes affect the canopy conductance, latent sensible heat flux, and surface albedo. Then, the energy exchange between the land and atmosphere is affected [36,37]. The consequent variations in the climate modulate the interplay between the LAI-related biophysical processes and the surface energy partitioning, and ultimately, the vegetation productivity changes [38]. The process-based diagnostic system modeling in Chen et al. found that the increase in the global LAI was responsible for 12.4% of the cumulative terrestrial carbon sink [39]. Li et al. found that large-scale ecological engineering improved the environment in northern China, the GPP increased significantly on the Loess Plateau and northeast plain, and the increase in the LAI was the main reason for the increase in the GPP in these areas [40]. In this study, we also found that the correlation between the LAI and GPP was stronger in northern China. Implementing large-scale ecological projects such as the Three-North shelterbelt forest may be an important reason for this phenomenon.

4.2. Relationship between Land Cover Changes and Vegetation Leaf Area and Carbon Sequestration

Since 1850, LUCC’s carbon emissions have accounted for one-third of global greenhouse gas emissions [41]. Improving land management can improve the carbon sequestration capacity of ecosystems and increase China’s contribution to greening the Earth. We digitized the contributions of the different vegetation changes in the different regions to the LAI and GPP. The results show that land management played an important role in greening and terrestrial carbon sequestration in China, and the self-rehabilitation of forest-grassland vegetation has the greatest potential for greening and terrestrial carbon sequestration. The principle may be to close the mountains for afforestation and transform the low-efficiency forest into a forest ecosystem. In the cropland ecosystem, the carbon in the biomass can be increased through rational fertilization, artificial grass planting, rotational grazing, and reducing grazing pressure. Through artificial management, the carbon input of the ecosystem can be increased, and the carbon output caused by ecological disturbances can be decreased.
Each land cover type has different water conservation characteristics, which determine differences in the plant species, growth characteristics, and spacing. Specific management measures can have a significant impact on species richness and ecological composition [42]. For example, in a given external environment, the same crop species in different types of land causes differences due to variations in the soil characteristics [43], and often does not produce the species richness and composition associated with the original communities [44]. In China, the public green spaces in parks, streets, communities, and other urban areas have a higher canopy closure and density, which provides more favorable environmental conditions for increasing the vegetation greening rate and carbon storage. However, vegetation intensification in these areas affects species performance and reduces species abundance. Change in the vegetation abundance in surface areas is an important factor leading to the distribution of solar radiation, and changes in the nature of the surface lead to redistribution of the energy [45]. In the process of LUCC, in recent years, almost all of the surface atmospheric conditions have changed, including solar radiation, precipitation, temperature, and humidity [46].
Urban expansion is the best example of the ecological and climatic impacts caused by the increase in population. The significant increase in the artificial surface area reduces evapotranspiration and base flow. In addition, due to the changes in the properties of the underlying surface, such as the surface reflectance, roughness, vegetation coverage, temperature, humidity, and wind speed, the regional climate changes [47,48]. Zhang et al. [49] found that in recent decades, the ground carbon storage capacity in China’s urbanized regions decreased briefly and then increased. Urbanization generally promotes ecosystem carbon sequestration, and the conclusions of this study are consistent with this assessment. Since 2013, China has started incorporating ecological civilization construction into the national plan and constitution, all residential areas need a certain proportion of green space [50], most of which are trees and shrubs, and high biomass is an important reason for this phenomenon. We also found that the GPP in the SW urbanization area decreased by 0.69 TgC, and the LAI in the EC urbanization area decreased by 2783.14 km2 from 2000 to 2018. Figure 13 shows the proportions of the other land types occupied by the urbanization process in these two regions. The common feature of these two regions is that the proportion of urbanization construction through the occupation of cropland was the largest. The cropland area occupied in SW was 1.06 × 10⁴ km2, accounting for 74.7%. In EC, the urbanization area created by occupying cropland was 5.57 × 10⁴ km2 (88.67%), and a large amount of cropland was occupied for urbanization construction, which may be an important reason for the decline in the ecological quality in this region.

4.3. Uncertainties

In this study, the eddy covariance-derived data from the flux stations are used to validate PML-GPP products. Because of the site data limitations, our validation process still had inevitable uncertainties, and the optimization results should be further compared with more sites in the future. Second, attention should also be paid to the uncertainty caused by the different resolutions of the original datasets, and for ease of analysis, we resampled the spatial resolution of all datasets to 500 m, which may change the values of some cells. Using datasets with closer resolutions or comparing and integrating multiple products may optimize results. Moreover, data analysis on sub-annual time scales (such as monthly and daily data) is crucial for improving temporal and spatial analysis of ecological parameters. Estimating the LAI and GPP in China at a finer time resolution than the current annual time scale may lead to different conclusions, which are worthy of further discussion.

5. Conclusions

Based on remote sensing products, in this study, the changes in the vegetation LAI and GPP in the terrestrial ecosystems from 2000–2018 were analyzed from a region-wide to zonal perspective. In addition, the PML-V2 GPP and data from eight flux stations were compared, and it was found that they were of good quality in these regions. The analysis results revealed that, in general, the LAI and GPP increased significantly during 2000–2018, and the contributions of SC and EC were relatively high.
Although grassland accounted for the largest proportion of the total area, forest and cropland were the main vegetation types leading to LAI and GPP changes. Under the premise of ensuring biodiversity and ecological balance, expanding the area of forest land and arable land is the key to improving ecological benefits and greening the Earth. Due to the high altitude, cold climate, and lack of plant diversity in SW, the urbanization process has had a negative impact on carbon sequestration. Strengthening the management of urban greening and planting trees with strong environmental adaptability may improve this situation. The strong correlation between GPP and LAI suggests it is wise to change the vegetation structure to grow terrestrial carbon sinks through ecological engineering. The results of this study provide a theoretical basis for quantitative analysis of the effects of LUCCs on the LAI and GPP in China and the current regional ecological situation. They also provide new data and a reference for regional ecological improvement planning and other land use change plans.

Author Contributions

Conceptualization, Z.W. and E.G.; methodology, Z.W. and Q.H.; software, J.Z.; validation, W.L. and F.F.; formal analysis, E.G. and J.Z.; investigation, Q.H.; resources, Q.H. and Z.W.; data curation, E.G. and Z.W.; writing—original draft preparation, E.G.; writing—review and editing, Z.W.; visualization, E.G. and J.Z.; supervision, W.L. and F.F.; project administration, Q.H. and Z.W.; funding acquisition, Q.H. Z.W. and F.F. All authors have read and agreed to the published version of the manuscript.

Funding

This research was funded by the Joint Funds of the Key Science and Technology Project of the Ministry of Water Resources (SKR-2022017), the National Natural Science Foundation of China(Nos.42277478), the Joint Funds of the National Natural Science Foundation of China (No. U21A20109), and Special Research Fund of the YRIHR (HKY-JBYW-2022-13).

Institutional Review Board Statement

Not applicable.

Informed Consent Statement

Not applicable.

Data Availability Statement

The data is available on request from the corresponding author.

Acknowledgments

We gratefully thank the anonymous reviewers for their useful comments and constructive suggestions on the manuscript.

Conflicts of Interest

The authors declare no conflict of interest.

References

  1. Beer, C.; Reichstein, M.; Tomelleri, E.; Ciais, P.; Jung, M.; Carvalhais, N.; Rödenbeck, C.; Arain, M.A.; Baldocchi, D.; Bonan, G.B.; et al. Terrestrial gross carbon dioxide uptake: Global distribution and covariation with climate. Science 2010, 329, 834–838. [Google Scholar] [CrossRef] [PubMed] [Green Version]
  2. Parker, G.G. Tamm review: Leaf Area Index (LAI) is both a determinant and a consequence of important processes in vegetation canopies. For. Ecol. Manag. 2020, 477, 118496. [Google Scholar] [CrossRef]
  3. Tang, X.; Zhao, X.; Bai, Y.; Tang, Z.; Wang, W.; Zhao, Y.; Wan, H.; Xie, Z.; Shi, X.; Wu, B.; et al. Carbon pools in China’s terrestrial ecosystems: New estimates based on an intensive field survey. Proc. Natl. Acad. Sci. USA 2018, 115, 4021–4026. [Google Scholar] [CrossRef] [PubMed] [Green Version]
  4. Wang, S.; Huang, K.; Yan, H.; Yan, H.; Zhou, L.; Wang, H.; Zhang, J.; Yan, J.; Zhao, L.; Wang, Y.; et al. Improving the light use efficiency model for simulating terrestrial vegetation gross primary production by the inclusion of diffuse radiation across ecosystems in China. Ecol. Complex. 2015, 23, 1–13. [Google Scholar] [CrossRef]
  5. Li, L.; Wang, Y.-P.; Beringer, J.; Shi, H.; Cleverly, J.; Cheng, L.; Eamus, D.; Huete, A.; Hutley, L.; Lu, X.; et al. Responses of LAI to rainfall explain contrasting sensitivities to carbon uptake between forest and non-forest ecosystems in Australia. Sci. Rep. 2017, 7, 11720. [Google Scholar] [CrossRef]
  6. Liu, Y.; Xiao, J.; Ju, W.; Zhu, G.; Wu, X.; Fan, W.; Li, D.; Zhou, Y. Satellite-derived LAI products exhibit large discrepancies and can lead to substantial uncertainty in simulated carbon and water fluxes. Remote Sens. Environ. 2018, 206, 174–188. [Google Scholar] [CrossRef]
  7. Mao, J.; Ribes, A.; Yan, B.; Shi, X.; Thornton, P.E.; Séférian, R.; Ciais, P.; Myneni, R.; Douville, H.; Piao, S.; et al. Human-induced greening of the northern extratropical land surface. Nat. Clim. Chang. 2016, 6, 959–963. [Google Scholar] [CrossRef]
  8. Zhu, Z.; Bi, J.; Pan, Y.; Ganguly, S.; Anav, A.; Xu, L.; Samanta, A.; Piao, S.; Nemani, R.R.; Myneni, R.B. Global Data Sets of Vegetation Leaf Area Index (LAI)3g and Fraction of Photosynthetically Active Radiation (FPAR)3g Derived from Global Inventory Modeling and Mapping Studies (GIMMS) Normalized Difference Vegetation Index (NDVI3g) for the Period 1981 to 2011. Remote Sens. 2013, 5, 927–948. [Google Scholar]
  9. Xiao, Z.; Liang, S.; Wang, J.; Xiang, Y.; Zhao, X.; Song, J. Long-Time-Series Global Land Surface Satellite Leaf Area Index Product Derived From MODIS and AVHRR Surface Reflectance. IEEE Trans. Geosci. Remote Sens. 2016, 54, 5301–5318. [Google Scholar] [CrossRef]
  10. Justice, C.; Townshend, J.; Vermote, E.; Masuoka, E.; Wolfe, R.; Saleous, N.; Roy, D.; Morisette, J. An overview of MODIS Land data processing and product status. Remote Sens. Environ. 2002, 83, 3–15. [Google Scholar] [CrossRef]
  11. Seto, K.C.; Reenberg, A.; Boone, C.G.; Fragkias, M.; Haase, D.; Langanke, T.; Marcotullio, P.; Munroe, D.K.; Olah, B.; Simon, D. Urban land teleconnections and sustainability. Proc. Natl. Acad. Sci. USA 2012, 109, 7687–7692. [Google Scholar] [CrossRef] [PubMed]
  12. Mu, H.; Li, X.; Ma, H.; Du, X.; Huang, J.; Su, W.; Yu, Z.; Xu, C.; Liu, H.; Yin, D.; et al. Evaluation of the policy-driven ecological network in the Three-North Shelterbelt region of China. Landsc. Urban Plan. 2022, 218, 104305. [Google Scholar] [CrossRef]
  13. Li, Z.; Sun, X.; Huang, Z.; Zhang, X.; Wang, Z.; Li, S.; Zheng, W.; Zhai, B. Changes in nutrient balance, environmental effects, and green development after returning farmland to forests: A case study in Ningxia, China. Sci. Total Environ. 2020, 735, 139370. [Google Scholar] [CrossRef] [PubMed]
  14. Hu, Y.; Li, H.; Wu, D.; Chen, W.; Zhao, X.; Hou, M.; Li, A.; Zhu, Y. LAI-indicated vegetation dynamic in ecologically fragile region: A case study in the Three-North Shelter Forest program region of China. Ecol. Indic. 2021, 120, 106932. [Google Scholar] [CrossRef]
  15. Ding, Z.; Zheng, H.; Li, H.; Yu, P.; Man, W.; Liu, M.; Tang, X.; Liu, Y. Afforestation-driven increases in terrestrial gross primary productivity are partly offset by urban expansion in Southwest China. Ecol. Indic. 2021, 127, 107641. [Google Scholar] [CrossRef]
  16. Hu, X.; Li, Z.; Chen, J.; Nie, X.; Liu, J.; Wang, L.; Ning, K. Carbon sequestration benefits of the grain for Green Program in the hilly red soil region of southern China. Int. Soil Water Conserv. Res. 2021, 9, 271–278. [Google Scholar] [CrossRef]
  17. Chen, T.; Huang, Q.; Liu, M.; Li, M.; Qu, L.; Deng, S.; Chen, D. Decreasing Net Primary Productivity in Response to Urbanization in Liaoning Province, China. Sustainability 2017, 9, 162. [Google Scholar] [CrossRef] [Green Version]
  18. Li, D.; Tian, P.; Luo, H.; Hu, T.; Dong, B.; Cui, Y.; Khan, S.; Luo, Y. Impacts of land use and land cover changes on regional climate in the Lhasa River basin, Tibetan Plateau. Sci. Total Environ. 2020, 742, 140570. [Google Scholar] [CrossRef]
  19. Deng, L.; Shangguan, Z. Afforestation Drives Soil Carbon and Nitrogen Changes in China. Land Degrad. Dev. 2016, 28, 151–165. [Google Scholar] [CrossRef] [Green Version]
  20. Deng, L.; Shangguan, Z.P.; Sweeney, S. “Grain for Green” driven land use change and carbon sequestration on the Loess Plateau, China. Sci. Rep. 2014, 4, 7039. [Google Scholar] [CrossRef] [Green Version]
  21. Roshetko, J.M.; Lasco, R.D.; Angeles, M.S. Angeles, Smallholder Agroforestry Systems for Carbon Storage. Mitig. Adapt. Strateg. Glob. Chang. 2006, 12, 219–242. [Google Scholar] [CrossRef]
  22. Wang, Z.; Cui, Z.; He, T.; Tang, Q.; Xiao, P.; Zhang, P.; Wang, L. Attributing the Evapotranspiration Trend in the Upper and Middle Reaches of Yellow River Basin Using Global Evapotranspiration Products. Remote Sens. 2022, 14, 175. [Google Scholar] [CrossRef]
  23. Chen, X.; Yu, L.; Du, Z.; Xu, Y.; Zhao, J.; Zhao, H.; Zhang, G.; Peng, D.; Gong, P. Distribution of ecological restoration projects associated with land use and land cover change in China and their ecological impacts. Sci. Total Environ. 2022, 825, 153938. [Google Scholar] [CrossRef] [PubMed]
  24. Xiao, Z.; Liang, S.; Wang, J.; Chen, P.; Yin, X.; Zhang, L.; Song, J. Use of General Regression Neural Networks for Generating the GLASS Leaf Area Index Product From Time-Series MODIS Surface Reflectance. IEEE Trans. Geosci. Remote Sens. 2013, 52, 209–223. [Google Scholar] [CrossRef]
  25. Fang, H.; Zhang, Y.; Wei, S.; Li, W.; Ye, Y.; Sun, T.; Liu, W. Validation of global moderate resolution leaf area index (LAI) products over croplands in northeastern China. Remote Sens. Environ. 2019, 233, 111377. [Google Scholar] [CrossRef]
  26. Gan, R.; Zhang, Y.; Shi, H.; Yang, Y.; Eamus, D.; Cheng, L.; Chiew, F.H.; Yu, Q. Use of satellite leaf area index estimating evapotranspiration and gross assimilation for Australian ecosystems. Ecohydrology 2018, 11, e1974. [Google Scholar] [CrossRef]
  27. Pei, Y.; Dong, J.; Zhang, Y.; Yang, J.; Zhang, Y.; Jiang, C.; Xiao, X. Performance of four state-of-the-art GPP products (VPM, MOD17, BESS and PML) for grasslands in drought years. Ecol. Inform. 2020, 56, 101052. [Google Scholar] [CrossRef]
  28. Sarmah, S.; Singha, M.; Wang, J.; Dong, J.; Burman, P.K.D.; Goswami, S.; Ge, Y.; Ilyas, S.; Niu, S. Mismatches between vegetation greening and primary productivity trends in South Asia—A satellite evidence. Int. J. Appl. Earth Obs. Geoinf. 2021, 104, 102561. [Google Scholar] [CrossRef]
  29. Zhao, M.; Heinsch, F.A.; Nemani, R.R.; Running, S.W. Improvements of the MODIS terrestrial gross and net primary production global data set. Remote Sens. Environ. 2005, 95, 164–176. [Google Scholar] [CrossRef]
  30. Chang, X.; Wang, Z.; Wei, F.; Xiao, P.; Shen, Z.; Lv, X.; Shi, Y. Determining the Contributions of Vegetation and Climate Change to Ecosystem WUE Variation over the Last Two Decades on the Loess Plateau, China. Forests. 2021, 12, 1442. [Google Scholar] [CrossRef]
  31. Chen, C.; Park, T.; Wang, X.; Piao, S.; Xu, B.; Chaturvedi, R.K.; Fuchs, R.; Brovkin, V.; Ciais, P.; Fensholt, R.; et al. China and India lead in greening of the world through land-use management. Nat. Sustain. 2019, 2, 122–129. [Google Scholar] [CrossRef] [PubMed]
  32. Zhang, Y.; Peng, C.; Li, W.; Tian, L.; Zhu, Q.; Chen, H.; Fang, X.; Zhang, G.; Liu, G.; Mu, X.; et al. Multiple afforestation programs accelerate the greenness in the ‘Three North’ region of China from 1982 to 2013. Ecol. Indic. 2016, 61, 404–412. [Google Scholar] [CrossRef]
  33. Chen, Y.; Chen, L.; Cheng, Y.; Ju, W.; Chen, H.Y.H.; Ruan, H. Afforestation promotes the enhancement of forest LAI and NPP in China. For. Ecol. Manag. 2020, 462, 117990. [Google Scholar] [CrossRef]
  34. Deng, L.; Liu, S.; Kim, D.G.; Peng, C.; Sweeney, S.; Shangguan, Z. Past and future carbon sequestration benefits of China’s grain for green program. Glob. Environ. Chang. 2017, 47, 13–20. [Google Scholar] [CrossRef]
  35. Forzieri, G.; Alkama, R.; Miralles, D.G.; Cescatti, A. Satellites reveal contrasting responses of regional climate to the widespread greening of Earth. Science 2017, 356, 1140–1144. [Google Scholar] [CrossRef] [Green Version]
  36. Bonan, G.B. Forests and climate change: Forcings, feedbacks, and the climate benefits of forests. Science 2008, 320, 1444–1449. [Google Scholar] [CrossRef] [Green Version]
  37. Forzieri, G.; Miralles, D.G.; Ciais, P.; Alkama, R.; Ryu, Y.; Duveiller, G.; Zhang, K.; Robertson, E.; Kautz, M.; Martens, B.; et al. Increased control of vegetation on global terrestrial energy fluxes. Nat. Clim. Chang. 2020, 10, 356–362. [Google Scholar] [CrossRef]
  38. Pitman, A.; Avila, F.B.; Abramowitz, G.; Wang, Y.; Phipps, S.; De Noblet-Ducoudré, N. Importance of background climate in determining impact of land-cover change on regional climate. Nat. Clim. Chang. 2011, 1, 472–475. [Google Scholar] [CrossRef]
  39. Chen, J.M.; Ju, W.; Ciais, P.; Viovy, N.; Liu, R.; Liu, Y.; Lu, X. Vegetation structural change since 1981 significantly enhanced the terrestrial carbon sink. Nat. Commun. 2019, 10, 4259. [Google Scholar] [CrossRef] [Green Version]
  40. Li, C.; Zhang, Y.; Shen, Y.; Kong, D.; Zhou, X. LUCC-Driven Changes in Gross Primary Production and Actual Evapotranspiration in Northern China. J. Geophys. Res. Atmos. 2020, 125, e2019JD031705. [Google Scholar] [CrossRef]
  41. Arneth, A.; Sitch, S.; Pongratz, J.; Stocker, B.D.; Ciais, P.; Poulter, B.; Bayer, A.D.; Bondeau, A.; Calle, L.; Chini, L.P.; et al. Historical carbon dioxide emissions caused by land-use changes are possibly larger than assumed. Nat. Geosci. 2017, 10, 79–84. [Google Scholar] [CrossRef] [Green Version]
  42. Du, X.; Jian, J.; Du, C.; Stewart, R.D. Conservation management decreases surface runoff and soil erosion. Int. Soil Water Conserv. Res. 2022, 10, 188–196. [Google Scholar] [CrossRef]
  43. Maikhuri, R.K.; Semwal, R.L.; Rao, K.S.; Singh, K.; Saxena, K.G. Growth and ecological impacts of traditional agroforestry tree species in Central Himalaya, India. Agrofor. Syst. 2000, 48, 257–271. [Google Scholar] [CrossRef]
  44. Poschlod, P.; Bakker, J.; Kahmen, S. Changing land use and its impact on biodiversity. Basic Appl. Ecol. 2005, 6, 93–98. [Google Scholar] [CrossRef]
  45. Yan, H.; Wang, S.; Dai, J.; Wang, J.; Chen, J.; Shugart, H.H. Forest Greening Increases Land Surface Albedo During the Main Growing Period Between 2002 and 2019 in China. J. Geophys. Res. Atmos. 2021, 126, e2020JD033582. [Google Scholar] [CrossRef]
  46. Chu, X.-L.; Lu, Z.; Wei, D.; Lei, G.-P. Effects of land use/cover change (LUCC) on the spatiotemporal variability of precipitation and temperature in the Songnen Plain, China. J. Integr. Agric. 2022, 21, 235–248. [Google Scholar] [CrossRef]
  47. Zhong, Q.; Ma, J.; Zhao, B.; Wang, X.; Zong, J.; Xiao, X. Assessing spatial-temporal dynamics of urban expansion, vegetation greenness and photosynthesis in megacity Shanghai, China during 2000–2016. Remote Sens. Environ. 2019, 233, 111374. [Google Scholar] [CrossRef]
  48. Yang, H.; Zhong, X.; Deng, S.; Xu, H. Assessment of the impact of LUCC on NPP and its influencing factors in the Yangtze River basin, China. CATENA 2021, 206, 105542. [Google Scholar] [CrossRef]
  49. Zhang, X.; Brandt, M.; Tong, X.; Ciais, P.; Yue, Y.; Xiao, X.; Zhang, W.; Wang, K.; Fensholt, R. A large but transient carbon sink from urbanization and rural depopulation in China. Nat. Sustain. 2022, 5, 321–328. [Google Scholar] [CrossRef]
  50. Feng, D.; Bao, W.; Yang, Y.; Fu, M. How do government policies promote greening? Evidence from China. Land Use Policy 2021, 104, 105389. [Google Scholar] [CrossRef]
Figure 1. Geographic map of China showing the different regions defined in this study and the flux stations used in this study.
Forests 13 01623 g001
Figure 2. Overall flow scheme of this study.
Forests 13 01623 g002
Figure 3. Accuracies of PML_V2 GPP estimates on the (a) 8-day scale and (b) annual scale based on in-situ observations from six flux stations.
Forests 13 01623 g003
Figure 4. (a) Spatial distribution of the changes in the annual average LAI and (b) its significance level during 2000–2018. (c) Temporal changes in the country-level average annual LAI during 2000–2018. the red-shaded areas denote the 95% confidence interval. (d) Boxplots of the regional-level statistics of the LAI trends in the seven regions.
Forests 13 01623 g004
Figure 5. Provincial-level (the primary axis) and regional-level (the secondary axis) net changes in the total leaf area from 2000 to 2018.
Forests 13 01623 g005
Figure 6. (a) Spatial distribution of the changes in the annual average GPP and (b) its significance level during 2000–2018. (c) Temporal changes in the country-level average annual GPP during 2000–2018. The red-shaded areas denote the 95% confidence interval. (d) Boxplots of regional-level statistics of the GPP trends in the seven regions.
Forests 13 01623 g006aForests 13 01623 g006b
Figure 7. Provincial-level (the primary axis) and regional-level (the secondary axis) net changes in the total carbon sequestration from 2000 to 2018.
Forests 13 01623 g007
Figure 8. Land cover maps of China for (a) 2000 and (b) 2018, spatial patterns of (c) the dominant land cover change types, and (d) the six land cover categories.
Forests 13 01623 g008
Figure 9. Proportions of the areas of the main land cover categories in the seven different regions.
Forests 13 01623 g009
Figure 10. Partial correlations and spatial distributions of significance (p < 0.05) between the GPP and the (a) LAI, (b) temperature, (c) precipitation, and (d) solar radiation.
Forests 13 01623 g010
Figure 11. Average correlation coefficients and standard deviations of the GPP with LAI, TEMP, PRCP and SR correlations in the different regions.
Forests 13 01623 g011
Figure 12. Average correlation coefficients and standard deviations of the GPP with LAI, TEMP, PRCP, and SR correlations in different main land cover change types.
Forests 13 01623 g012
Figure 13. Proportion of artificial surfaces converted from the different land cover types in SW and EC.
Forests 13 01623 g013
Table 1. Satellite products and reanalysis data used in this study.
VariablesProduct Spatial ResolutionTemporal ResolutionPeriod
LAIGLASS500 m8 days2000–2018
GPPPML-V2500 m8 days2000–2018
LUCCGlobeland3030 m2000, 2020
TEMP
PRCP
SR
ERA50.25°hourly2000–2018
Table 2. Information about the geography and vegetation of the study sites.
SiteLatitude (°N)Longitude (°E)Data PeriodMean Annual Precipitation (mm)Mean Annual Temperature (°C)Altitude (m)Vegetation Type
Dangxiong30.4991.062004–20054501.3295.7Alpine meadow
Dinghushan23.17112.542005195620.9493Forest
Duolun42.05116.2820072751.71324Grassland
Haibei Wetland37.61101.332004–2005535−14.43190Swamp
Haibei Shrub37.67101.332004–2005535−14.43190Bush
Qianyanzhou26.74115.062003–2004154217.9100Cropland
Changling44.59123.5120094704.9171Grassland
Changbaishan42.40128.102004–20057133.6738Forest
Table 3. Transfer matrix of the different land cover types during the study period (104 km2).
2020Cropland ForestGrasslandShrublandBare LandArtificial SurfacesOthersDecrease
2000
Cropland 157.60 20.08 12.56 0.37 0.45 15.61 3.05 52.12
Forest20.79 173.88 14.76 1.23 0.26 1.29 1.39 39.71
Grassland15.71 17.30 217.06 2.68 29.54 1.57 6.63 73.43
Shrubland0.45 1.15 1.90 1.64 0.57 0.03 0.20 4.31
Bare land1.72 0.20 15.34 0.46 166.89 0.30 2.76 20.78
Artificial surfaces5.72 0.31 0.35 0.01 0.03 7.24 0.18 6.61
Others2.63 1.02 2.36 0.05 2.92 0.58 18.08 9.56
Increase47.02 40.08 47.27 4.80 33.77 19.38 14.21 206.52
Forests 13 01623 i001Cropland maintenance Forests 13 01623 i002Cropland reclamation Forests 13 01623 i003Self-rehabilitation of forest–grassland; Forests 13 01623 i004Return of cropland to forest–grassland Forests 13 01623 i005Urbanization Forests 13 01623 i006Artificial restoration of forest–grassland.
Table 4. Annual mean and total changes in the LAI and GPP in the major vegetation transfer areas.
Vegetation TypeLAI ChangeGPP Change
Average LAI
(m2·m−2·yr−1)
Total Leaf Area
(104 km2)
Contr.
(%)
Average GPP
(gc·m−2·yr−1)
Total Carbon
(TgC)
Contr.
(%)
Returning cropland to forest–grassland0.0213.357.75%15.45125.856.57%
Artificial restoration of forest–grassland0.0110.986.37%8.16108.815.68%
Cropland maintenance0.0142.724.7%18.72634.4833.1%
Cropland reclamation0.0216.159.38%14.74162.518.48%
Urbanization00.970.56%4.2426.241.37%
Self-rehabilitation of forest–grassland0.0188.1151.1%5.69857.5644.7%
Table 5. Total changes in the LAI and GPP in the land use change areas in each region from 2000 to 2018.
Returning Cropland to Forest–GrasslandArtificial Restoration of Forest–Grassland VegetationCropland MaintenanceCropland
Reclamation
UrbanizationSelf-Rehabilitation of Forest–Grassland Vegetation
LAI (104 km2) NE0.79 0.67 6.16 1.00 0.37 3.96
NC1.38 2.41 5.50 1.77 0.36 11.85
EC1.45 0.85 4.29 1.81 −0.28 12.93
SC2.31 1.44 4.65 2.43 0.18 17.70
CC1.43 0.82 4.21 1.80 0.10 9.26
NW1.58 1.01 6.34 2.50 0.20 13.15
SW4.41 3.78 11.55 4.84 0.04 19.26
GPP (TgC) NE14.26 9.61 157.99 19.81 7.53 69.99
NC20.13 26.47 106.20 28.10 7.22 169.96
EC17.10 8.42 116.88 24.93 5.26 129.20
SC10.77 6.89 25.28 11.51 0.75 72.57
CC12.27 6.18 66.52 17.43 3.23 65.49
NW19.52 15.64 81.33 25.17 2.94 144.70
SW31.80 35.60 80.28 35.56 −0.69 205.65
Publisher’s Note: MDPI stays neutral with regard to jurisdictional claims in published maps and institutional affiliations.

