
The Dominant Driving Force of Forest Change in the Yangtze River Basin, China: Climate Variation or Anthropogenic Activities?


Abstract
:1. Introduction
2. Materials and Methods
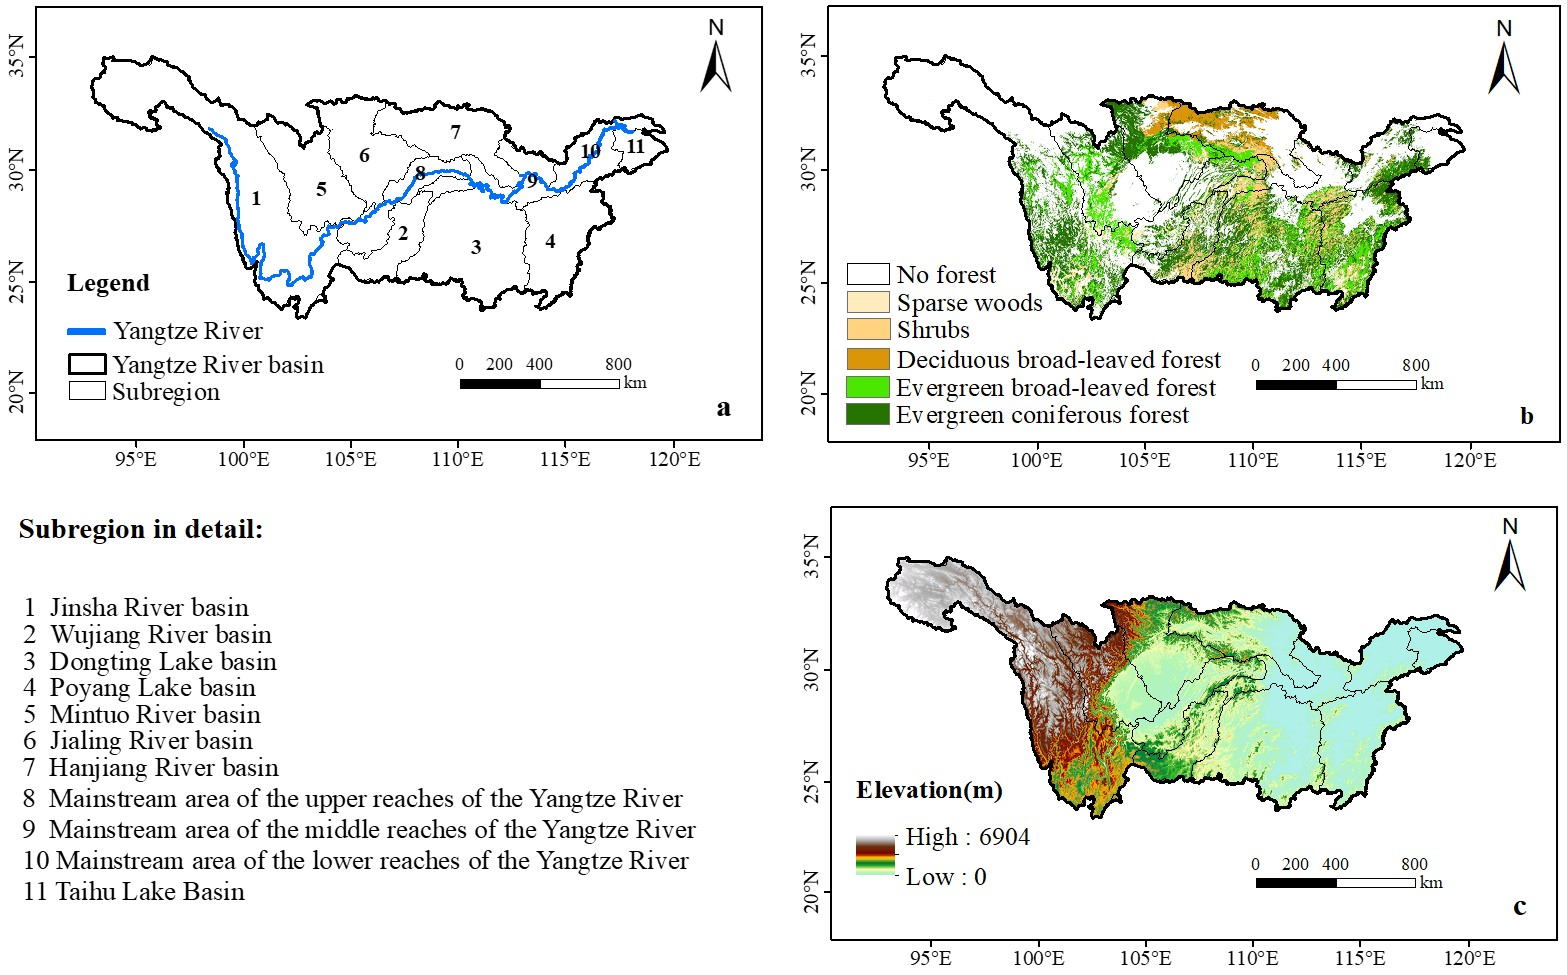
2.1. Study Area
2.2. Data Sources
2.3. Methodology
2.3.1. Definition and Calculation of ANPP, PNPP and HNPP
2.3.2. Trend Analysis
2.3.3. Scenario Establishment
2.3.4. Correlation Analysis
3. Results
3.1. Spatial Distribution of Forest NPP from 2000 to 2015
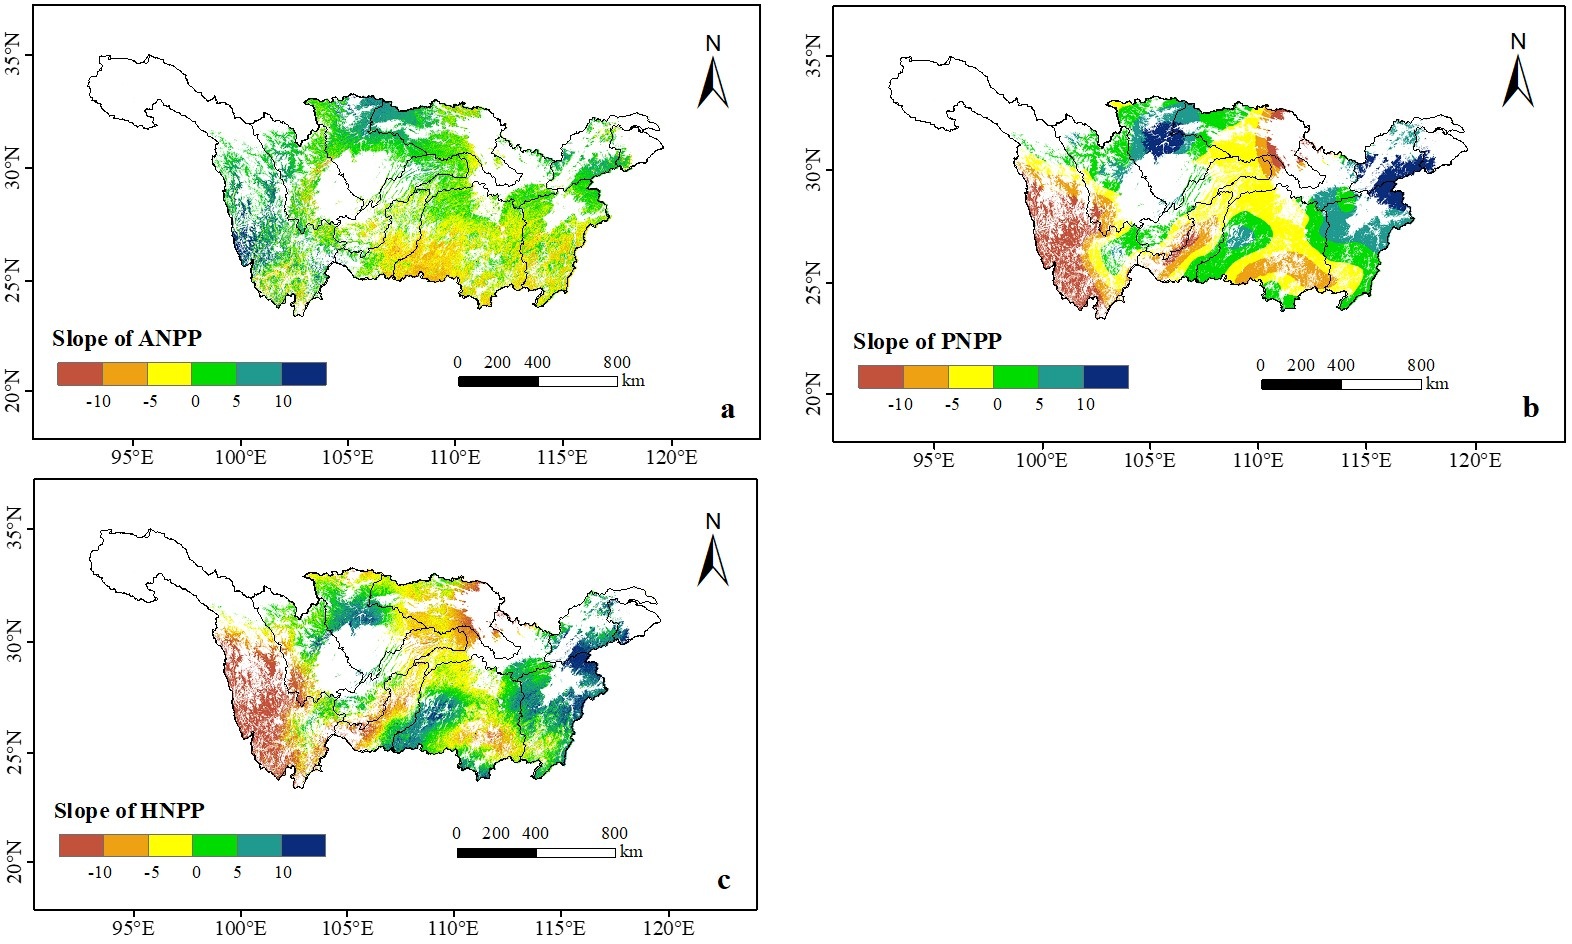
3.2. The Trends in Forest ANPP, PNPP and HNPP in the YRB
3.3. Forest ANPP Dynamics at the Tributary Level in the YRB
3.4. Contributions of Climate Variation and Anthropogenic Activities to Forest ANPP Variation
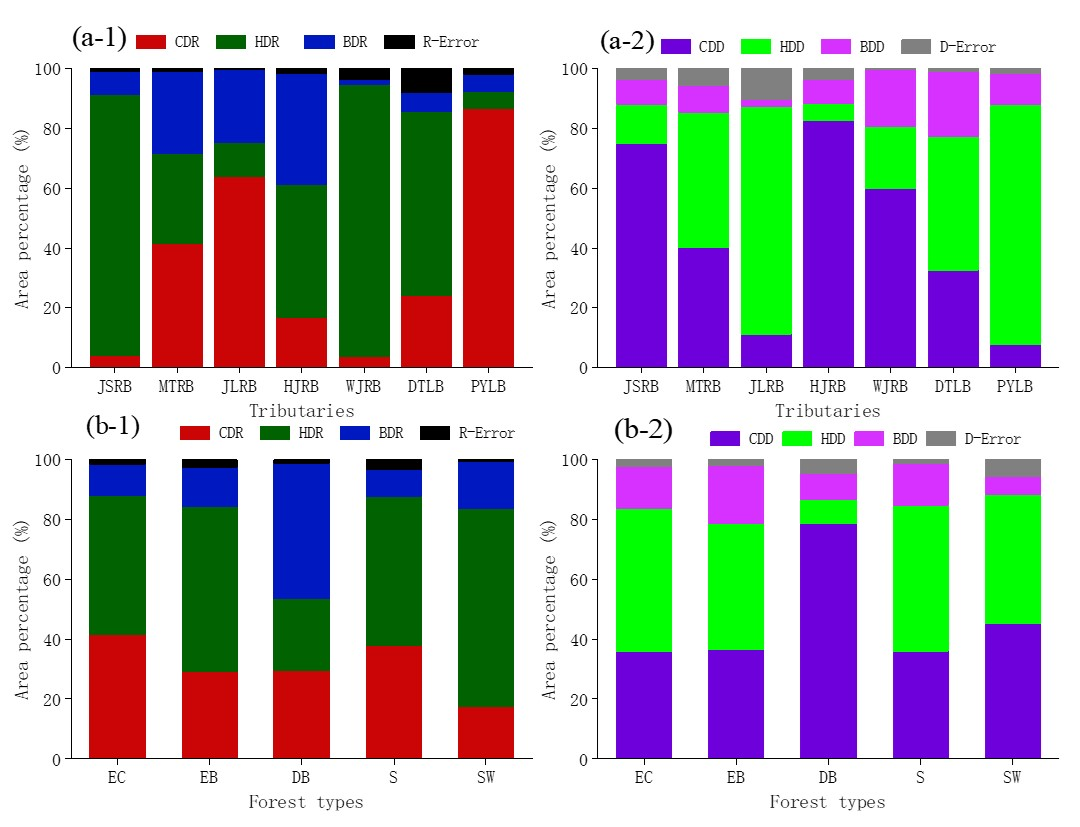
3.4.1. Contribution of Climate Variation and Anthropogenic Activities to Forest Restoration at the Tributary Level
3.4.2. Contribution of Climate Variations and Anthropogenic Activities to Forest Degradation at the Tributary Level
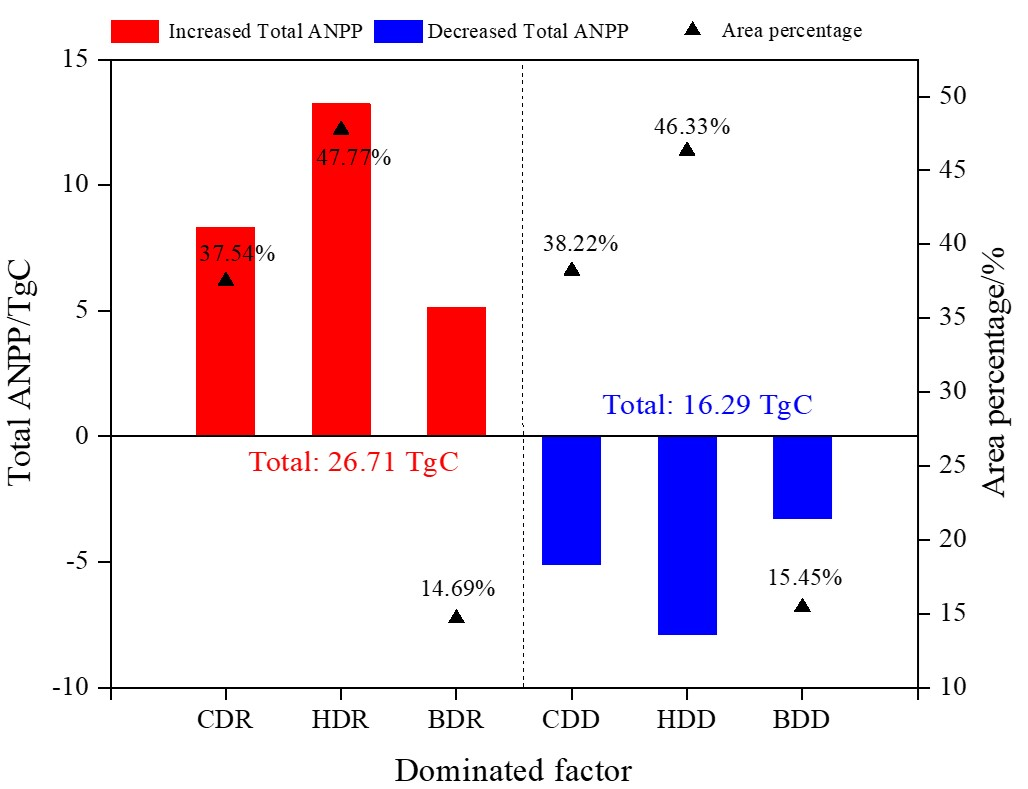
3.4.3. Contribution of Climate Variations and Anthropogenic Activities to Forest ANPP Dynamics in the Whole YRB
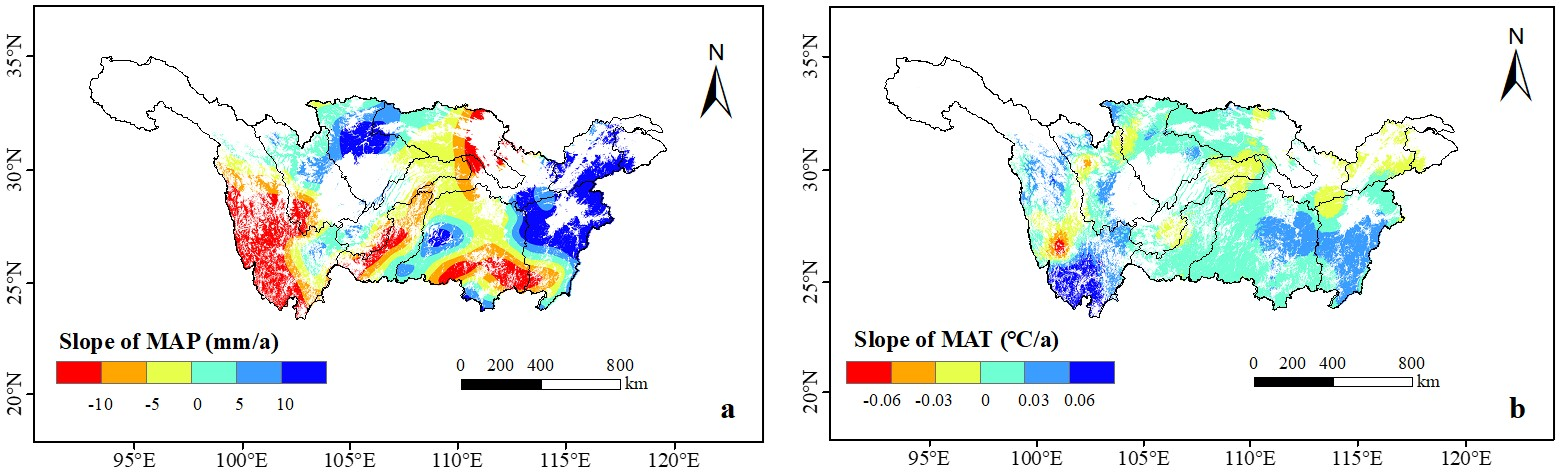
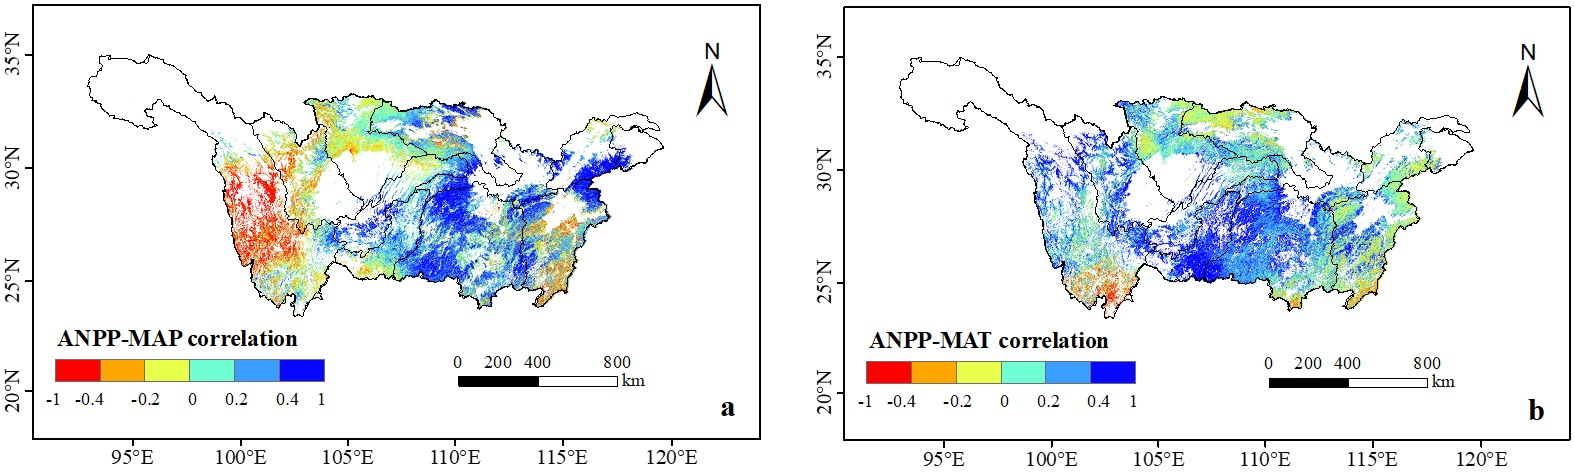
3.5. The Relationship between Forest ANPP and Climate Factors in the Whole YRB
4. Discussion
4.1. The Impact of Climate Variations on Forest ANPP Dynamic in the YRB
4.2. The Impact of Anthropogenic Activities on Forest ANPP Dynamic in the YRB
4.3. Limitation and Uncertainty
5. Conclusions
Author Contributions
Funding
Institutional Review Board Statement
Informed Consent Statement
Data Availability Statement
Conflicts of Interest
Abbreviations
| ANPP | Actual Net Primary Productivity |
| BDD | Both dominated the forest degradation |
| BDR | Both dominated forest restoration |
| CDD | Climate-dominated forest degradation |
| CDR | Climate-dominated forest restoration |
| DTLB | Dongting Lake basin |
| GTGP | Grain to Green Program |
| HDD | Human-dominated forest degradation |
| HDR | Human-dominated forest restoration |
| HJRB | Hanjiang River basin |
| HNPP | Human-induced Net Primary Productivity |
| JLRB | Jialing River basin |
| JSRB | Jinsha River basin |
| MAP | Mean annual precipitation |
| MAT | Mean annual temperature |
| MODIS | Moderate-resolution Imaging spectroradiometer |
| MTRB | Mintuo River basin |
| MAURYR | Mainstream area of the upper reaches of the Yangtze River |
| MAMRYR | Mainstream area of the middle reaches of the Yangtze River |
| MALRYR | Mainstream area of the lower reaches of the Yangtze River |
| NFCP | Natural Forest Conservation Program |
| NPP | Net Primary Productivity |
| PNPP | Potential Net Primary Productivity |
| PYLB | Poyang Lake basin |
| SDGs | Sustainable Development Goals |
| THLB | Taihu Lake basin |
| WJRB | Wujiang River basin |
| YRB | Yangtze River Basin |
References
- Pan, Y.; Birdsey, R.A.; Fang, J.; Houghton, R.; Kauppi, P.E.; Kurz, W.A.; Phillips, O.L.; Shvidenko, A.; Lewis, S.L.; Canadell, J.G.; et al. A large and persistent carbon sink in the world’s forests. Science 2011, 333, 988–993. [Google Scholar] [CrossRef] [PubMed] [Green Version]
- Negi, V.S.; Pathak, R.; Rawal, R.S.; Bhatt, I.D.; Sharma, S. Long-term ecological monitoring on forest ecosystems in Indian Himalayan Region: Criteria and indicator approach. Ecol. Indic. 2019, 102, 374–381. [Google Scholar] [CrossRef]
- Wang, C.; Jiang, Q.o.; Engel, B.; Mercado, J.A.V.; Zhang, Z. Analysis on net primary productivity change of forests and its multi–level driving mechanism—A case study in Changbai Mountains in Northeast China. Technol. Forecast. Soc. Chang. 2020, 153, 119939. [Google Scholar] [CrossRef]
- Matricardi, E.A.T.; Skole, D.L.; Costa, O.B.; Pedlowski, M.A.; Samek, J.H.; Miguel, E.P. Long-term forest degradation surpasses deforestation in the Brazilian Amazon. Science 2020, 369, 1378–1382. [Google Scholar] [CrossRef]
- Liu, S.Y.; Bai, J.J.; Chen, J. Measuring SDG 15 at the county scale: Localization and practice of SDGs indicators based on geospatial information. Isprs Int. J. Geo Inf. 2019, 8, 515. [Google Scholar] [CrossRef] [Green Version]
- Di Pasquale, G.; Saracino, A.; Bosso, L.; Russo, D.; Moroni, A.; Bonanomi, G.; Allevato, E. Coastal pine-oak glacial refugia in the mediterranean basin: A biogeographic approach based on charcoal analysis and spatial modelling. Forests 2020, 11, 673. [Google Scholar] [CrossRef]
- Msofe, N.; Sheng, L.; Lyimo, J. Land use change trends and their driving forces in the kilombero valley floodplain, southeastern tanzania. Sustainability 2019, 11, 505. [Google Scholar] [CrossRef] [Green Version]
- Zhao, M.; Running, S.W. Drought-induced reduction in global terrestrial net primary production from 2000 through 2009. Science 2010, 329, 940–943. [Google Scholar] [CrossRef] [Green Version]
- Jiang, L.; Guli, J.; Bao, A.; Guo, H.; Ndayisaba, F. Vegetation dynamics and responses to climate change and human activities in Central Asia. Sci. Total Environ. 2017, 599, 967–980. [Google Scholar] [CrossRef]
- Brown, P.T.; Ming, Y.; Li, W.; Hill, S.A. Change in the magnitude and mechanisms of global temperature variability with warming. Nat. Clim. Chang. 2017, 7, 743–748. [Google Scholar] [CrossRef] [Green Version]
- Piao, S.; Fang, J.; Ciais, P.; Peylin, P.; Huang, Y.; Sitch, S.; Wang, T. The carbon balance of terrestrial ecosystems in China. Nature 2009, 458, 1009–1013. [Google Scholar] [CrossRef] [PubMed]
- Tong, X.W.; Brandt, M.; Yue, Y.M.; Horion, S.; Wang, K.L.; De Keersmaecker, W.; Tian, F.; Schurgers, G.; Xiao, X.M.; Luo, Y.Q.; et al. Increased vegetation growth and carbon stock in China karst via ecological engineering. Nat. Sustain. 2018, 1, 44–50. [Google Scholar] [CrossRef]
- Piao, S.; Wang, X.; Park, T.; Chen, C.; Lian, X.; He, Y.; Bjerke, J.W.; Chen, A.; Ciais, P.; Tømmervik, H.; et al. Characteristics, drivers and feedbacks of global greening. Nat. Rev. Earth Environ. 2019, 1, 14–27. [Google Scholar] [CrossRef]
- Yang, Y.; Saatchi, S.S.; Xu, L.; Yu, Y.; Choi, S.; Phillips, N.; Kennedy, R.; Keller, M.; Knyazikhin, Y.; Myneni, R.B. Post-drought decline of the Amazon carbon sink. Nat. Commun. 2018, 9, 3172. [Google Scholar] [CrossRef] [PubMed]
- Khoury, S.; Coomes, D.A. Resilience of Spanish forests to recent droughts and climate change. Glob. Chang. Biol. 2020, 26, 7079–7098. [Google Scholar] [CrossRef]
- Chen, C.; Park, T.; Wang, X.; Piao, S.; Xu, B.; Chaturvedi, R.K.; Fuchs, R.; Brovkin, V.; Ciais, P.; Fensholt, R.; et al. China and India lead in greening of the world through land-use management. Nat. Sustain. 2019, 2, 122–129. [Google Scholar] [CrossRef]
- Ouyang, Z.; Zheng, H.; Xiao, Y.; Polasky, S.; Liu, J.; Xu, W.; Wang, Q.; Zhang, L.; Xiao, Y.; Rao, E.; et al. Improvements in ecosystem services from investments in natural capital. Science 2016, 352, 1455–1459. [Google Scholar] [CrossRef]
- Lu, F.; Hu, H.; Sun, W.; Zhu, J.; Liu, G.; Zhou, W.; Zhang, Q.; Shi, P.; Liu, X.; Wu, X.; et al. Effects of national ecological restoration projects on carbon sequestration in China from 2001 to 2010. Proc. Natl. Acad. Sci. USA 2018, 115, 4039–4044. [Google Scholar] [CrossRef] [Green Version]
- Wang, G.; Guan, D.; Xiao, L.; Peart, M.R. Forest biomass-carbon variation affected by the climatic and topographic factors in Pearl River Delta, South China. J. Environ. Manag. 2019, 232, 781–788. [Google Scholar] [CrossRef]
- Li, J.; Wang, Z.; Lai, C.; Wu, X.; Zeng, Z.; Chen, X.; Lian, Y. Response of net primary production to land use and land cover change in mainland China since the late 1980s. Sci. Total Environ. 2018, 639, 237–247. [Google Scholar] [CrossRef]
- Wu, S.; Zhou, S.; Chen, D.; Wei, Z.; Dai, L.; Li, X. Determining the contributions of urbanisation and climate change to NPP variations over the last decade in the Yangtze River Delta, China. Sci. Total Environ. 2014, 472, 397–406. [Google Scholar] [CrossRef]
- Tian, G.; Qiao, Z. Assessing the impact of the urbanization process on net primary productivity in China in 1989–2000. Environ. Pollut. 2014, 184, 320–326. [Google Scholar] [CrossRef]
- Pei, F.; Li, X.; Liu, X.; Wang, S.; He, Z. Assessing the differences in net primary productivity between pre- and post-urban land development in China. Agric. For. Meteorol. 2013, 171, 174–186. [Google Scholar] [CrossRef]
- Piao, S.; Fang, J.; He, J. Variations in vegetation net primary production in the Qinghai-Xizang Plateau, China, from 1982 to 1999. Clim. Chang. 2006, 74, 253–267. [Google Scholar] [CrossRef]
- Zhang, F.Y.; Zhang, Z.X.; Kong, R.; Chang, J.; Tian, J.X.; Zhu, B.; Jiang, S.S.; Chen, X.; Xu, C.Y. Changes in forest net primary productivity in the yangtze river basin and its relationship with climate change and human activities. Remote Sens. 2019, 11, 1451. [Google Scholar] [CrossRef] [Green Version]
- Pettorelli, N.; Vik, J.O.; Mysterud, A.; Gaillard, J.M.; Tucker, C.J.; Stenseth, N.C. Using the satellite-derived NDVI to assess ecological responses to environmental change. Trends Ecol. Evol. 2005, 20, 503–510. [Google Scholar] [CrossRef] [PubMed]
- Wang, Y.; Zhang, Z.; Chen, X. Quantifying influences of natural and anthropogenic factors on vegetation changes based on geodetector: A case study in the Poyang Lake Basin, China. Remote Sens. 2021, 13, 5081. [Google Scholar] [CrossRef]
- Nie, T.; Dong, G.; Jiang, X.; Lei, Y. Spatio-temporal changes and driving forces of vegetation coverage on the loess plateau of Northern Shaanxi. Remote Sens. 2021, 13, 613. [Google Scholar] [CrossRef]
- Xiu, L.; Yao, X.; Chen, M.; Yan, C. Effect of ecological construction engineering on vegetation restoration: A case study of the loess plateau. Remote Sens. 2021, 13, 1407. [Google Scholar] [CrossRef]
- Xu, D.Y.; Kang, X.W.; Zhuang, D.F.; Pan, J.J. Multi-scale quantitative assessment of the relative roles of climate change and human activities in desertification—A case study of the Ordos Plateau, China. J. Arid Environ. 2010, 74, 498–507. [Google Scholar] [CrossRef]
- Teng, M.; Zeng, L.; Hu, W.; Wang, P.; Yan, Z.; He, W.; Zhang, Y.; Huang, Z.; Xiao, W. The impacts of climate changes and human activities on net primary productivity vary across an ecotone zone in Northwest China. Sci. Total Environ. 2020, 714, 136691. [Google Scholar] [CrossRef] [PubMed]
- Liu, Y.Y.; Zhang, Z.Y.; Tong, L.J.; Khalifa, M.; Wang, Q.; Gang, C.C.; Wang, Z.Q.; Li, J.L.; Sun, Z.G. Assessing the effects of climate variation and human activities on grassland degradation and restoration across the globe. Ecol. Indic. 2019, 106, 105504. [Google Scholar] [CrossRef]
- Naeem, S.; Zhang, Y.; Tian, J.; Qamer, F.M.; Latif, A.; Paul, P.K. Quantifying the impacts of anthropogenic activities and climate variations on vegetation productivity changes in China from 1985 to 2015. Remote Sens. 2020, 12, 1113. [Google Scholar] [CrossRef] [Green Version]
- Qu, S.; Wang, L.C.; Lin, A.W.; Zhu, H.J.; Yuan, M.X. What drives the vegetation restoration in Yangtze River basin, China: Climate change or anthropogenic factors? Ecol. Indic. 2018, 90, 438–450. [Google Scholar] [CrossRef]
- Li, D.J.; Xu, D.Y.; Wang, Z.Y.; You, X.G.; Zhang, X.Y.; Song, A.L. The dynamics of sand-Stabilization services in Inner Mongolia, China from 1981 to 2010 and its relationship with climate change and human activities. Ecol. Indic. 2018, 88, 351–360. [Google Scholar] [CrossRef]
- Lin, Y.Y.; Qiu, R.Z.; Yao, J.X.; Hu, X.S.; Lin, J.G. The effects of urbanization on China’s forest loss from 2000 to 2012: Evidence from a panel analysis. J. Clean. Prod. 2019, 214, 270–278. [Google Scholar] [CrossRef]
- Hu, Y.; Peng, J.; Liu, Y.; Tian, L. Integrating ecosystem services trade-offs with paddy land-to-dry land decisions: A scenario approach in Erhai Lake Basin, southwest China. Sci. Total Environ. 2018, 625, 849–860. [Google Scholar] [CrossRef]
- Wang, Y.; Zhao, J.; Fu, J.; Wei, W. Effects of the grain for green program on the water ecosystem services in an arid area of China—Using the Shiyang River Basin as an example. Ecol. Indic. 2019, 104, 659–668. [Google Scholar] [CrossRef]
- Zhang, Y.L.; Song, C.H.; Zhang, K.R.; Cheng, X.L.; Band, L.E.; Zhang, Q.F. Effects of land use/land cover and climate changes on terrestrial net primary productivity in the Yangtze River Basin, China, from 2001 to 2010. J. Geophys. Res. Biogeosci. 2014, 119, 1092–1109. [Google Scholar] [CrossRef]
- Wang, J.Y.; Delang, C.O.; Hou, G.L.; Gao, L.; Lu, X.X. Net primary production increases in the Yangtze River Basin within the latest two decades. Glob. Ecol. Conserv. 2021, 26, e01497. [Google Scholar] [CrossRef]
- Ye, X.-c.; Liu, F.-h.; Zhang, Z.-x.; Xu, C.-y.; Liu, J. Spatio-temporal variations of vegetation carbon use efficiency and potential driving meteorological factors in the Yangtze River Basin. J. Mt. Sci. 2020, 17, 1959–1973. [Google Scholar] [CrossRef]
- Turner, D.P.; Ritts, W.D.; Cohen, W.B.; Gower, S.T.; Running, S.W.; Zhao, M.S.; Costa, M.H.; Kirschbaum, A.A.; Ham, J.M.; Saleska, S.R.; et al. Evaluation of MODIS NPP and GPP products across multiple biomes. Remote Sens. Environ. 2006, 102, 282–292. [Google Scholar] [CrossRef]
- Zhou, W.; Yang, H.; Huang, L.; Chen, C.; Lin, X.S.; Hu, Z.J.; Li, J.L. Grassland degradation remote sensing monitoring and driving factors quantitative assessment in China from 1982 to 2010. Ecol. Indic. 2017, 83, 303–313. [Google Scholar] [CrossRef]
- Kong, R.; Zhang, Z.; Zhang, F.; Tian, J.; Chang, J.; Jiang, S.; Zhu, B.; Chen, X. Increasing carbon storage in subtropical forests over the Yangtze River basin and its relations to the major ecological projects. Sci. Total Environ. 2020, 709, 136163. [Google Scholar] [CrossRef] [PubMed]
- Chen, T.; Bao, A.; Jiapaer, G.; Guo, H.; Zheng, G.; Jiang, L.; Chang, C.; Tuerhanjiang, L. Disentangling the relative impacts of climate change and human activities on arid and semiarid grasslands in Central Asia during 1982-2015. Sci. Total Environ. 2019, 653, 1311–1325. [Google Scholar] [CrossRef] [PubMed]
- Qu, S.; Wang, L.C.; Lin, A.W.; Yu, D.Q.; Yuan, M.X.; Li, C.A. Distinguishing the impacts of climate change and anthropogenic factors on vegetation dynamics in the Yangtze River Basin, China. Ecol. Indic. 2020, 108, 105724. [Google Scholar] [CrossRef]
- Fan, X.; Liu, Y.; Tao, J.; Wang, Y.; Zhou, H. MODIS detection of vegetation changes and investigation of causal factors in Poyang Lake basin, China for 2001–2015. Ecol. Indic. 2018, 91, 511–522. [Google Scholar] [CrossRef]
- Gourdji, S.M.; Sibley, A.M.; Lobell, D.B. Global crop exposure to critical high temperatures in the reproductive period: Historical trends and future projections. Environ. Res. Lett. 2013, 8, 024041. [Google Scholar] [CrossRef]
- Lai, C.G.; Li, J.; Wang, Z.L.; Wu, X.Q.; Zeng, Z.Y.; Chen, X.H.; Lian, Y.Q.; Yu, H.J.; Wang, P.; Bai, X.Y. Drought-induced reduction in net primary productivity across mainland China from 1982 to 2015. Remote Sens. 2018, 10, 1433. [Google Scholar] [CrossRef] [Green Version]
- Wang, W.; Wang, J.; Liu, X.; Zhou, G.; Yan, J. Decadal drought deaccelerated the increasing trend of annual net primary production in tropical or subtropical forests in southern China. Sci. Rep. 2016, 6, 28640. [Google Scholar] [CrossRef] [Green Version]
- Yu, L.; Wu, Z.T.; Du, Z.Q.; Zhang, H.; Liu, Y. Insights on the roles of climate and human activities to vegetation degradation and restoration in Beijing-Tianjin sandstorm source region. Ecol. Eng. 2021, 159, 106105. [Google Scholar] [CrossRef]
- Liu, D.; Chen, Y.; Cai, W.; Dong, W.; Xiao, J.; Chen, J.; Zhang, H.; Xia, J.; Yuan, W. The contribution of China’s grain to green program to carbon sequestration. Landsc. Ecol. 2014, 29, 1675–1688. [Google Scholar] [CrossRef]
- Yin, L.; Dai, E.F.; Zheng, D.; Wang, Y.H.; Ma, L.; Tong, M. What drives the vegetation dynamics in the Hengduan Mountain region, southwest China: Climate change or human activity? Ecol. Indic. 2020, 112, 106013. [Google Scholar] [CrossRef]
- Xu, X.; Tan, Y.; Yang, G.; Li, H.; Su, W. Impacts of China’s three gorges dam project on net primary productivity in the reservoir area. Sci. Total Environ. 2011, 409, 4656–4662. [Google Scholar] [CrossRef]
- Zhou, Y.Y.; Yue, D.X.; Guo, J.J.; Chao, Z.Z.; Meng, X.M. Assessing the impact of land conversion and management measures on the net primary productivity in the Bailong River Basin, in China. Catena 2021, 207, 105672. [Google Scholar] [CrossRef]
- Chen, S.; Wen, Z.; Zhang, S.; Huang, P.; Ma, M.; Zhou, X.; Liao, T.; Wu, S. Effects of long-term and large-scale ecology projects on forest dynamics in Yangtze River Basin, China. For. Ecol. Manag. 2021, 496, 119463. [Google Scholar] [CrossRef]
- Wang, L.X.; Li, Z.W.; Wang, D.Y.; Chen, J.; Liu, Y.J.; Nie, X.D.; Zhang, Y.T.; Ning, K.; Hu, X.Q. Unbalanced social-ecological development within the Dongting Lake basin: Inspiration from evaluation of ecological restoration projects. J. Clean. Prod. 2021, 315, 128161. [Google Scholar] [CrossRef]
- Liu, F.H.; Xu, C.Y.; Yang, X.X.; Ye, X.C. Controls of climate and land-use change on terrestrial net primary productivity variation in a subtropical humid basin. Remote Sens. 2020, 12, 3525. [Google Scholar] [CrossRef]


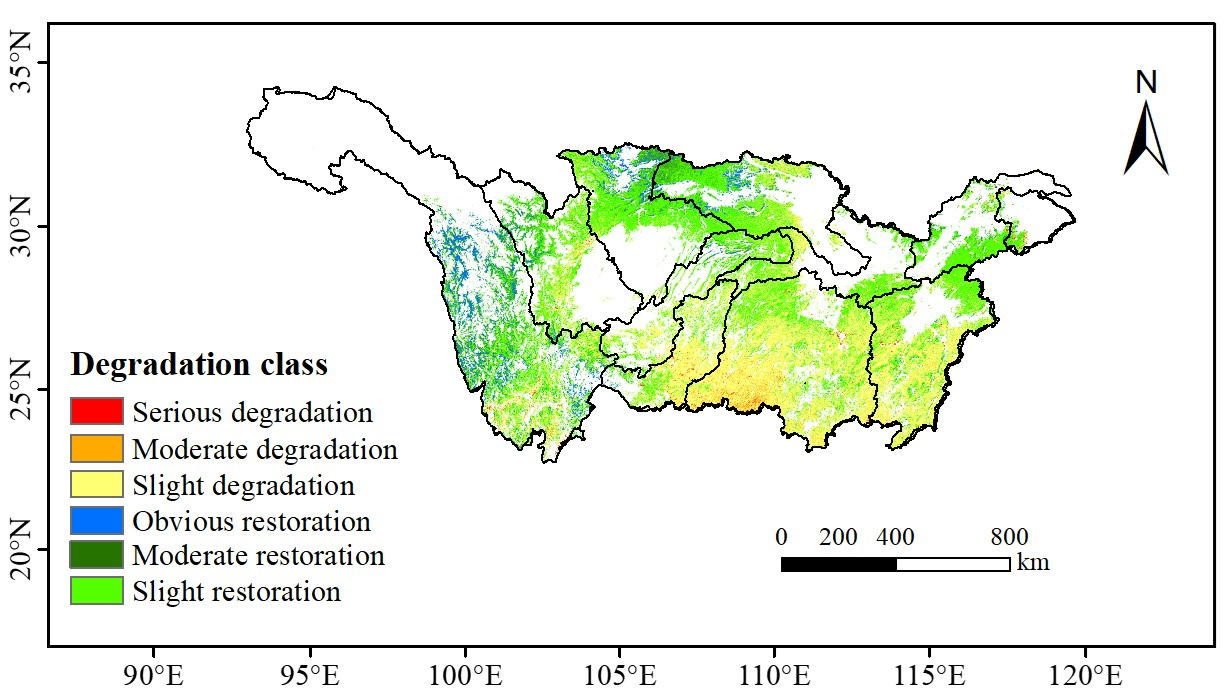
| Forest Status | Slope | p-Value | Degree of Forest Dynamic |
|---|---|---|---|
| Forest restoration | Slope > 0 | p > 0.05 | Slight forest restoration |
| Slope > 0 | 0.01 < p < 0.05 | Moderate forest restoration | |
| Slope > 0 | p < 0.01 | Obvious forest restoration | |
| Forest degradation | Slope < 0 | p > 0.05 | Slight forest degradation |
| Slope < 0 | 0.01 < p < 0.05 | Moderate forest degradation | |
| Slope < 0 | p < 0.01 | Serious forest degradation |
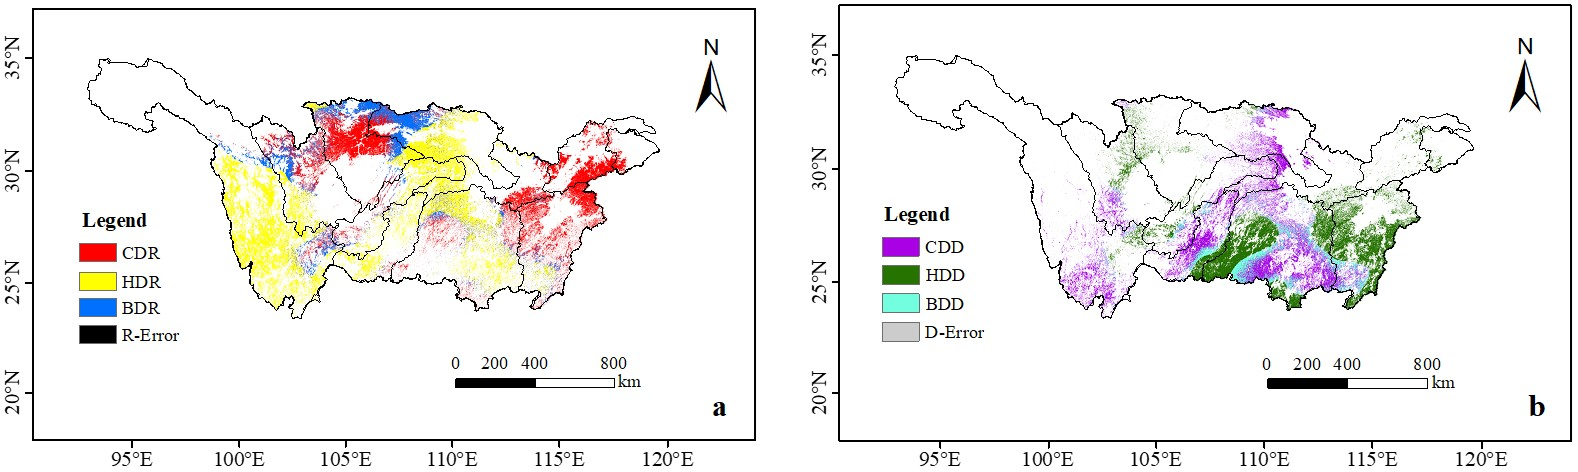
| Forest Status | Scenario | SANPP | SPNPP | SHNPP | Dominant Driving Force |
|---|---|---|---|---|---|
| Forest restoration | 1 | >0 | >0 | >0 | Climate-dominated forest restoration (CDR) |
| 2 | >0 | <0 | <0 | Human-dominated forest restoration (HDR) | |
| 3 | >0 | >0 | <0 | Both dominated forest restoration (BDR) | |
| 4 | >0 | <0 | >0 | Neither Affected the forest restoration (R-Error) | |
| Forest degradation | 5 | <0 | <0 | <0 | Climate-dominated forest degradation (CDD) |
| 6 | <0 | >0 | >0 | Human-dominated forest degradation (HDD) | |
| 7 | <0 | <0 | >0 | Both dominated the forest degradation (BDD) | |
| 8 | <0 | >0 | <0 | Neither Affected the forest degradation (D-Error) |
| Region | Forest Restoration Region | Forest Degradation Region | ||
|---|---|---|---|---|
| Area/104 km2 | Total ANPP/TgC | Area/104 km2 | Total ANPP/TgC | |
| JSRB | 11.50 | 10.40 | 2.87 | −1.41 |
| MTRB | 4.19 | 2.31 | 1.56 | −0.71 |
| JLRB | 7.21 | 4.70 | 0.84 | −0.19 |
| HJRB | 5.96 | 3.89 | 1.75 | −0.61 |
| WJRB | 1.74 | 0.55 | 3.72 | −1.79 |
| DTLB | 5.53 | 1.27 | 14.83 | −7.49 |
| PYLB | 4.61 | 1.44 | 7.18 | −3.52 |
| Forest Type | Forest Restoration Region | Forest Degradation Region | ||
|---|---|---|---|---|
| Area/104 km2 | Total ANPP/Tg C | Area/104 km2 | Total ANPP/Tg C | |
| Evergreen coniferous forest | 26.48 | 13.98 | 16.10 | −6.65 |
| Evergreen broad-leaved forest | 10.33 | 5.79 | 8.95 | −4.54 |
| Deciduous broad-leaved forest | 4.87 | 3.92 | 1.07 | −0.42 |
| Shrubs | 6.90 | 2.46 | 9.86 | −4.54 |
| Sparse woods | 0.93 | 0.56 | 0.38 | −0.14 |
| Region | Croplands | Forests | Grasslands | Waters | Urban | Barren |
|---|---|---|---|---|---|---|
| JSRB | −553 | 114 | −276 | 299 | 524 | −107 |
| MTRB | −1178 | −186 | 198 | 127 | 988 | 53 |
| JLRB | −1324 | 152 | 102 | 78 | 922 | 71 |
| HJRB | −1235 | −154 | 78 | 465 | 839 | 7 |
| WJRB | −403 | 384 | −649 | 39 | 633 | −3 |
| DTLB | −1545 | −218 | −578 | 320 | 2026 | −4 |
| PYLB | −663 | −616 | 22 | 205 | 1309 | −257 |
| YRB | −15,004 | −637 | −1358 | 2422 | 14,917 | −227 |
Publisher’s Note: MDPI stays neutral with regard to jurisdictional claims in published maps and institutional affiliations. |
© 2022 by the authors. Licensee MDPI, Basel, Switzerland. This article is an open access article distributed under the terms and conditions of the Creative Commons Attribution (CC BY) license (https://creativecommons.org/licenses/by/4.0/).
Share and Cite
Wang, Y.; Zhang, Z.; Chen, X. The Dominant Driving Force of Forest Change in the Yangtze River Basin, China: Climate Variation or Anthropogenic Activities? Forests 2022, 13, 82. https://doi.org/10.3390/f13010082
Wang Y, Zhang Z, Chen X. The Dominant Driving Force of Forest Change in the Yangtze River Basin, China: Climate Variation or Anthropogenic Activities? Forests. 2022; 13(1):82. https://doi.org/10.3390/f13010082
Chicago/Turabian StyleWang, Yiming, Zengxin Zhang, and Xi Chen. 2022. "The Dominant Driving Force of Forest Change in the Yangtze River Basin, China: Climate Variation or Anthropogenic Activities?" Forests 13, no. 1: 82. https://doi.org/10.3390/f13010082
APA StyleWang, Y., Zhang, Z., & Chen, X. (2022). The Dominant Driving Force of Forest Change in the Yangtze River Basin, China: Climate Variation or Anthropogenic Activities? Forests, 13(1), 82. https://doi.org/10.3390/f13010082