Article

The Effectiveness of Soil Extracts from Selangor Peat Swamp and Pristine Forest Soils on the Growth of Green Microalgae sp.

by
Nor Suhaila Yaacob
1,2,*,
Mohd Fadzli Ahmad
1,3,
Ashvini Sivam
3,
Emi Fazlina Hashim
3,4,
Maegala Nallapan Maniyam
1,2,
Fridelina Sjahrir
3,
Noor Fazreen Dzulkafli
3,
Wan Muhammad Ikram Wan Mohd Zamri
3,
Kazuhiro Komatsu
5,
Victor S. Kuwahara
4 and
Hasdianty Abdullah
1,3
1
Institute of Bio-IT Selangor, Universiti Selangor, Jalan Zirkon A7/A, Seksyen 7, Shah Alam 40000, Malaysia
2
Centre for Foundation and General Studies, Universiti Selangor, Jalan Zirkon A7/A, Seksyen 7, Shah Alam 40000, Malaysia
3
Department of Science & Biotechnology, Faculty of Engineering & Life Sciences, Universiti Selangor, Bestari Jaya 45600, Malaysia
4
Faculty of Education & Graduate School of Engineering Soka University, 1-236 Tangi-Machi, Hachioji-Shi 192-8577, Japan
5
National Institute for Environmental Studies, 16-2 Onogawa, Ibaraki, Tsukuba 305-8506, Japan
*
Author to whom correspondence should be addressed.
Forests 2022, 13(1), 79; https://doi.org/10.3390/f13010079
Submission received: 28 October 2021 / Revised: 31 December 2021 / Accepted: 4 January 2022 / Published: 7 January 2022
(This article belongs to the Special Issue Soil Biology and Biochemistry of Forests)

Abstract

:
Microalgae are widely utilized in commercial industries. The addition of a modified artificial medium (soil extract) could enhance their growth. Soil extract collected from the Raja Musa peat swamp and mineral soil from the Ayer Hitam Forest Reserve (AHFR), Selangor, Malaysia, were treated using various extraction methods. Carteria radiosa PHG2-A01, Neochloris conjuncta, and Nephrochlamys subsolitaria were grown in microplates at 25 °C, light intensity 33.75 µmol photons m−2s−1 for 9 days. N. conjuncta dominated the growth in 121 °C twice extraction method AFHR samples, with 47.17% increment. The highest concentrations of ammonia and nitrate were detected in the medium with soil extract treated with 121 °C twice extraction method, yielding the concentrations of 2 mg NL−1 and 35 mg NL−1 for ammonia and nitrate of RM soil and 2 mg NL−1 and 2.85 mg NL−1 for the AH soil. These extracts are proved successful as a microalgal growth stimulant, increasing revenue and the need for enriched medium. The high rate of nutrient recovery has the potential to serve as a growth promoter for microalgae.

1. Introduction

In recent years, the interest in microalgal cultivation has noticeably increased among researchers due to its nutritional values; however, their cultivation only started actively over the last three decades [1,2]. Japan was the first country to embark on microalgae cultivation in the 1960s, with Chlorella as the first microalgae cultivated for commercial application [2,3]. Microalgae have been reputed as one of the best sources in developing various products (biofuel, fodder additives, polysaccharides, dyes, food additives, unsaturated fatty acids, and antioxidants) used in various industries [4]. Furthermore, microalgae contribution significantly impacts industries like food and pharmaceuticals, cosmetics, biofertilisers, nutraceutical, bioplastic, and aquaculture feed [5,6,7]. In addition, some microalgae are viable because of their high lipid content for biofuel production [8,9] and are utilised as nutritional supplements or as a source of food due to their important nutritional ingredients [10,11].
Good and healthy soil is represented by sufficient air, water, minerals, and organic materials to promote and sustain plants. Animal and plant tissues in sediments and soils form humic substances by biochemical transformation. Humus found either in aqueous soil extracts (SE) or dissolved naturally largely consists of biologically active fulvo-humic fractions.
Although microalgae biomass is widely used, applications on a commercial scale are still limited because of the low yield and high cost of microalgal products [12]. For instance, in the open sea, and thus in aquaculture, microalgae have an essential dietary role to marine animals [13]. Moreover, all marine invertebrates are microalgae-dependent for their entire lives and utilised as live feed [14,15].
Typically, microalgae can be discovered in both freshwater and marine habitats, usually as single-celled photosynthetic autotrophic organisms [16]. They could produce complex compounds such as carbohydrates, protein, and lipids from simple elements in their surroundings. Microalgae require basic nutrients for growth, besides light, carbon dioxide, and carbon, from the air to produce energy [6]. The cultivation of marine microalgae requires phosphate fertilisers, nitrate, and some micronutrients such as manganese (Mn), copper (Cu), cobalt (Co), and zinc (Zn). These elements in the growth media [17] are essential for processes such as energy storage and photosynthesis [18].
In the growth of microalgal biomass, the culture medium plays a significant role and crucial in microalgae cultivation. The culture medium components should satisfy the basic requirements for optimum energy supply [19]. However, culture medium alone is not adequate for microalgal growth; most marine algae require certain organic soil extract growing factors. In addition, the source of vitamins, hormones, and other micronutrients found in soil extract further enhanced growth. Similarly, artificial medium could also augment the growth of open ocean and coastal microalgal species.
Few studies also suggest that natural “growth-promoting nutrients” (GPN), such as soil extract, could also enhance the growth of microalgae due to its composition of nitrogen, sulphur, phosphorus, and magnesium [20,21]. These components are essential in producing high-quality microalgae biomass [22] as they promote faster cell division, besides increasing cell density and the growth rate of microalgae [23]. A previous study showed that soil extract contains the microelements beneficial for microalgae cultivation, and it has been proven that soil extract can establish rapid reproduction and growth in certain microalgae [2].
The significant growth of industry and urban development leads to the increased use of heavy metals, causing serious environmental problems to the soil and the environment. Because algae play a role as primary producers in most aquatic ecosystems, estimating the heavy metal effects on the growth and photosynthesis of algae is vital in assessing the ecological impact of heavy metals [24]. Heavy metals are highly abundant in nature, with Cu and Zn functioning as essential elements to microalgae and plants, while chromium (Cr), cadmium (Cd), and lead (Pb) are scarcely beneficial biologically [25]. Cu is a key component in the electron transport chains and a co-enzyme factor that plays a significant role in plant photosynthesis and respiration. Meanwhile, Zn is a basic component of various enzymes involved in photosynthesis and metabolism, such as carbon anhydride, acidic phosphatase, and alkaline phosphatase. Both Cu and Zn are vital in the promotion of plant growth factors. If lacking either element, the plant’s rate of growth and photosynthesis will be greatly reduced.
Despite their benefits at minute concentrations, both metals may become toxic at higher levels. Unlike Cu and Zn, the heavy metals Cr, Cd, and Pb are unnecessary for plant growth or respiration. However, the rapid industrial growth produces a great quantity of Cr, Cd, and Pb deposited into the environment, resulting in adverse effects on plants. Being the most toxic heavy metal to plants, the toxicity of Cr is form-dependent. Meanwhile, Cd, a potentially toxic metal that is very stable in the aquatic environment, can directly affect the physiological processes of algae. Similarly, Pb is easily accumulated by algae, becoming a toxic influence.
Microalgae are diverse organisms with rapid growth rates and productivity and could live under extreme environments because of their unicellular or simple multicell structure. Microalgae are commonly used as biosensors in environmental analyses and monitoring due to their high sensitivity and specificity in detecting heavy metal pollutants because they are the primary producers at the bottom of the aquatic food chain, first organisms affected by heavy metal pollution. Studies have shown that microalgae possess extracellular and intracellular mechanisms to resist metal toxicity, including the ability to absorb a certain amount of heavy metals. Heavy metals may enter algal cells by active transportation or endocytosis, with the help of chelating proteins such as phytochelatin and class II metallothioneins; thus, reducing heavy metal toxicity. These chelating proteins form complexes with heavy metals and transfer them to intracellular vacuoles. However, toxicity occurs when the amount of accumulated heavy metals exceeds a critical concentration. The binding of heavy metal ions to sulfhydryl groups in the protein cysteine and the disruption of protein structure or displacement of essential elements will eventually affect the physiological and biochemical processes of the microalgae.
Though the positive effects of Growth-Promoting Agent (GPN) extracted from the soil are well known, very few studies have focussed on applying soil extracts from tropical rainforests and the effect of heavy metals on commercially exploitable, high-value microalgae. To the best of our knowledge, this research is the first attempt in investigating the effect of GNP from the virgin rainforest in a tropical climate. In this regard, this study aims to find the natural growth promoters and study the effectiveness of various soil extracts as well as heavy metals in soil on the targeted microalgae growth. In addition, a 96-well plate culturing method was adopted in this research to decrease the time and cost for a high throughput study of microalgae growth. This has subsequently contributed to the cost-effective production of microalgae with a cheaper medium.

2. Results

2.1. Soil Properties Analysis

Table 1 illustrates the soil properties analysis conducted at Raja Musa Forest Reserve (RMFR) and Ayer Hitam Forest Reserve (AHFR) soil samples. According to the analysis result, Raja Musa and Ayer Hitam soils exhibit low pH values of 3.36 and 5.81, respectively, which are acidic. The soil collected from Raja Musa is composed of 42.48% sand, while Ayer Hitam soil contains 33.69%, which is 21% less than Raja Musa soil. The Ayer Hitam soil is also composed of 58.3% silt and 8.01% clay, 12% and 18.6% higher than Raja Musa soils at 50.95% silt and 6.52% clay, characterising the soil texture. In comparison, soil from Ayer Hitam comprises 33.69% sand, 58.3% silt, and 8.01% clay.
All analysed metals accumulated in the soil and were extracted at varying concentrations (Table 2). Results of the three replicate assays are expressed as mean ± standard deviation. According to the chemical analysis of soils RMFR and AHFR, it can be concluded that the concentration of organic matter in Raja Musa and Ayer Hitam soil exhibit a range of 5.03% and 5.23% of total organic carbon (TOC), 0.28% and 0.35% of N, and 1.07% and 1.49% of P, respectively. Ayer Hitam shows the highest potassium of 886.77 mg/kg while RMFR contain only 3.66 mg/kg. Meanwhile, the level of trace elements present in the soil of RMFR exhibits a very low concentration range of arsenic (As), cadmium (Cd), chromium (Cr), chromium hexavalent [Cr(VI)], nickel (Ni), mercury (Hg), and silver (Ag). By contrast, the heavy metal present in AHFR soil exhibits a higher level of Fe, 1905.48%, than other heavy metals. Meanwhile, the low Cd, Ni, Hg, and Ag levels could not be determined. Nutrient and heavy metals content were totally reduced in soil extract for both locations.

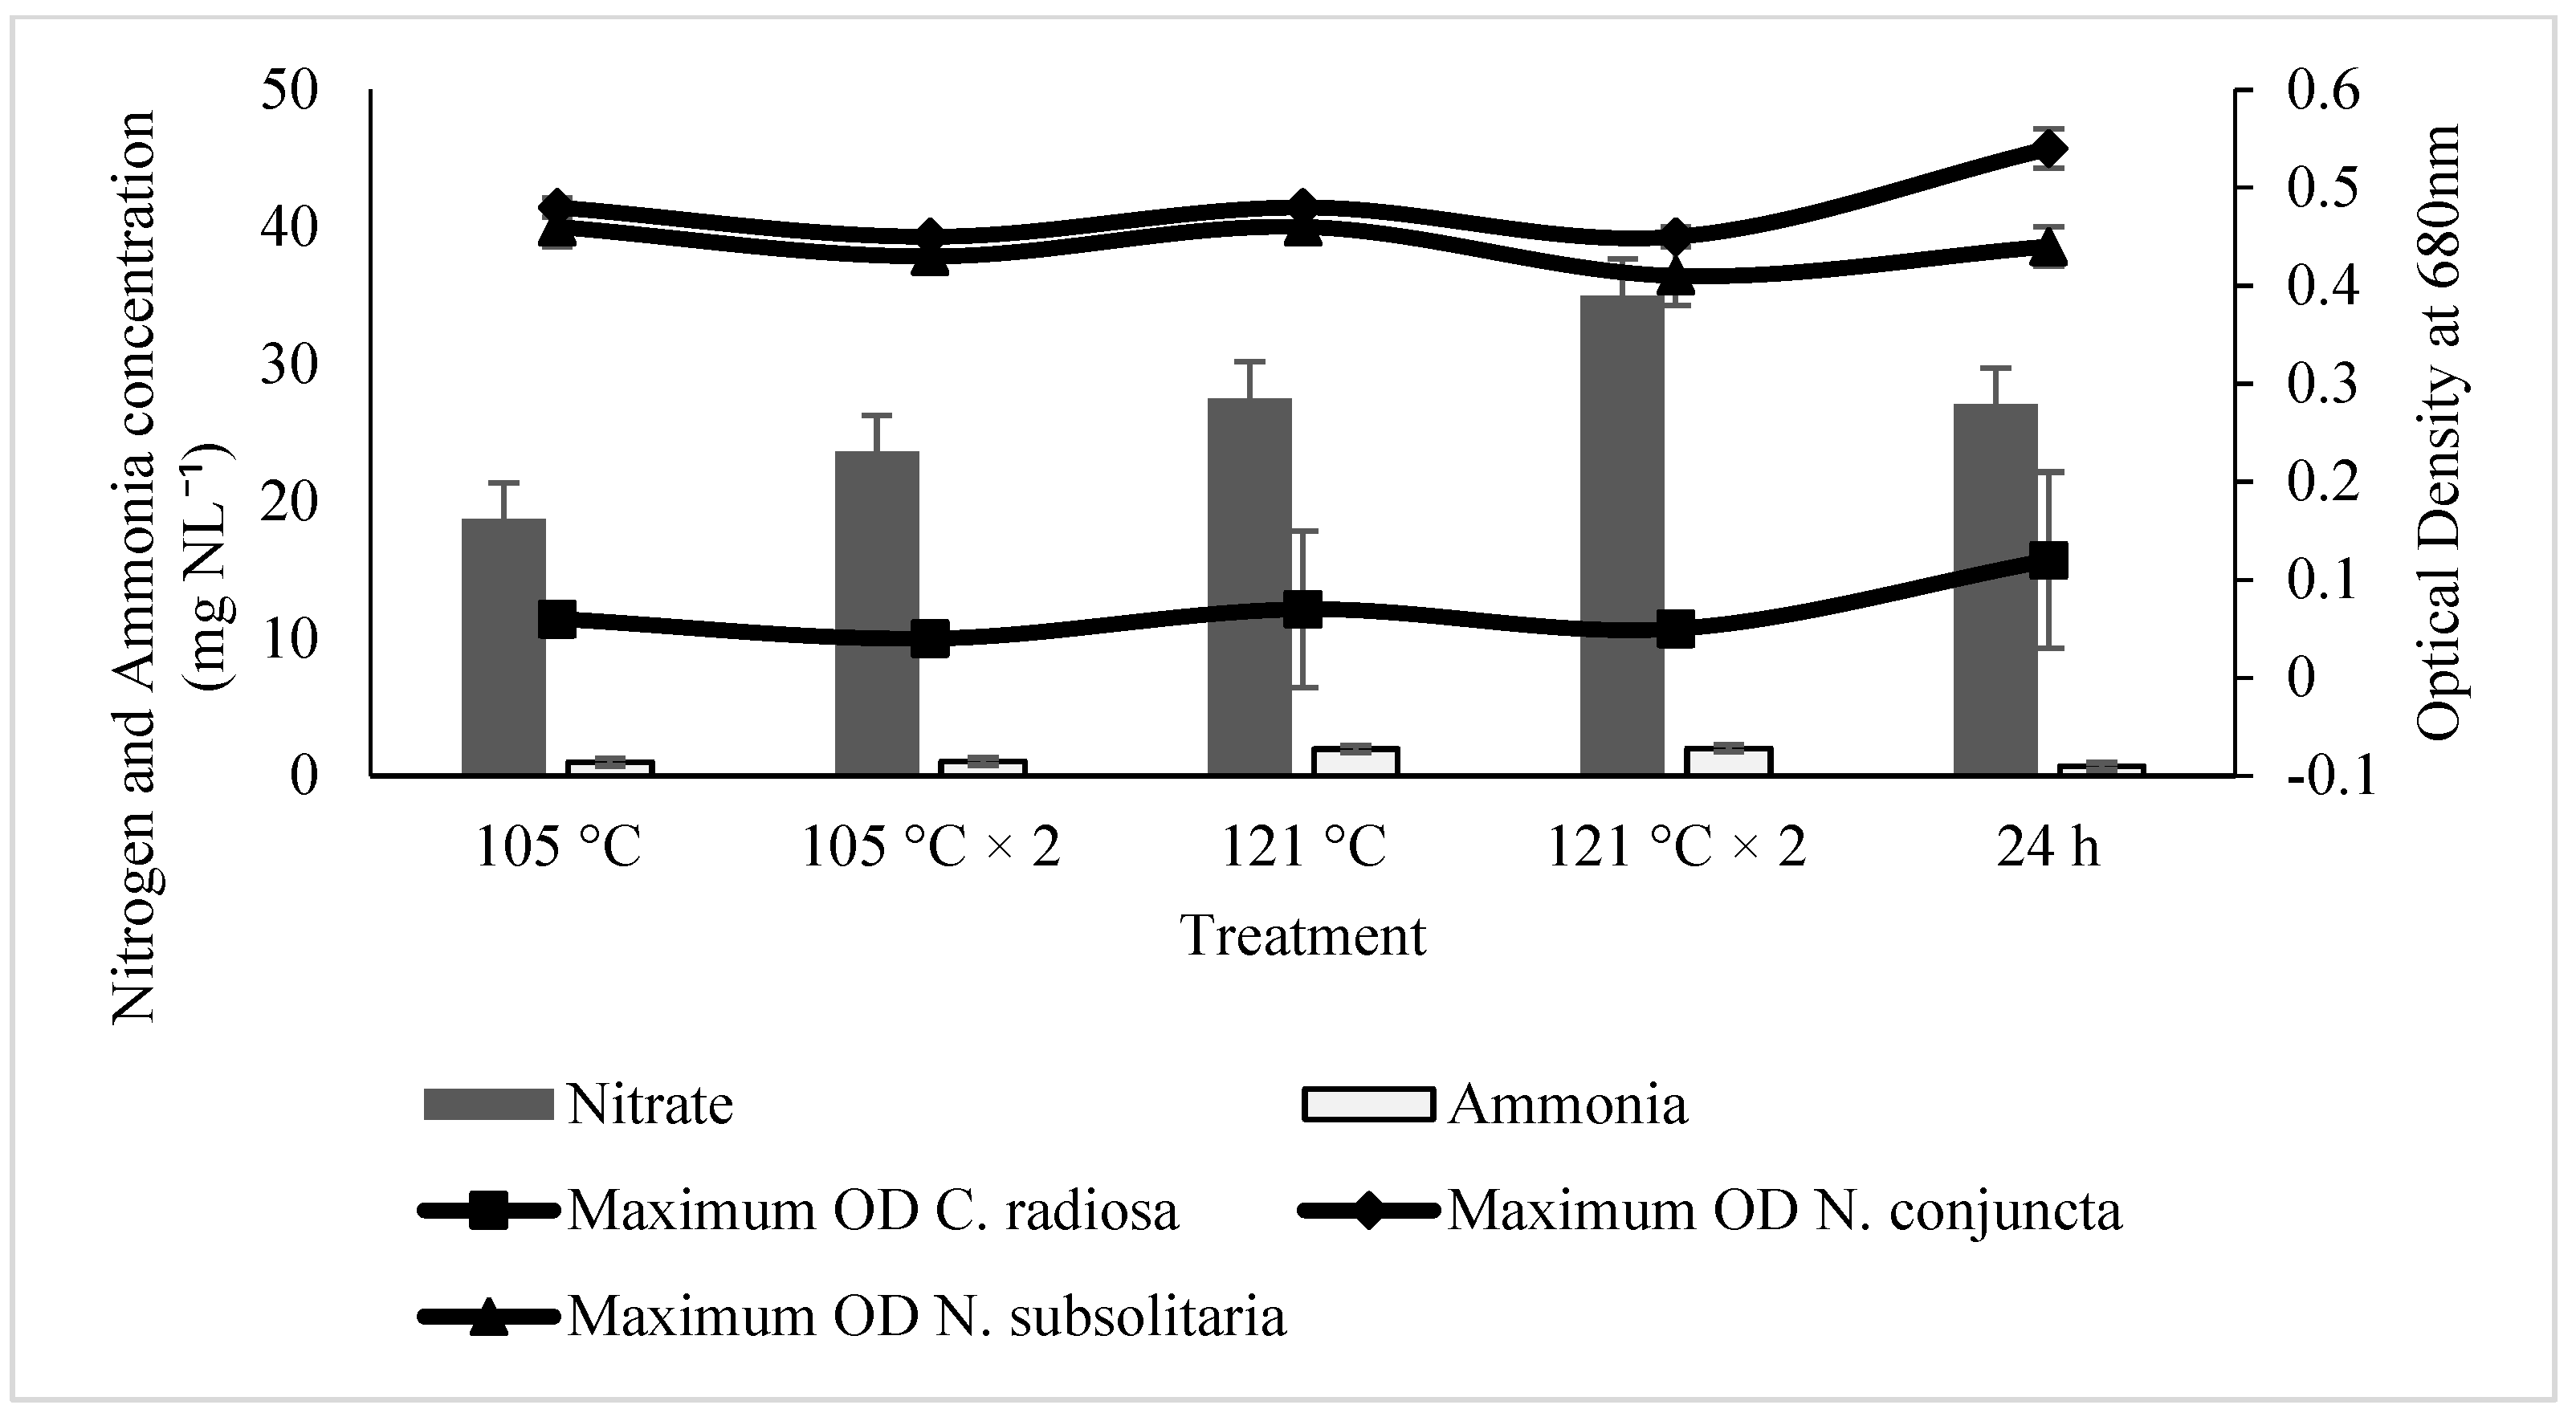
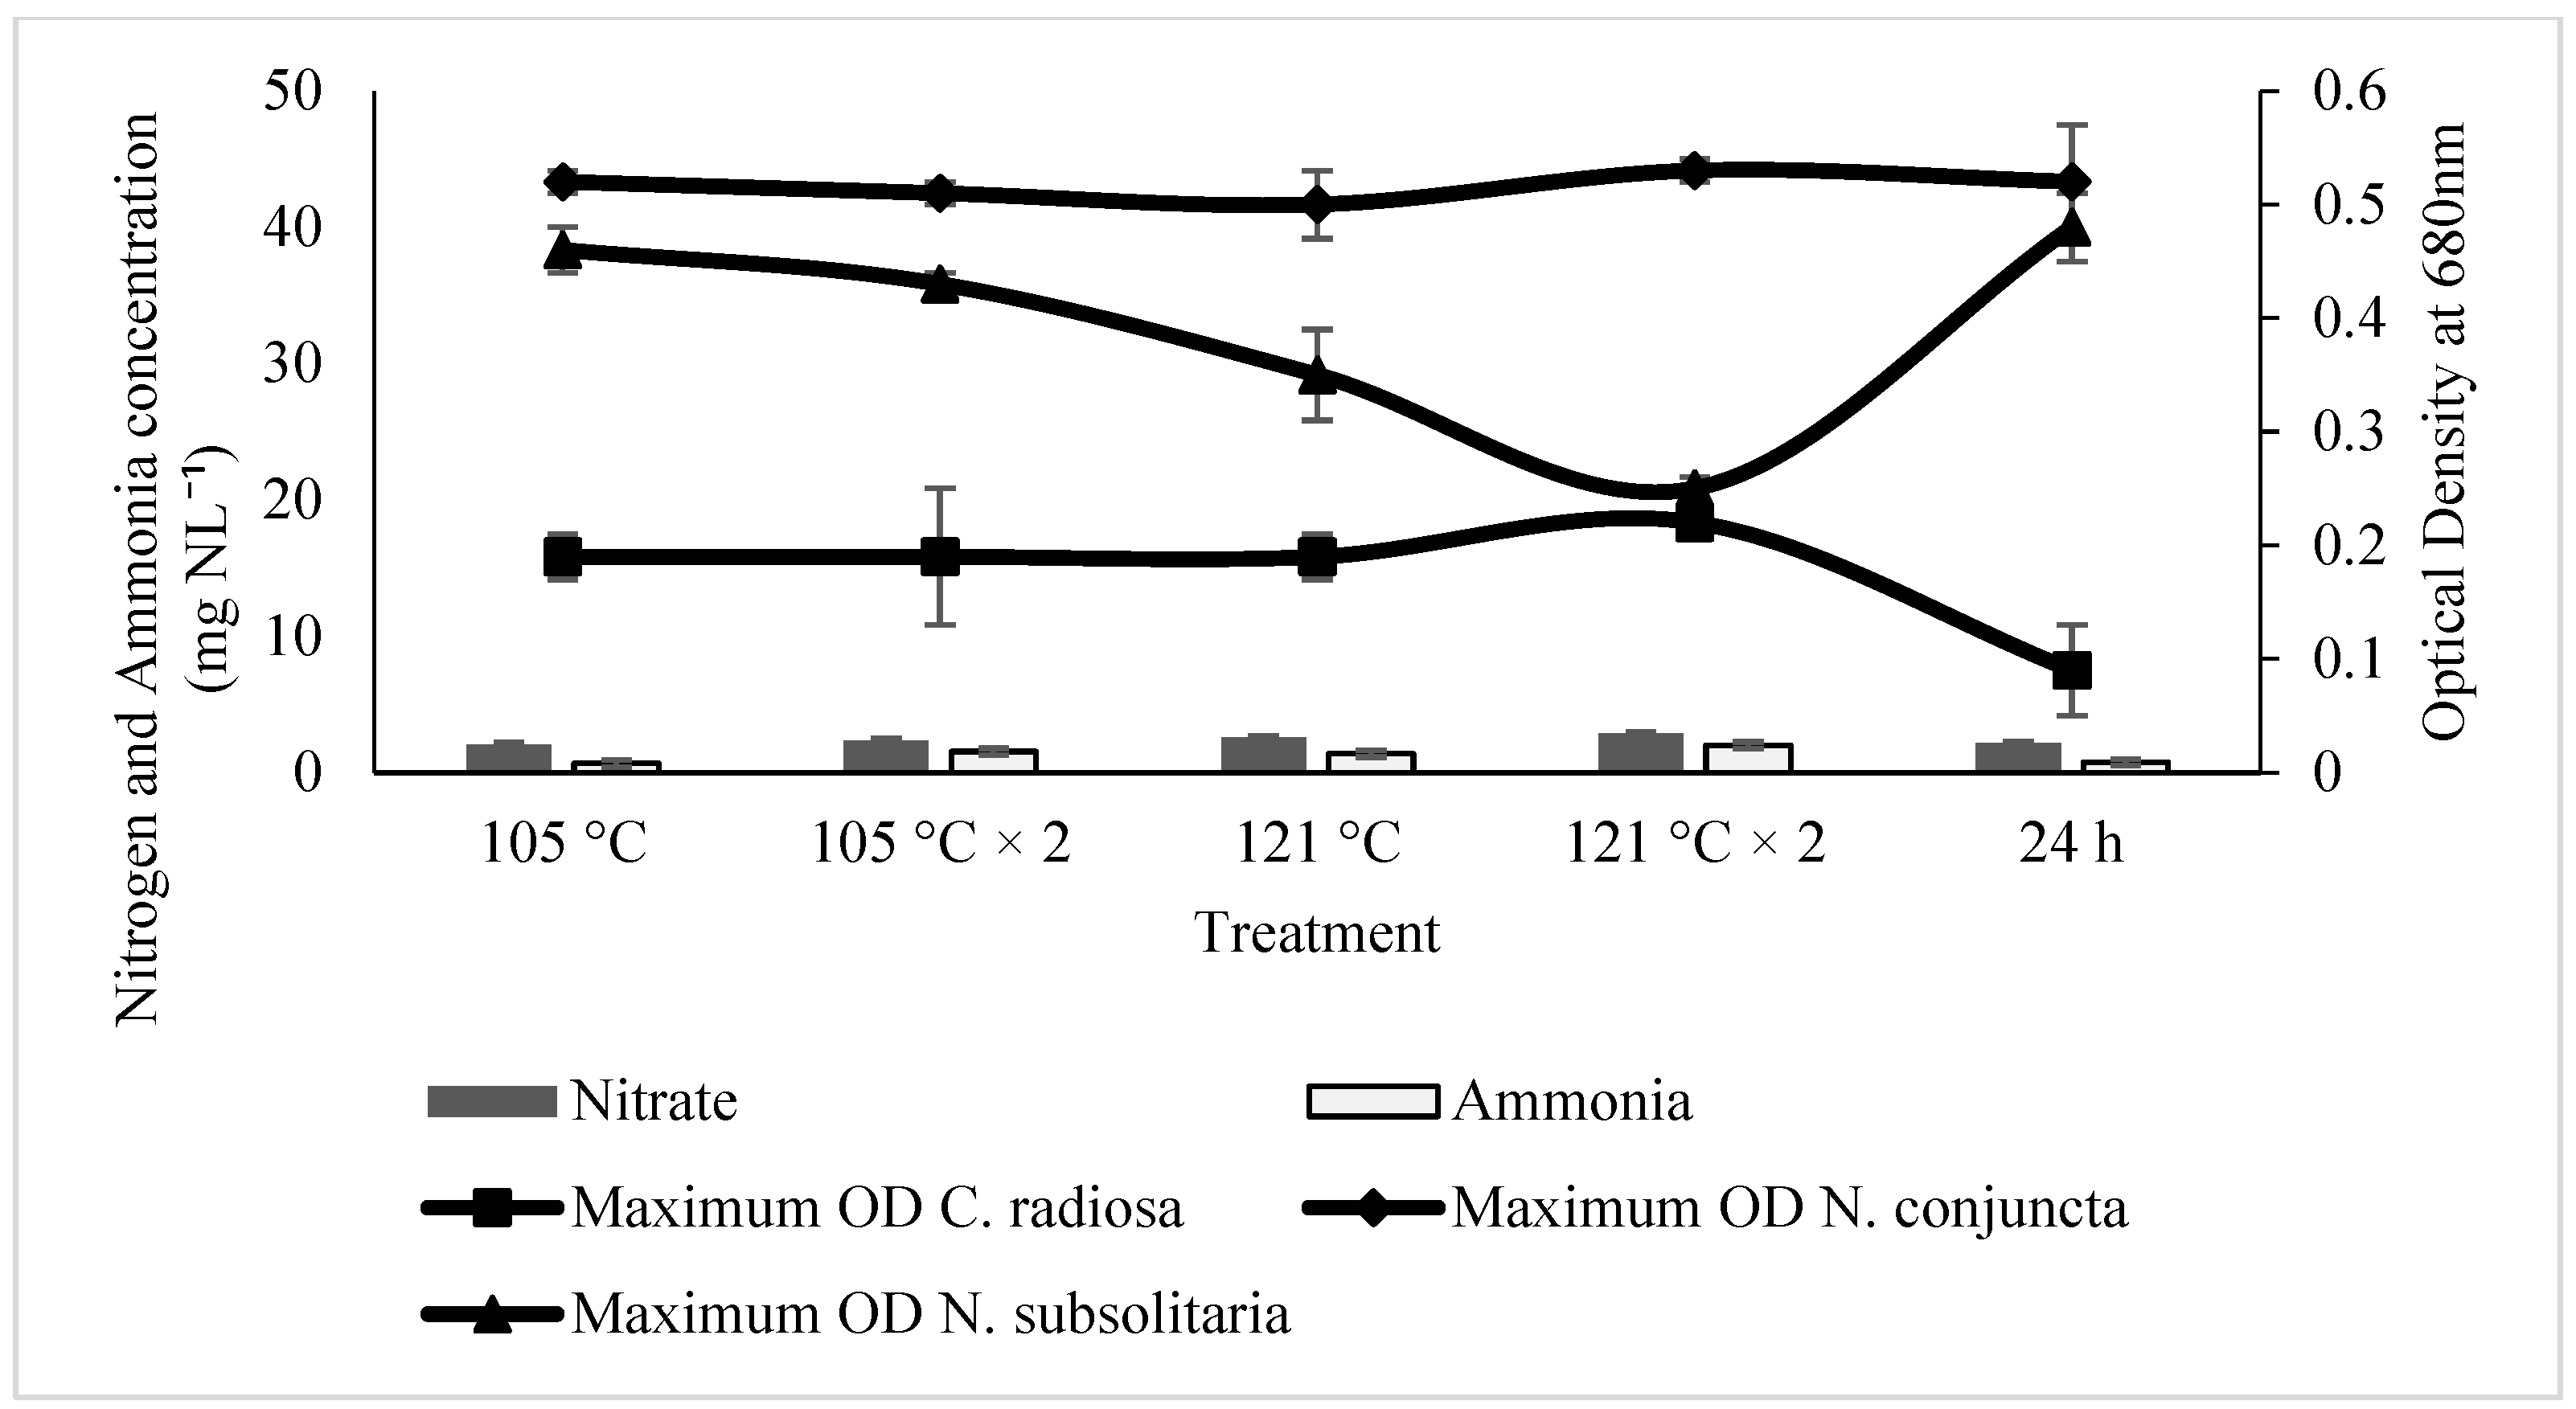
2.2. Effect of Ammonia and Nitrate on Microalgae Growth

Inorganic N, such as nitrate or ammonium ion, is a notable limiting nutrient in microalgal growth. Figure 1 shows the results of the three microalgal species used in this study: C. radiosa, N. conjuncta, and N. subsolitaria. A positive growth effect is observed in all three species by the recovered ammonia and nitrate from the RMFR and AHFR samples. The highest growth is observed in C. radiosa and N. conjuncta cultured in RMFR SE media for 24 h. Meanwhile, the highest growth for N. subsolitaria is detected in the RMFR SE media with 105 °C and 121 °C. Meanwhile, the highest concentrations of ammonia and nitrate are detected when the extraction method of 121 °C twice is employed, with a concentration of 2 mg NL−1 and 35 mg NL−1 for ammonia and nitrate. Similar growth is observed in all three microalgae in modified SEs of AHFR (Figure 2), where the highest growth is observed in C. radiosa and N. conjuncta cultured in AHFR soil media with 121 °C twice.
Meanwhile, the highest growth was detected for N. subsolitaria when the species was cultured in the AHFR SE media for 24 h. The highest concentrations of ammonia and nitrate are detected in the application of the 121 °C twice extraction method, achieving a concentration of 2 mg NL−1 and 2.85 mg NL−1 for ammonia and nitrate, respectively.

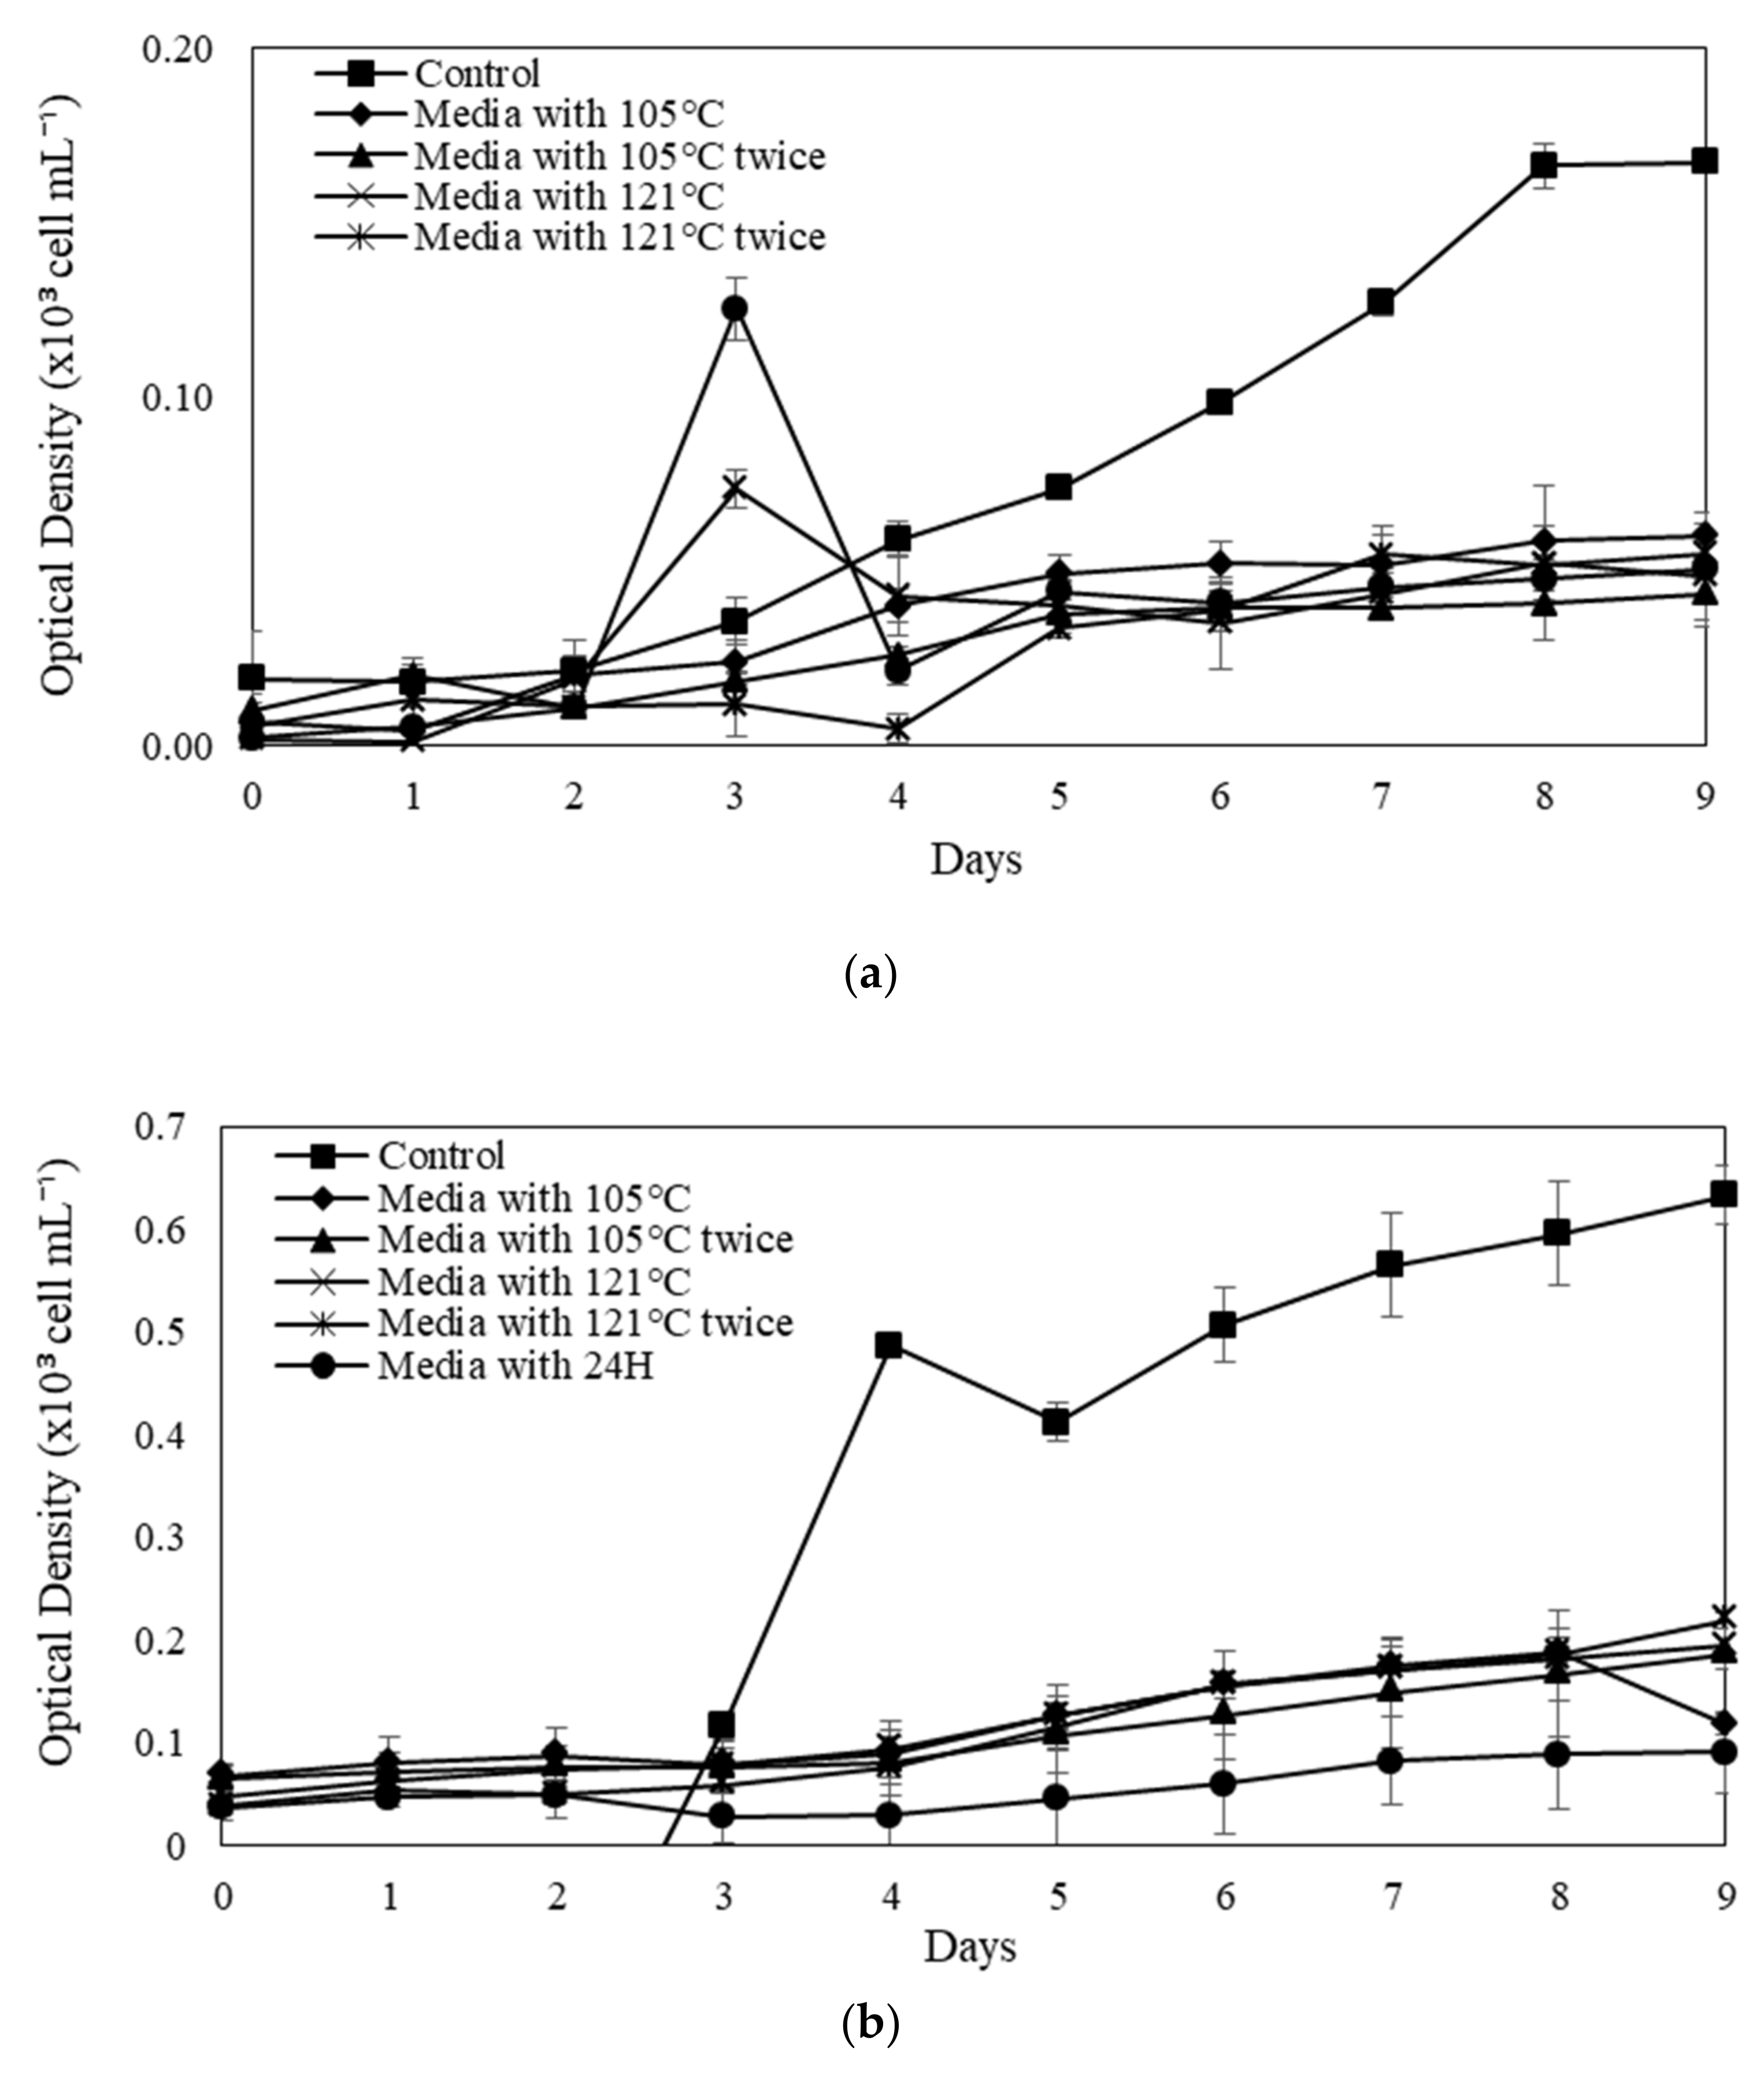
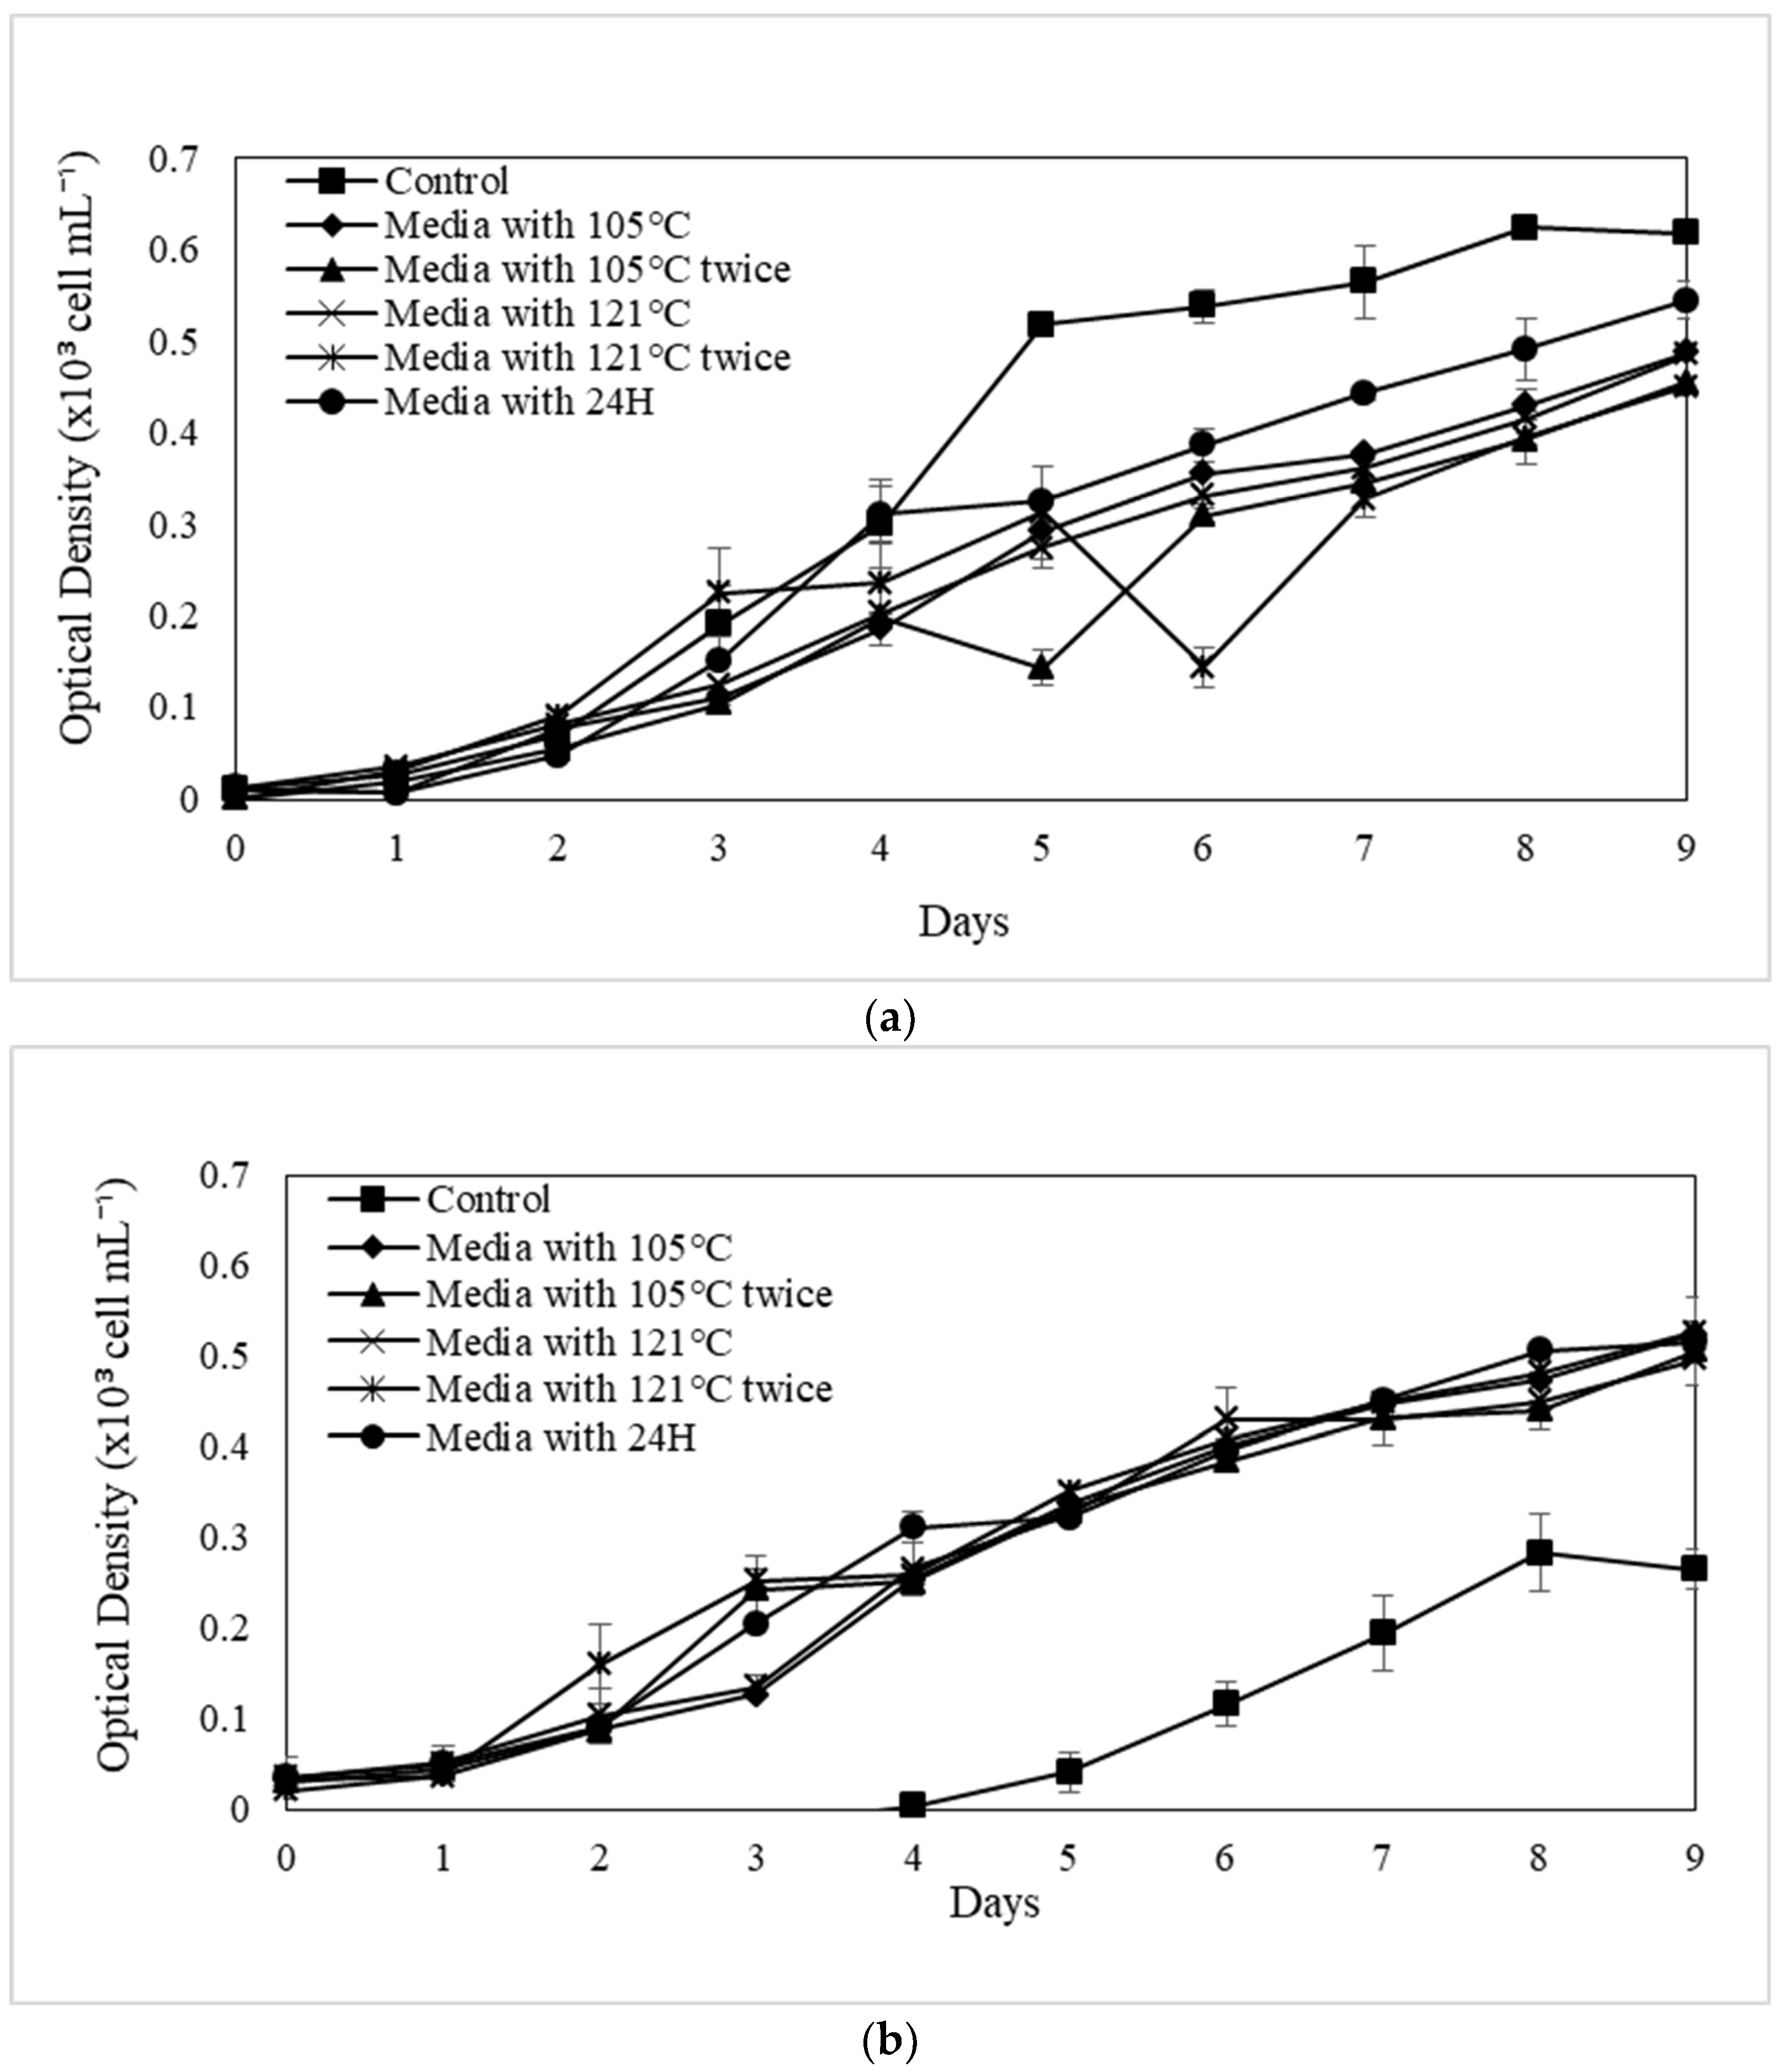
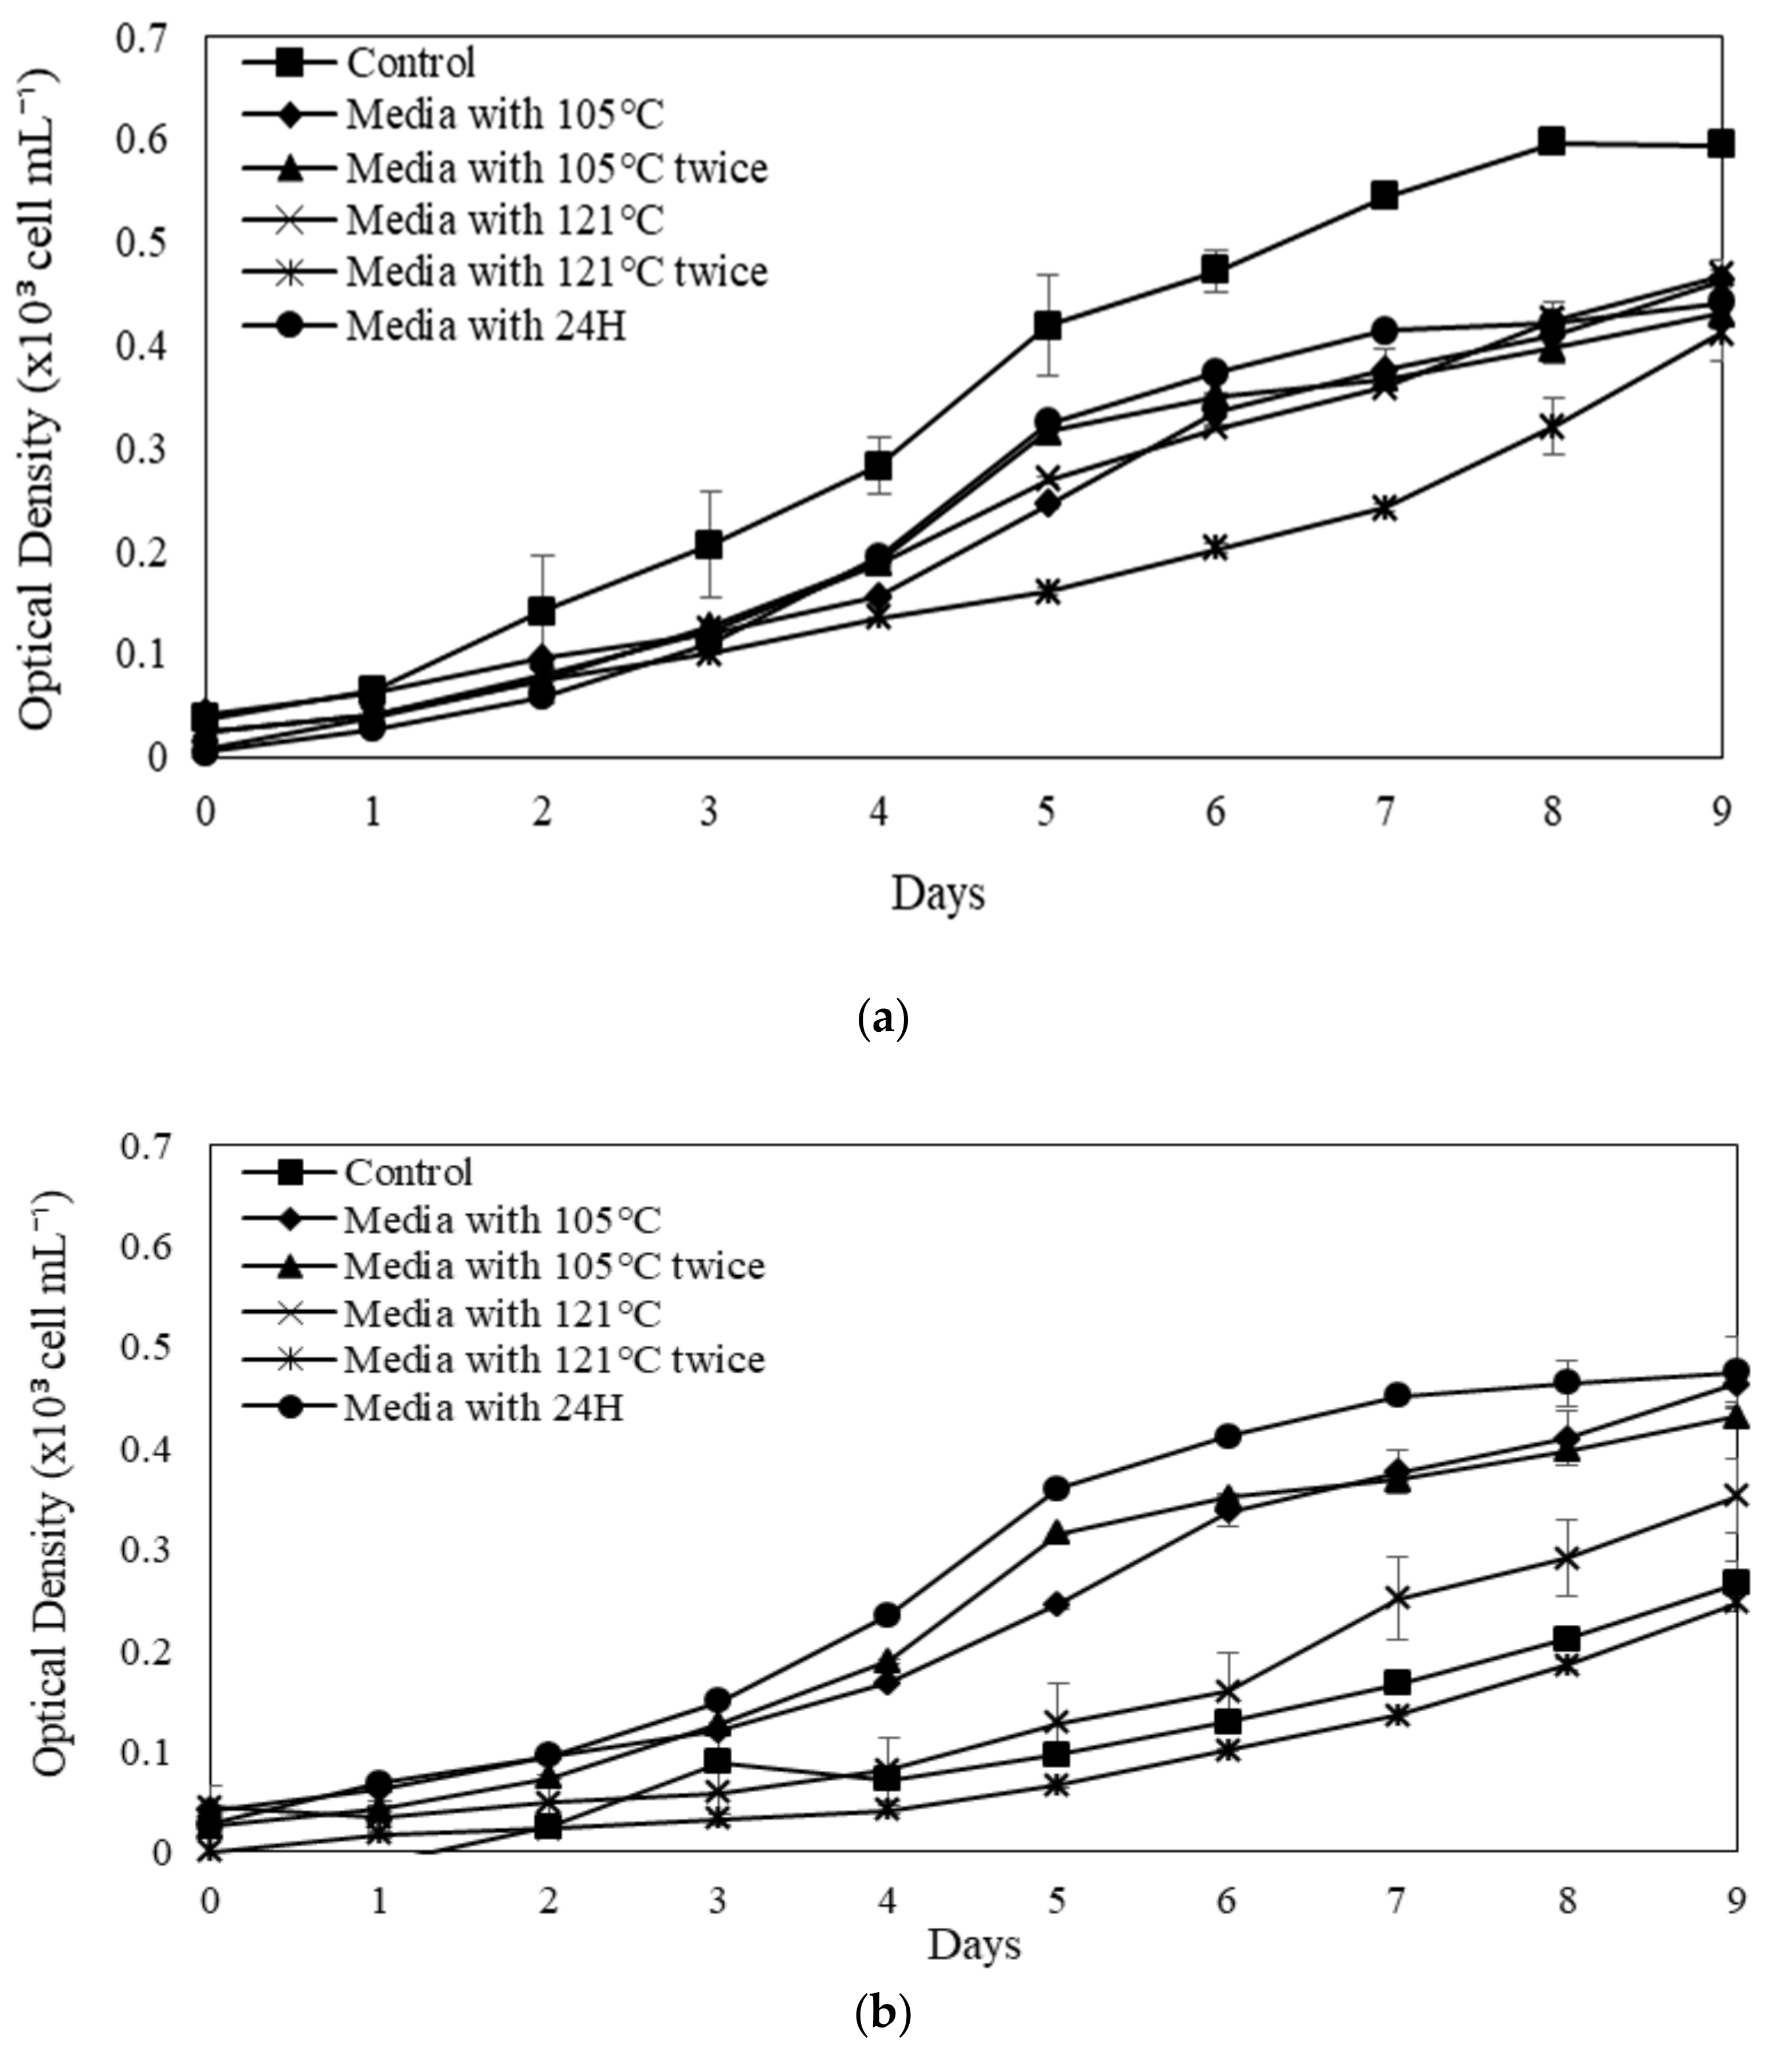
2.3. The Influences of SE for the Microalgal Growth

Three species showed a positive growth trend in all extraction parameters examined by two distinct SEs. The growth of C. radiosa is higher in the media with SE treated at 24 h compared to the control, as shown in Figure 3a. However, in AHFR SE, the increased algal growth (C. radiosa) in the control condition is higher after the third day of incubation than the five modified SE extraction treatments (Figure 3b).
The N. conjuncta growth in RMFR SE shows a higher growth pattern in the control experiment, media with 24 h, media with 105 °C, and media with 121 °C than the media with 105 °C twice and media with 121 °C twice (Figure 4a). By contrast, Figure 4b shows that in the control experiments, the growth of N. conjuncta is less than the five AHFR SE-modified extraction treatments. This microalga shows a positive growth pattern in the tested and control experiments between the five modified SEs.
N. subsolitaria growth is higher in the control media for RMFR (Figure 5a), whereas the control’s growth is lower in the modified AHFR SEs (Figure 5b). Nonetheless, the microalga shows a higher growth rate pattern in the control and media with 24 h treatment than the other treatments after day 3 until day 7, as shown in Figure 5a. The growth of N. subsolitaria in the media with 24 h demonstrates greater OD from day 3 to day 7 due to its rapid cell duplication till day 7, which subsequently decline from day 8 to day 9. The N. subsolitaria biomass in AHFR SE significantly modifies AHFR SEs, as illustrated in Figure 5b. However, differences in growth patterns exist in all soil extracts and the control.
Table 3 shows the different maximum OD values for the three microalgal species for the control and SE that has been modified. Maximum OD of C. radiosa is observed in the control experiment, followed by the media with 24 h and media with 121 °C twice in RMFR and AHFR SE. N. conjuncta exhibits the maximum OD in the control media and media with 24 h for RMFR SE and in media with 121 °C twice, media with 105 °C, and media with 24 h for AHFR SE. Meanwhile, N. subsolitaria exhibits a higher OD in the RMFR SE control experiment, followed by the media with 105 °C and media with 121 °C, while the highest OD for AHFR SE recorded in the media with 24 h.

2.4. Evaluation of Specific Growth Rate (SGR, µ) and Division Rate (k) for Selected Microalgae in Modified SE

In the modified RMFR and AHFR SEs, the SGR (μ) value of three microalgae depends on various medium types used. The highest SGR (0.129 d−1) is observed at the modified RMFR SE in media with 24 h for N. conjuncta (Figure 6a). N. conjuncta displays the highest SGR in the control media at 0.23 d−1 among the three microalgae cultivated in modified AHFR SE (Figure 6b). Nevertheless, in the modified RMFR SE and AHFR SE, the three microalgae division rates (k) depend on the microalgae SGR (Table 4). N. conjuncta exhibits the division rate of 0.18 d−1, the highest in media with 24 h treatment of RMFR SE. Moreover, N. conjuncta also recorded the highest division rate in AHFR SE treatments, with 0.16 in media with 105 °C and 121 °C twice treatments.

3. Discussion

Microalgae cultivation is becoming more popular around the world as a result of the possible economic and commercial benefits [26]. Using a unique microplate incubation approach, the current study attempted to assess the enhancing effect of soil extracts and heavy metal content from both RMFR and AHFR on the growth of specific microalgae species.
Soil texture, chemical characteristics, water holding capacity, and bulk density must be determined to understand the roles of soil science. The soil pH of RMFR in this investigation is 3.36, indicating acidic soil. The weathering and leaching processes within the soil could explain this phenomenon. According to the USDA guidelines, the pH levels are in the strongly acidic, moderately acidic, and minor acidic ranges, which differ from the pH levels (5.3 to 6.14) of soil in a previous study [27]. Similarly, the soil pH level in this study is more acidic than those reported by Ichikogu [28]. The P ion bound by the sand particles causes the strongly acidic soil in this investigation. The positive connection of sand and P analysis supports this hypothesis. It was discovered that increasing the amount of sand in the soil boosted the P content considerably.
This study determined the total C and N at 5.03 and 0.28 mg/kg for RMFR and at 5.23 mg/kg and 0.35 mg/kg for AHRF. The data are similar to the study by Amlin et al. [29], where C and N contents were 2.76 and 0.28 mg/kg, respectively. However, the result is low compared to other studies. For example, in the plantation forest of Khaya ivorensis, Heryati et al. [30] reported the C and N contents of 12.24 and 1.29 g/kg, respectively. Likewise, the total P in this study (1.07 mg/kg) is lower than reported by Abdu et al. [31], who studied the secondary forest and plantation forest in Regam (2.13 mg/kg), Durian (2.09 mg/kg), and Padang Besar (1.85 mg/kg). The findings revealed that the fully-managed secondary and plantation forests recover soil nutrients faster than natural forest regeneration.
From the results, Fe was found to be the most predominant trace metals at the soil sampling sites than other heavy metals such as Pb, Zn, and Cu. Fe concentrations are greatest among other heavy metals examined from both Raja Musa and Ayer Hitam locations, with 832.48 mg/kg in Raja Musa soil and 1905.48 mg/kg in Ayer Hitam soil, as shown in Table 2. These results are lower than the established standard [32]. The reason for this extreme value of Fe in soil might be due to the sampling procedure as the soils were collected from the depth. This was supported by another study [23], explained that the highest concentration of Fe is found at 2–15 cm level despites the Fe content varies with the type and depth of the soil, ranging from 20,000 to 550,000 mg/kg [33] (Xu et al., 2021). Fe is the fourth most prevalent element in the Earth’s crust; therefore, its high level could be attributed to its abundance [34]. Fe is essential mineral elements for algae growth which promoting photosynthesis, respiration, nitrogen fixation, protein, and nucleic acid synthesis.
Heavy metals possess relatively high densities, and the proportional weight of the atom with an atomic number above 20 is significant. Certain heavy metals, such as Co, Cu, Fe, Mn, Mo, Ni, V, and Zn, are essential for organisms in minimum amounts. Excessive quantities of these metals, however, are harmful to organisms. Other heavy metals such as Pb, Cd, Hg, and As are not advantageous for organisms [35]. The Pb values in the soil samples analysed are 9.15 and 506.16 mg/kg for Raja Musa and Ayer Hitam soil sample site, respectively (Table 4). It can be summarised that Pb concentration level in soil between both sampling site was significantly different. According to Singh et al. [36], the typical mean Pb concentration for surface soils worldwide averages 32 mg/kg and ranges from 10 to 67 mg/kg. However, the value of Pb obtained from Raja Musa soil in this study is lower than in previous studies [37,38], with 100 mg/kg suggested as the upper limit [39]. Meanwhile, a study by Lenart and Wolny-Koładka [40] indicated a higher Pb concentration than the Ayer Hitam soil sampling site. The availability of Pb in soil can also be affected by the soil type since Pb prefers to absorb on clay and oxides as well as form complex with organic matter. This finding might be the factor that cause Pb concentration was high in Ayer Hitam compared to Raja Musa that has sand-texture soil. Metal availability is influenced by soil conditions in various ways. Harter [41] reported that soil pH is the most crucial component of metal availability in soil. As reported by Wang et al. [42], the availability of Cd and Zn decreased with increasing soil pH. Heavy metals have also been significantly associated with soil physical attributes, such as moisture content and water holding capacity [43].
In Raja Musa and Ayer Hitam soils, Zn concentrations ranged from 4.91 mg/kg to 121.83 mg/kg. The mean concentration of Zn for surface soils worldwide ranges from 5 to 10 mg/kg. The soil collected from RMFR showed the lowest Zn concentration in contrast to soil collected from AHFR. The zinc content found in this study is significantly lower than Ogundele et al. [44]. The low levels of Zn in these forest sites are likely attributable to the soil’s limited exposure to farming activities in these areas, as well as the widespread use of pesticides and fertilisers.
Cu concentrations ranged from 0.70 mg/kg to 84.41 mg/kg. The soil sample collected from Raja Musa regions had the lowest concentration of Cu, whereas Ayer Hitam soil had the greatest concentration. It was found that the mean concentration of Ayer Hitam soil was above permissible limit set by the Department of Environment in soil (the DOE’s permissible limit of Cu in soils is 13.80 mg/kg) [45]. The Cu concentration in this Raja Musa soil sample was generally lower than the allowed levels in soil defined in [46]. All algae have a micronutrient copper requirement for growth and reproduction; however, excess copper could be highly toxic to most algae. For example, Cu plays a very important role in photosynthesis, in a protein involved in photosynthetic electron transport, and serves as a co-factor for several enzymes in the green alga. Cu is required at sufficient concentrations to merit its addition to artificial media.
The finding of this study shows that some of the heavy metal present in the soil such as arsenic, cadmium, chromium, nickel, mercury, and silver are less in concentration which is not determined. This might be attributed to the fact that, undisturbed nature of the forest soil which has been prevented from experiencing illicit felling and lopping of the soil [47].
According to the work in [48], the addition of 0.5–2.5 mg/L of mercury inhibited the photosynthetic activity of C. vulgaris by 23.3–71.1 percent. C. vulgaris photosynthetic activity was inhibited by 0.5–2.5 mg/L silver for 12 h, resulting in a 23.1–57.6 percent inhibition. Mercury interferes with chloride binding and harms the oxygen evolution complex [49]. Mercury inhibits the metabolic fixation of CO2 and the uptake of the carbon source in the dark reaction. According to Singh et al. [50], even at very low concentrations, mercury inhibits algae growth by affecting nutrient uptake and nitrogen metabolism. It inhibits a variety of enzymatic activities while also inducing oxidative stress, altering the antioxidative defence mechanism.
Over a 72 h exposure time, Ksiazyk et al. [51] and Ribeiro et al. [52] reported 50% inhibition of microalgae values of 1.6 and 0.03 mg/L for silver for Pseudokirchneriella subcapitata species, respectively. Silver penetrated the cell wall, causing damage to the cell membrane, membrane integrity loss, and cell lysis.
Lukavsky et al. [53] found exposure to 2.5 mg/L copper for 12 h showed 44% inhibition of photosynthetic activity of C. vulgaris. However, the toxicity of arsenic was mainly depended on the exposure time instead of its concentration in the solutions. Therefore, when arsenic concentration in the exposed medium was below 1000 μg/L, no matter how much arsenic was absorbed in the algae, it was able to promote the absorption of Arsenic during the first 10 days of exposure [54] and after day 10, the toxicity of arsenic caused the algal cells to die gradually. Although the NPK decreased in the soil extract used (except for potassium in RMRF). The decreasing of heavy metal content in extract helps in promoting algae growth as compared in real soil.
NH+4 and NO3 might be used as N sources by most phytoplankton species [55]. Based on our review, some researchers have discovered that for a given N source, macro- and microalgae have a higher photosynthetic or growth rate, as shown by different affinities for NH+4 and NO3 uptake, or changes in a wide range of physiological parameters related to growth response to different N sources. According to the work in [56], NH+4 is the preferred N source for Chlamydomonas species and inhibit NO3 absorption. As the content of both nutrients varies, these preferences could be a factor in competition [57]. Unlike NO3, NH+4 is directly absorbed into amino acids by glutamate condensation, which is catalysed by glutamine synthetase [56].
Microalgae prefer ammonium to convert it to nitrate or nitrite. Although ammonium is a reduced form of N, it can be digested directly into amino acids within the cells. On the other hand, nitrate or nitrite must first be reduced to ammonium before being used [58]. However, in the present study, nitrate is more favourable for the growth of C. radiosa, N. conjuncta, and N. subsolitaria cells, showing approximately the highest maximum OD and growth rate. Therefore, cell growth inhibition upon ammonium supplementation might indicate that it is toxic to the cell. However, the inhibitory level of ammonium on cell growth is different, depending on the microalgal species. Furthermore, in rare situations, ammonium oversaturation in the medium can drastically lower the pH by releasing H+ ions, limiting cell development and even triggering cell lysis [59,60]. Several studies reported cell growth inhibition at certain concentrations of ammonium. For example, cell growth suppression was seen in a marine microalga, Dunaliella tertiolecta, at ammonium concentrations greater than 10 mM [61]. Conversely, ammonium concentrations of 15 mM were found to limit the growth of a blue-green alga, Arthrospira platensis [62], whereas low levels (1.2 mM) were found to be lethal to several marine algae [63]. This study demonstrated that nitrate is preferred for growth rather than ammonium, similar to previous studies. In comparison, many other microalgal species preferred nitrate over ammonium for growth, such as D. tertiolecta, Isochrysis galbana, Neochloris oleoabundans, Chlorella sorokiniana, and Botryococcus braunii [59,61,64,65,66].
This soil extract contains unidentified growth factors absent in other materials [67]. Biomass growth and its chemical composition of microalgae mainly depend on the quality (source) and quantity (intensity) and C and N percentage in the growth media. The algal cell requires inorganic nutrients provided by the growth medium, including essential elements such as N, P, Fe, and silica (SiO2) [68]. The highest cell growth rate was merely found by the AHFR due to the ammonium, nitrogen, and various organic matters present from the SE. The species seemingly utilises both N and organic compound-modified SE through metabolism and consequently stimulating cell growth.
Soil extract plays a critical role in the enhanced biomass of C. radiosa, N. conjuncta, and N. subsolitaria due to N, S, P, Ca, and Mg composition. These elements play a vital function in protein formation for microalgal growth. P and Ca are also essential in cell division by promoting faster cell division, increasing cell density, specific growth rate resulting in faster algal growth [69].
Due to the difference in organic matter content, the Ayer Hitam soil extract promoted microalgal development proportionately to the Raja Musa soil extract in the current investigation. The freshwater nature of the species renders it favourable growth in the AH SE. In some cases, decreasing the pH will consequently inhibit cell growth and even cause cell lysis. However, the development of several microalgae is similar under different soil extraction parameters and the control. Due to high quantities of nutrients combined with specialised extraction procedures, microalgae thrived well in varied extraction settings compared to the controls in some circumstances. Specific extraction conditions are also likely to decrease while precipitated essential minerals and vitamins exist in treated SE [70].
The maximum OD observed in Ayer Hitam SE is higher than that of Raja Musa SE at different treatment methods for all microalgal species. Maximum OD at specific points has been observed specifically in N. conjuncta and N. subsolitaria when treated with Ayer Hitam SE. Several studies have reported using soil extracts for algae cultivation and growth enhancement [71,72]. Moreover, the production of microalgae biomass was reported to increase significantly due to its higher levels of N, P, and higher concentrations of micronutrients (Co, Mn, Zn, and Cu), which adversely affect the growth of microalgae, as studied by Lian et al. [73]. In the present study, media with 121 °C, × 2 and 24 h of treatment method exhibited the maximum OD in Ayer Hitam SE in modified soil extracts. Marjakangas et al. [74] stated that autoclaving at high temperatures for an extended time could kill bacteria and protozoa; thus, inhibiting the growth of microalgae. Moreover, a drastic increase in dissolved organic matters after autoclaving has been reported [70,75,76].
The SGR of microalgal species varies depending on the category of soil extracts, the procedure of augmentation or extraction, and the culture media utilised in the control experiment. N. conjuncta SGR is in comparable to the control in modified Raja Musa and Ayer Hitam soil extracts (Figure 6A,B). The significantly greater SGR implies that the extraction parameters and nutrients of further SE that have been modified are essential to the exponential increase. A higher SGR value in the control experiment by some species indicates species dependence and variability. This might be due to the basal medium containing N mainly in the form of NO3-, which is reduced to ammonia during the cultivation period. These high levels of environmental ammonium inhibit cell growth, resulting in the imbalance of ammonia diffusion across the plasma membrane. At high concentrations, the tricarboxylic acid (TCA) cycle may be disturbed, disrupting cellular respiration. In this scenario, more support for microalgae production will be provided, but overall biomass concentrations will not rise over time. Furthermore, Chew et al. [77] claimed that high microalgae concentrations could restrict growth rates due to population concentration. The microplate approach utilised in this work may induce certain growth constraints due to the low volume (microwells) and high microalgal biomass concentration on day 9. Namely, the small incubation capacity of the microplate wells may have slowed any growth.

4. Materials and Methods

4.1. Collection and Preparation of Sample

Two soil sample were collected, i.e., organic soil from Raja Musa Peat Swamp Forest Reserve, Selangor, and mineral soil from Ayer Hitam Forest Reserve, Selangor. The detailed location of the sample collection is shown in Table 5 (Supplementary Figure S1). Raja Musa is classified as a peat soil, with black in colour, soft and acidic conditions, while Ayer Hitam appeared as a mineral soil or loam soil with dark brown colour. The A random sampling technique was used according to the United States Department of Agriculture (USDA). Soil surface or O horizon was removed before the sample collection, and each subsample soil was collected with uniform characteristics before mixing. The samples were collected up to 15 cm deep for the Ayer Hitam (AH) soil and up to 30 cm for the Raja Musa (RM) soil. Coarse particles such as stones, woods, and roots were removed, and the samples were oven-dried at 60 °C. After the drying process was completed, the dried soils were ground and sieved to obtain homogenised samples. The fine dried soils were put into zip lock bags and stored in a dark room at 24 °C until further analysis. The selected soil characteristics and analytical method are shown in Table 6.
Non-purgeable organic carbon (NPOC) concentrations in the aqueous sludge extracts were measured as dissolved organic carbon (DOC) using Shimadzu TOC-L CSH (Shimadzu Corp., Kyoto, Japan). In order to remove volatile carbon, each sample was acidified with 2M of HCl and purged with CO2-free synthetic air (Big Purifier with CoFree Indicator, USA). The DOC was analysed based on the manufacturer’s instruction manual. Total dissolved nitrogen (TDN) and total dissolved phosphorus (TDP) were analysed using MD600/MaxiDirect photometer system (Lovibond Tintometer, Amesbury, United Kingdom). TDN of SB and KP SE filtrates were analysed using a Vario Total Nitrogen LR Set, while TDP samples were analysed using a Vario Total Phosphate Reagent Set from Lovibond. A colourimetric assay was used to analyse TDN and TDP of SB and KP SE filtrates based on the manufacturer’s instruction manual, where N and P levels were calculated in mg L−1. The concentrations of the samples were positively correlated with colour intensity [78]. Each sample was measured in triplicate and the average value was estimated.
The soil heavy metals analysis was performed according to USEPA 1311 (APHA 3111- B) method. Briefly, the soils were digested with 18 mL of concentrated HCl and 6 mL of concentrated HNO3. The mixture was boiled until remaining with 5 mL solution and cooled. The mixture was then filtered, markup to 50 mL of distilled water, and analysed using atomic absorption spectrophotometer (AAS). The soil particle analysis were analysed using a Laser Diffraction Particle Size Analyzer (SALD-2300, Shimadzu).

4.2. Soil Extraction

Tropical rain forest soil extracts were used to assess microalgal growth in five different treatments (24 h, 105 °C, 105 °C × 2, 121 °C, and 121 °C × 2) as shown in Table 7. Approximately 20 g of each dried soil sample was put into Schott bottles and 200 mL of ultrapure water was added (1 part of the soil to 10 parts of ultrapure water). The soil samples were incubated for 24 h for the room temperature aqueous extraction. Meanwhile, the high-temperature samples for aqueous extraction were autoclaved for one hour in different conditions, i.e., 105 °C and 121 °C temperatures and extended autoclave time of one hour twice at 105 °C twice (105 °C × 2) and 121 °C twice (121 °C × 2). Next, all samples were centrifuged using the Beckman Allegra X-30R Centrifuge machine at 2500 rpm for 15 min. The supernatant was filtered using Whatman Glass Microfiber Filter (GF/F) 0.7 µm using a 0.2 µm syringe filter. Finally, the filtrate was kept in the Revco, ULT-390-10 freezer at −20 °C (Thermo Fisher Scientific, Japan) for further analysis.

4.3. Microalgae

Three different microalgal strains were used for this study: Carteria radiosa (PHG2-A01) isolated from Tasik Bera, Pahang; Neochloris conjuncta (KDH2-C01) from Tasik Dayang Bunting, Kedah; and Nephrochlamys subsolitaria (KDH3-C05) also from Tasik Dayang Bunting, Kedah. Stock cultures were prepared for all microalgal species at Universiti Selangor (Unisel) SATREPS-COSMOS laboratory. Enriched seawater medium was prepared using collected offshore seawater free from pollution, and the particulate matter was removed by filtering using Whatman GF/F filters. The Conway media was prepared according to Powlson and Jenkinson [76] from five basic solutions, i.e., the mineral solution of 45 g disodium EDTA (C6H16N2O8), 100 g of NaNo3, 33.6 g of H3BO3, 1.3 g of FeCl3·6H2O, 20 g of NaH2PO4·4H2O, 0.36 g of MnCl2·4H2O, and 1 L of Milli-Q water containing 1 mL trace metal solution. The trace metal solution was prepared by measuring ZnCl2 (0.21 g), CoCl3·6H2O (0.2 g), (NH4)6MO7O2·4H2O (0.09 g), and CuSO4·5H2O (0.2 g) in 100 mL Milli-Q water. Meanwhile, the vitamin solution was prepared by measuring 0.2 g thiamine (B1) and cyanocobalamin (B12) in 100 mL of Milli-Q. Silicate solution was prepared by adding 2 g of Na2SiO3 into 100 mL of Milli-Q, followed by 2 g KNO3 into 100 mL of Milli-Q for nitrate solution. Preparation of media was done by the addition of 1 mL of silicate, nitrate solution and main mineral into the preparation bottle for the final volume of 1L of the media. The prepared media was autoclaved using the SX-500 autoclave (Tomy Seiko Co., Ltd., Tokyo, Japan). A total of 1 mL of NH4Cl and vitamin were added to the cooled media to achieve a concentration of 5.0 × 10⁻⁴ M of final media concentration. The culture was grown at 25 ± 0.5 °C at the preferred light intensity (33.75 µmol photons m−2 s−1), a 12-h dark and light cycle.

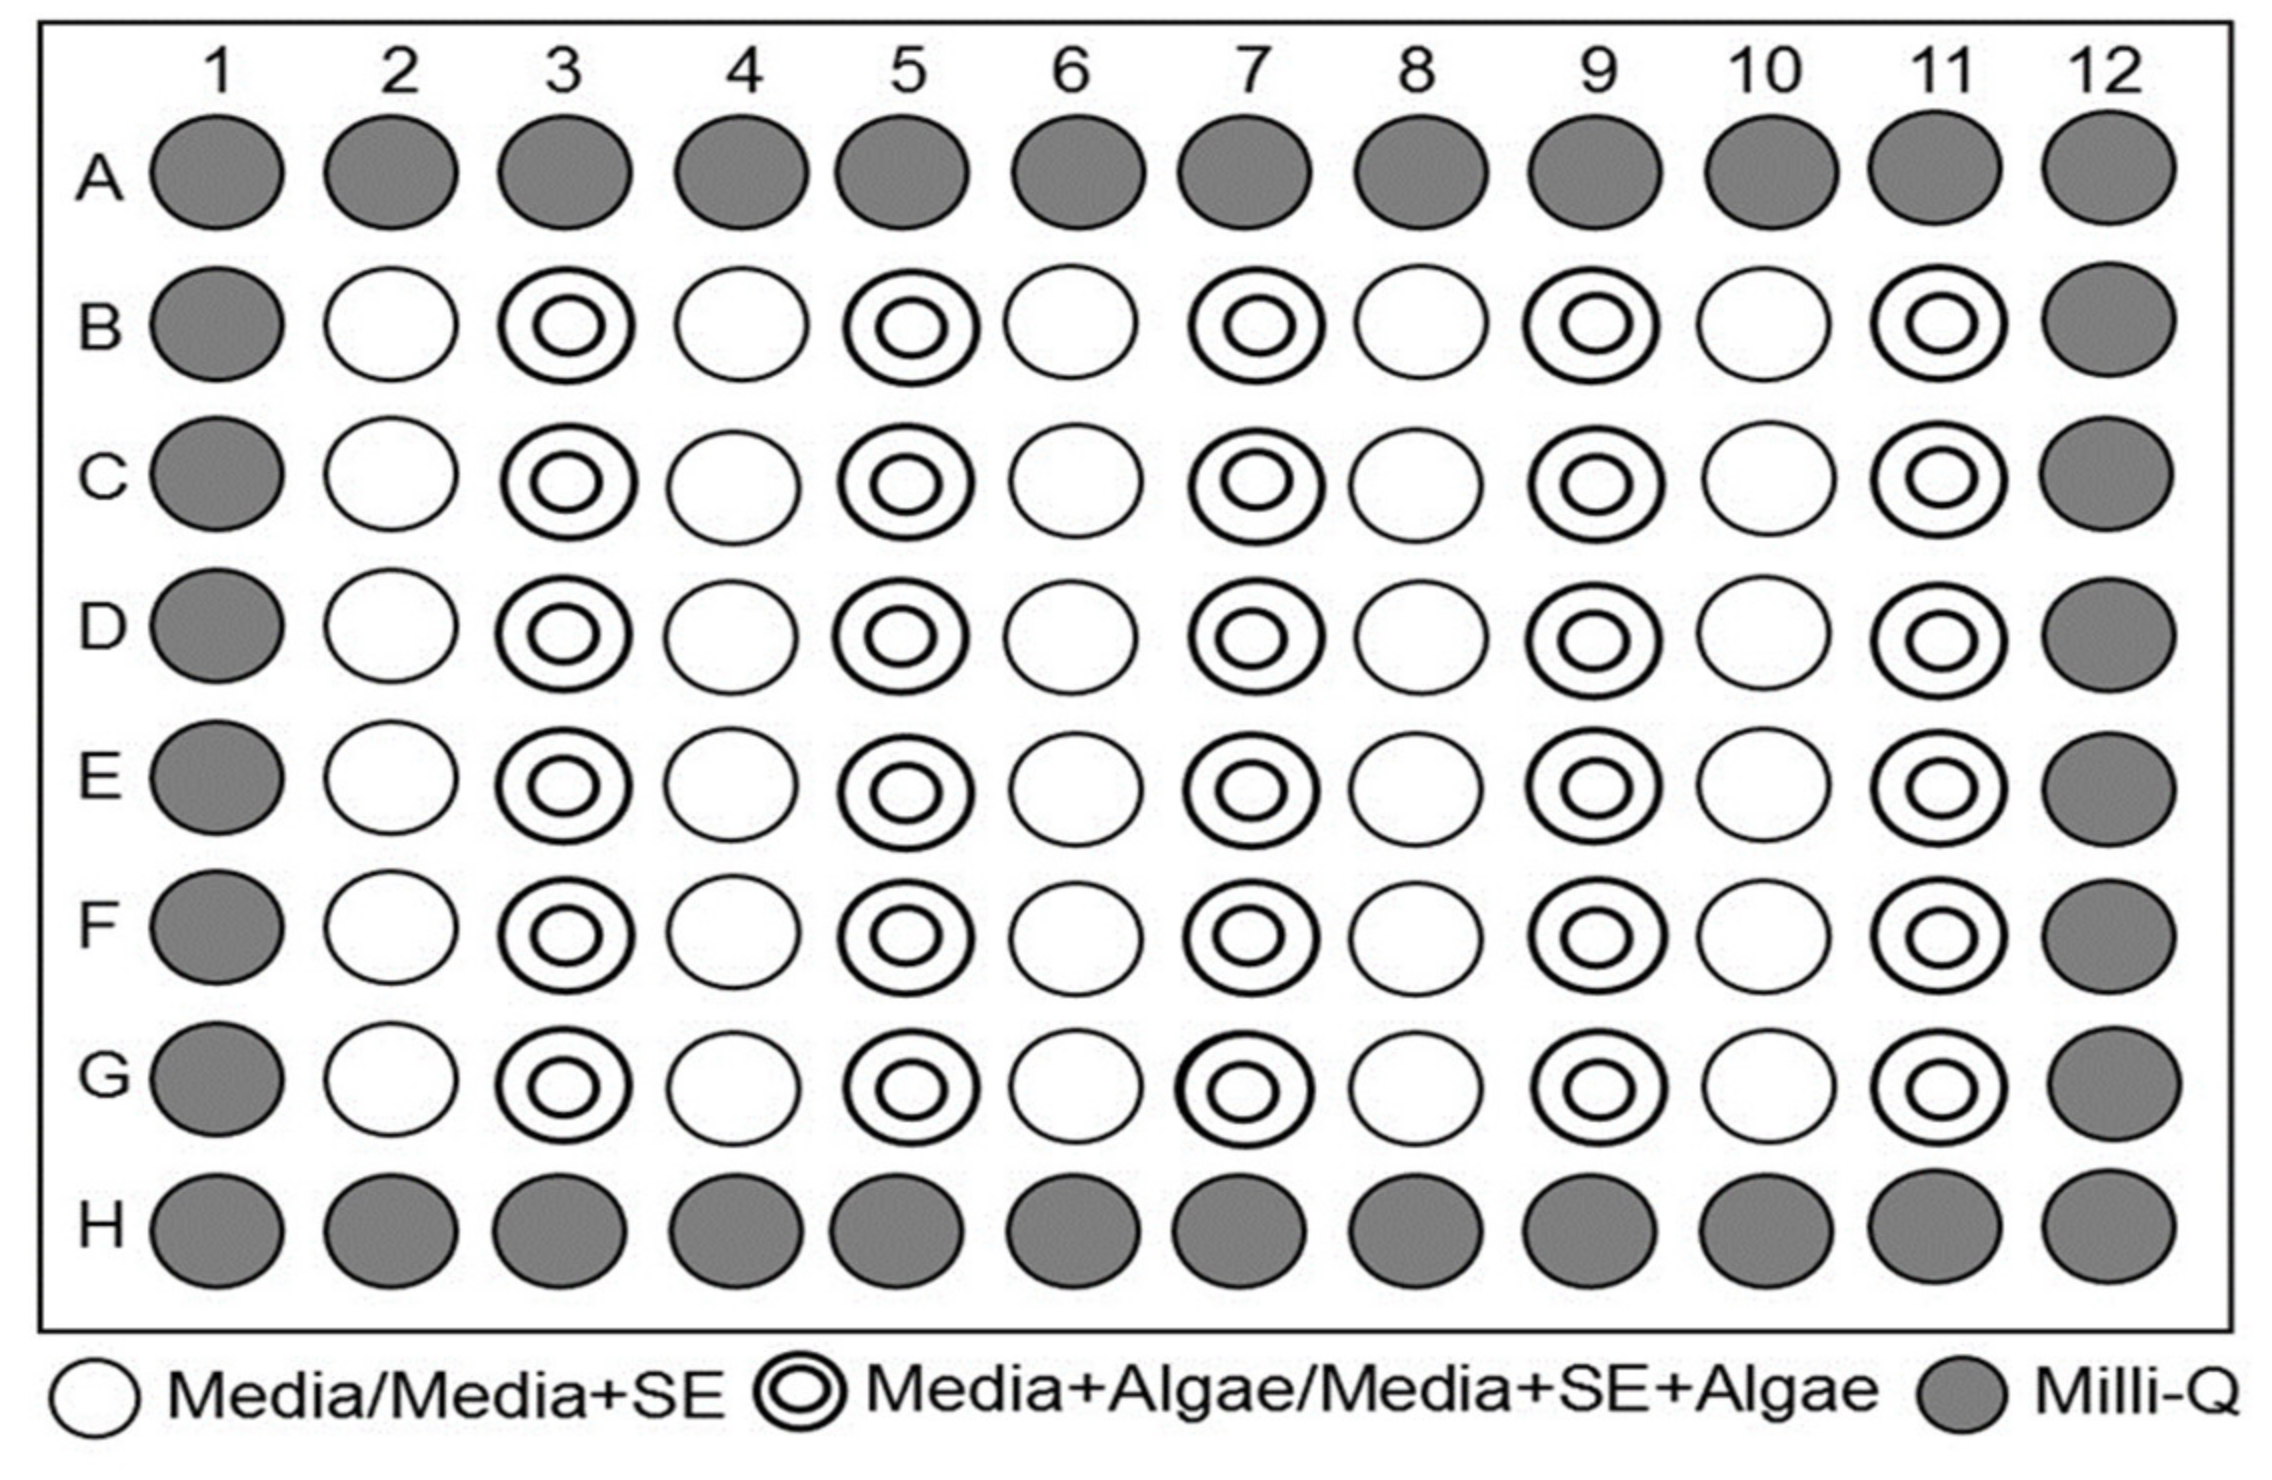
4.4. Technique of Microplate Incubation

The effect of soil extracts on microalgal growth was assessed using a 96-well microplate [79,80]. Each well was filled with solution up to 200 µL total volume. Milli-Q water, soil extracts, microalgae sp., and medium were dispensed into the wells using a 6-channel micropipette. Each microplate was used to assess two different strains, where the microplate was divided into upper and lower parts. The wells of the microplate were made up of 12 columns and 8 rows. Milli-Q water was used to fill the microplates wells on the outer part to minimise evaporation and increase humidity. Approximately 6 wells of the second column were filled up with 195 µL of medium + 5 µL of 24 h SE, while 3 wells of the third column (B3–D3) were filled up with 175 µL of medium + 5 µL of 24 h SE + 20 µL of targeted microalgae. Once the wells were filled up, the microplate was closed and sealed with parafilm and incubated at 25 °C, with the light intensity set to 2500 lux (33.75 µmol photons m−2s−1, followed by a 12-h of light and dark conditions). Microalgae growth was observed daily.
Figure 7 shows the setup of the microplate. The microplate was divided into three main zones, i.e., the outer wells (the buffer zone, red-marked) filled with 200 µL of Milli-Q water to minimise evaporation and maintain the humidity of the microplate. This zone prevents the wells containing samples from drying during the nine-day incubation period. The second zone comprised wells filled with control samples and placed alternatively between wells that contained microalgae. The 195 μL media and 5 μL SE (marked white) were filled with these wells as control. The well of the third area included 175 μL media, 5 μL of SE, and 20 μL of microalgae. Each sample was replicated three times. The average optical density (OD) of the corresponding samples were determined every 24 h for 9 days at the condition of 25 °C, a light intensity of 2500 lux with a 12:12 light-dark cycle. Once the microplate well was filled up, it was covered and sealed with parafilm to prevent contamination and evaporation. Each microplate contained two types of microalgae denoted as B2, C2, D2–B11, C11, and D11 for the upper part and E2, F2, G2–E11, F11, and G1 for the lower part.
The optical density (OD) of the microalgal growth has been determined. The OD readings of the samples were taken every 24 h for 9 days using a Tecan M200pro microplate reader at 680 nm. The sensitive mean value (SMV) of each replication well according to the types of soil samples was calculated using the formula SMV = {Sum(3)/3 is the sum of each 3-well replicates, the average count for each sample that contained microalgae have been subtracted with the average reading for control sample to determined microalgae cells concentration. This method was applied to all samples on the microplate.
Each sample and control experiment in a column were conducted in three microplate replicates. In order to obtain the net OD mean value, control OD values and samples have been subtracted. In this study, OD measurements for microalgal biomass were utilised as a simple, quick, and frequently employed approach in measuring algal culture density [55,81,82]. The specific growth rate (μ) and the division rate (k) were determined as below:
µ = ln N 2 N 1 t 2 t 1 k
= µ l n 2
where N2 and N1 indicate the OD at times t2 and t1, respectively.
The maximum OD and microalgae growth in the respective temperature treatment parameters of RMFR and AHFR SE were analysed using an independent samples t-test, one-way analysis of variance (ANOVA), and Tukey post hoc analysis. At the 95 percent confidence interval level, significant differences between the different extraction parameters were calculated. All statistical analyses were carried out using IBM SPSS statistics 20 software (Statistical Package for the Social Sciences).

5. Conclusions

This study revealed a positive outcome of improved microalgal (marine and freshwater) growth due to the addition of treated forest soil extracts to the culture medium. Soil extract can boost the potential microalga enriched biomass as an alternative to costly growth media components. The results suggested that the best extraction method is the autoclaved method at 121 °C twice for 24 h, yielding the highest nutrients recovery that supports the growth of the studied microalgae. The Ayer Hitam Forest Reserve (AHFR) soil extract enhanced microalgal growth up to 47.17%. Meanwhile, the AHFR soil extract showed a relatively higher concentration of nitrogen, carbon, and phosphorus and trace elements than Raja Musa Forest Reserve (RMFR) soil. AHFR shows superior results as compared to RMFR because of mineral soils characteristic. Autoclaving has been proven to aid the recovery of nutrients at elevated temperatures and potentially inhibits pathogens. As per the study, the method is particularly efficient as a high throughput technique for screening the reaction of microalgae to enrichment experiments using the novel microplate incubation technique. Nonetheless, our findings also suggest that the highest rate of growth and biomass growth from cell overpopulation can be restricted by the limited area of the microplate wells. Although this research concedes the use of forest soils in the culture medium for microalgal growth, environmental sustainability remains a priority throughout the study. Appropriate approaches and strict guidelines by the authority were followed to ensure that the environment is not affected. Therefore, the findings of this study would benefit the microalgae production industry by lowering the cost of mass crop enrichment with soil extracts while also potentially increasing the growth and nutritional value of microalgae.

Supplementary Materials

The following are available online at https://www.mdpi.com/article/10.3390/f13010079/s1, Figure S1: Map of sampling sites in this study (A) Raja Musa Forest Reserve (RMFR) (3°26′45.2” N 101°19′20.9” E) and (B) Ayer Hitam Forest Reserve (AHFR) (3°00′27.7” N 101°38′46.9” E), Selangor Malaysia.

Author Contributions

Conceptualisation, M.F.A. and E.F.H.; Funding acquisition, M.N.M.; Methodology, W.M.I.W.M.Z. and K.K.; Resources, N.F.D.; Software, F.S.; Supervision, V.S.K.; Validation, N.S.Y.; Visualisation, H.A.; Writing—original draft, N.S.Y.; Writing—review & editing, A.S. All authors have read and agreed to the published version of the manuscript.

Funding

This research was funded by the Ministry of Higher Education Malaysia (MOHE) and Japan Science and Technology Agency (JST) or Japan International Cooperation Agency (JICA), (Grant No. JPMJSA1509).

Institutional Review Board Statement

Not applicable.

Data Availability Statement

Not applicable.

Acknowledgments

Special thanks to the Ministry of Higher Education Malaysia (MOHE), Japan Science and Technology Agency (JST) or Japan International Cooperation Agency (JICA), through the project for JPMJSA1509), and the SATREPS-COSMOS Matching Fund.

Conflicts of Interest

The authors declare no conflict of interest.

Sample Availability

Samples of the compounds are not available.

References

  1. Sonnekus, M.J. Effects of Salinity on the Growth and Lipid Production of Ten Species of Microalgae from the Swartkops Saltworks: A Biodiesel Perspective. Ph.D. Thesis, Nelson Mandela Metropolitan University, Port Elizabeth, South Africa, 2010. [Google Scholar]
  2. Borowitzka, M.A. Commercial production of microalgae: Ponds, tanks, and fermenters. Prog. Ind. Microbiol. 1999, 35, 313–321. [Google Scholar]
  3. Medipally, S.R.; Yusoff, F.M.; Banerjee, S.; Shariff, M. Microalgae as sustainable renewable energy feedstock for biofuel production. BioMed. Res. Int. 2015, 2015, 1–13. [Google Scholar] [CrossRef]
  4. Metting, F.B. Biodiversity and application of microalgae. J. Ind. Microbiol. 1996, 17, 477–489. [Google Scholar] [CrossRef]
  5. Spolaore, P.; Joannis-Cassan, C.; Duran, E.; Isambert, A. Commercial applications of microalgae. J. Biosci. Bioeng. 2006, 101, 87–96. [Google Scholar] [CrossRef] [PubMed] [Green Version]
  6. Mobin, S.; Alam, F. Some promising microalgal species for commercial applications: A review. Energy Procedia 2017, 110, 510–517. [Google Scholar] [CrossRef]
  7. Priyadarshani, I.; Rath, B. Commercial and industrial applications of micro algae—A review. J. Algal Biomass Util. 2012, 3, 89–100. [Google Scholar]
  8. Pulz, O.; Gross, W. Valuable products from biotechnology of microalgae. Appl. Microbiol. Biotechnol. 2004, 65, 635–648. [Google Scholar] [CrossRef]
  9. Schenk, P.; Thomas-Hall, S.; Stephens, E.; Marx, U.; Mussgnug, J.; Posten, C.; Kruse, O.; Hankamer, B. Second generation biofuels: High efficiency microalgae for biodiesel production. Bioenergy Res. 2008, 1, 20–43. [Google Scholar] [CrossRef]
  10. Colla, L.M.; Reinehr, C.O.; Reichert, C.; Costa, J.A.V. Production of biomass and nutraceutical compounds by Spirulina platensis under different temperature and nitrogen regimes. Bioresour. Technol. 2007, 98, 1489–1493. [Google Scholar] [CrossRef]
  11. Enright, C.T.; Newkirk, G.F.; Craigie, J.S.; Castell, J.D. Growth of juvenile Ostrea edulis L. fed Chaetoceros gracilis Schütt of varied chemical composition. J. Exp. Mar. Biol. Ecol. 1986, 96, 15–26. [Google Scholar] [CrossRef]
  12. Suganya, T.; Varman, M.; Masjuki, H.H.; Renganathan, S. Macroalgae and microalgae as a potential source for commercial applications along with biofuels production: A biorefinery approach. Renew. Sustain. Energy Rev. 2016, 55, 909–941. [Google Scholar] [CrossRef]
  13. Guedes, A.C.; Malcata, F.X. Nutritional value and uses of microalgae in aquaculture. Aquaculture 2012, 10, 59–78. [Google Scholar]
  14. Cai, T.; Ge, X.; Park, S.Y.; Li, Y. Comparison of Synechocystis sp. PCC6803 and Nannochloropsis salina for lipid production using artificial seawater and nutrients from anaerobic digestion effluent. Bioresour. Technol. 2013, 144, 255–260. [Google Scholar] [CrossRef] [PubMed]
  15. Van Den Hende, S.; Vervaeren, H.; Saveyn, H.; Maes, G.; Boon, N. Microalgal bacterial floc properties are improved by a balanced inorganic/organic carbon ratio. Biotechnol. Bioeng. 2011, 108, 549–558. [Google Scholar] [CrossRef]
  16. Karthikeyan, S. A critical review: Microalgae as a renewable source for biofuel production. Int. J. Eng. Res. Technol. 2012, 1, 1–6. [Google Scholar]
  17. Andersen, R.A.; Kawachi, M. Microalgae isolation techniques. Algal Cult. Tech. 2005, 83–100. [Google Scholar]
  18. Kurano, N.; Ikemoto, H.; Miyashita, H.; Hasegawa, T.; Hata, H.; Miyachi, S. Fixation and utilization of carbon dioxide by microalgal photosynthesis. Energy Convers. Manag. 1995, 36, 689–692. [Google Scholar] [CrossRef]
  19. Velichkova, K.; Sirakov, I.; Stoyanova, S. Biomass production and wastewater treatment from aquaculture with Chlorella vulgaris under different carbon sources. Sci. Bulletin. Ser. F. Biotechnol. 2014, 18, 83–88. [Google Scholar]
  20. Lorenz, R.T.; Cysewski, G.R. Commercial potential for Haematococcus microalgae as a natural source of astaxanthin. Trends Biotechnol. 2000, 18, 160–167. [Google Scholar] [CrossRef]
  21. Doig III, M.T.; Martin, D.F. The effect of naturally occurring organic substances on the growth of a red tide organism. Water Res. 1974, 8, 601–606. [Google Scholar] [CrossRef]
  22. Becker, E.W. Micro-algae as a source of protein. Biotechnol. Adv. 2007, 25, 207–210. [Google Scholar] [CrossRef]
  23. Muller-Feuga, A. The role of microalgae in aquaculture: Situation and trends. J. Appl. Phycol. 2000, 12, 527–534. [Google Scholar] [CrossRef]
  24. Rahman, Z.; Singh, V.P. The relative impact of toxic heavy metals (THMs) (arsenic (As), cadmium (Cd), chromium (Cr)(VI), mercury (Hg), and lead (Pb)) on the total environment: An overview. Environ. Monit. Assess. 2019, 191, 1–21. [Google Scholar] [CrossRef] [PubMed]
  25. Kahlon, S.K.; Sharma, G.; Julka, J.M.; Kumar, A.; Sharma, S.; Stadler, F.J. Impact of heavy metals and nanoparticles on aquatic biota. Environ. Chem. Lett. 2018, 16, 919–946. [Google Scholar] [CrossRef]
  26. Khan, M.I.; Shin, J.H.; Kim, J.D. The promising future of microalgae: Current status, challenges, and optimization of a sustainable and renewable industry for biofuels, feed, and other products. Microb. Cell Factories 2018, 17, 36. [Google Scholar] [CrossRef]
  27. Morris, P. Method of Environmental Impact Assessment; Taylor and Francis Science: Abingdon, UK, 2009. [Google Scholar]
  28. Ichikogu, V.I. The dynamics of soil physical properties and exchangeable cations in secondary forest regenerating from degraded abandoned rubber plantation (Hevea brasiliensis) in orogun area of southern Nigeria. Ethiop. J. Environ. Stud. Manag. 2011, 4, 117–126. [Google Scholar] [CrossRef] [Green Version]
  29. Amlin, G.; Suratman, M.N.; Isa, N.N.M. Soil chemical analysis of secondary forest 30 years after logging activities at Krau Wildlife Reserve, Pahang, Malaysia. APCBEE Procedia 2014, 9, 75–81. [Google Scholar] [CrossRef] [Green Version]
  30. Heryati, Y.; Abdu, A.; Mahat, M.N.; Abdul-Hamid, H.; Jusop, S.; Majid, N.M.; Heriansyah, I.; Ajang, L.; Ahmad, K. Comparing the fertility of soils under Khaya ivorensis plantation and regenerated dengraded secondary forest. Am. J. Appl. Sci. 2011, 8, 472–480. [Google Scholar] [CrossRef]
  31. Abdu, A.; Karam, D.S.; Shamshuddin, J.; Majid, N.M.; Radziah, O.; Hazandy, A.H.; Zahari, I. Proposing a suitable soil quality index for natural, secondary and rehabilitated tropical forests in Malaysia. Afr. J. Biotechnol. 2012, 11, 3297–3309. [Google Scholar]
  32. FAO/WHO (Codex Alimentarius Commission). Food Additives and Contaminants. Joint FAO/WHO Food Standards Program, ALINORM 01/12A; FAO/WHO: Rome, Italy, 2001; pp. 1–289. [Google Scholar]
  33. Xu, D.M.; Fu, R.B.; Liu, H.Q.; Guo, X.P. Current knowledge from heavy metal pollution in Chinese smelter contaminated soils, health risk implications and associated remediation progress in recent decades: A critical review. J. Clean. Prod. 2021, 286, 124989. [Google Scholar] [CrossRef]
  34. Suess, H.E.; Urey, H.C. Abundances of the elements. Rev. Mod. Phys. 1956, 28, 53. [Google Scholar] [CrossRef]
  35. Krishnamoorthy, R.; Venkateswaran, V.; Senthilkumar, M.; Anandham, R.; Selvakumar, G.; Kim, K.; Kang, Y.; Sa, T. Potential microbiological approaches for the remediation of heavy metal-contaminated soils. In Plant-Microbe Interactions in Agro-Ecological Perspectives; Springer: Singapore, 2017; pp. 341–366. [Google Scholar]
  36. Singh, R.; Ahirwar, N.K.; Tiwari, J.; Pathak, J. Review on sources and effect of heavy metal in soil: Its bioremediation. Int. J. Res. Appl. Nat. Soc. Sci. 2018, 2018, 1–22. [Google Scholar]
  37. Osmani, M.; Bani, A.; Hoxha, B. Heavy Metals and Ni Phytoextractionin in the Metallurgical Area Soils in Elbasan. Albanian J. Agric. Sci. 2015, 14, 414. [Google Scholar]
  38. Zhang, W.; Liu, M.; Li, C. Soil heavy metal contamination assessment in the Hun-Taizi River watershed, China. Sci. Rep. 2020, 10, 1–10. [Google Scholar] [CrossRef]
  39. Addis, W.; Abebaw, A. Determination of heavy metal concentration in soils used for cultivation of Allium sativum L. (garlic) in East Gojjam Zone, Amhara Region, Ethiopia. Cogent Chem. 2017, 3, 1419422. [Google Scholar] [CrossRef]
  40. Lenart, A.; Wolny-Koładka, K. The effect of heavy metal concentration and soil pH on the abundance of selected microbial groups within ArcelorMittal Poland steelworks in Cracow. Bull. Environ. Contam. Toxicol. 2013, 90, 85–90. [Google Scholar] [CrossRef] [PubMed] [Green Version]
  41. Harter, R.D. Effect of soil pH on adsorption of lead, copper, zinc, and nickel. Soil Sci. Soc. Am. J. 1983, 47, 47–51. [Google Scholar] [CrossRef]
  42. Wang, A.S.; Angle, J.S.; Chaney, R.L.; Delorme, T.A.; Reeves, R.D. Soil pH effects on uptake of Cd and Zn by Thlaspi caerulescens. Plant Soil 2006, 281, 325–337. [Google Scholar] [CrossRef]
  43. Yi, L.; Hong, Y.; Wang, D.; Zhu, Y. Determination of free heavy metal ion concentrations in soils around a cadmium rich zinc deposit. Geochem. J. 2007, 41, 235–240. [Google Scholar] [CrossRef] [Green Version]
  44. Ogundele, D.T.; Adio, A.A.; Oludele, O.E. Heavy metal concentrations in plants and soil along heavy traffic roads in North Central Nigeria. J. Environ. Anal. Toxicol. 2015, 5, 1. [Google Scholar]
  45. Li, C.; Zhou, K.; Qin, W.; Tian, C.; Qi, M.; Yan, X.; Han, W. A review on heavy metals contamination in soil: Effects, sources, and remediation techniques. Soil Sediment Contam. Int. J. 2019, 28, 380–394. [Google Scholar] [CrossRef]
  46. Ewers, U. Standards, guidelines and legislative regulations concerning metals and their compounds. In Metals and Their Compounds in the Environment: Occurrence; Merian, E., Ed.; Analysis and Biological Relevance; VCH: Weinheim, Germany, 1991; pp. 458–468. [Google Scholar]
  47. Sharma, S.; Arunachalam, K.; Arunachalam, A. Soil Characteristics in the Disturbed and Undisturbed Plots of a Sal (Shorea robusta) Forest in the Shiwaliks of Indian Himalayan Region. Indian J. Hill Farming 2017, 30, 176–180. [Google Scholar]
  48. Hussain, F.; Eom, H.; Ali Toor, U.; Lee, C.S.; Oh, S.E. Rapid assessment of heavy metal-induced toxicity in water using micro-algal bioassay based on photosynthetic oxygen evolution. Environ. Eng. Res. 2020, 26, 200391. [Google Scholar] [CrossRef]
  49. Pan, X.; Chang, F.; Wang, S. Toxic effects of mercury on PSI and PSII activities, membrane potential and transthylakoid proton gradient in Microsorium pteropus. J. Photochem. Photobiol. B Biol. 2013, 127, 1–7. [Google Scholar]
  50. Singh, R.; Dubey, G.; Singh, V.P.; Srivastava, P.K.; Kumar, S.; Prasad, S.M. High light intensity augments mercury toxicity in cyanobacterium Nostoc muscorum. Biol. Trace Elem. Res. 2012, 149, 262–272. [Google Scholar] [CrossRef] [PubMed]
  51. Książyk, M.; Asztemborska, M.; Stęborowski, R.; Bystrzejewska-Piotrowska, G. Toxic effect of silver and platinum nanoparticles toward the freshwater microalga Pseudokirchneriella subcapitata. Bull. Environ. Contam. Toxicol. 2015, 94, 554–558. [Google Scholar] [CrossRef] [PubMed] [Green Version]
  52. Ribeiro, F.; Gallego-Urrea, J.A.; Jurkschat, K.; Crossley, A.; Hassellöv, M.; Taylor, C.; Loureiro, S. Silver nanoparticles and silver nitrate induce high toxicity to Pseudokirchneriella subcapitata, Daphnia magna and Danio rerio. Sci. Total. Environ. 2014, 466, 232–241. [Google Scholar] [CrossRef]
  53. Lukavský, J.F.; Cepák, V. Toxicity of metals, Al, Cd, Co, Cr, Cu, Fe, Ni, Pb and Zn on microalgae, using microplate bioassay 1: Chlorella kessleri, Scenedesmus quadricauda, sc. subspicatus and Raphidocelis subcapitata (Selenastrum capricornutum). Algol. Stud. Arch. Für Hydrobiol. Suppl. Vol. 2003, 110, 127–141. [Google Scholar] [CrossRef]
  54. Huang, Z.; Chen, B.; Zhang, J.; Yang, C.; Wang, J.; Song, F.; Li, S. Absorption and speciation of arsenic by microalgae under arsenic-copper Co-exposure. Ecotoxicol. Environ. Saf. 2021, 213, 112024. [Google Scholar] [CrossRef]
  55. Borowitzka, M.A.; Beardall, J.; Raven, J.A. (Eds.) The Physiology of Microalgae; Springer International Publishing: Cham, Switzerland, 2016; Volume 6. [Google Scholar]
  56. Sanz-Luque, E.; Chamizo-Ampudia, A.; Llamas, A.; Galvan, A.; Fernandez, E. Understanding nitrate assimilation and its regulation in microalgae. Front. Plant Sci. 2015, 6, 899. [Google Scholar] [CrossRef] [Green Version]
  57. Kolzau, S.; Wiedner, C.; Rücker, J.; Köhler, J.; Köhler, A.; Dolman, A.M. Seasonal patterns of nitrogen and phosphorus limitation in four German lakes and the predictability of limitation status from ambient nutrient concentrations. PLoS ONE 2014, 9, e96065. [Google Scholar] [CrossRef] [PubMed] [Green Version]
  58. Podevin, M.; De Francisci, D.; Holdt, S.L.; Angelidaki, I. Effect of nitrogen source and acclimatization on specific growth rates of microalgae determined by a high-throughput in vivo microplate autofluorescence method. J. Appl. Phycol. 2015, 27, 1415–1423. [Google Scholar] [CrossRef] [Green Version]
  59. Li, T.; Zheng, Y.; Yu, L.; Chen, S. High productivity cultivation of a heat-resistant microalga Chlorella sorokiniana for biofuel production. Bioresour. Technol. 2013, 131, 60–67. [Google Scholar] [CrossRef] [PubMed]
  60. Wu, L.F.; Chen, P.C.; Lee, C.M. The effects of nitrogen sources and temperature on cell growth and lipid accumulation of microalgae. Int. Biodeterior. Biodegrad. 2013, 85, 506–510. [Google Scholar] [CrossRef]
  61. Chen, M.; Tang, H.; Ma, H.; Holland, T.C.; Ng, K.S.; Salley, S.O. Effect of nutrients on growth and lipid accumulation in the green algae Dunaliella tertiolecta. Bioresour. Technol. 2011, 102, 1649–1655. [Google Scholar] [CrossRef] [PubMed]
  62. Ferreira, L.S.; Rodrigues, M.S.; Converti, A.; Sato, S.; Carvalho, J.C.M. A new approach to ammonium sulphate feeding for fed-batch Arthrospira (Spirulina) platensis cultivation in tubular photobioreactor. Biotechnol. Prog. 2010, 26, 1271–1277. [Google Scholar] [CrossRef]
  63. Lourenco, S.O.; Barbarino, E.; Mancini-Filho, J.; Schinke, K.P.; Aidar, E. Effects of different nitrogen sources on the growth and biochemical profile of 10 marine microalgae in batch culture: An evaluation for aquaculture. Phycologia 2002, 41, 158–168. [Google Scholar] [CrossRef]
  64. Li, Y.; Horsman, M.; Wang, B.; Wu, N.; Lan, C.Q. Effects of nitrogen sources on cell growth and lipid accumulation of green alga Neochloris oleoabundans. Appl. Microbiol. Biotechnol. 2008, 81, 629–636. [Google Scholar] [CrossRef]
  65. Roopnarain, A.; Sym, S.; Gray, V.M. Effect of nitrogenous resource on growth, biochemical composition and ultrastructure of I sochrysis galbana (I sochrysidales, H aptophyta). Phycol. Res. 2015, 63, 43–50. [Google Scholar] [CrossRef]
  66. Ruangsomboon, S. Effects of different media and nitrogen sources and levels on growth and lipid of green microalga Botryococcus braunii KMITL and its biodiesel properties based on fatty acid composition. Bioresour. Technol. 2015, 191, 377–384. [Google Scholar] [CrossRef]
  67. Rizwan, M.; Mujtaba, G.; Memon, S.A.; Lee, K.; Rashid, N. Exploring the potential of microalgae for new biotechnology applications and beyond: A review. Renew. Sustain. Energy Rev. 2018, 92, 394–404. [Google Scholar] [CrossRef]
  68. Juneja, A.; Ceballos, R.M.; Murthy, G.S. Effects of environmental factors and nutrient availability on the biochemical composition of algae for biofuels production: A review. Energies 2013, 6, 4607–4638. [Google Scholar] [CrossRef] [Green Version]
  69. Ren, L.; Wang, P.; Wang, C.; Chen, J.; Hou, J.; Qian, J. Algal growth and utilization of phosphorus studied by combined mono-culture and co-culture experiments. Environ. Pollut. 2017, 220, 274–285. [Google Scholar] [CrossRef]
  70. Berns, A.E.; Philipp, H.; Narres, H.D.; Burauel, P.; Vereecken, H.; Tappe, W. Effect of gamma-sterilization and autoclaving on soil organic matter structure as studied by solid state NMR, UV and fluorescence spectroscopy. Eur. J. Soil Sci. 2008, 59, 540–550. [Google Scholar] [CrossRef]
  71. Daliry, S.; Hallajisani, A.; Mohammadi, R.J.; Nouri, H.; Golzary, A. Investigation of optimal condition for Chlorella vulgaris microalgae growth. Glob. J. Environ. Sci. Manag. 2007, 3, 217–230. [Google Scholar]
  72. Metsoviti, M.N.; Katsoulas, N.; Karapanagiotidis, I.T.; Papapolymerou, G. Effect of nitrogen concentration, two-stage and prolonged cultivation on growth rate, lipid and protein content of Chlorella vulgaris. J. Chem. Technol. Biotechnol. 2019, 94, 1466–1473. [Google Scholar] [CrossRef]
  73. Lian, J.; Wijffels, R.H.; Smidt, H.; Sipkema, D. The effect of the algal microbiome on industrial production of microalgae. Microb. Biotechnol. 2018, 11, 806–818. [Google Scholar] [CrossRef] [Green Version]
  74. Marjakangas, J.M.; Chen, C.Y.; Lakaniemi, A.M.; Puhakka, J.A.; Whang, L.M.; Chang, J.S. Simultaneous nutrient removal and lipid production with Chlorella vulgaris on sterilized and non-sterilized anaerobically pretreated piggery wastewater. Biochem. Eng. J. 2015, 103, 177–184. [Google Scholar] [CrossRef]
  75. Warcup, J.H. Chemical and biological aspects of soil sterilization. Soils Fertil. 1957, 20, 1–5. [Google Scholar]
  76. Powlson, D.S.; Jenkinson, D.S. Effects of biocidal treatments on metabolism in soil. 2. gamma-irradiation, autoclaving, air-drying and fumigation. Soil Biol. Biochem. 1976, 8, 179–188. [Google Scholar] [CrossRef]
  77. Chew, K.W.; Chia, S.R.; Show, P.L.; Yap, Y.J.; Ling, T.C.; Chang, J.S. Effects of water culture medium, cultivation systems and growth modes for microalgae cultivation: A review. J. Taiwan Inst. Chem. Eng. 2018, 91, 332–344. [Google Scholar] [CrossRef]
  78. Kawasaki, N.; Kushairi, M.R.M.; Nagao, N. Release of nitrogen and phosphorus from aquaculture farms to Selangor River, Malaysia. Int. J. Environ. Sci. Dev. 2016, 7, 113. [Google Scholar] [CrossRef] [Green Version]
  79. Yaacob, N.S.; Ahmad, M.F.; Kawasaki, N.; Maniyam, M.N.; Abdullah, H.; Hashim, E.F.; Sjahrir, F.; Wan Mohd Zamri, W.M.; Komatsu, K.; Kuwahara, V.S. Kinetics Growth and Recovery of Valuable Nutrients from Selangor Peat Swamp and Pristine Forest Soils Using Different Extraction Methods as Potential Microalgae Growth Enhancers. Molecules 2021, 26, 653. [Google Scholar] [CrossRef] [PubMed]
  80. Arumugam, K.; Ahmad, M.F.; Yaacob, N.S.; Ikram, W.M.; Maniyam, M.N.; Abdullah, H.; Katayama, T.; Komatsu, K.; Kuwahara, V.S. Enhancement of targeted microalgae species growth using aquaculture sludge extracts. Heliyon 2020, 6, e04556. [Google Scholar] [CrossRef] [PubMed]
  81. Sharma, M.R.; Raju, N.S. Correlation of heavy metal contamination with soil properties of industrial areas of Mysore, Karnataka, India by cluster analysis. Int. Res. J. Environ. Sci. 2013, 2, 22–27. [Google Scholar]
  82. Reay, D.S.; Nedwell, D.B.; Priddle, J.; Ellis-Evans, J.C. Temperature dependence of inorganic nitrogen uptake: Reduced affinity for nitrate at suboptimal temperatures in both algae and bacteria. Appl. Environ. Microbiol. 1999, 65, 2577. [Google Scholar] [CrossRef] [Green Version]
Figure 1. Effect of ammonia and nitrate concentration on the growth of C. radiosa, N. conjuncta, and N. subsolitaria from Raja Musa Forest Reserve (RMFR) with different extraction methods. Error bars represent standard deviation (n = 3).
Forests 13 00079 g001
Figure 2. Effect of ammonia and nitrate concentration on the growth of C. radiosa, N. conjuncta, and N. subsolitaria from Ayer Hitam Forest Reserve (AHFR) with different extraction methods. The error bars (n = 3) represent the standard deviation.
Forests 13 00079 g002
Figure 3. OD at 680 nm of C. radiosa in control (media without soil extract), media with 105 °C, media with 105 °C twice, media with 121 °C, media with 121 °C twice, and media with 24 h (media with 105 °C—autoclave 105 °C; media with 105 °C twice—autoclave 105 °C 2 × after natural extraction 24 h; media with 121 °C—autoclave 121 °C after natural extraction 24 h; media with 121 °C × 2—autoclave 121 °C twice after natural extraction 24 h; media with 24 h—natural extraction for 24 h). (a) RMFR SE and (b) AHFR SE. The error bars (n = 3) indicating the standard deviation.
Forests 13 00079 g003
Figure 4. OD at 680 nm of N. conjuncta in control (media without soil extract), media with 105 °C, media with 105 °C twice, media with 121 °C, media with 121 °C twice, and media with 24 h (media with 105 °C—autoclave 105 °C; media with 105 °C twice—autoclave 105 °C 2 × after natural extraction 24 h; media with 121 °C—autoclave 121 °C after natural extraction 24 h; media with 121 °C × 2—autoclave 121 °C twice after natural extraction 24 h; media with 24 h—natural extraction for 24 h). (a) RMFR SE and (b) AHFR SE. The error bars (n = 3) indicating the standard deviation.
Forests 13 00079 g004
Figure 5. OD at 680 nm of N. subsolitaria in control (media without soil extract), media with 105 °C, media with 105 °C twice, media with 121 °C, media with 121 °C twice, and media with 24 h (media with 105 °C—autoclave 105 °C; media with 105 °C twice—autoclave 105 °C 2 × after natural extraction 24 h; media with 121 °C—autoclave 121 °C after natural extraction 24 h; media with 121 °C × 2—autoclave 121 °C twice after natural extraction 24 h; media with 24 h—natural extraction for 24 h). (a) RMFR SE and (b) AHFR SE. The error bars (n = 3) indicating the standard deviation.
Forests 13 00079 g005
Figure 6. Specific growth rate, µ, of C. radiosa, N. conjuncta, and N. subsolitaria, in control (media without soil extract), media with 105 °C, media with 105 °C twice, media with 121 °C, media with 121 °C twice and media with 24 h at (a) RMFR SE and (b) AHFR SE. (media with 105 °C- autoclave 105 °C; media with 105 °C twice—autoclave 105 °C 2 × after natural extraction 24 h; media with 121 °C- autoclave 121 °C after natural extraction 24 h; media with 121 °C × 2- autoclave 121 °C twice after natural extraction 24 h; media with 24 h- natural extraction for 24 h). The error bars (n = 3) represent the standard deviation. a The overall mean of the same row with distinct superscripts change significantly (p < 0.05) using ANOVA and Tukey post hoc.
Forests 13 00079 g006
Figure 7. Microplate incubation techniques.
Forests 13 00079 g007
Table 1. The means value of physical properties for RMFR and AHFR soil samples.
Soil SampleRaja MusaAyer Hitam
pH3.36 ± 0.005.81 ± 0.02
Sand (%)42.48 ± 0.0033.69 ± 0.00
Silt (%)50.95 ± 0.0058.3 ± 0.00
Clay (%)6.52 ± 0.048.01 ± 0.00
The value shows as mean value with (n = 3) ± standard deviation.
Table 2. The means value of chemicals properties for RM and AH soils samples.
Soil LocationRaja MusaAyer Hitam
SoilExtractSoilExtract
Total Organic Carbon (%)5.03 ± 0.02 5.23 ± 0.07
Nitrogen (%)0.28 ± 0.000.00812 ± 0.000.35 ± 0.000.00084 ± 0.00
Phosphorus (%)1.07 ± 0.000.001786 ± 0.001.49 ± 0.000.000423 ± 0.00
Potassium (mg/l)3.66 ± 0.159.66 ± 0.00886.77 ± 30.676.09 ± 0.00
Trace Metals (mg/kg)
Iron832.84 ± 3.74-1905.48 ± 68.42-
ArsenicND < 1ND < 186.79 ± 4.98ND < 10
CadmiumND < 0.002ND < 0.002ND < 0.5ND < 0.002
ChromiumND < 2ND < 235.84 ± 1.16ND < 10
Plumbum/Lead9.15 ± 0.68ND < 0.01506.16 ± 33.54ND < 0.01
Copper0.70 ± 0.05ND < 0.0184.41 ± 61.440.01 ± 0.00
NickelND < 0.010.02 ± 0.00ND < 0.50.01 ± 0.00
Zinc4.91 ± 0.060.19 ± 0.00121.83 ± 33.440.07 ± 0.00
MercuryND < 1ND < 1ND < 0.5ND < 0.5
SilverND < 10ND < 10ND < 0.5ND < 0.5
ND = not determined. The value shows as mean value with (n = 3) ± standard deviation.
Table 3. The maximum OD of C. radiosa, N. conjuncta, and N. subsolitaria on control (media without soil extract), 105 °C, 105 °C twice, 121 °C, 121 °C twice, and 24 h SE from RMFR and AHFR.
SE TypeMicroalgaeControlModified SE
Media with 105 °CMedia with 105 °C twiceMedia with 121 °CMedia with 121 °C twiceMedia with 24 h
RMFR SEC. radiosa0.16 ± 0.00 a0.06 ± 0.00 a0.04 ± 0.00 b0.07 ± 0.08 a0.05 ± 0.01 b0.12 ± 0.09 a
N. conjuncta0.62 ± 0.00 a0.48 ± 0.01 a0.45 ± 0.00 a0.48 ± 0.00 a0.45 ± 0.01 a0.54 ± 0.02 a
N. subsolitaria0.59 ± 0.00 a0.46 ± 0.02 a0.43 ± 0.00 a0.46 ± 0.00 a0.41 ± 0.03 a0.44 ± 0.02 a
AHFR SEC. radiosa0.63 ± 0.02 a0.19 ± 0.02 b0.19 ± 0.06 b0.19 ± 0.02 b0.22 ± 0.01 b0.09 ± 0.04 b
N. conjuncta0.28 ± 0.04 a0.52 ± 0.01 a0.51 ± 0.01 a0.50 ± 0.03 a0.53 ± 0.01 a0.52 ± 0.05 a
N. subsolitarias0.27 ± 0.02 a0.46 ± 0.02 a0.43 ± 0.01 a0.35 ± 0.04 a0.25 ± 0.01 a0.48 ± 0.03 a
Note: The values displayed are the average for replicates of three with standard deviation. a to b The overall mean of the same row with distinct superscripts change significantly (p < 0.05) using ANOVA and Tukey post hoc.
Table 4. The division rate, k, of C. radiosa, N. conjuncta, and N. subsolitaria on control (media without soil extract), 105 °C, 105 °C twice, 121 °C, 121 °C twice, and 24 h SE from RMFR and AHFR.
SE TypeMicroalgaeControlModified SE
Media with 105 °CMedia with 105 °C twiceMedia with 121 °CMedia with 121 °C twiceMedia with 24 h
RM SEC. radiosa0.13 ± 0.01 a0.00 ± 0.00 a0.01 ± 0.02 a0.06 ± 0.00 a0.01 ± 0.01 a0.07 ± 0.01 a
N. conjuncta0.18 ± 0.00 a0.15 ± 0.01 a0.15 ± 0.00 a0.15 ± 0.01 a0.02 ± 0.00 a0.18 ± 0.00 a
N. subsolitaria0.16 ± 0.02 a0.13 ± 0.01 a0.13 ± 0.00 a0.14 ± 0.00 a0.13 ± 0.01 a0.14 ± 0.00 a
AH SEC. radiosa0.11 ± 0.01 a0.01 ± 0.01 a0.04 ± 0.00 a0.06 ± 0.00 a0.07 ± 0.00 a0.01 ± 0.01 a
N. conjuncta0.06 ± 0.00 a0.16 ± 0.00 a0.15 ± 0.00 a0.14 ± 0.00 a0.16 ± 0.00 a0.15 ± 0.01 a
N. subsolitaria0.09 ± 0.00 a0.13 ± 0.00 a0.13 ± 0.00 a0.09 ± 0.00 a0.10 ± 0.00 a0.15 ± 0.00 a
Note: The values displayed are the average of three replicates with standard deviation. a The overall mean of the same row with distinct superscripts change significantly (p < 0.05) using ANOVA and Tukey post hoc.
Table 5. Location of sample collections.
SiteGps
Raja Musa Forest Reserve (RM)(3°26′45.2” N 101°19′20.9” E)
Ayer Hitam Forest Reserve (AH)(3°00′’27.7” N 101°38′46.9” E)
Table 6. Analytical method used for selected parameters.
ParametersUnitAnalysis Method
Particle Size Distribution (PSD)
Sand%USDA/NRCS Soil Taxonomy
Silt%USDA/NRCS Soil Taxonomy
Clay%USDA/NRCS Soil Taxonomy
pH-APHA 4500-H B
Nitrogen (N)%MS 417L PART 3: 1994
Phosphorus (P)%MS 678: PART 8
Potassium (K)%(MS 417: PART 3: 1994): MS 678:
PART VI to IX: 1980 (APHA 3500 K))
Total organic carbon%MS 678: PART 3A: 1980
Arsenic (As)mg/kgUSEPA 1311 (APHA 3111-B)
Iron (Fe)mg/kgUSEPA 1311 (APHA 3111-B)
Cadmium (Cd)mg/kgUSEPA 1311 (APHA 3111-B)
Chromium (Cr)mg/kgUSEPA 1311 (APHA 3111-B)
Lead (Pb)mg/kgUSEPA 1311 (APHA 3111-B)
Copper (Cu)mg/kgUSEPA 1311 (APHA 3111-B)
Nickel (Ni)mg/kgUSEPA 1311 (APHA 3111-B)
Zinc (Zn)mg/kgUSEPA 1311 (APHA 3111-B)
Mercury (Hg)mg/kgUSEPA 1311 (APHA 3111-B)
Silver (Ag)mg/kgUSEPA 1311 (APHA 3111-B)
Table 7. Soil extraction method.
Extraction MethodsProcedure
Natural Extraction 24 H (NE-24 H)Soil extracted at room temperature for 24 h
Autoclave 105 °C (105 °C)Soil extracted at 105 °C autoclave, 1 h
Autoclave 121 °C (121 °C)Soil extracted at 121 °C autoclave, 1 h
Autoclave 105 °C twice (105 °C × 2)Soil extracted at 105 °C autoclave for 1 h, and after cooled (~30 min), soil extracted at 105 °C autoclave, 1 h
Autoclave 121 °C twice (×2) (121 °C × 2)Soil extracted at 121 °C autoclave for 1 h, and after cooled (~30 min), soil extracted at 121 °C autoclave, 1 h
Publisher’s Note: MDPI stays neutral with regard to jurisdictional claims in published maps and institutional affiliations.

