
Does the Policy of Ecological Forest Rangers (EFRs) for the Impoverished Populations Reduce Forest Disasters?—Empirical Evidence from China


Abstract
:1. Introduction
2. Literature Review
2.1. Current Status of Research on Environmental Payment Project Policy Effects
2.2. The Current Research Situation Regarding the Effects of EFR Policies
3. Policy Background and Hypothesis
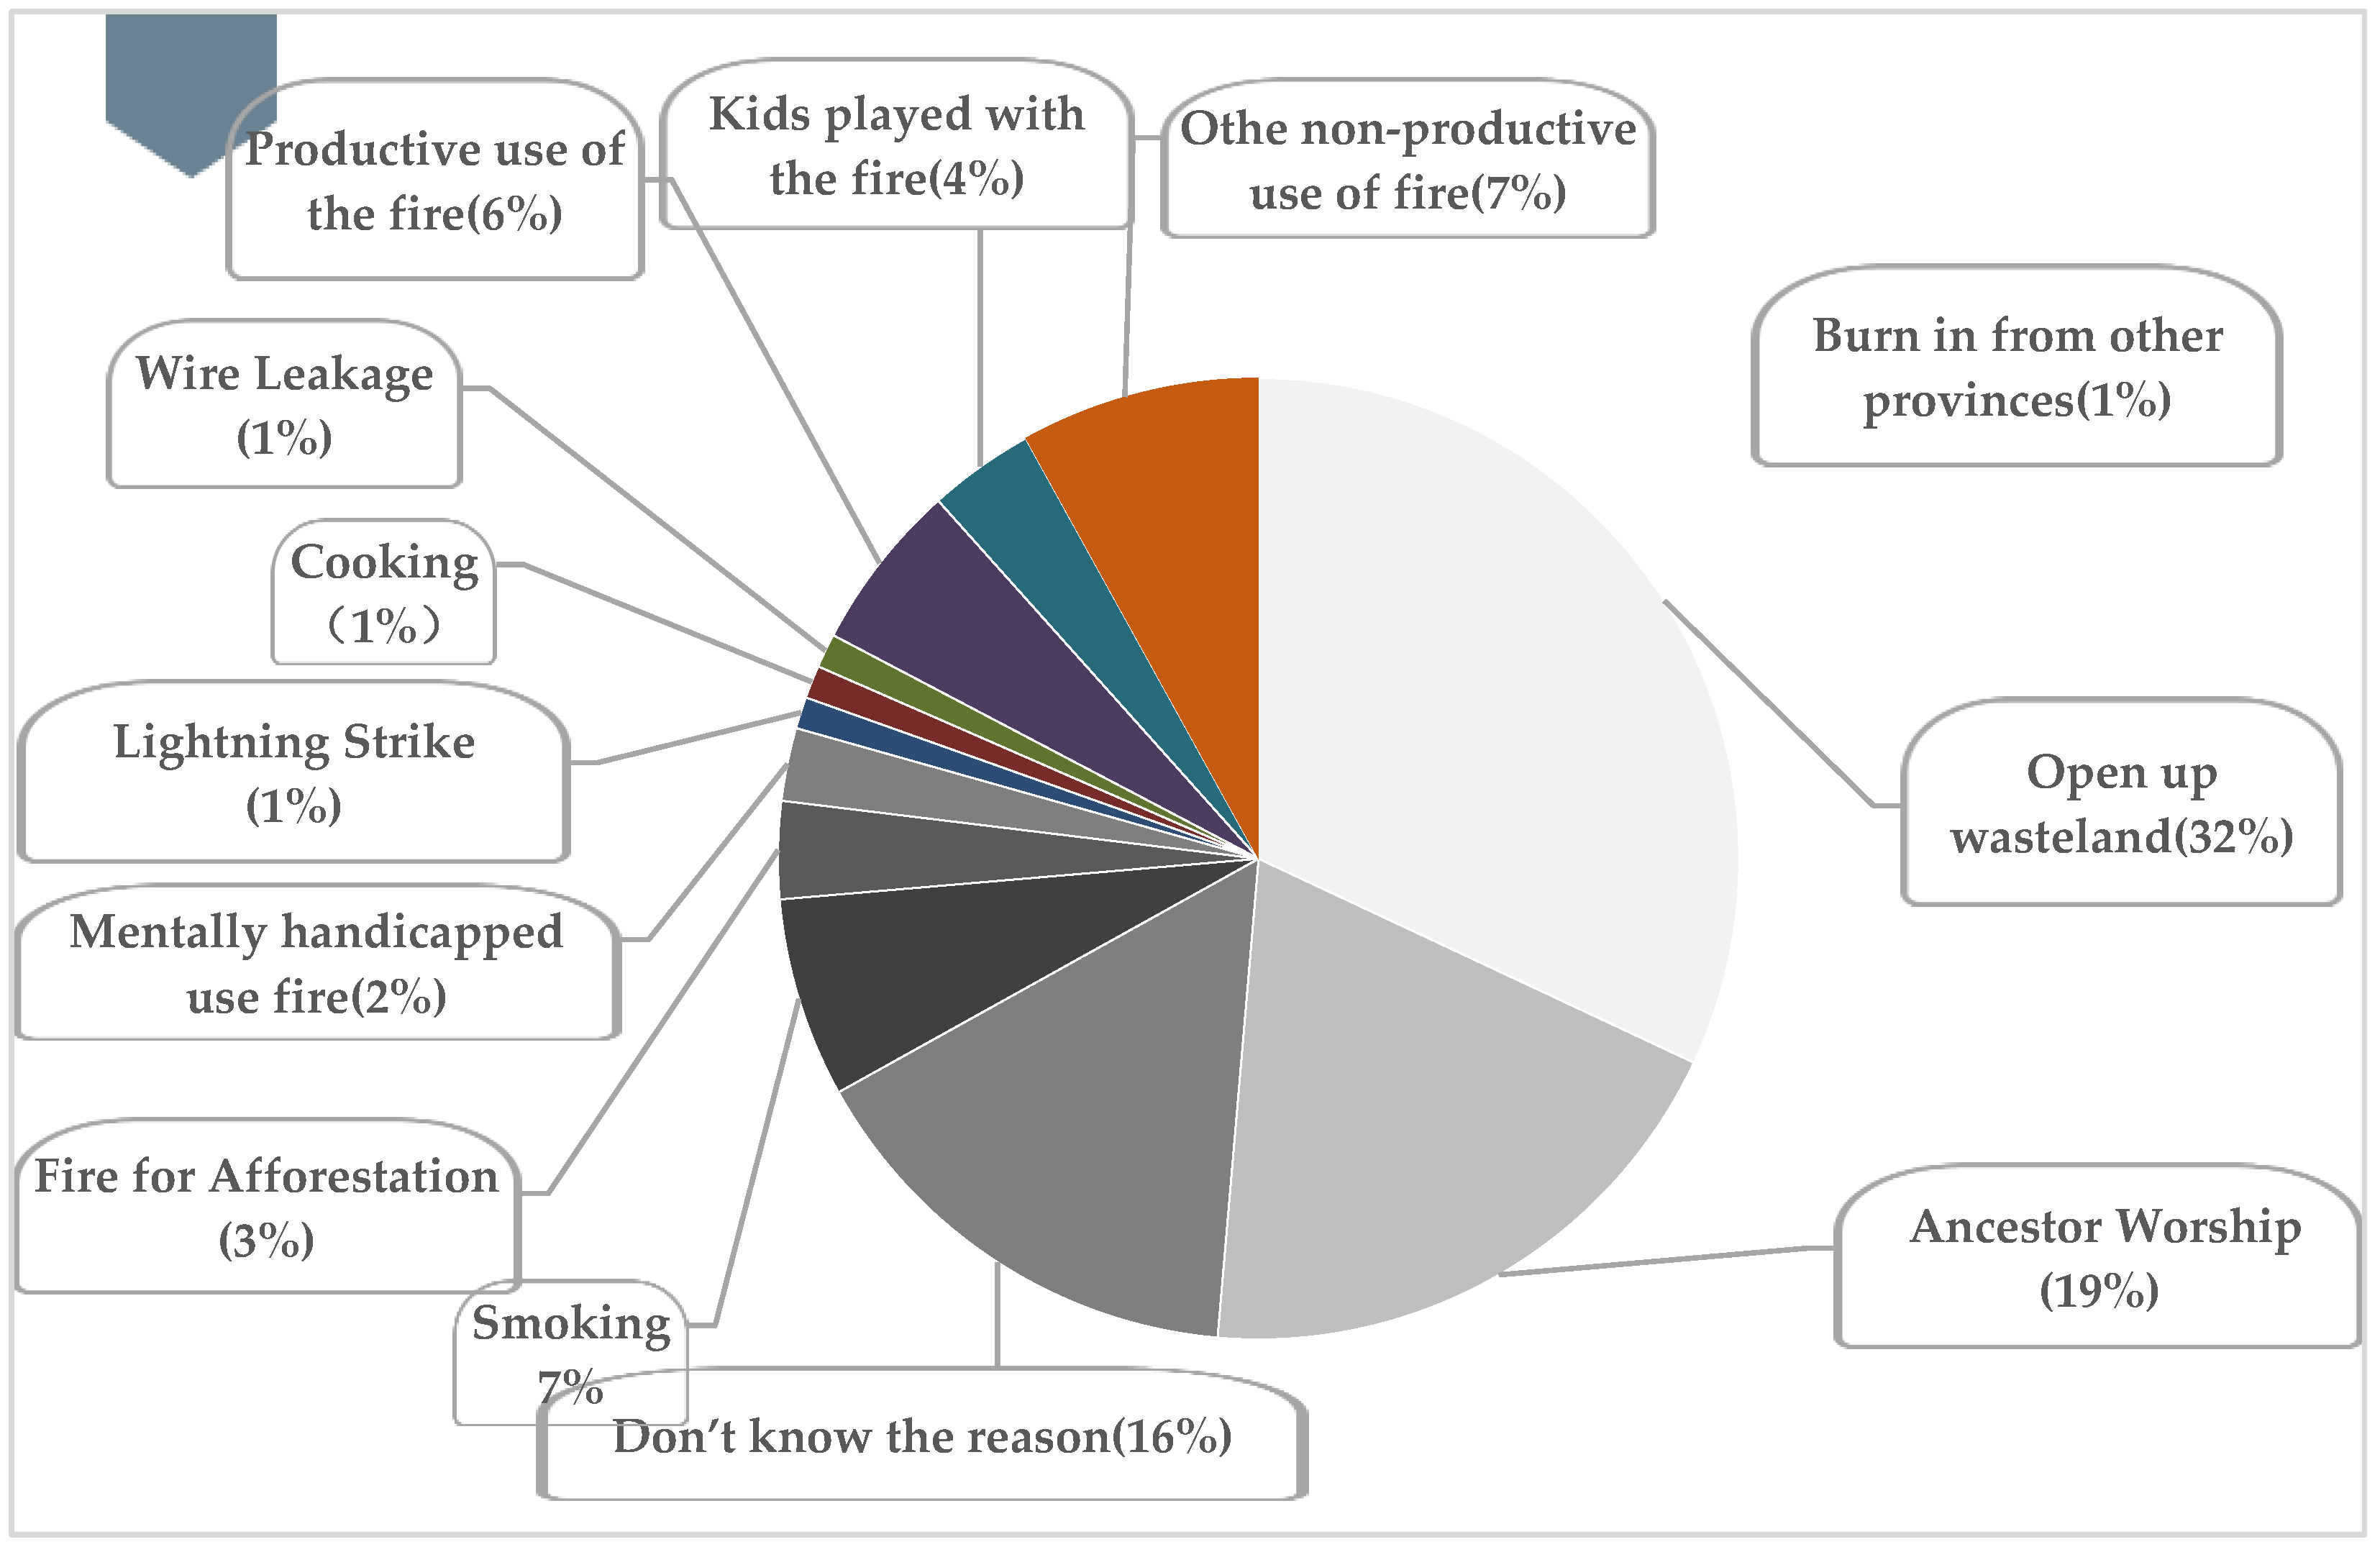
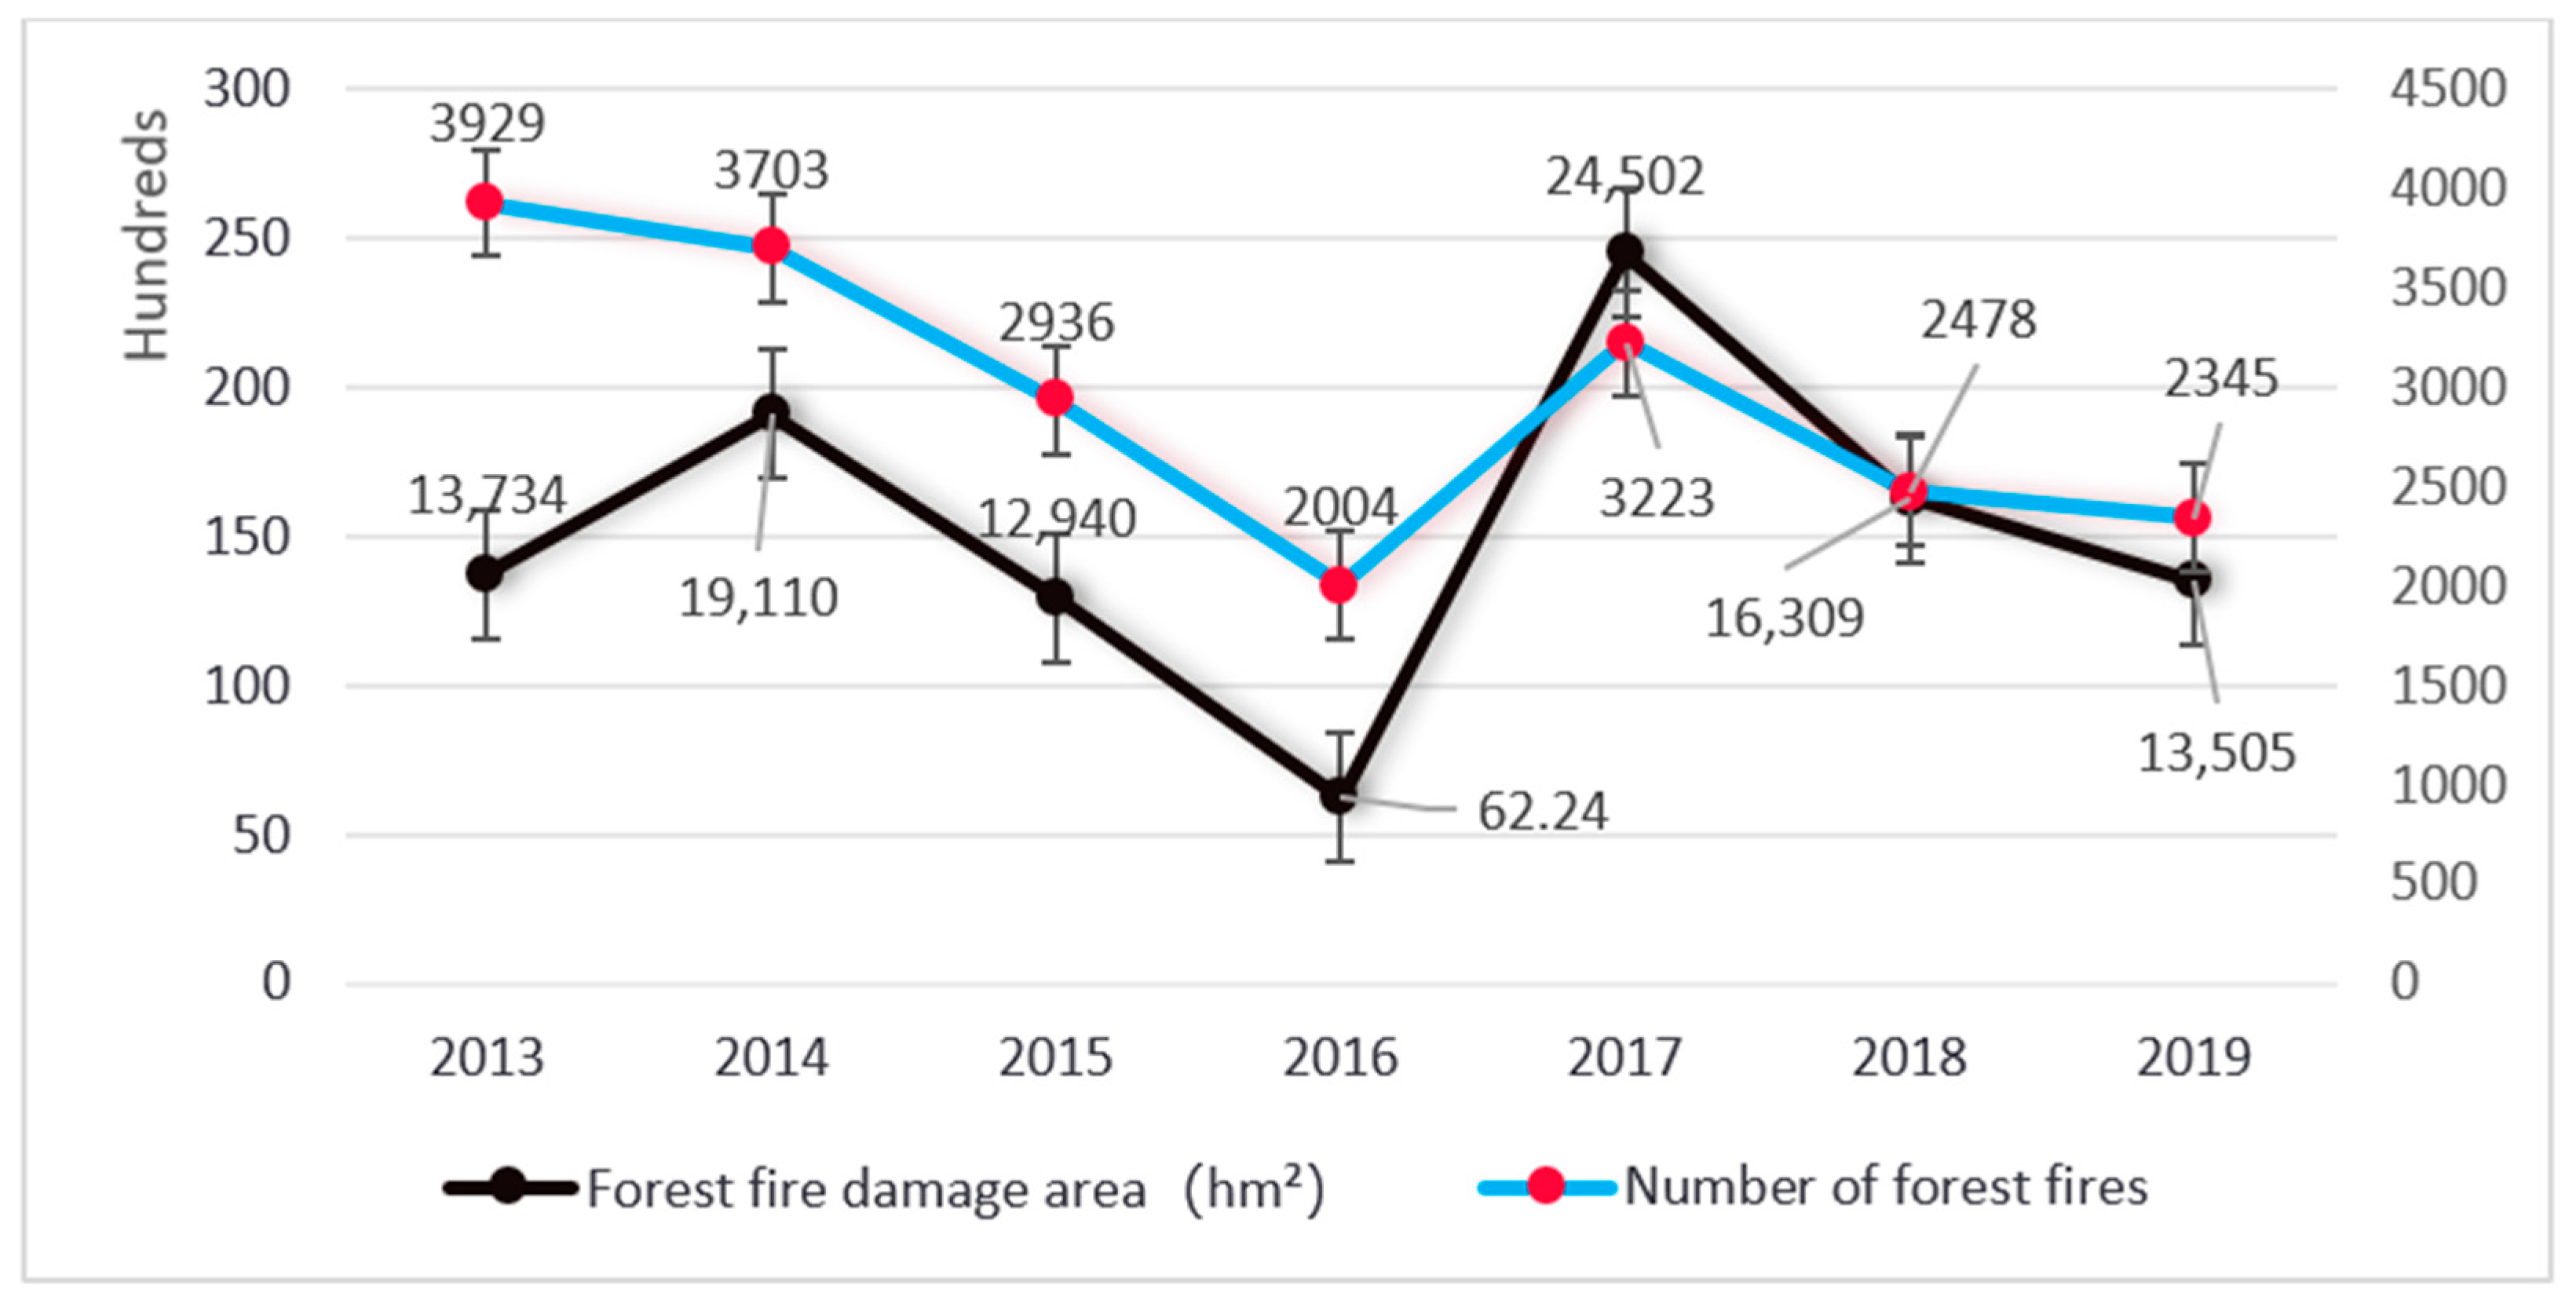
3.1. Policy Background
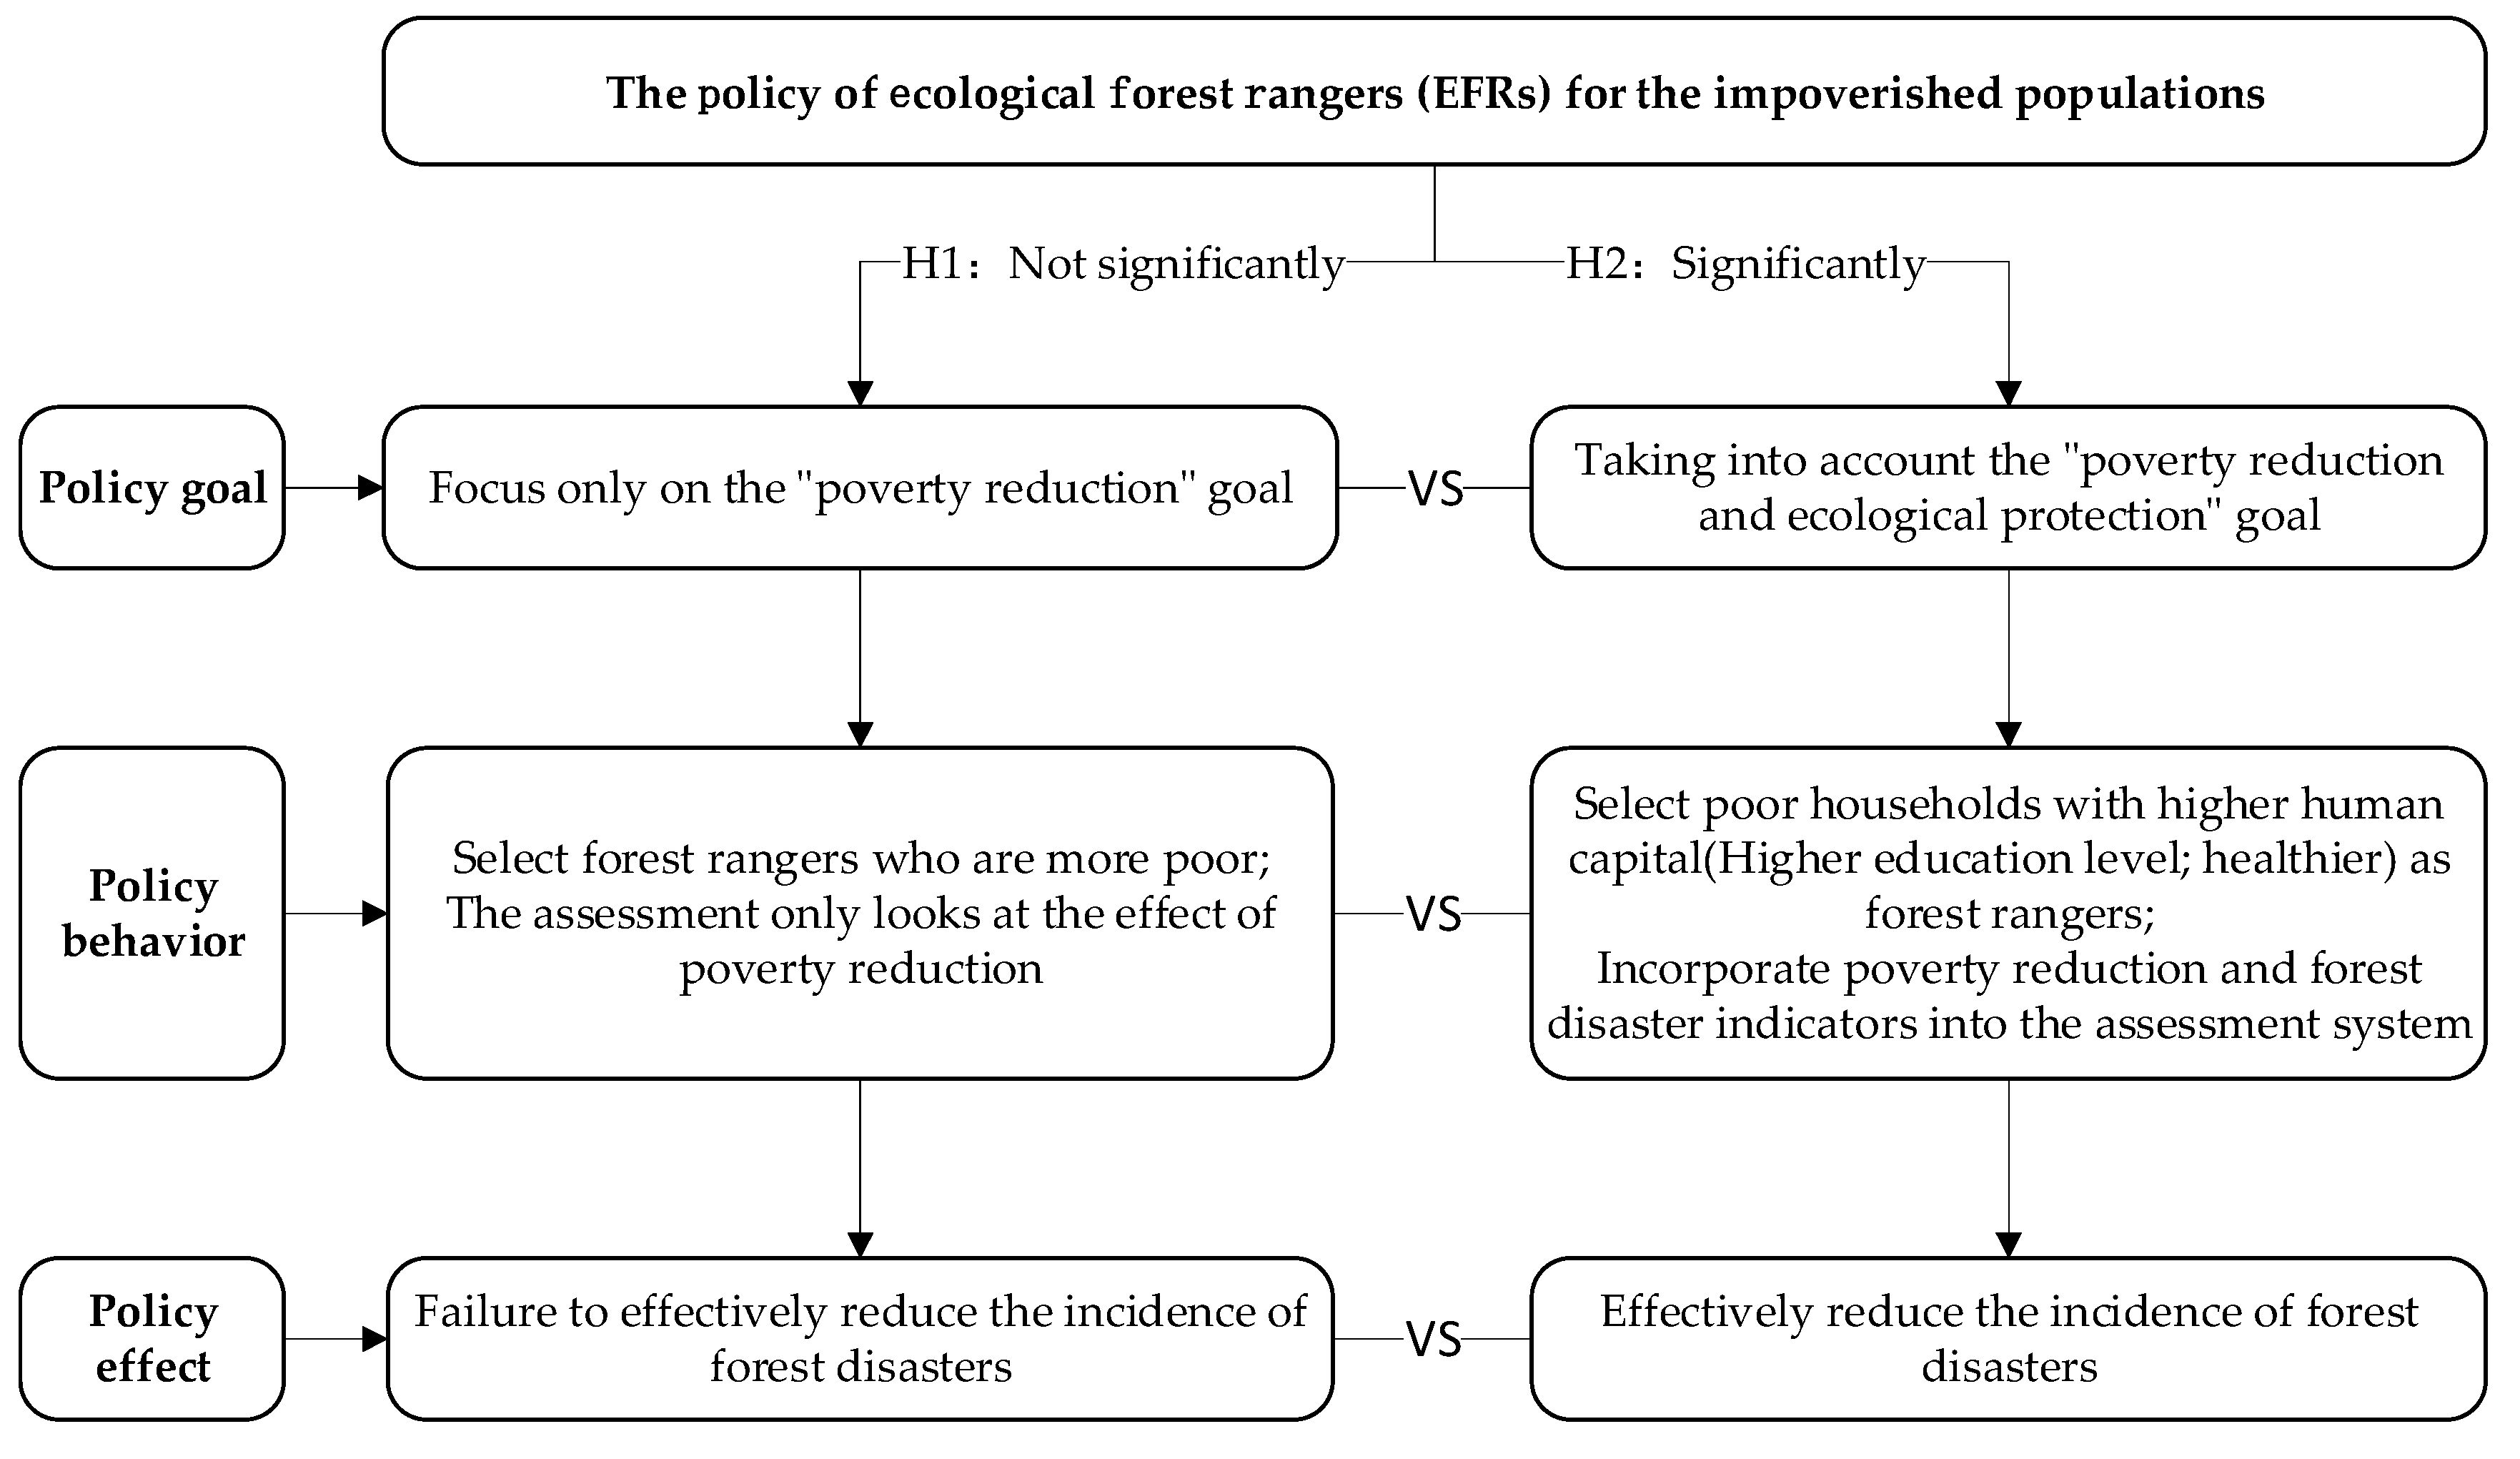
3.2. Hypothesis
4. Data and Model Design
4.1. Data
4.2. Model Design
4.3. Variable Selection and Definition
4.4. Methods
5. Results
5.1. Descriptive Statistical Analysis
5.2. Analysis of Empirical Results
5.2.1. Basic Regression Results
5.2.2. Analysis of Heterogeneous Effect
6. Discussion
7. Conclusions and Policy Implications
7.1. Conclusions
- (1)
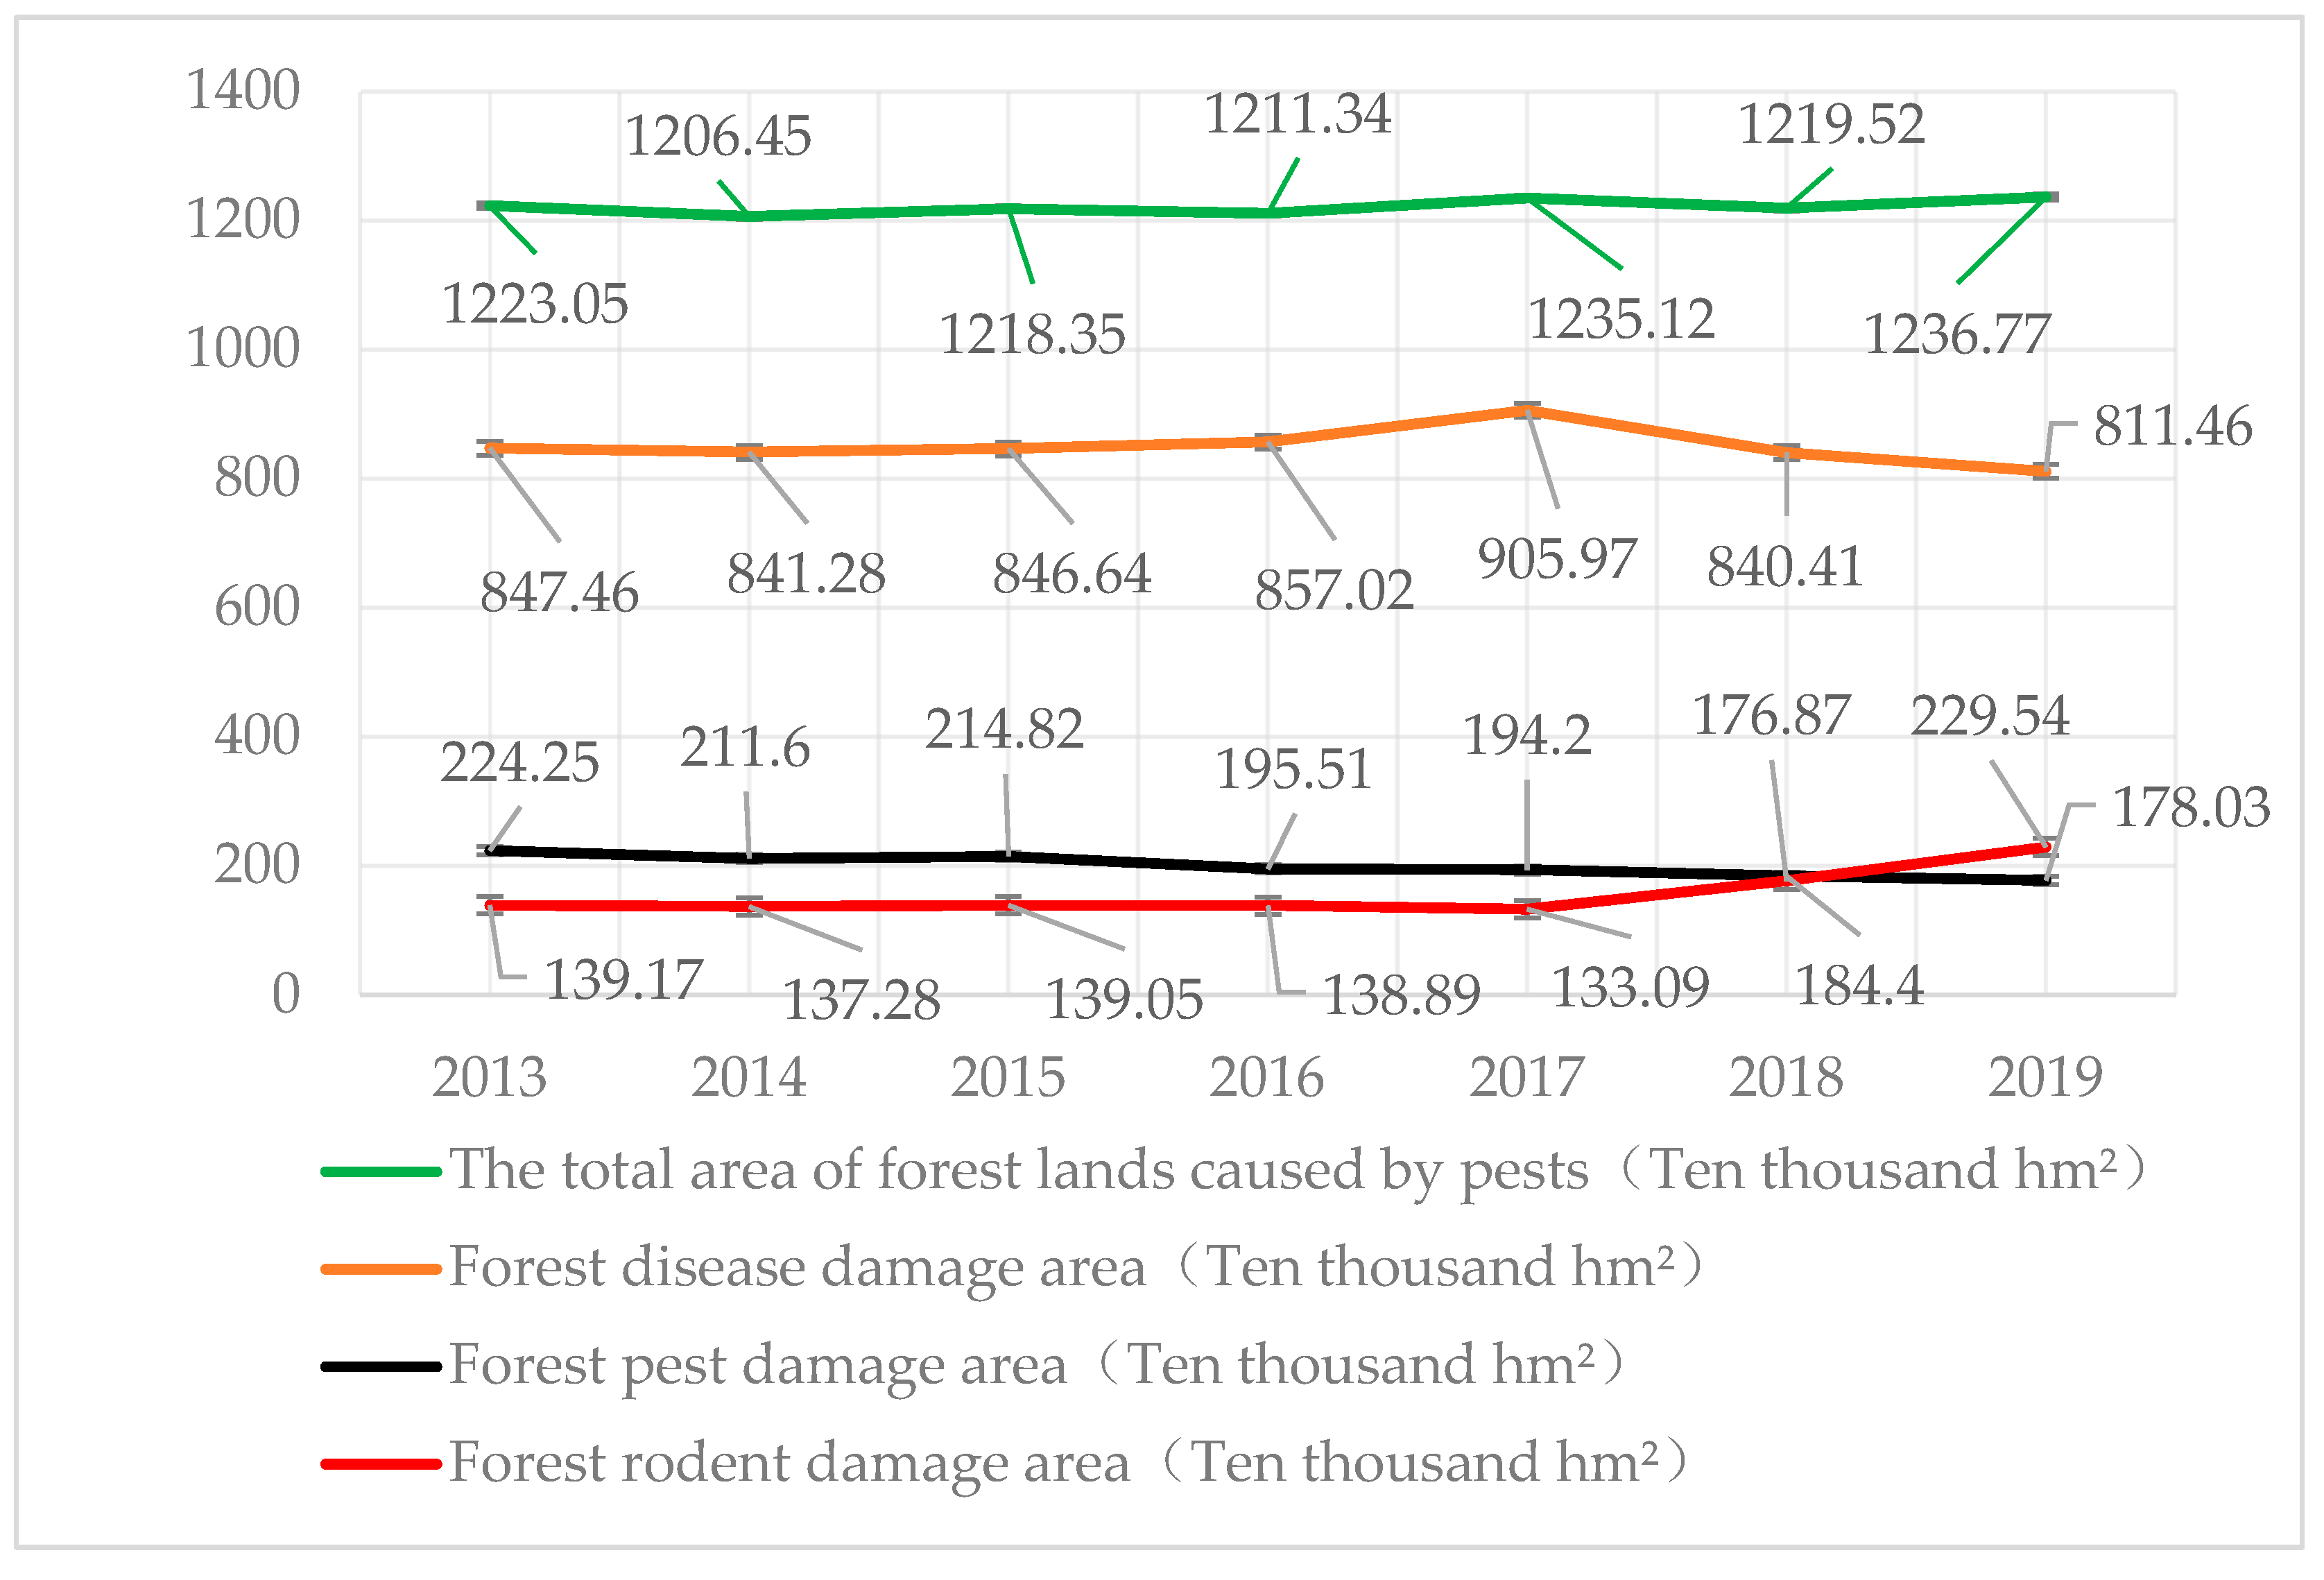
- The empirical results at the provincial level show that the implementation of China’s EFR policy did not effectively reduce the incidence of forest disasters. In short, the implementation of the EFR policy did not effectively reduce the incidence of forest fires, forest pests, forest diseases, and forest rodents. Moreover, this effect has no significant differences in the stock of forest resources, the level of forest disasters, or regional differences. Therefore, proposition 1 proposed in this paper is supported.
- (2)
- The EFR policy failed to effectively reduce the incidence of forest disasters. The main reason for this is that the policy is currently being implemented. Due to the pressure of the “poverty reduction” assessment, the local government mainly chose the policy’s “poverty reduction goals”, and the central government did not include the indicators of “effective forest disaster prevention and control” in the performance evaluation of local governments during the evaluation process, which in turn led the local governments to disregard the performance evaluation of ecological forest rangers’ ecological protection effect. In this way, the opportunism of local governments and ecological rangers was strengthened, and attention to forest disasters was neglected. In the end, the policy did not achieve the goal of reducing the incidence of forest disasters.
- (3)
- Increasing the urbanization rate (reducing the rural population), increasing the income level of residents, and abundant precipitation can effectively reduce the incidence of forest fires. Therefore, this result also shows that, by adjusting the frequency of population activities, increasing residents’ income, and then improving the level of awareness, it is beneficial for reducing the incidence of forest disasters.
7.2. Policy Implications
Author Contributions
Funding
Data Availability Statement
Acknowledgments
Conflicts of Interest
Appendix A

| Numbering | Notes and Reference Source |
|---|---|
| 1.1 | https://www.thepaper.cn/newsDetail_forward_3263397, accessed on 21 March 2021 |
| 1.2 | http://www.forestry.gov.cn/main/5383/20190930/100821670658921.html, accessed on 22 March 2021 |
| 1.3 | The financial support standard for the ecological forest rangers is USD 1563.45/person/year, and is mainly used for the labor compensation of forest rangers. This standard is much higher than the poverty alleviation standard of USD 359.62/person-year (the constant price in 2011) |
| 1.4 | http://www.gov.cn/gongbao/content/2011/content_2020905.htm, accessed on 22 March 2021 |
| 1.5 | http://politics.people.com.cn/n/2015/1208/c1001-27898134.html, accessed on 22 March 2021 |
| 1.6 | http://www.greentimes.com/greentimepaper/html/2016-08/30/content_3294090.htm, accessed on 15 February 2021 |
| 1.7 | https://www.66law.cn/tiaoli/23.aspx, accessed on 15 February 2021 |
| 1.8 | http://aqxxgk.anqing.gov.cn/show.php?id=658441, accessed on 15 February 2021 |
| 1.9 | https://www.docin.com/p-2162409316.html, accessed on 15 February 2021 |
| 1.10 | http://www.stats.gov.cn/, accessed on 24 January 2021 |
Appendix B
- (1)
- General fire. A fire that caused the death of less than 3 people, or severely injured less than 10 people, or caused direct property damage of less than 10 million yuan.
- (2)
- Relatively serious fires. A fire that caused the death of more than 3 people and less than 10 people, or serious injuries of more than 10 people and less than 50 people, or direct property losses of more than 10 million yuan and less than 50 million yuan.
- (3)
- Especially serious fires. A fire that caused more than 10 deaths but less than 30 people, or serious injuries of more than 50 people but less than 100 people, or direct property losses of more than 50 million yuan and less than 100 million yuan.
- (4)
- Particularly big serious fire. A fire that caused more than 30 deaths, or serious injuries of more than 100 people, or direct property losses of more than 100 million yuan.
References
- Wu, Y.Z.; Zhang, Z.G. The DEA-Tobit Model Analysis of Forestry Ecological Safety Efficiency and Its Influencing Factors—Based on the Symbiosis between Ecology and Industry. Resour. Environ. Yangtze River Basin 2021, 30, 76–86. [Google Scholar]
- Zhou, X.; Zhang, Y. Study on the impact of forest fire risk on the development of forestry econom. Resour. Dev. Mark. 2014, 30, 1198–1202. [Google Scholar]
- Kiel, K.A.; Matheson, V.A. The effect of natural disasters on housing prices: An examination of the Fourmile Canyon fire. J. For. Econ. 2018, 33, 1–7. [Google Scholar] [CrossRef] [Green Version]
- Di, L.Y.; Sun, R.Y. Summary of China’s Forest Fire Research. J. Catastr. 2007, 4, 118–123. [Google Scholar]
- Mi, F.; Chen, H.S. Classification and Cause Analysis of Forest Disasters and Forestry Accidents. Guangdong For. Sci. Technol. 2007, 23, 77–81. [Google Scholar]
- Cai, X.T.; Jiang, Y. The evolution of the spatiotemporal pattern of forest ecological security in China and the diagnosis of obstacles. Stat. Decis. 2019, 35, 96–100. [Google Scholar] [CrossRef]
- Zhang, Y.; Chen, S.Z. Property Reform and Resource Management: An Analysis Based on Forest Disaster. China Rural Econ. 2015, 10, 15–27. [Google Scholar]
- Pan, J.H.; Feng, Y.Y. Spatial Scanning of Deep Poverty in Rural China and Geographical Exploration of Poverty Differentiation Mechanism. Acta Geogr. Sin. 2020, 75, 769–788. [Google Scholar]
- Wu, L.; Zhu, K.N.; Jin, L.S. International experience and reference for poverty alleviation by paying for environmental services. Arid. Land Resour. Environ. 2019, 33, 34–41. [Google Scholar] [CrossRef]
- Engel, S.; Pagiola, S.; Wunder, S. Payments for environmental services in Costa Rica. Ecol. Econ. 2007, 65, 663–674. [Google Scholar] [CrossRef]
- Brownson, K.; Elizabeth, P.A.; Ferreira, S.; Wenger, S.; Fowler, L.; German, L. Governance of Payments for Ecosystem Ecosystem services influences social and environmental outcomes in Costa Rica. Ecol. Econ. 2020, 174, 106659. [Google Scholar] [CrossRef]
- Yan, Z.C.; Wei, F.; Chen, Y.R.; Deng, X.; Qi, Y.B. The Policy of Ecological Forest Rangers (EFRs) for the Poor: Goal Positioning and Realistic Choices—Evidence from the Re-Employment Behavior of EFRs in Sichuan, China. Land 2020, 9, 286. [Google Scholar] [CrossRef]
- García-Amado, L.R.; Pérez, M.R.; Escutia, F.R.; García, S.B.; Mejía, E.C. Efficiency of Payments for Environmental Services: Equity and additionality in a case study from a Biosphere Reserve in Chiapas, Mexico. Ecol. Econ. 2011, 70, 2361–2368. [Google Scholar] [CrossRef]
- Vaissière, A.; Calvet, F.Q.; Levrel, H.; Wunder, S. Biodiversity offsets and payments for environmental services: Clarifying the family ties. Ecol. Econ. 2020, 169, 106428. [Google Scholar] [CrossRef]
- Pates, N.J.; Hendricks, N.P. Additionality from Payments for Environmental Services with Technology Diffusion. Am. J. Agric. Econ. 2020, 102, 281–299. [Google Scholar] [CrossRef]
- Lapeyre, R.; Froger, G.; Hrabanski, M. Biodiversity offsets as market-based instruments for ecosystem services? From discourses to practice. Ecosyst. Serv. 2015, 15, 125–133. [Google Scholar] [CrossRef]
- Haas, J.C.; Loft, L.; Pham, T.T. How fair can incentive-based conservation get? The interdependence of distributional and contextual equity in Vietnam’s payments for Forest Environmental Services Program. Ecol. Econ. 2019, 160, 205–214. [Google Scholar] [CrossRef]
- Ezzine-de-Blas, D.; Corbera, E.; Lapeyre, R. Payments for Environmental Services and Motivation Crowding: Towards a Conceptual Framework. Ecol. Econ. 2019, 156, 434–443. [Google Scholar] [CrossRef]
- Zuo, T. Reflections on the Poverty Alleviation Policy of Actively Expanding Public Welfare Posts. China Natl. Cond. Natl. Power 2017, 11, 18–20. [Google Scholar] [CrossRef]
- Du, H.Y.; Wu, J. Analysis of the Impact of Ecological Compensation Projects on Poverty Alleviation—Based on the Perspective of Farmers’ Heterogeneity. Beijing Soc. Sci. 2016, 1, 121–128. [Google Scholar] [CrossRef]
- Zhu, L.F.; Yin, H.D.; Zhang, Z.T.; Ke, S.F. Is ecological compensation conducive to precision poverty alleviation?—Taking the construction area of the Three Gorges Ecological Barrier as an example. J. Northwest Sci.-Tech. Univ. Agric. For. (Soc. Sci. Ed.) 2018, 18, 42–48. [Google Scholar] [CrossRef]
- Wu, L.; Kong, D.S.; Jin, L.H. Ecological compensation beneficial to poverty reduction? An empirical analysis of three counties in Guizhou province based on the propensity score matching method. Rural Econ. 2017, 9, 48–55. Available online: http://www.cnki.com.cn/Article/CJFDTotal-NCJJ201709010.htm (accessed on 21 November 2021).
- Liu, P.; Liu, P.; Cheng, T.; Zhang, Y. Analysis of the effect of the ecological forest ranger policy for the population in Guizhou Province. Green Financ. Account. 2017, 1, 43–46. [Google Scholar] [CrossRef]
- Wang, J.H.; Teng, S.H.A. Win-win situation for ecological poverty alleviation and resource management and protection—A record of the work of ecological forest rangers in the Inner Mongolia Autonomous Region. Inn. Mong. For. 2018, 12, 6–8. [Google Scholar]
- Liu, Y.Q.; Zhang, P.; Zhang, M.X. Implementation and practice of poverty alleviation policies for ecological forest rangers in Qinghai. Economist 2020, 9, 135–137. [Google Scholar]
- Liu, H.J.; Li, D. The status quo and suggestions for the management of ecological forest rangers’ public welfare posts in Li County, Aba Prefecture. Green Technol. 2019, 3, 138–140. [Google Scholar] [CrossRef]
- Guo, J.G.; Wang, J. Adjustable Connection: An Explanation of the Evolution of local Government Policy Executive Power. J. Public Manag. 2021, 18, 140–152+175. [Google Scholar] [CrossRef]
- Zhou, L.A. Research on the Promotion Championship Mode of Local Officials in China. Econ. Res. 2007, 7, 36–50. [Google Scholar]
- Yu, Y.Z.; Sun, P.B.; Xuan, Y. Does the local government’s environmental objective constraints affect industrial transformation and upgrading? Econ. Res. 2020, 55, 57–72. [Google Scholar]
- Hu, R.D.; Lin, M.Y. The research trends of the double difference method and its application in public policy evaluation. Financ. Financ. Think Tank 2018, 3, 84–111+143–144. [Google Scholar]
- Qin, T.; Zhou, H.X.; Deng, J. China’s forest fire risk zoning based on cluster analysis. Resour. Dev. Mark. 2015, 31, 1458–1461+1533+1553. [Google Scholar]
- Wang, Y.; Yu, H.; Zhang, M.Y. China Ecological Public Welfare Post Policy and Practice: Progress, Problems and Suggestions. Environ. Sustain. Dev. 2019, 44, 54–58. [Google Scholar] [CrossRef]
- Wang, J. Problems and countermeasures of ecological forest guards for the impoverished population on file establishment. Green Sci. Technol. 2019, 21, 200–201. [Google Scholar] [CrossRef]
- Zhang, P.; Zhang, M.X. Proposals for Ecological Poverty Alleviation: The Central Government’s implementation of the ecological poverty alleviation policy for the impoverished population in Qinghai. Economist 2019, 11, 145–146. [Google Scholar]
- Yao, W.T.; Ma, Y.; Chen, M.; Xiao, Z.S.; Shu, Z.F.; Chen, L.J.; Xiao, W.H.; Liu, J.Y.; Zhang, S.Y. Analysis of Ice Storm Impact on and Post-Disaster Recovery of Typical Subtropical Forests in Southeast China. Remote Sens. 2020, 12, 164. [Google Scholar] [CrossRef] [Green Version]


| Variable Type | Variable Name | Meaning or Calculation | Unit |
|---|---|---|---|
| Explained variable | Total number of forest fires | The number of forest fire occurrences shall prevail. In the regression, both the logarithm of the total area and the number of occurrences shall be taken (the same below) | Once |
| Number of occurrences of forest fires in each class | Fire classification: general fires; relatively serious fires; especially serious fires; particularly large, serious fires | Once | |
| Total area of pests | The actual total area of damage shall prevail | Ten thousand hm2 | |
| The total area caused by the classification of pests | Pest classification: diseases, pests, harmful plants and rodents | Ten thousand hm2 | |
| Core explanatory variables | Whether to implement the policy | 1 = Yes; 0 = No | |
| Control variable | Importance of forestry | Total output value of forestry/gross output value of primary industry | % |
| Population density | Total population/total area of province (logarithm of regression) | ||
| Guarantee of financial funds per unit of woodland area | Total value of forestry support and protection/total area of forestland | ||
| Annual per-capita disposable income of farmers | Logarithmic regression | ||
| Forest cover rate | Forest area/land area × 100 | % | |
| Urbanization rate | Actual statistics shall prevail | % | |
| Average annual precipitation | Core city average | mm | |
| Average annual temperature | Actual statistics shall prevail | °C | |
| Information level | Mobile phone penetration rate (actual statistics shall prevail) | % | |
| Human capital level | Total population with junior high school education or above/total population over six years old | % |
| Variable Name | Obs | Mean | SD | Min | Max |
|---|---|---|---|---|---|
| Total Number of Forest Fires | 186 | 98.4 | 139.44 | 0 | 949 |
| Number of General Fires | 186 | 60.62 | 96.58 | 0 | 591 |
| Number of Relatively Serious Fires | 186 | 37.79 | 57 | 0 | 358 |
| Number of Especially Serious Fires | 186 | 0.08 | 0.49 | 0 | 5 |
| Number of Particularly Large, Serious Fires | 186 | 0.03 | 0.25 | 0 | 3 |
| Total Area of Pest Damage | 186 | 39.02 | 33.94 | 0.44 | 201.15 |
| Disease-damaged Area | 186 | 4.62 | 4.42 | 0.01 | 21.51 |
| Insect-damaged Area | 186 | 27.5 | 21.23 | 0.39 | 122.54 |
| Rodent-damaged Area | 186 | 6.3 | 13.69 | 0 | 86.96 |
| Whether to Implement the Policy | 186 | 0.74 | 0.44 | 0 | 1 |
| Importance of Forestry | 186 | 7.55 | 10.62 | 1.39 | 107.81 |
| Forest Cover Rate | 186 | 32.7 | 17.98 | 4.2 | 66.8 |
| Annual Per-capita Disposable Income of Farmers | 186 | 9.46 | 0.35 | 8.74 | 10.41 |
| Population Density | 186 | 5.31 | 1.49 | .93 | 8.27 |
| Urbanization Rate | 186 | 57.24 | 12.73 | 23.71 | 89.6 |
| Guarantee of Financial Funds Per Unit of Woodland Area | 186 | 336.47 | 502.98 | 3.55 | 3365.72 |
| Information Level | 186 | 98.93 | 22.82 | 62.07 | 189.47 |
| Human Capital level | 186 | 69.51 | 11.95 | 18.69 | 94.09 |
| Annual Precipitation | 186 | 967.43 | 576.53 | 44.1 | 2939.7 |
| Average Annual Temperature | 186 | 14.48 | 5.02 | 4.3 | 25.3 |
| Variable Name | Policy Is Not Implemented (Control Group) | Policy Implementation Group (Experimental Group) | t-Test | ||
|---|---|---|---|---|---|
| Sample Size | Mean | Sample Size | Mean | ||
| Annual Per-capita Disposable Income of Farmers | 48 | 9.81 | 138 | 9.34 | 0.46 *** |
| Population Density | 48 | 6.76 | 138 | 4.81 | 1.95 *** |
| Urbanization Rate | 48 | 72.62 | 138 | 51.89 | 20.73 *** |
| Guarantee of Financial Funds Per Unit of Woodland Area | 48 | 706.64 | 138 | 207.73 | 498.91 *** |
| Information Level | 48 | 123.11 | 138 | 90.52 | 32.59 *** |
| Human Capital Level | 48 | 76.65 | 138 | 67.04 | 9.61 *** |
| Annual Precipitation | 48 | 1260.83 | 138 | 865.38 | 395.45 *** |
| Average Annual Temperature | 48 | 17.01 | 138 | 13.56 | 3.46 *** |
| Variable Name | Policy Is Not Implemented (Control Group) | Policy Implementation Group (Experimental Group) | t-Test | ||
|---|---|---|---|---|---|
| Sample Size | Mean | Sample Size | Mean | ||
| Logarithm of the Total Number of Forest Fires | 41 | 3.17 | 137 | 4.00 | −0.82 *** |
| Proportion of Relatively Serious Fires and above | 41 | 0.51 | 137 | 0.34 | 0.18 *** |
| Environmental Emergencies | 41 | 2.43 | 137 | 1.85 | 0.58 *** |
| Logarithm of the Total Area of Pests | 41 | 2.63 | 137 | 3.61 | −0.97 *** |
| Importance of Forestry | 41 | 11.75 | 137 | 5.81 | 5.94 *** |
| Forest Cover Rate | 41 | 36.73 | 137 | 32.59 | 4.14 |
| Variable Name | Policy Is Not Implemented (Control Group) | Policy Implementation Group (Experimental Group) | t-Test | ||
|---|---|---|---|---|---|
| Sample Size | Mean | Sample Size | Mean | ||
| Logarithm of the Total number of Forest Fires | 69 | 4.09 | 68 | 3.90 | 0.20 |
| Proportion of Relatively Serious Fires and above | 69 | 0.33 | 68 | 0.34 | −0.01 |
| Environmental Emergencies | 69 | 1.81 | 68 | 1.89 | −0.07 |
| Logarithm of the Total Area of Pests | 69 | 3.59 | 68 | 3.63 | −0.04 |
| (1) | (2) | (3) | (4) | |
|---|---|---|---|---|
| FE | Two-Way FE | Two-Way FE | 2-Year Window Period | |
| Treat * Post | −0.252 * | −0.066 | 0.249 | 0.027 |
| (0.13) | (0.22) | (0.20) | (0.22) | |
| Importance of Forestry | −0.015 *** | −0.011 | ||
| (0.00) | (0.01) | |||
| Forest Cover Rate | −0.035 | 0.151 | ||
| (0.04) | (0.13) | |||
| Annual Per-capita Disposable Income of Farmers | 0.242 | −10.700 ** | ||
| (0.28) | (5.06) | |||
| Population Density | 5.866 | 12.865 * | ||
| (5.05) | (6.93) | |||
| Urbanization Rate | −0.181 ** | −0.142 * | ||
| (0.07) | (0.07) | |||
| Guarantee of Financial Funds Per Unit of Woodland Area | −0.000 | 0.000 | ||
| (0.00) | (0.00) | |||
| Information Level | 0.016 | 0.012 | ||
| (0.01) | (0.02) | |||
| Human Capital Level | 0.001 | −0.002 | ||
| (0.01) | (0.03) | |||
| Annual precipitation | −0.001 *** | −0.001 ** | ||
| (0.00) | (0.00) | |||
| Average Annual Temperature | 0.185 | 0.177 | ||
| (0.17) | (0.26) | |||
| Constant | 3.736 *** | 3.855 *** | −22.007 | 34.785 |
| (0.05) | (0.13) | (25.49) | (42.38) | |
| Year Fixed Effect | No | Yes | Yes | Yes |
| Province Fixed Effect | Yes | Yes | Yes | Yes |
| N | 186 | 186 | 186 | 124 |
| r2 | 0.037 | 0.119 | 0.323 | 0.293 |
| (1) | (2) | (3) | (4) | |
|---|---|---|---|---|
| FE | Two-Way FE | Two-Way FE | 2-Year Window Period | |
| Treat * Post | 0.006 | 0.042 | 0.105 | 0.073 |
| (0.04) | (0.08) | (0.10) | (0.11) | |
| Importance of Forestry | −0.014 *** | −0.014 *** | ||
| (0.00) | (0.00) | |||
| Forest Cover Rate | −0.028 | −0.026 | ||
| (0.03) | (0.02) | |||
| Annual Per-capita Disposable Income of Farmers | 0.012 | 4.400 ** | ||
| (0.11) | (2.05) | |||
| Population Density | 1.116 | −1.431 | ||
| (1.97) | (3.33) | |||
| Urbanization Rate | 0.002 | −0.017 | ||
| (0.03) | (0.03) | |||
| Guarantee of Financial Funds Per Unit of Woodland Area | −0.000 ** | −0.000 * | ||
| (0.00) | (0.00) | |||
| Information Level | −0.005 | −0.009 | ||
| (0.00) | (0.01) | |||
| Human Capital Level | 0.010 | 0.005 | ||
| (0.01) | (0.01) | |||
| Annual Precipitation | 0.000 | 0.000 | ||
| (0.00) | (0.00) | |||
| Average Annual Temperature | −0.003 | −0.011 | ||
| (0.04) | (0.03) | |||
| Constant | 0.375 *** | 0.381 *** | −4.845 | −30.307 |
| (0.01) | (0.03) | (11.43) | (20.36) | |
| Year Fixed Effect | No | Yes | Yes | Yes |
| Province Fixed Effect | Yes | Yes | Yes | Yes |
| N | 178 | 178 | 178 | 118 |
| r2 | 0.000 | 0.008 | 0.202 | 0.298 |
| (1) | (2) | (3) | (4) | |
|---|---|---|---|---|
| Two-Way FE | Two-Way FE | 2-Year Window Period | ||
| Treat * Post | 0.036 | −0.115 | −0.134 | −0.042 |
| (0.02) | (0.13) | (0.11) | (0.09) | |
| (0.02) | (0.02) | |||
| Constant | 3.238 *** | 3.221 *** | 3.075 | −14.384 * |
| (0.01) | (0.03) | (8.29) | (8.27) | |
| Year Fixed Effect | No | Yes | Yes | Yes |
| Province Fixed Effect | Yes | Yes | Yes | Yes |
| Control Variables | No | No | Yes | Yes |
| N | 186 | 186 | 186 | 124 |
| r2 | 0.012 | 0.096 | 0.187 | 0.285 |
| (1) | (2) | (3) | (4) | |
|---|---|---|---|---|
| Disease | Pest | Rodent | Harmful Plants | |
| Treat * Post | −0.197 | −0.052 | 0.024 | 0.003 |
| (0.16) | (0.11) | (0.06) | (0.04) | |
| Constant | −29.204 | −8.767 | 16.320 ** | −2.301 |
| (17.89) | (11.46) | (7.92) | (4.39) | |
| Year Fixed Effect | No | Yes | Yes | Yes |
| Province Fixed Effect | Yes | Yes | Yes | Yes |
| Control Variable | Yes | Yes | Yes | Yes |
| N | 186 | 186 | 186 | 186 |
| r2 | 0.179 | 0.134 | 0.161 | 0.140 |
| (1) | (2) | (3) | (4) | (5) | (6) | |
|---|---|---|---|---|---|---|
| Logarithm of the Total Number of Fires | Heavily Damaging Forest Fires and above | Logarithm of the Area Infested by Pests | ||||
| Large Forestry Provinces | Small Forestry Provinces | Large Forestry Provinces | Small Forestry Provinces | Large Forestry Provinces | Small Forestry Provinces | |
| Treat * Post | 0.816 ** | 0.130 | 0.524 | 0.015 | −0.167 | −0.110 |
| (2.59) | (0.58) | (1.12) | (0.16) | (−0.73) | (−0.99) | |
| Constant | 0.389 | −1.027 | −5.276 | 13.265 | −5.084 | 13.199 |
| (0.02) | (−0.03) | (−0.49) | (1.01) | (−0.69) | (1.04) | |
| Year Fixed Effect | No | Yes | Yes | Yes | Yes | Yes |
| Province Fixed Effect | Yes | Yes | Yes | Yes | Yes | Yes |
| Control Variable | Yes | Yes | Yes | Yes | Yes | Yes |
| N | 47 | 139 | 46 | 132 | 47 | 139 |
| r2 | 0.645 | 0.309 | 0.568 | 0.303 | 0.622 | 0.239 |
| (1) Logarithm of the Total Number of Fires | (2) Logarithm of the Total Number of Fires | (3) Logarithm of the Total Number of Fires | (1) Relatively Serious Fires and above | (2) Relatively Serious Fires and above | (3) Relatively Serious Fires and above | (1) Logarithm of the Area Infested by Pests | (2) Logarithm of the Area Infested by Pests | (3) Logarithm of the Area Infested by Pests | |
|---|---|---|---|---|---|---|---|---|---|
| West | Middle | East | West | Middle | East | West | Middle | East | |
| Treat * Post | 1.078 * | −0.558 | −0.168 | 0.668 | 0.232 | 0.193 | −0.159 | 0.035 | −0.202 |
| (1.99) | (−1.17) | (−0.52) | (1.17) | (1.23) | (1.44) | (−0.56) | (0.13) | (−1.51) | |
| _cons | −23.47 | 151.37 * | 61.672 | 2.767 | 10.701 | 23.466 | −2.944 | −33.482 * | 22.924 |
| (−0.83) | (2.22) | (1.79) | (0.19) | (0.59) | (1.17) | (−0.27) | (−1.93) | (1.28) | |
| Annual Fixed Effect | Yes | Yes | Yes | Yes | Yes | Yes | Yes | Yes | Yes |
| Control Variable | Yes | Yes | Yes | Yes | Yes | Yes | Yes | Yes | Yes |
| N | 72 | 48 | 66 | 72 | 48 | 66 | 72 | 48 | 66 |
| r2 | 0.223 | 0.400 | 0.399 | 0.223 | 0.400 | 0.399 | 0.223 | 0.400 | 0.399 |
Publisher’s Note: MDPI stays neutral with regard to jurisdictional claims in published maps and institutional affiliations. |
© 2022 by the authors. Licensee MDPI, Basel, Switzerland. This article is an open access article distributed under the terms and conditions of the Creative Commons Attribution (CC BY) license (https://creativecommons.org/licenses/by/4.0/).
Share and Cite
Yan, Z.; Wei, F.; Deng, X.; Li, C.; He, Q.; Qi, Y. Does the Policy of Ecological Forest Rangers (EFRs) for the Impoverished Populations Reduce Forest Disasters?—Empirical Evidence from China. Forests 2022, 13, 80. https://doi.org/10.3390/f13010080
Yan Z, Wei F, Deng X, Li C, He Q, Qi Y. Does the Policy of Ecological Forest Rangers (EFRs) for the Impoverished Populations Reduce Forest Disasters?—Empirical Evidence from China. Forests. 2022; 13(1):80. https://doi.org/10.3390/f13010080
Chicago/Turabian StyleYan, Zhongcheng, Feng Wei, Xin Deng, Chuan Li, Qiang He, and Yanbin Qi. 2022. "Does the Policy of Ecological Forest Rangers (EFRs) for the Impoverished Populations Reduce Forest Disasters?—Empirical Evidence from China" Forests 13, no. 1: 80. https://doi.org/10.3390/f13010080
APA StyleYan, Z., Wei, F., Deng, X., Li, C., He, Q., & Qi, Y. (2022). Does the Policy of Ecological Forest Rangers (EFRs) for the Impoverished Populations Reduce Forest Disasters?—Empirical Evidence from China. Forests, 13(1), 80. https://doi.org/10.3390/f13010080