
Urban Forest Ecosystem Services Vary with Land Use and Species: A Case Study of Kyoto City


Abstract
1. Introduction
2. Materials and Methods
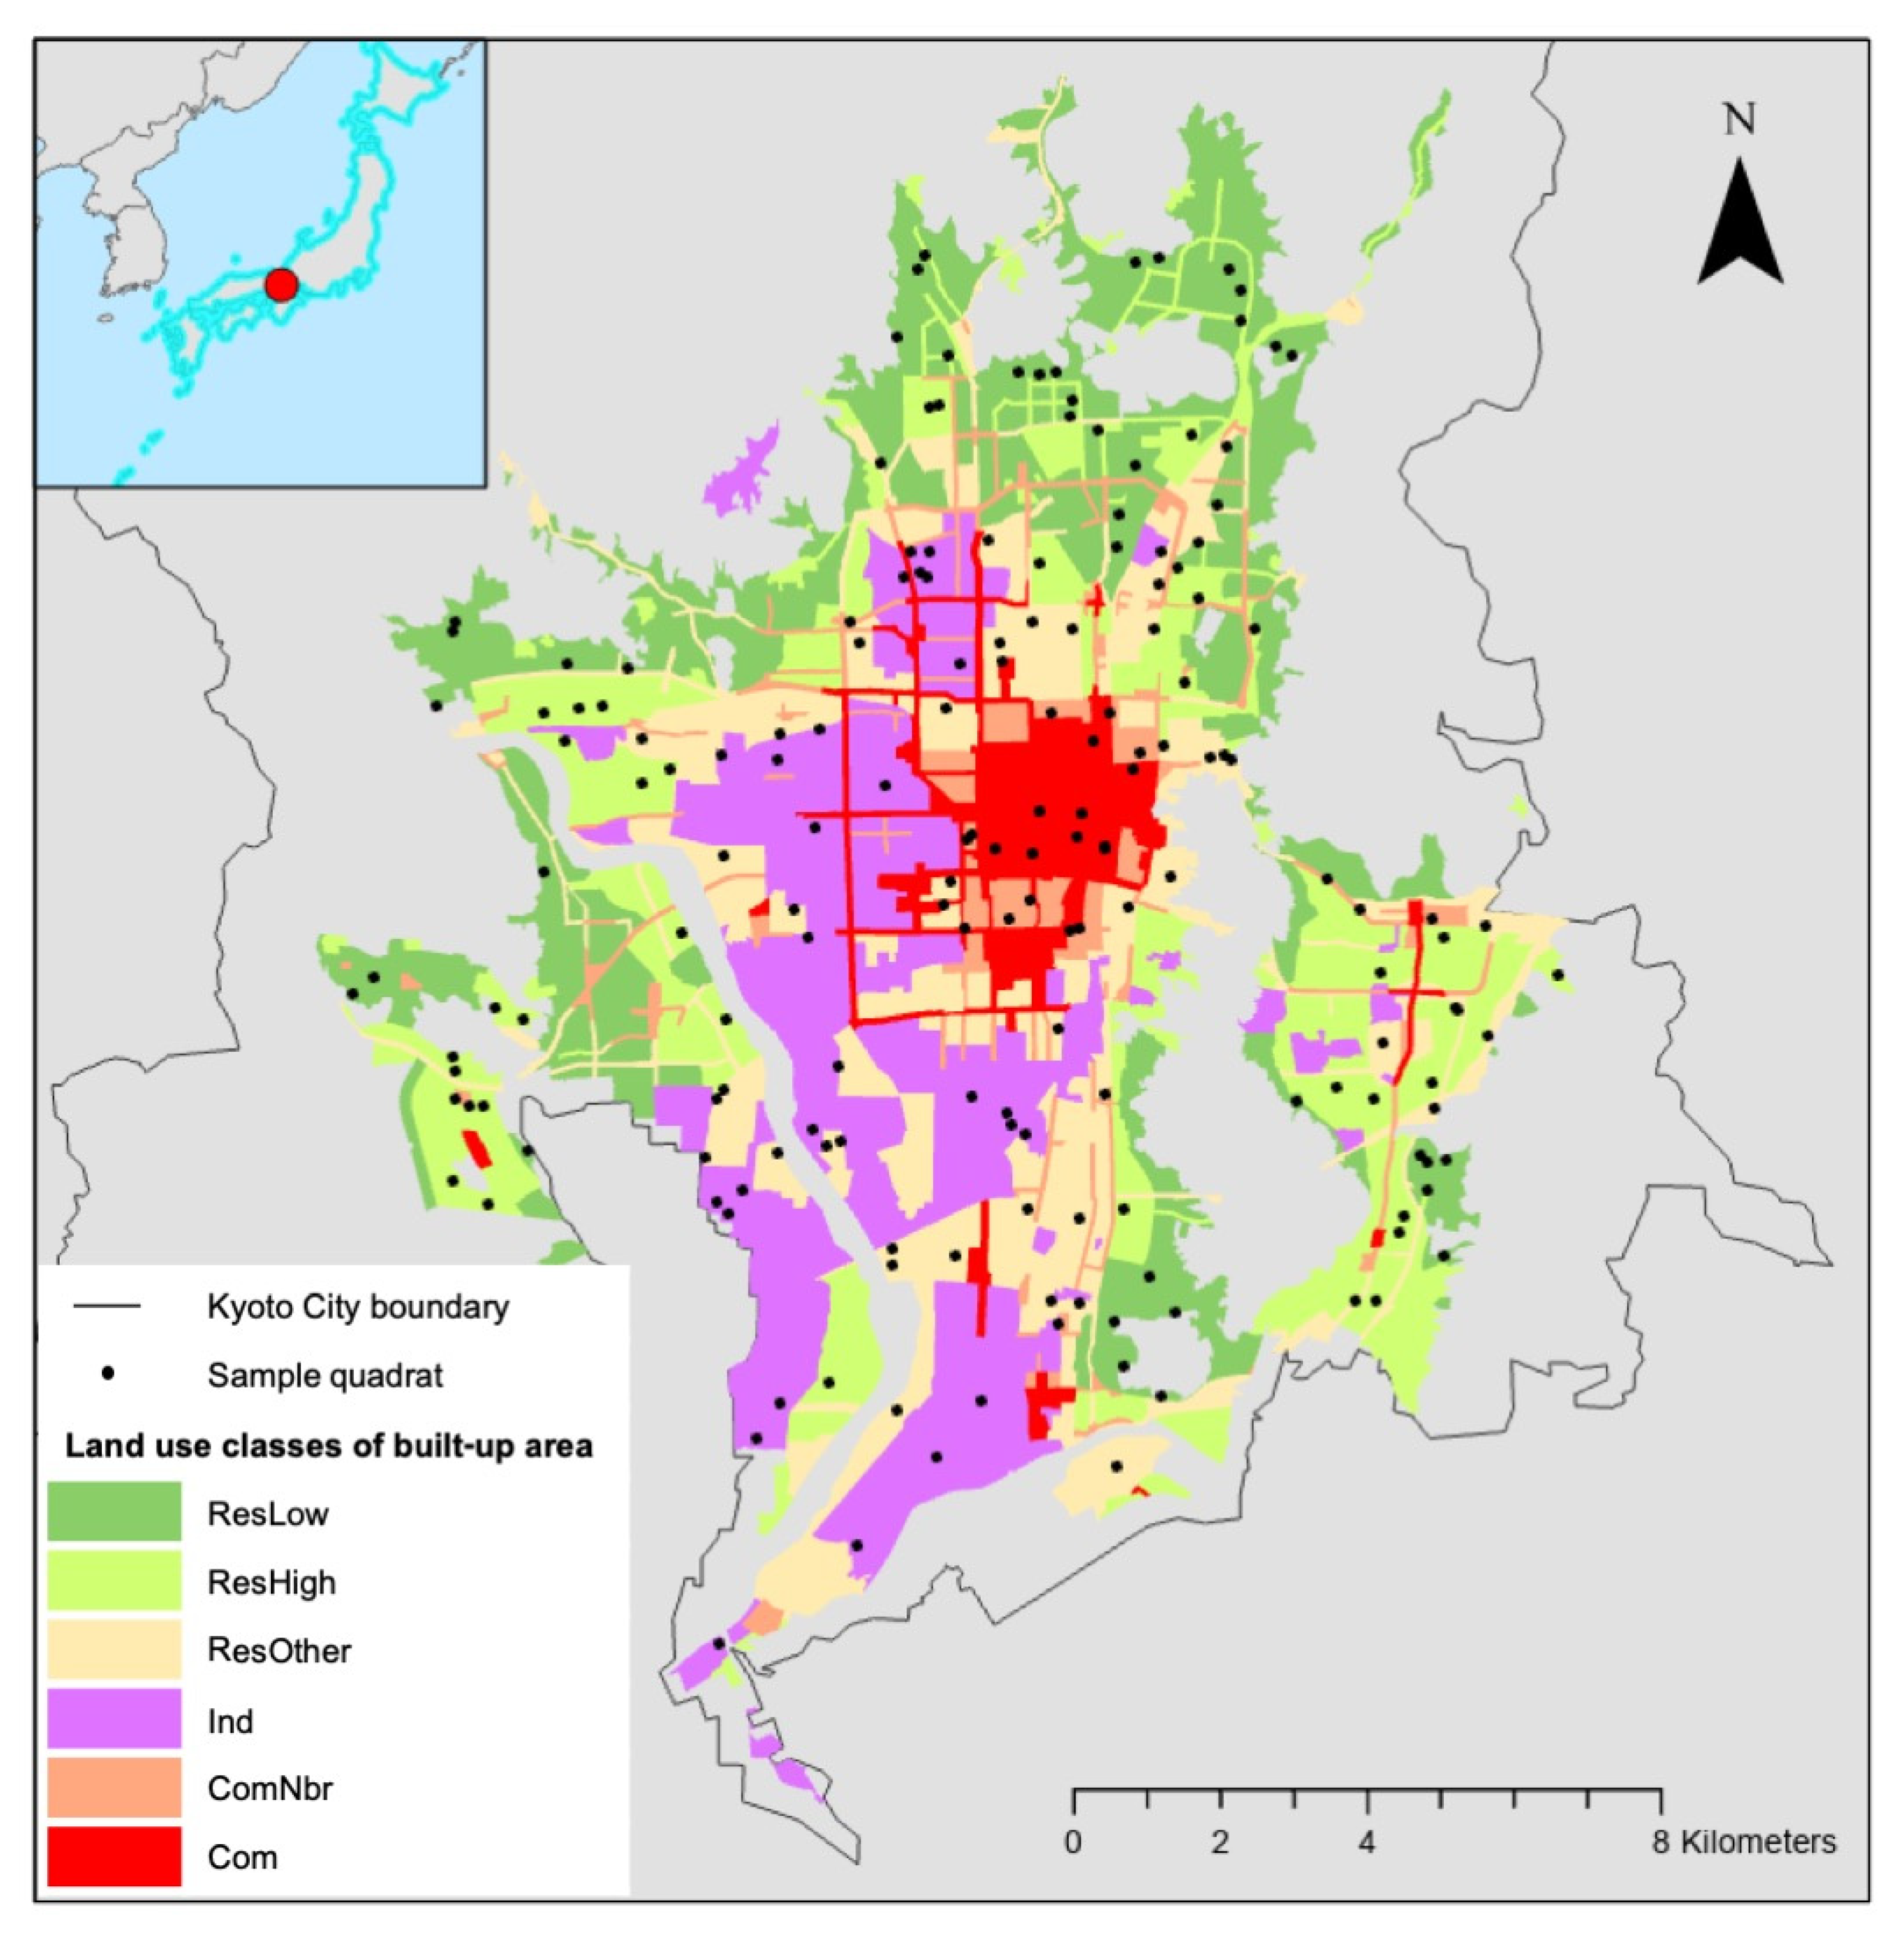
2.1. Study Area
2.2. Tree Data Collection
2.3. Evaluation of Ecosystem Services and Monetary Value
2.3.1. Structure
2.3.2. Carbon Storage and Carbon Sequestration
2.3.3. Air pollutants Removal and Health Benefits
2.3.4. Runoff Reduction
2.3.5. Compensatory Value
2.4. Data Analysis
3. Results
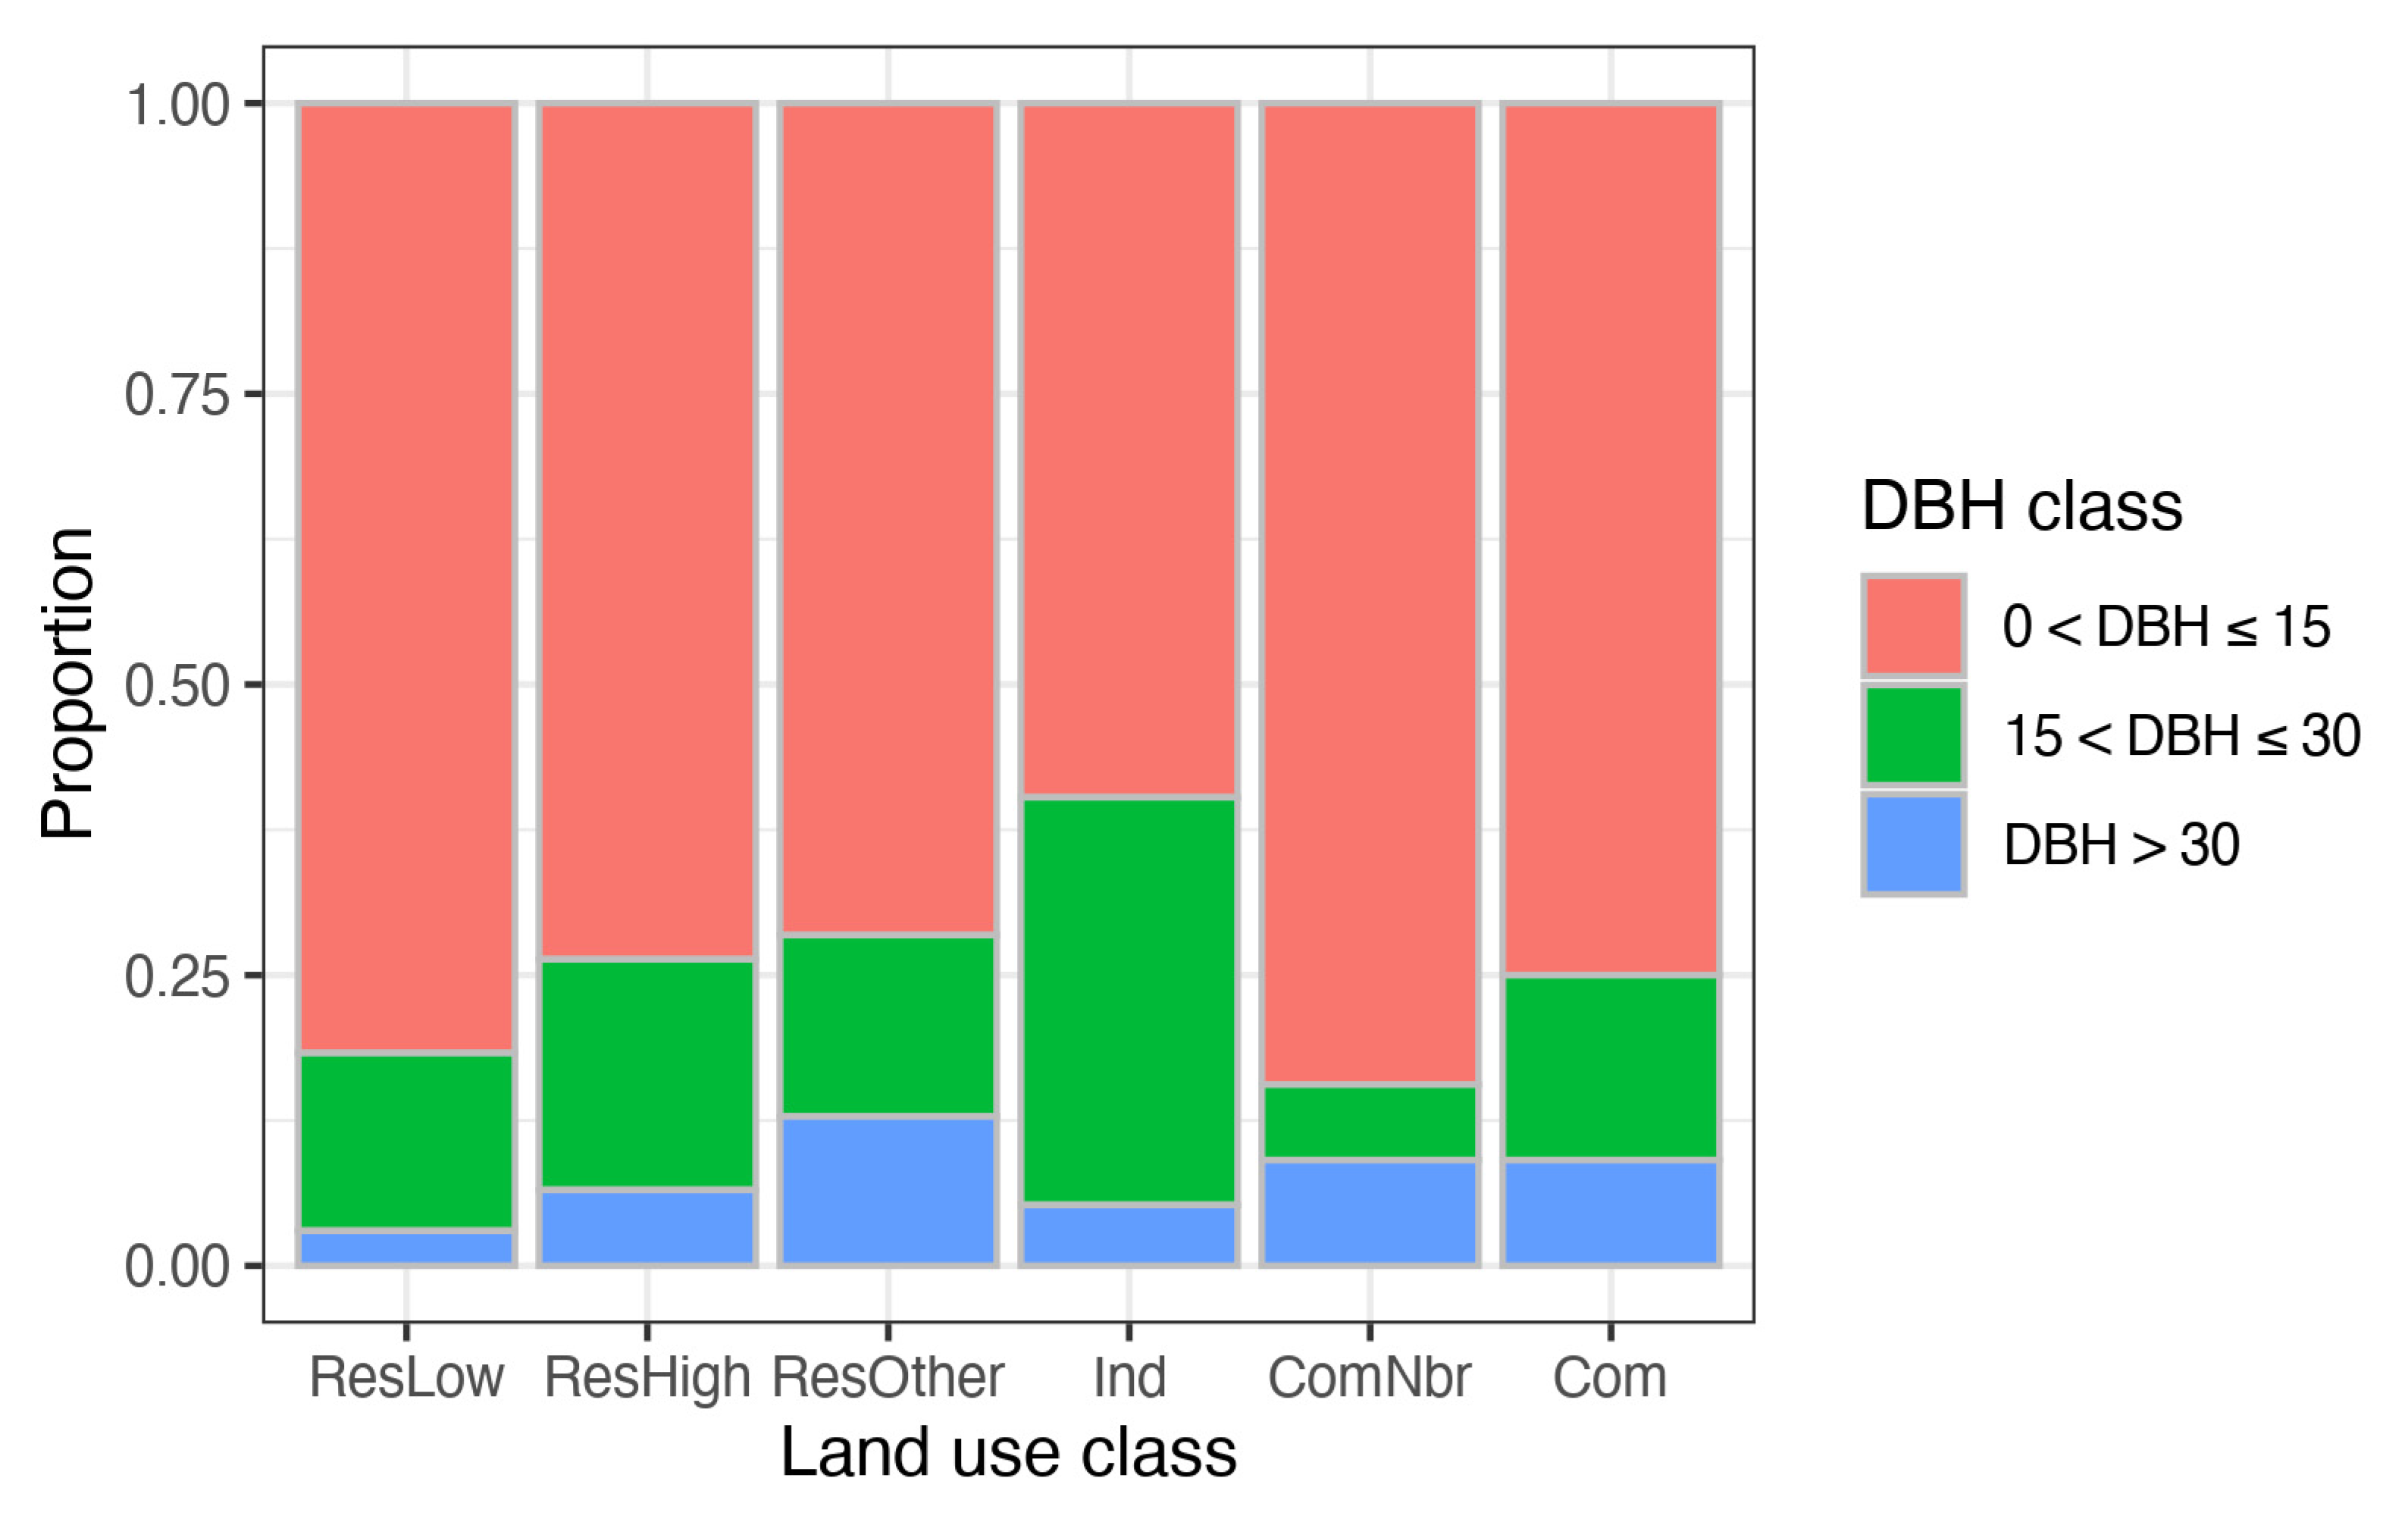
3.1. DBH and LAI
3.2. Total Monetary Value of Trees
3.3. Quadrat Ecosystem Services across Land Use
3.4. Single-Tree Ecosystem Services across Land Use
3.5. Species-Specific Analysis
4. Discussion
4.1. Ecosystem Services across Land Use
4.2. Impact of Scale
4.3. Comparison of Ecosystem Services between Cities
4.4. Ecosystem Service Evaluation in Cities
5. Conclusions
Supplementary Materials
Author Contributions
Funding
Institutional Review Board Statement
Informed Consent Statement
Data Availability Statement
Conflicts of Interest
References
- The World Bank Data. Available online: https://data.worldbank.org/indicator/SP.URB.TOTL.IN.ZS (accessed on 20 January 2021).
- Population Division, United Nations. World Urbanization Prospects: The 2018 Revision. 2019. Available online: https://population.un.org/wup/ (accessed on 18 October 2021).
- Gómez-Baggethun, E.; Gren, A.; Barton, D.N.; Langemeyer, J.; McPhearson, T.; O’farrell, P.; Andersson, E.; Hamstead, Z.; Kremer, P. Urban Ecosystem Services. In Urbanization, Biodiversity and Ecosystem Services: Challenges and Opportunities; Springer: Dordrecht, The Netherlands, 2013; pp. 175–251. [Google Scholar]
- Gómez-Baggethun, E.; Barton, D.N. Classifying and Valuing Ecosystem Services for Urban Planning. Ecol. Econ. 2013, 86, 235–245. [Google Scholar] [CrossRef]
- Elmqvist, T.; Fragkias, M.; Goodness, J.; Güneralp, B.; Marcotullio, P.J.; McDonald, R.I.; Parnell, S.; Schewenius, M.; Sendstad, M.; Seto, K.C.; et al. (Eds.) Urbanization, Biodiversity and Ecosystem Services: Challenges and Opportunities; Springer: Dordrecht, The Netherlands, 2013; ISBN 978-94-007-7087-4. [Google Scholar]
- Haase, D.; Larondelle, N.; Andersson, E.; Artmann, M.; Borgström, S.; Breuste, J.; Gomez-Baggethun, E.; Gren, A.; Hamstead, Z.; Hansen, R. A Quantitative Review of Urban Ecosystem Service Assessments: Concepts, Models, and Implementation. AMBIO 2014, 43, 413–433. [Google Scholar] [CrossRef] [PubMed]
- Ordóñez-Barona, C.; Devisscher, T.; Dobbs, C.; Aguilar, L.A.O.; Baptista, M.; Navarro, N.M.; da Silva Filho, D.F.; Escobedo, F.J. Trends in Urban Forestry Research in Latin America & the Caribbean: A Systematic Literature Review and Synthesis. Urban For. Urban Green. 2019, 126544. [Google Scholar] [CrossRef]
- Kremer, P.; Hamstead, Z.A.; McPhearson, T. The Value of Urban Ecosystem Services in New York City: A Spatially Explicit Multicriteria Analysis of Landscape Scale Valuation Scenarios. Environ. Sci. Policy 2016, 62, 57–68. [Google Scholar] [CrossRef]
- Larondelle, N.; Lauf, S. Balancing Demand and Supply of Multiple Urban Ecosystem Services on Different Spatial Scales. Ecosyst. Serv. 2016, 22, 18–31. [Google Scholar] [CrossRef]
- Hirabayashi, S.; Tokue, Y.; Ito, A.; Ellis, A.; Hoehn, R.; Imamura, F.; Morioka, C. Estimating Ecosystem Services and Their Monetary Values Provided by Street Trees in Kawasaki Ward of Kawasaki City Using I-Tree Eco. J. Jpn. Soc. Reveg. Technol. 2016, 42, 44–49. (In Japanese) [Google Scholar] [CrossRef][Green Version]
- Hirabayashi, S.; Tan, X.; Shozo, S. Customization of I-Tree Eco’s Medical Cost and Building Energy Saving Models for Japan. J. Jpn. Soc. Reveg. Technol. 2019, 45, 200–203. (In Japanese) [Google Scholar] [CrossRef]
- Tan, X.; Hirabayashi, S.; Shibata, S. Estimation of Ecosystem Services Provided by Street Trees in Kyoto, Japan. Forests 2021, 12, 311. [Google Scholar] [CrossRef]
- Kawaguchi, M.; Hirabayashi, S.; Hirase, K.; Kaga, H.; Akazawa, H. Estimation of Monetary Value of Street Trees by I-Tree Eco Using Tree Health Surveys in Suita City, Osaka Prefecture. Landsc. Res. Jpn. Online 2021, 14, 1–12. [Google Scholar] [CrossRef]
- Zhao, C.; Sander, H.A. Assessing the Sensitivity of Urban Ecosystem Service Maps to Input Spatial Data Resolution and Method Choice. Landsc. Urban Plan. 2018, 175, 11–22. [Google Scholar] [CrossRef]
- Kremer, P.; Hamstead, Z.; Haase, D.; McPhearson, T.; Frantzeskaki, N.; Andersson, E.; Kabisch, N.; Larondelle, N.; Rall, E.L.; Voigt, A. Key Insights for the Future of Urban Ecosystem Services Research. Ecol. Soc. 2016, 21. [Google Scholar] [CrossRef]
- Costanza, R.; De Groot, R.; Braat, L.; Kubiszewski, I.; Fioramonti, L.; Sutton, P.; Farber, S.; Grasso, M. Twenty Years of Ecosystem Services: How Far Have We Come and How Far Do We Still Need to Go? Ecosyst. Serv. 2017, 28, 1–16. [Google Scholar] [CrossRef]
- Costanza, R.; de Groot, R.; Sutton, P.; van der Ploeg, S.; Anderson, S.J.; Kubiszewski, I.; Farber, S.; Turner, R.K. Changes in the Global Value of Ecosystem Services. Glob. Environ. Change 2014, 26, 152–158. [Google Scholar] [CrossRef]
- Yi, H.; Güneralp, B.; Filippi, A.M.; Kreuter, U.P.; Güneralp, İ. Impacts of Land Change on Ecosystem Services in the San Antonio River Basin, Texas, from 1984 to 2010. Ecol. Econ. 2017, 135, 125–135. [Google Scholar] [CrossRef]
- Arowolo, A.O.; Deng, X.; Olatunji, O.A.; Obayelu, A.E. Assessing Changes in the Value of Ecosystem Services in Response to Land-Use/Land-Cover Dynamics in Nigeria. Sci. Total Environ. 2018, 636, 597–609. [Google Scholar] [CrossRef]
- Bryan, B.A.; Ye, Y.; Zhang, J.; Connor, J.D. Land-Use Change Impacts on Ecosystem Services Value: Incorporating the Scarcity Effects of Supply and Demand Dynamics. Ecosyst. Serv. 2018, 32, 144–157. [Google Scholar] [CrossRef]
- Kim, G.; Miller, P.; Nowak, D. Assessing Urban Vacant Land Ecosystem Services: Urban Vacant Land as Green Infrastructure in the City of Roanoke, Virginia. Urban For. Urban Green. 2015, 14, 519–526. [Google Scholar] [CrossRef]
- Haase, D. Shrinking Cities, Biodiversity and Ecosystem Services. In Urbanization, Biodiversity and Ecosystem Services: Challenges and Opportunities; Springer: Dordrecht, The Netherlands, 2013; pp. 253–274. [Google Scholar]
- Bolund, P.; Hunhammar, S. Ecosystem Services in Urban Areas. Ecol. Econ. 1999, 29, 293–301. [Google Scholar] [CrossRef]
- Tang, Y.; Chen, A.; Zhao, S. Carbon Storage and Sequestration of Urban Street Trees in Beijing, China. Front. Ecol. Evol. 2016, 4. [Google Scholar] [CrossRef]
- Szkop, Z. An Evaluation of the Ecosystem Services Provided by Urban Trees: The Role of Krasinski Gardens in Air Quality and Human Health in Warsaw (Poland). Environ. Socio-Econ. Stud. 2016, 4, 41–50. [Google Scholar] [CrossRef]
- Camps-Calvet, M.; Langemeyer, J.; Calvet-Mir, L.; Gómez-Baggethun, E. Ecosystem Services Provided by Urban Gardens in Barcelona, Spain: Insights for Policy and Planning. Environ. Sci. Policy 2016, 62, 14–23. [Google Scholar] [CrossRef]
- Nowak, D.; Hoehn, R.; Bodine, A.; Greenfield, E.; O’Neil-Dunne, J. Urban Forest Structure, Ecosystem Services and Change in Syracuse, NY. Urban Ecosyst. 2016, 19, 1455–1477. [Google Scholar] [CrossRef]
- Kiss, M.; Takacs, A.; Pogacsas, R.; Gulyas, A. The Role of Ecosystem Services in Climate and Air Quality in Urban Areas: Evaluating Carbon Sequestration and Air Pollution Removal by Street and Park Trees in Szeged (Hungary). Morav. Geogr. Rep. 2015, 23, 36–46. [Google Scholar] [CrossRef]
- Ning, Z.; Chambers, R.; Abdollahi, K. Modeling Air Pollutant Removal, Carbon Storage, and CO2 Sequestration Potential of Urban Forests in Scotlandville, Louisiana, USA. iForest-Biogeosci. For. 2016, 9, 860–867. [Google Scholar] [CrossRef]
- Baro, F.; Chaparro, L.; Gomez-Baggethun, E.; Langemeyer, J.; Nowak, D.; Terradas, J. Contribution of Ecosystem Services to Air Quality and Climate Change Mitigation Policies: The Case of Urban Forests in Barcelona, Spain. AMBIO 2014, 43, 466–479. [Google Scholar] [CrossRef] [PubMed]
- Ueno, H. City Planning and Formation of Kyoto in Modern Age. Shisen 2010, 111, 30–44. (In Japanese) [Google Scholar]
- Ministry of Land, Infrastructure, Transport and Tourism, Government of Japan. Introduction of Urban Land Use Planning System in Japan. Available online: https://www.mlit.go.jp/crd/city/plan/tochiriyou/index.html (accessed on 2 January 2022).
- i-Tree Manuals, Guides & Workbooks. Available online: https://www.itreetools.org/support/resources-overview/i-tree-manuals-workbooks (accessed on 16 September 2020).
- Nowak, D.J.; Walton, J.T.; Stevens, J.C.; Crane, D.E.; Hoehn, R.E. Effect of Plot and Sample Size on Timing and Precision of Urban Forest Assessments. Arboric. Urban For. 2008, 34, 386–390. [Google Scholar]
- Nowak, D.J. Compensatory Value of Urban Trees in the United States. J. Arboric. 2002, 28, 194–199. [Google Scholar]
- Council of Tree and Landscape Appraisers Guide for Plant Appraisal. In Guide for Plant Appraisal, 8th ed.; The International Society of Arboriculture: Atlanta, GA, USA, 1992.
- Nowak, D.J. Understanding I-Tree: Summary of Programs and Methods. In United States Department of Agriculture; Forest Service, Northern Research Station: Madison, WI, USA, 2020. [Google Scholar]
- i-Tree UFORE Methods. Available online: https://www.itreetools.org/documents/53/UFORE%20Methods.pdf (accessed on 16 September 2020).
- Nowak, D.J. Brooklyn’s Urban Forest; USDA Forest Service: Washington, DC, USA, 2002. [Google Scholar]
- Nowak, D.J. Atmospheric Carbon Dioxide Reduction by Chicago’s Urban Forest; General Technical Report NE-186: Philadelphia, PA, USA, 1994. [Google Scholar]
- Ministry of the Environment, Government of Japan. Manual for Calculation and Valuation of Ecosystem Services Related to Biodiversity Conservation Activities for Enterprises. 2019. Available online: http://www.biodic.go.jp/biodiversity/activity/policy/valuation/pdf/instructions.pdf (accessed on 18 October 2021). (In Japanese)
- Nowak, D.J.; Hirabayashi, S.; Bodine, A.; Greenfield, E. Tree and Forest Effects on Air Quality and Human Health in the United States. Environ. Pollut. 2014, 193, 119–129. [Google Scholar] [CrossRef]
- Wang, J.; Endreny, T.A.; Nowak, D.J. Mechanistic Simulation of Tree Effects in an Urban Water Balance Model 1. JAWRA J. Am. Water Resour. Assoc. 2008, 44, 75–85. [Google Scholar] [CrossRef]
- Interagency Working Group on Social Cost of Greenhouse Gases, United States Government Technical Support Document: Technical Update of the Social Cost of Carbon for Regulatory Impact Analysis—Under Executive Order 12866. 2016. Available online: https://www.epa.gov/sites/default/files/2016-12/documents/sc_co2_tsd_august_2016.pdf (accessed on 18 October 2021).
- Turner, B.L.; Skole, D.; Sanderson, S.; Fischer, G.; Fresco, L.; Leemans, R. Land-Use and Land-Cover Change: Science/Research Plan. IGBP Report. 1995. Available online: https://asu.pure.elsevier.com/en/publications/land-use-and-land-cover-change-scienceresearch-plan-2 (accessed on 18 October 2021).
- Briassoulis, H. Analysis of Land Use Change: Theoretical and Modeling Approaches. In WVU Research Repository; Regional Research Institute, West Virginia University: Morgantown, WV, USA, 2019. [Google Scholar]
- Uchida, K.; Blakey, R.V.; Burger, J.R.; Cooper, D.S.; Niesner, C.A.; Blumstein, D.T. Urban Biodiversity and the Importance of Scale. Trends Ecol. Evol. 2021, 36, 123–131. [Google Scholar] [CrossRef] [PubMed]
- Pickett, S.T.A.; Cadenasso, M.L.; Rosi-Marshall, E.J.; Belt, K.T.; Groffman, P.M.; Grove, J.M.; Irwin, E.G.; Kaushal, S.S.; LaDeau, S.L.; Nilon, C.H. Dynamic Heterogeneity: A Framework to Promote Ecological Integration and Hypothesis Generation in Urban Systems. Urban Ecosyst. 2017, 20, 1–14. [Google Scholar] [CrossRef]
- Wu, J.; Li, H. Concepts of Scale and Scaling. In Scaling and Uncertainty Analysis in Ecology; Springer: Dordrecht, The Netherlands, 2006; pp. 3–15. [Google Scholar]
- Wiens, J.A. Spatial Scaling in Ecology. Funct. Ecol. 1989, 3, 385–397. [Google Scholar] [CrossRef]
- Song, P.; Kim, G.; Mayer, A.; He, R.; Tian, G. Assessing the Ecosystem Services of Various Types of Urban Green Spaces Based on I-Tree Eco. Sustainability 2020, 12, 1630. [Google Scholar] [CrossRef]
- Selmi, W.; Weber, C.; Riviere, E.; Blond, N.; Mehdi, L.; Nowak, D. Air Pollution Removal by Trees in Public Green Spaces in Strasbourg City, France. Urban For. Urban Green. 2016, 17, 192–201. [Google Scholar] [CrossRef]


| Land Use Class | Area (ha) | Proportion of Area | Number of Quadrats | Number of Trees |
|---|---|---|---|---|
| ResLow | 3519 | 24% | 35 | 399 |
| ResHigh | 3027 | 21% | 38 | 368 |
| ResOther | 3113 | 21% | 34 | 218 |
| Ind | 3213 | 22% | 23 | 134 |
| ComNbr | 864 | 5% | 9 | 77 |
| Com | 1009 | 7% | 12 | 44 |
| Item | Sum | Quadrat Average | Quadrat Median |
|---|---|---|---|
| Annual ecosystem services | 4285 | 28 | 10 |
| Carbon storage | 14,339 | 95 | 16 |
| Compensatory value | 518,712 | 3435 | 1128 |
| Scale | Carbon Sequestration | NO2 Removal | O3 Removal | PM2.5 Removal | SO2 Removal | Runoff Reduction |
|---|---|---|---|---|---|---|
| Quadrat level | 7.68 | 9.53 | 9.04 | 8.00 | 9.34 | 7.97 |
| Single-tree level | 24.42 *** | 55.68 *** | 53.94 *** | 51.98 *** | 54.21 *** | 51.68 *** |
| Species | Distribution (>3 Individuals per Land Use Class) | Carbon Sequestration | NO2 Removal | O3 Removal | PM2.5 Removal | SO2 Removal | Runoff Reduction |
|---|---|---|---|---|---|---|---|
| Acer palmatum Thunb. | Ind, ResOther, ResHigh, ResLow | 4.80 | 6.12 | 6.12 | 6.12 | 6.12 | 6.12 |
| Ginkgo biloba L., 1771 | Com, ComNbr, Ind, ResHigh | 9.86 * | 8.04 * | 8.04 * | 8.04 * | 8.04 * | 8.04 * |
| Ligustrum lucidum Ait. | Ind, ResOther, ResHigh, ResLow | 18.14 *** | 23.75 *** | 23.75 *** | 23.75 *** | 23.75 *** | 23.75 *** |
| Nandina domestica Thunb. | ComNbr, Ind, ResOther, ResHigh, ResLow | 14.38 ** | 23.92 *** | 23.92 *** | 23.92 *** | 23.92 *** | 23.92 *** |
| Osmanthus fragrans Lour. | Ind, ResOther, ResHigh, ResLow | 7.51 | 12.01 ** | 12.01 ** | 12.01 ** | 12.01 ** | 12.01 ** |
| Podocarpus macrophyllus (Thunb.) Sweet, 1818 | Com, ResOther, ResHigh, ResLow | 7.51 | 10.89 * | 10.89 * | 10.89 * | 10.89 * | 10.89 * |
| Prunus x blireana | Com, Ind, ResOther, ResHigh, ResLow | 0.78 | 3.49 | 3.49 | 3.49 | 3.49 | 3.49 |
| Quercus x alvordiana | Com, ComNbr, Ind, ResOther, ResHigh, ResLow | 54.36 *** | 72.05 *** | 72.05 *** | 72.05 *** | 72.05 *** | 72.05 *** |
| Zelkova serrata (Thunb.) Makino | Com, Ind, ResOther, ResHigh, ResLow | 7.19 | 5.53 | 5.53 | 5.53 | 5.53 | 5.53 |
| Land Use | Carbon Storage (ton/ha) | Carbon Sequestration (ton/ha/Year) | Runoff Reduction (m3/ha/Year) |
|---|---|---|---|
| ResLow | 11.51 | 1.47 | 36.08 |
| ResHigh | 12.82 | 1.60 | 42.48 |
| ResOther | 17.41 | 1.35 | 56.88 |
| Ind | 9.95 | 1.19 | 33.35 |
| ComNbr | 12.45 | 1.21 | 32.38 |
| Com | 6.99 | 0.81 | 16.71 |
| Land Use | NO2 Removal | O3 Removal | PM2.5 Removal | SO2 Removal |
|---|---|---|---|---|
| ResLow | 1.01 | 3.21 | 0.21 | 0.42 |
| ResHigh | 1.10 | 3.53 | 0.23 | 0.47 |
| ResOther | 1.00 | 3.16 | 0.20 | 0.42 |
| Ind | 1.04 | 3.36 | 0.22 | 0.44 |
| ComNbr | 1.07 | 3.46 | 0.23 | 0.45 |
| Com | 0.71 | 2.35 | 0.16 | 0.31 |
Publisher’s Note: MDPI stays neutral with regard to jurisdictional claims in published maps and institutional affiliations. |
© 2022 by the authors. Licensee MDPI, Basel, Switzerland. This article is an open access article distributed under the terms and conditions of the Creative Commons Attribution (CC BY) license (https://creativecommons.org/licenses/by/4.0/).
Share and Cite
Kang, J.; Hirabayashi, S.; Shibata, S. Urban Forest Ecosystem Services Vary with Land Use and Species: A Case Study of Kyoto City. Forests 2022, 13, 67. https://doi.org/10.3390/f13010067
Kang J, Hirabayashi S, Shibata S. Urban Forest Ecosystem Services Vary with Land Use and Species: A Case Study of Kyoto City. Forests. 2022; 13(1):67. https://doi.org/10.3390/f13010067
Chicago/Turabian StyleKang, Jiefeng, Satoshi Hirabayashi, and Shozo Shibata. 2022. "Urban Forest Ecosystem Services Vary with Land Use and Species: A Case Study of Kyoto City" Forests 13, no. 1: 67. https://doi.org/10.3390/f13010067
APA StyleKang, J., Hirabayashi, S., & Shibata, S. (2022). Urban Forest Ecosystem Services Vary with Land Use and Species: A Case Study of Kyoto City. Forests, 13(1), 67. https://doi.org/10.3390/f13010067