Abstract
Mangroves are important wetland ecosystems on tropical and subtropical coasts. There is an urgent need to better understand how the spatial distribution of mangroves varies with climate change factors. Species distribution models can be used to reveal the spatial change of mangroves; however, global models typically have a horizontal resolution of hundreds of kilometers and more than 1 km, even after downscaling. In the present study, a maximum entropy model was used to predict suitable areas for the northernmost mangroves in China in the 2050s. An approach was proposed to improve the resolution and credibility of suitability predictions by incorporating land-use potential. Predictions were made based on two CMIP6 scenarios (i.e., SSP1-2.6 and SSP5-8.5). The results show that the northern edge of the natural mangrove distribution in China would migrate from 27.20° N to 27.39° N–28.15° N, and the total extent of suitable mangrove habitats would expand. By integrating 30 m resolution land-use data to refine the model’s predictions, under the SSP1-2.6 scenario, the suitable habitats of mangroves are predicted to be 13,435 ha, which would increase by 33.9% compared with the current scenario. Under the SSP5-8.5 scenario, the suitable area would be 23,120 ha, with an increased rate of 96.5%. Approximately 40–44% of the simulated mangrove patches would be adjacent to aquacultural ponds, cultivated, and artificial land, which may restrict mangrove expansion. Collectively, our results showed how climate change and land use could influence mangrove distributions, providing a scientific basis for adaptive mangrove habitat management despite climate change.
1. Introduction
Mangroves are ecologically important wetland ecosystems that provide habitats for many species [1,2], store carbon [3], and support key ecosystem services for humans [4]. Mangroves protect tropical and subtropical coasts from erosion and storm damage [5]; however, they are degenerating at an alarming rate [6,7]. Climate change [8], sea level rise [9], and anthropogenic activities, such as clearing mangrove forests for aquaculture or agriculture [10,11,12], threaten this valuable ecosystem.
Records show that the global temperature was 1.09 °C higher in 2011–2020 than in 1850–1900 with larger increases over land (1.59 °C) than over the ocean (0.88 °C). In addition, the growing season of organisms has lengthened by up to 2 days per decade since the 1950s in the extratropical Northern Hemisphere [13]. As tropical and subtropical vegetation, the distribution of mangrove forests will be driven by changes in these environmental conditions. In eastern Asia, the western Gulf of Mexico, and eastern North America, mangrove distribution range limits are typically determined by winter air temperature extremes [14]. Predictions of global mangrove distribution indicate that by 2080, mangroves ranges would shift poleward by more than 2° of latitude and experience a gain or loss of coastal habitat depending on the species [15]. Although warmer winter temperatures are expected to facilitate the poleward expansion of mangroves, complex factors, such as dispersal limitation, habitat availability constraints, and climate extremes, may hinder mangrove expansion, especially near certain range limits [16,17].
China is located on the northern edge of the global mangrove forest distribution and has one-third of the mangrove species [18,19]. From 1980 to 2019, China’s coastal sea surface temperature increased by an average of 0.25 °C every decade, of which 2015–2019 was at a high level for five consecutive years [20]. Fujian Province is at the northern edge of the natural distribution of mangrove forests throughout the country. In 2020, the annual average temperature in Fujian exceeded the historical record by 1.1 °C; meanwhile, the average temperature in winter was 1.9 °C higher than the historical record [20]. Therefore, the areas suitable for mangroves in coastal China may extend northward beyond Fujian Province as warming and lengthened growing seasons may provide more suitable habitats. However, mangrove habitat availability is highly affected by coastal land-use patterns. In China, 75% of the predicted suitable habitat for mangroves has been lost as a consequence of coastal land-use change [11]. In 2020, China’s coastal sea level was 73 mm higher than the average from 1993 to 2011 [21]. With intensive coastal land development, the mangrove landward migration caused by sea level rise may also be blocked by concrete seawalls or other constructions [22,23]. Therefore, to effectively implement mangrove protection and restoration in China, predicting mangrove distribution shifts and formulating novel strategies to fight extreme climatic scenarios are a necessity.
As one of the best and widely used species distribution models, the maximum entropy model (MaxEnt) enables habitat suitability predictions based on machine learning algorithms using species occurrence records and environmental data. It provides probable species distribution according to the maximum entropy subjected to a set of constraints that represent incomplete information about the target species distribution [24,25,26]. The model can also project the species distribution under changing environmental factors based on the training relationship under current conditions, thus evaluating whether the species will shift their geography in response to global environmental change by contracting, expanding, or fragmenting distribution ranges. So far, the model has been used to predict future changes of terrestrial or marine species distribution on different temporal and spatial scales, yielding reliable predictions [15,16,17,27].
Environmental variables derived from global change models (GCMs) are commonly used for model predictions. The newly released edition of the Coupled Model Intercomparison Project 6 (CMIP6) includes several global change scenarios, among which SSP1-2.6 represents a scenario in which societies would rapidly reduce emissions leading to a limit warming, and SSP5-8.5 represents “business as usual” with very high emissions. CMIP6 has a higher climate sensitivity than previously used models [28]. However, these GCMs typically have a horizontal resolution of hundreds of kilometers and more than 1 km even after downscaling [15,29,30]. Therefore, previous predictions of mangrove spatial distribution changes were made based on large resolution data [15,17] and considered only natural environmental conditions, which can hardly identify mangrove patches and actual habitat availability, causing distortion when focusing on regional scales. On the other hand, the spatial availability of mangrove forests is mainly limited by the state of land use, and land-use data products have reached a universal resolution of 30 m or higher. Therefore, using high-resolution land-use data to refine climate model results is possible, and it could improve the prediction accuracy and reveal actually available habitats. Recently, land-use potential has been included in the climate suitability evaluation approaches for particular species to predict whether the study region has increasing or decreasing suitability for adaptation recommendations [31]. Considering the land-use strategy under CMIP6, more sensible possibilities of distribution prediction for plants can be performed [32].
Therefore, the aim of this study was to (1) predict suitable habitats for northernmost mangroves in China in response to future climate change by the 2050s and map their shifts under SSP1-2.6 and SSP5-8.5 scenarios; (2) explore the feasibility of using high-resolution coastal land use to refine the outputs of the species distribution model to improve the conclusion reliability; (3) estimate the potential impact of coastal land-use patterns on mangrove habitat shifts under climate change.
2. Materials and Methods
2.1. Study Areas and Mangrove Occurrence Data Collection
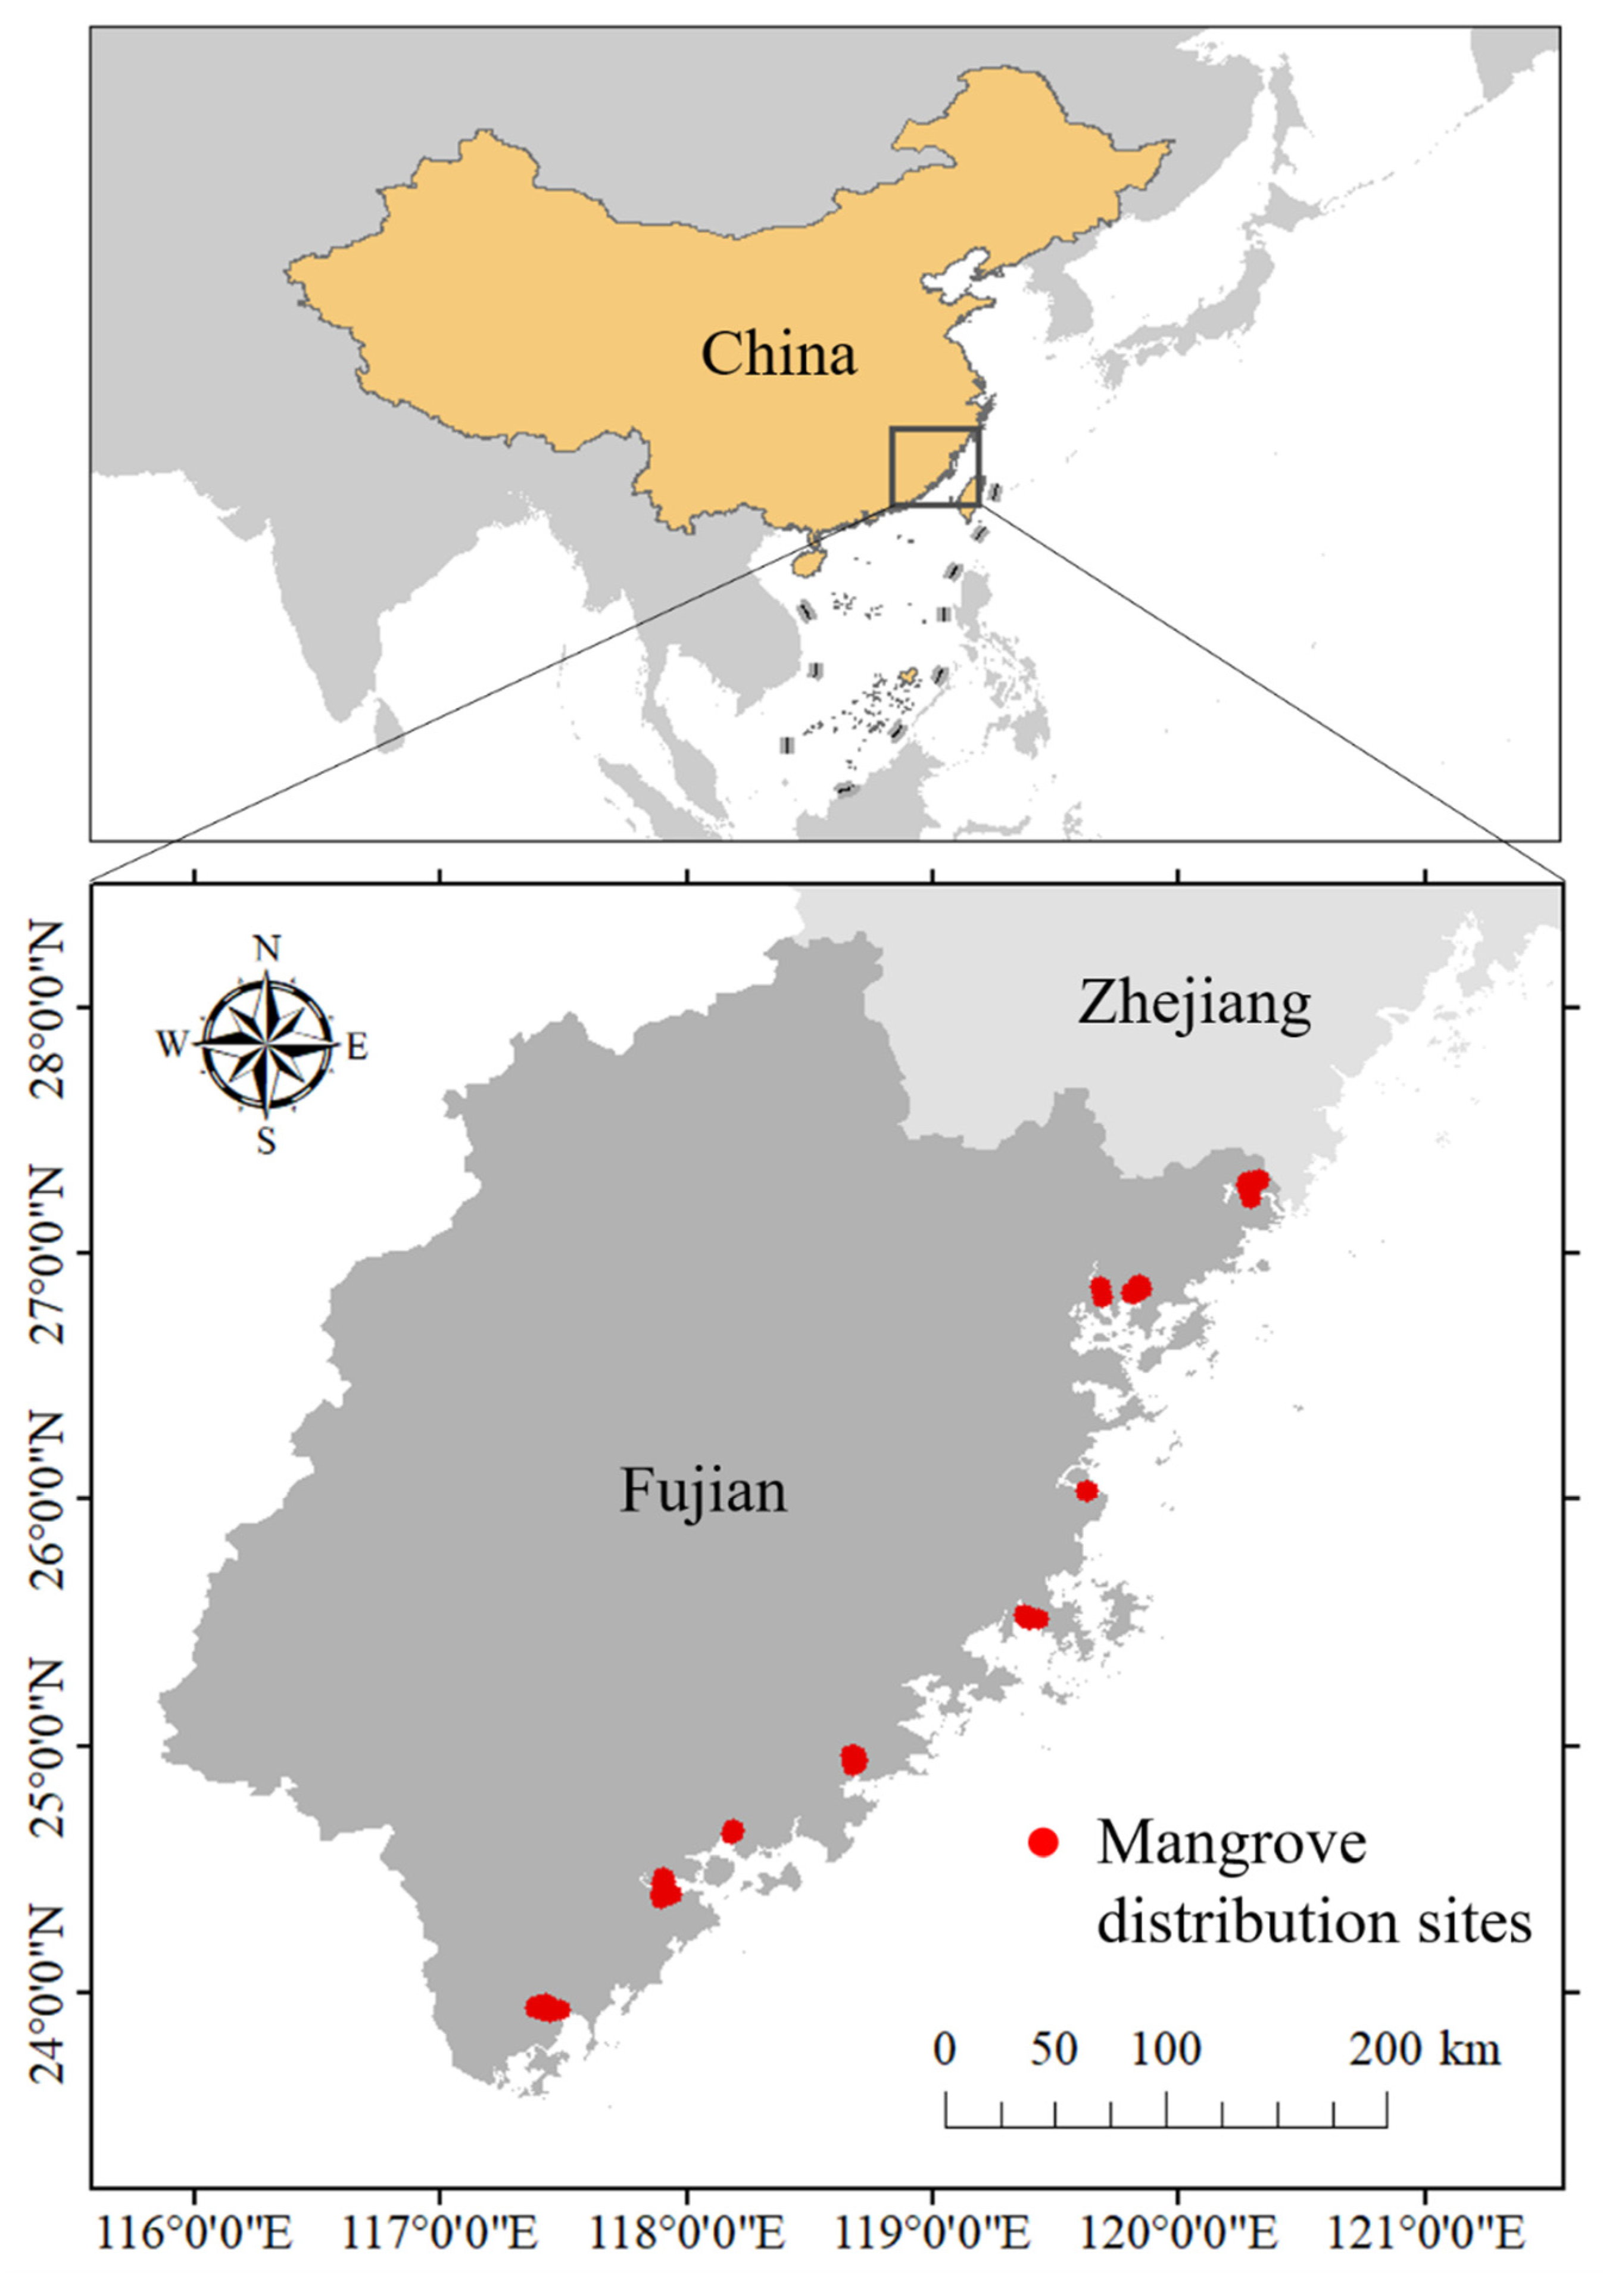
Fujian Province is China’s northernmost mangrove natural distribution area (excluding artificially introduced sites) with a 3300 km coastline (Figure 1). The terrain of Fujian Province is dominated by mountains and hills lacking cultivated land and has a long history of coastal reclamation and aquaculture [33]. Fujian Province has a subtropical marine monsoon climate. During 1981 and 2010, the average annual temperature was 19.5 °C with an average winter temperature of 11.2 °C and summer temperature of 27 °C. In Fujian’s coastal areas, February has the lowest temperature and August has the highest. The average temperature during the coldest month is 8.4~12.9 °C. The average annual precipitation is 1686 mm, and the majority of the precipitation occurs in May and June [34]. Within the study region, mangroves are scattered across various harbors or estuaries (Figure 1) [33]. The richness in mangrove species gradually decreases from south to north, with Kandelia candel distributed throughout the province [35]. Considering that mangrove habitats may move northward under future scenarios, southern Zhejiang Province was also included in the study area. The mangrove patches were visually interpreted from 2.5 m resolution remote sensing images (2018 ESRI World Imagery) and were checked during reconnaissance and sampling plot surveys in 2018 and 2019. The Fishnet method in ArcGIS Pro 2.5 was then used to resample the mangrove patches into occurrence points. Finally, a data set, including 319 occurrence points, was constructed.
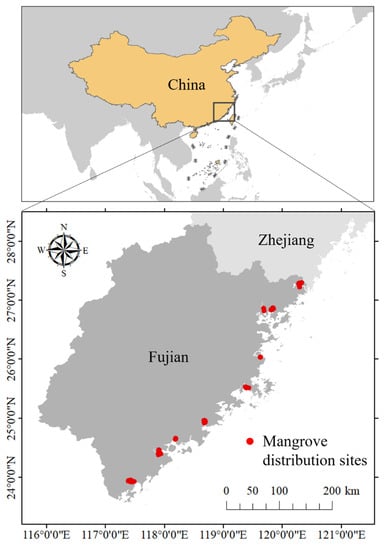
Figure 1.
Study area and mangrove distribution sites.
2.2. Environmental Variables under Climate Change
Mangrove distributions along coastlines are influenced by both land and marine environmental factors. Landscape setting, salinity, slope, sea level rise, precipitation regime alternation, and temperature increase the impact on mangrove distribution [12,16,36,37,38]. A total of 28 environmental factors, including bioclimatic, topographic, marine environmental, and intertidal substrate cover, were used to build the mangrove distribution model under SSP1-2.6 and SSP5-8.5 (Table 1).

Table 1.
Environmental factors used to predict current and future suitable habitats for mangroves in Fujian Province.
The current and future bioclimatic data of CMIP6 were downloaded from the WorldClim database with an original data resolution of 2.5 min [39,40]. The marine environmental data layers were extracted from the Bio-ORACLE v2.2 data set with a resolution of 10 km [41,42]. The intertidal substrate cover data, at a resolution of 30 m, were downloaded from http://www.geodata.cn (accessed on 2 August 2021) [12,43,44]. Topographic data, at a 2 km resolution, were obtained from NOAA ETOPO1 bathymetry data (https://www.ngdc.noaa.gov/accessed on 28 July 2021). Sea level rise estimation was based on the 2020 China Sea Level Bulletin, which estimated that in the next 30 years, the coastal sea level would rise from 40 mm (SSP1-2.6) to 150 mm (SSP5-8.5) in the study area. All current and future environmental variables were interpolated to a 1 km spatial resolution using the change factor approach, low-pass filter, and mosaic methods for model prediction and grid analysis [40]. All 28 factors were simultaneously entered in the models, because MaxEnt is based on machine learning methods and is not sensitive to factor collinearity [25,45]. These environmental factors were integrated into a background area within a −6–6 m elevation to assure the environmental data can cover the intertidal zone.
2.3. MaxEnt Modeling and Evaluation
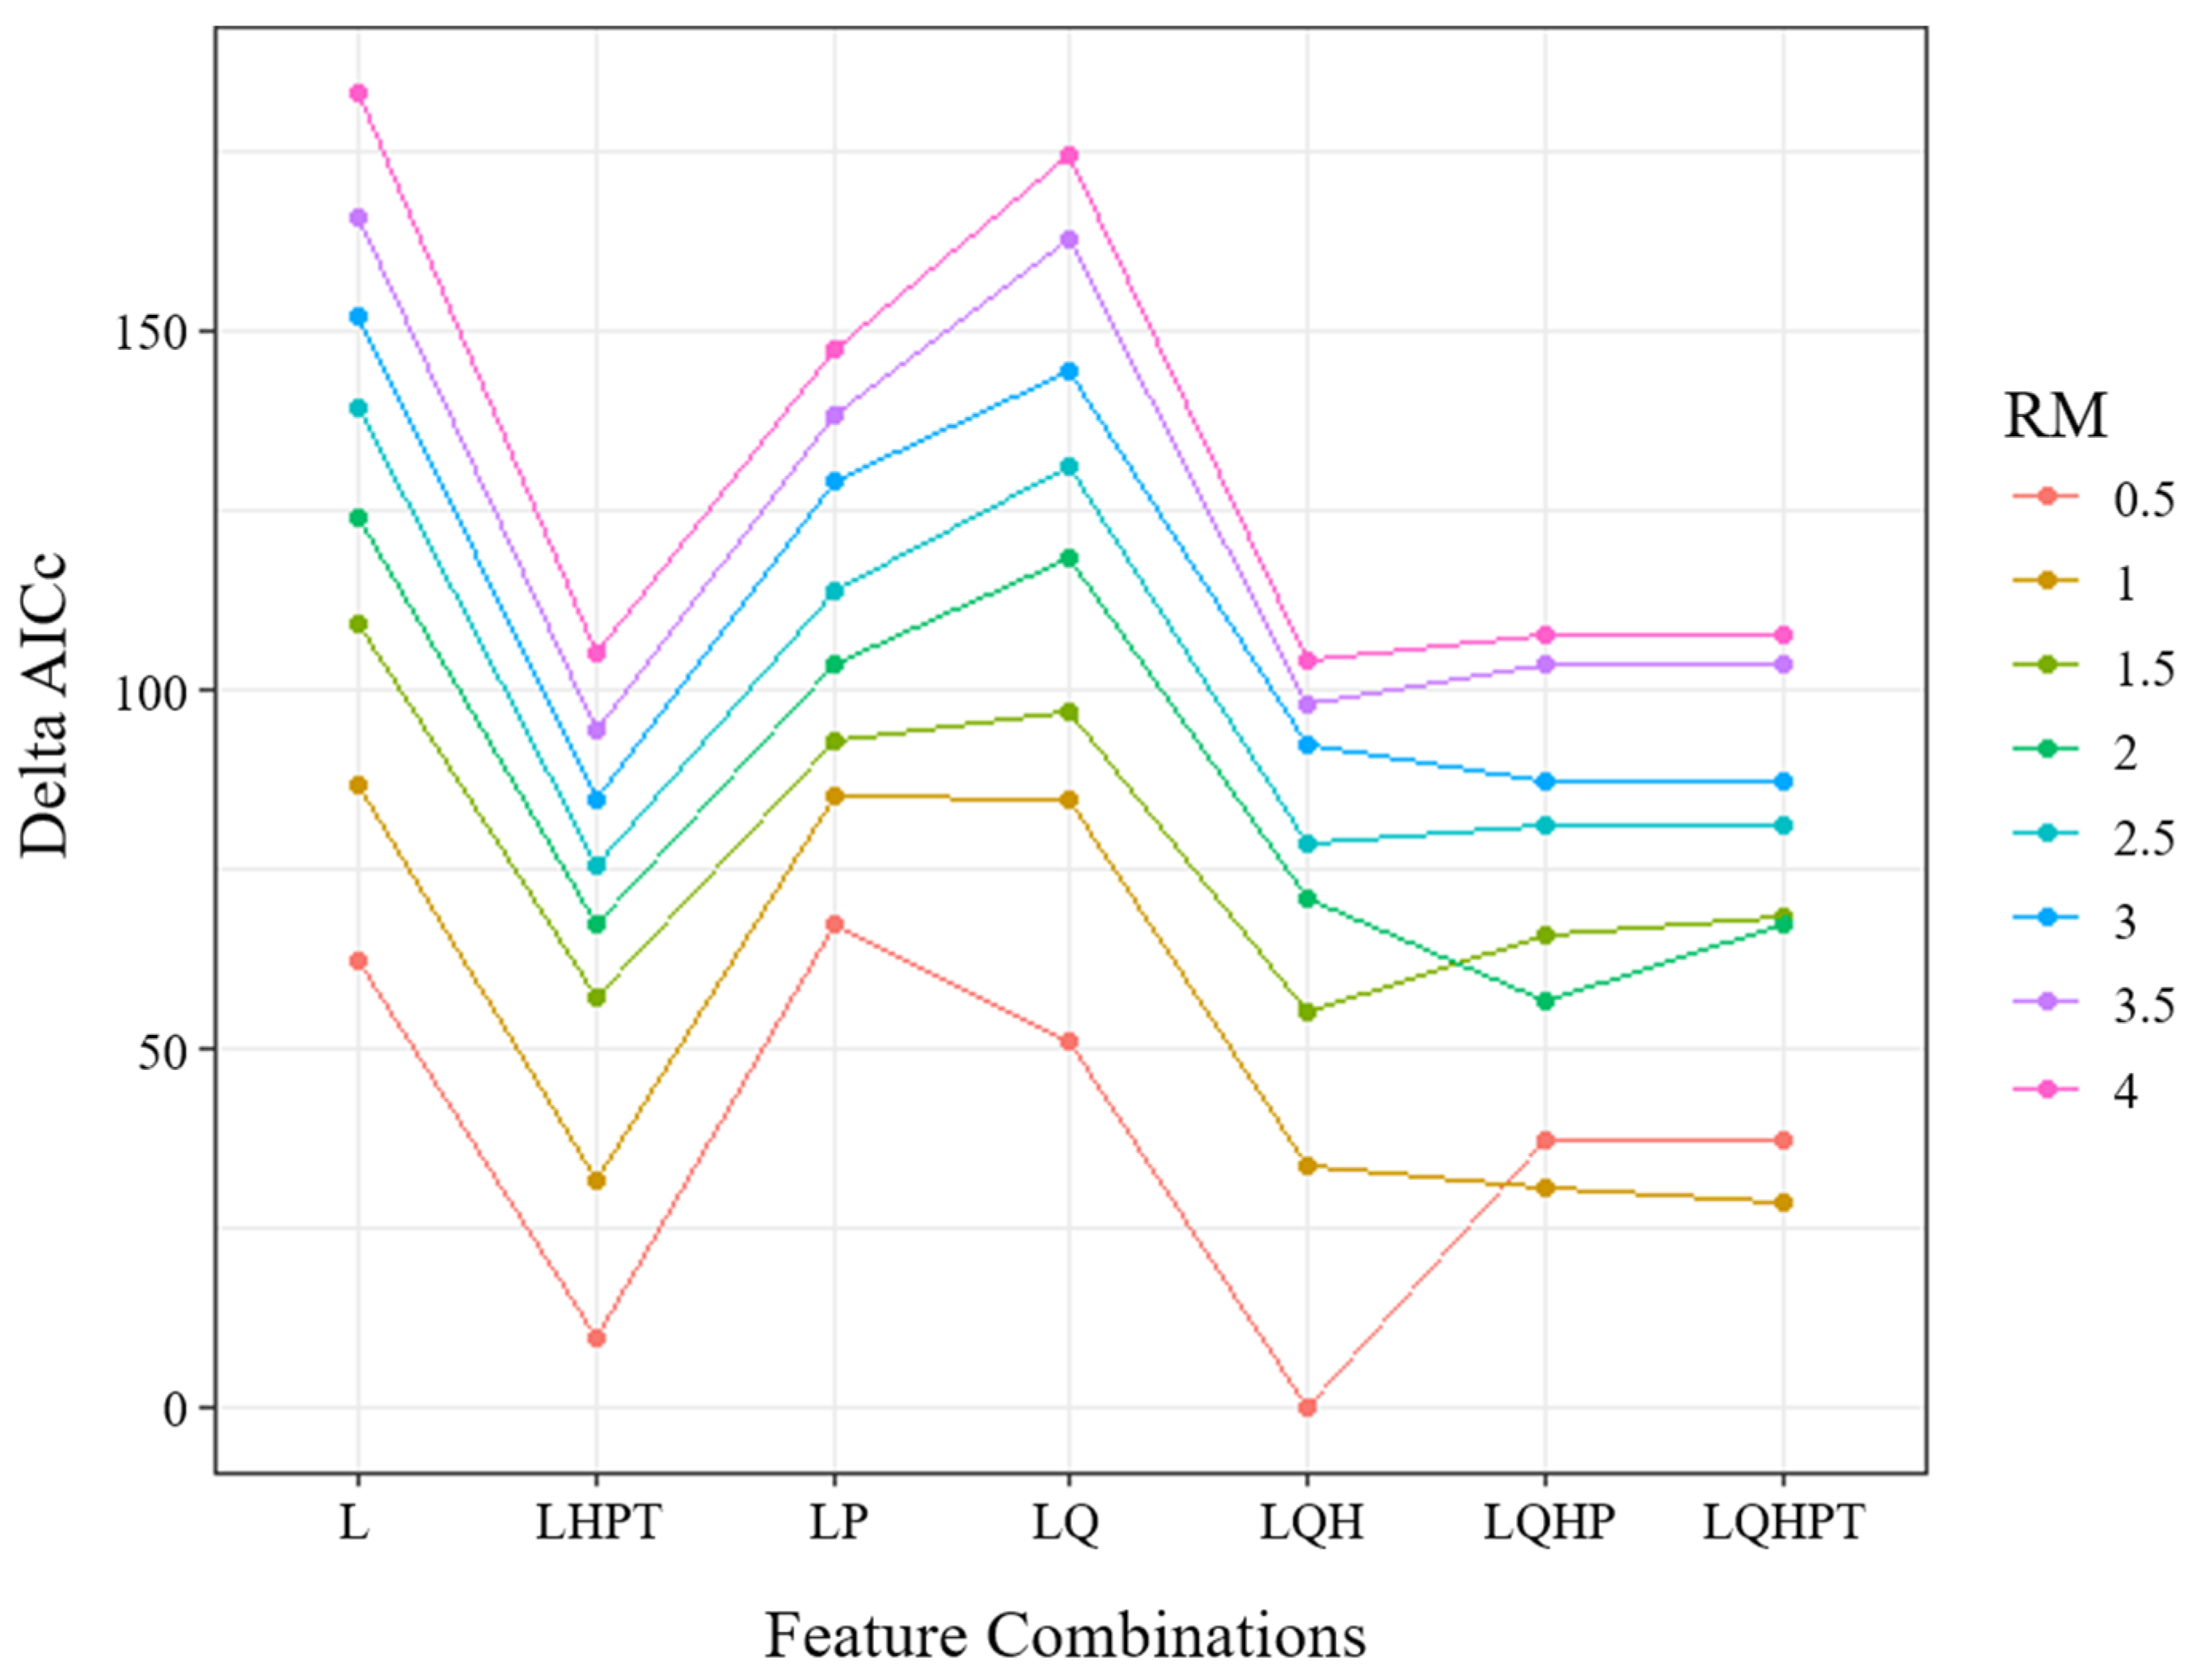
MaxEnt (version 3.4.1) was used to predict potentially suitable mangrove habitats under two scenarios: SSP1-2.6 and SSP5-8.5. To optimize the model, we fine-tuned it using the ENMeval package in “R” software instead of using the default settings [46]. The setting of regularization multiplier (RM) values between 0.5 and 4 (the increment was 0.5) and seven feature class combinations: L (linear), LQ (linear, quadratic), LQH (linear, quadratic, and hinge), LQHP (linear, quadratic, hinge, and product), LP (linear, product), LHPT (linear, hinge, product, and threshold), and LQHPT (linear, quadratic, hinge, product, and threshold) were evaluated [46,47]. Among the 56 tested models, the configuration that yielded the lowest delta-AICc under the block cross-validation scheme was considered to have the best predictive performance and was finally chosen [46]. The model reliability was evaluated using the receiver operating characteristic curve of the jackknife method [24,48]. Binary habitat suitability maps were produced using the lowest presence threshold [49]. The variations of future suitable habitats under different scenarios were calculated and analyzed using ArcGIS Pro 2.5 based on the model predictions.
2.4. Refining Procedure with Land-Use Data
A refining process was proposed to quickly optimize the modeling results, improve the resolution, and reveal the impact of land-use patterns on mangroves (Figure 2). The 2020 Globeland30 land cover data (http://www.globeland30.org/ accessed on 17 October 2021) [50] and ASTER Global Digital Elevation Model V003 (http://earthdata.nasa.gov accessed on 17 October 2021) were used for the refining process. There are ten land cover types in the Globeland30 data set. However, land cover types that were crucial to our study are not listed in the original data set, for example, mangroves and aquaculture ponds. Therefore, we reprocessed the Globeland30 data. The ten types were reclassified into four main types: cultivated land, artificial surfaces, wetland, water, and sea, and others. The coastal aquaculture pond data [43] and modeled mangrove habitats were collected, where mangrove patches were extracted at an elevation below 6 m according to the digital elevation model (DEM) data. In the refining procedure, the above data sets were mosaicked according to certain criteria to extract available mangrove habitats and to deduct those developed lands. Considering the restrictive effect of developed land on mangroves, the order of mosaics was set to prioritize aquaculture ponds, cultivated land, and artificial surfaces, followed by potential mangrove habitats and other land types to ensure that it could reflect the occupation of mangroves by development land. Finally, three 30 m resolution land-use maps containing available mangrove habitats under the current and 2050 scenarios were produced. To further evaluate the potential effects of land use on mangrove habitats, mangrove patches adjacent to the developed land were extracted and calculated. The raster maps were converted into polygons to obtain four classes of polygons: mangrove habitats, aquaculture ponds, cultivated land, and artificial surfaces. The boundary touching condition was set in ArcGIS Pro 2.5 to obtain the spatial relationship between mangrove patches and developed land types, and the adjacent patches were filtered and counted.
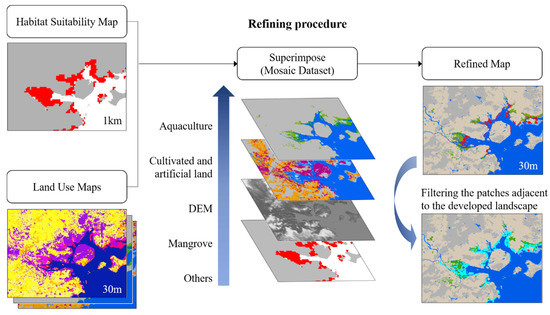
Figure 2.
Refining procedure to obtain high-resolution mangrove habitat maps.
3. Results
3.1. Model Evaluation and Environmental Drivers
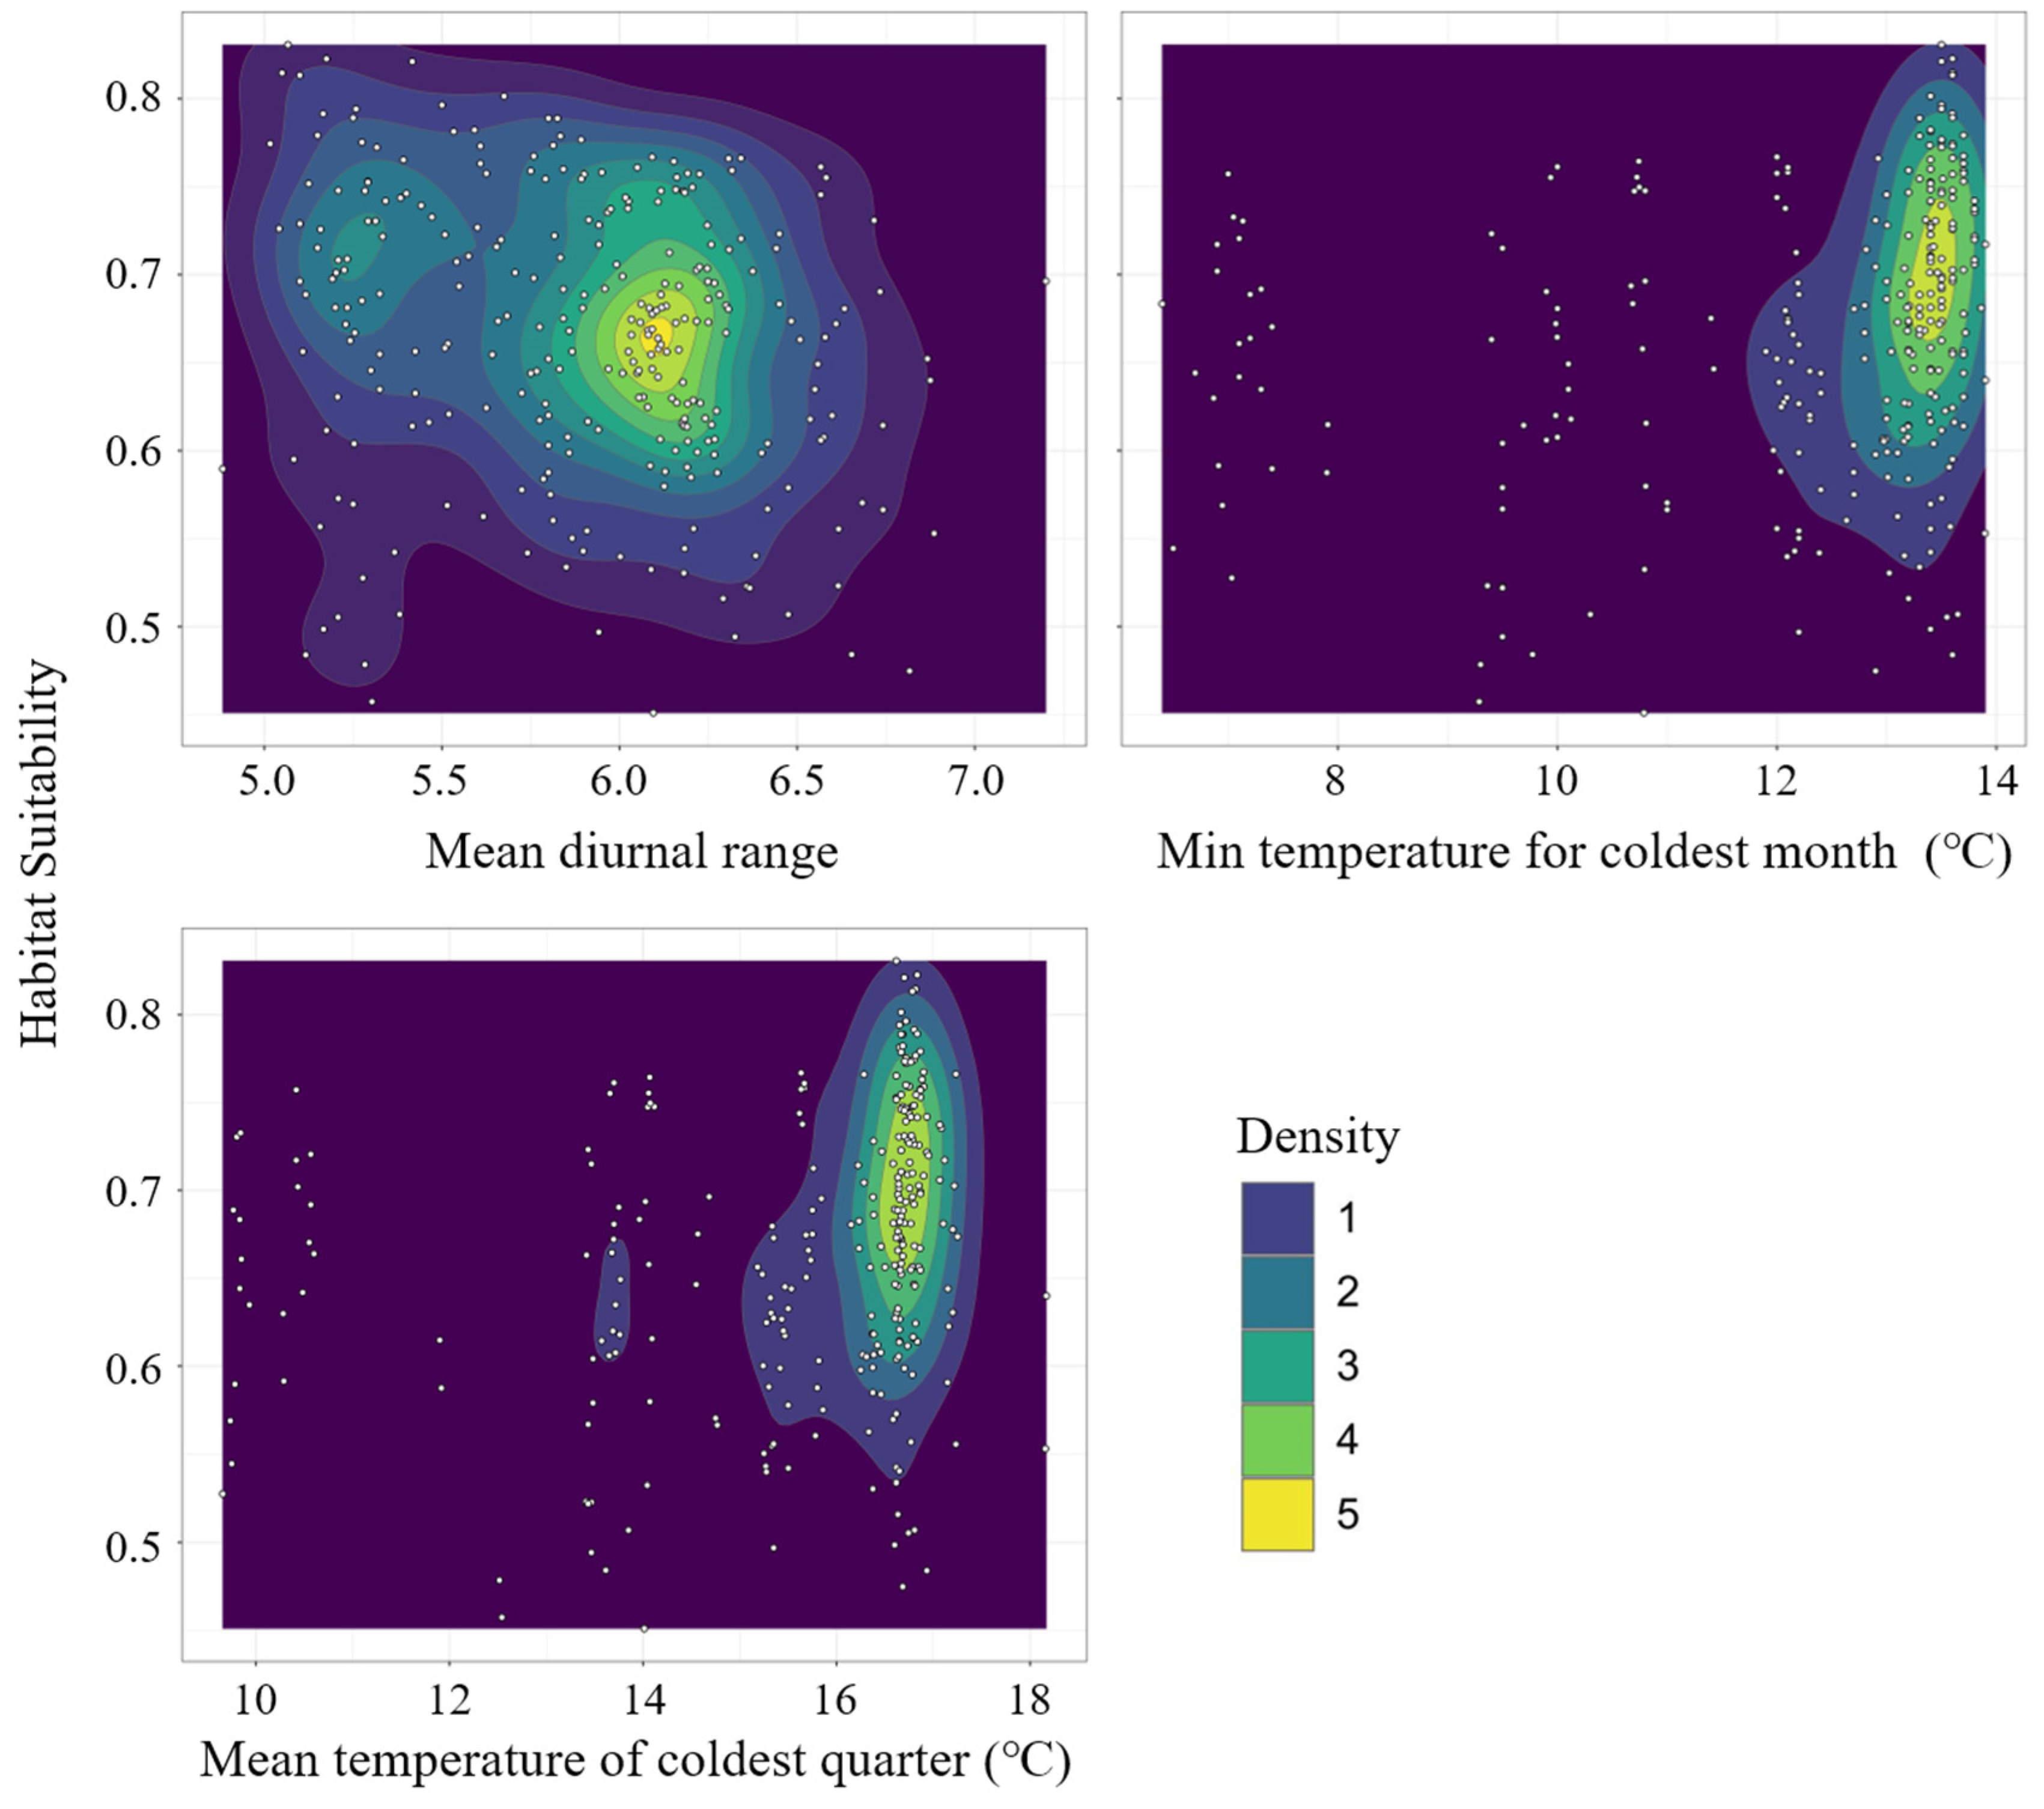
Among the 56 models, the model with RM = 0.5 and a feature combination (FC) of LQH had a delta-AICc of 0; thus, it was selected as the best setting (Figure 3). With the optimized setting, the average AUC test for the ten replicate runs of the models was 0.978 (±0.018), indicating a high model accuracy. The jackknife test of variable importance showed that intertidal substrate cover, Euclidean distance to coastline, bathymetry, mean diurnal range, the minimum temperature for the coldest month, and mean temperature of the coldest quarter were the top drivers among the 28 environmental predictors. The first three variables limit the physical conditions of mangrove distribution. The results indicated that suitable habitats for mangroves are mainly located in tidal mudflats within 200 m offshore and wit a bathymetry of approximately 0 m. The latter three variables limit the climatic suitability range of mangroves. In the study region, mangroves prefer climate conditions with a mean diurnal range of 6.0–6.5 °C, a minimum temperature of 13–14 °C, and a mean winter temperature beyond 16 °C (Figure 4).

Figure 3.
Delta-AICc values under different settings of the regularization multiplier (RM) and feature class combinations.

Figure 4.
Contour map of three climate variables and habitat suitability.
3.2. Simulated Suitable Habitats and Their Shifts under Different Scenarios
The mangroves were predicted to experience habitat expansion and poleward shifts. According to the results of the MaxEnt models (1 km resolution), the current potential suitable area for mangroves was 581,848 ha. Under the SSP1-2.6 scenario, the suitable area would be 767,501 ha, which is an increase of 24.2% compared with the current scenario. Under the SSP5-8.5 scenario, the suitable area was 1,272,340 ha, with an increase of 118.7% compared with the current scenario. In Sansha Bay and Shacheng Harbor of northern Fujian, suitable areas would expand more than in other places. Currently, the northernmost natural boundary of mangrove distribution in China is in Shacheng Harbor, Fujian (27.20° N). According to the predicted results, the northernmost boundary would shift to Cangnan, Zhejiang (27.39° N) under SSP1-2.6, while under SSP5-8.5, the boundary would probably move to Yueqing, Zhejiang (28.15° N) (Figure 5a–c). Depending on different scenarios, the northward moving distance ranged between 23 and 114 km.
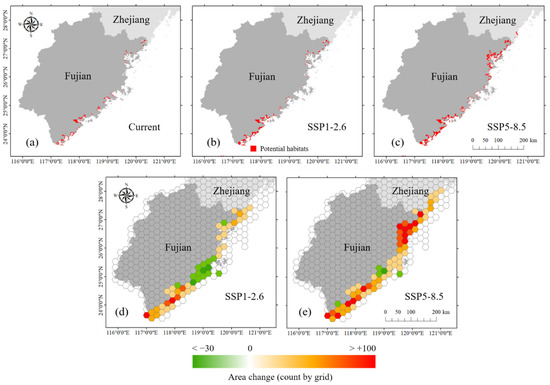
Figure 5.
Potential distributions of suitable mangrove habitats: (a) current; (b) SSP1-2.6 scenario; (c) SSP5-8.5 scenario; habitats’ spatial variation was based on 500 km2 hexagonal cells, and hexagonal cell color shading represents the change in 1 km grid numbers predicted to be mangrove habitats; (d) SSP1-2.6 scenario; (e) SSP5-8.5 scenario.
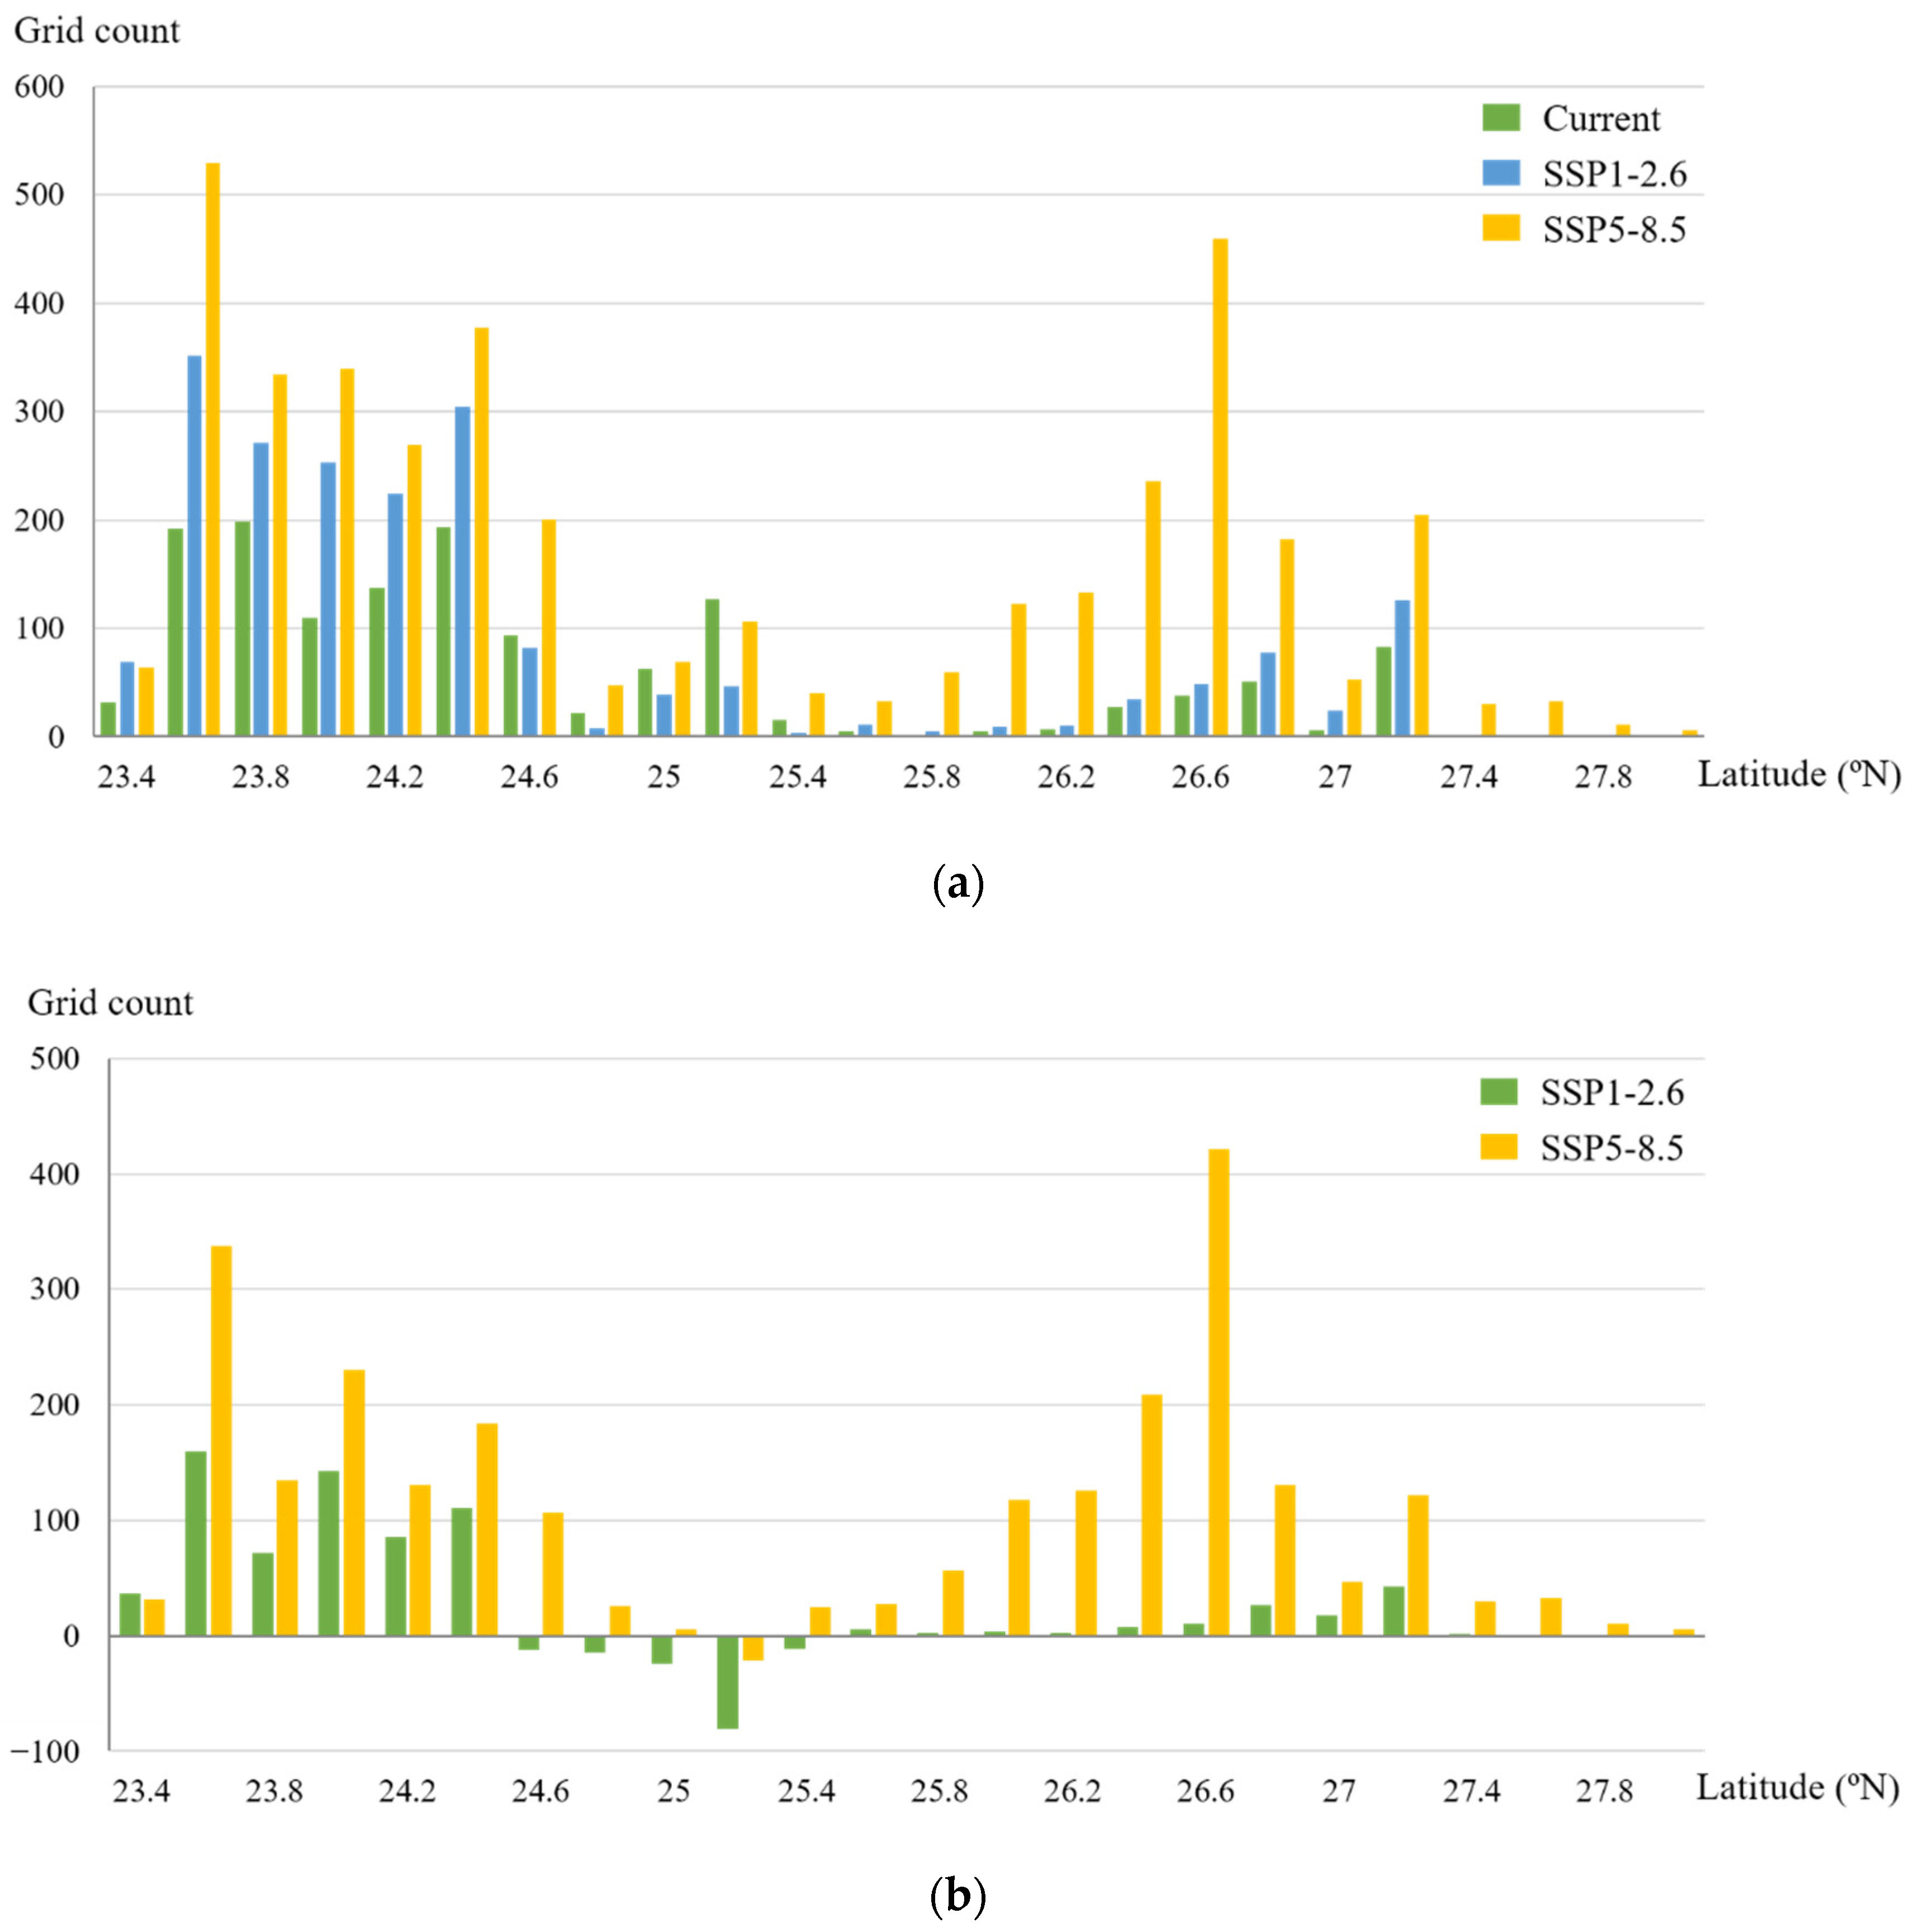
To observe the mangrove habitat shifting more clearly, we mapped the change in predicted occupancy grids for mangroves under climate scenarios projected for the 2050s relative to the current fitted predicted occupancy within 500 km2 of hexagonal cells along the coast (Figure 5d,e). The results showed that under the SSP1-2.6 and SSP5-8.5 scenarios, mangroves were forecast to gain an area of suitable habitat in most coastal regions (within 54%–91% hexagonal grids). However, habitat loss would occur in a small number of hexagonal grids. We also observed changes in the habitat characteristics along the latitude gradient. The suitable habitat areas of mangroves were larger in the south than in the north, with 69.6%, 77%, and 53.7% of suitable areas concentrated to the south of 25° N in the current, SSP1-2.6, and SSP5-8.5 scenarios, respectively (Figure 6a). This finding indicated that the habitat centroid would move northward. Under the SSP1-2.6 scenario, the expanded habitats were mostly concentrated between 23.5° N and 24.5° N. Under the SSP5-8.5 scenario, there would be a significant increase in mangrove suitable habitat distribution at 26–27° N. Habitat loss would be observed at 25° N in both climate change scenarios (Figure 6b).

Figure 6.
Distribution and variation of current and future mangrove suitable habitats along latitude gradients: (a) distribution; (b) variation.
3.3. Refined Results and the Effect of Land Use on Mangrove Habitats
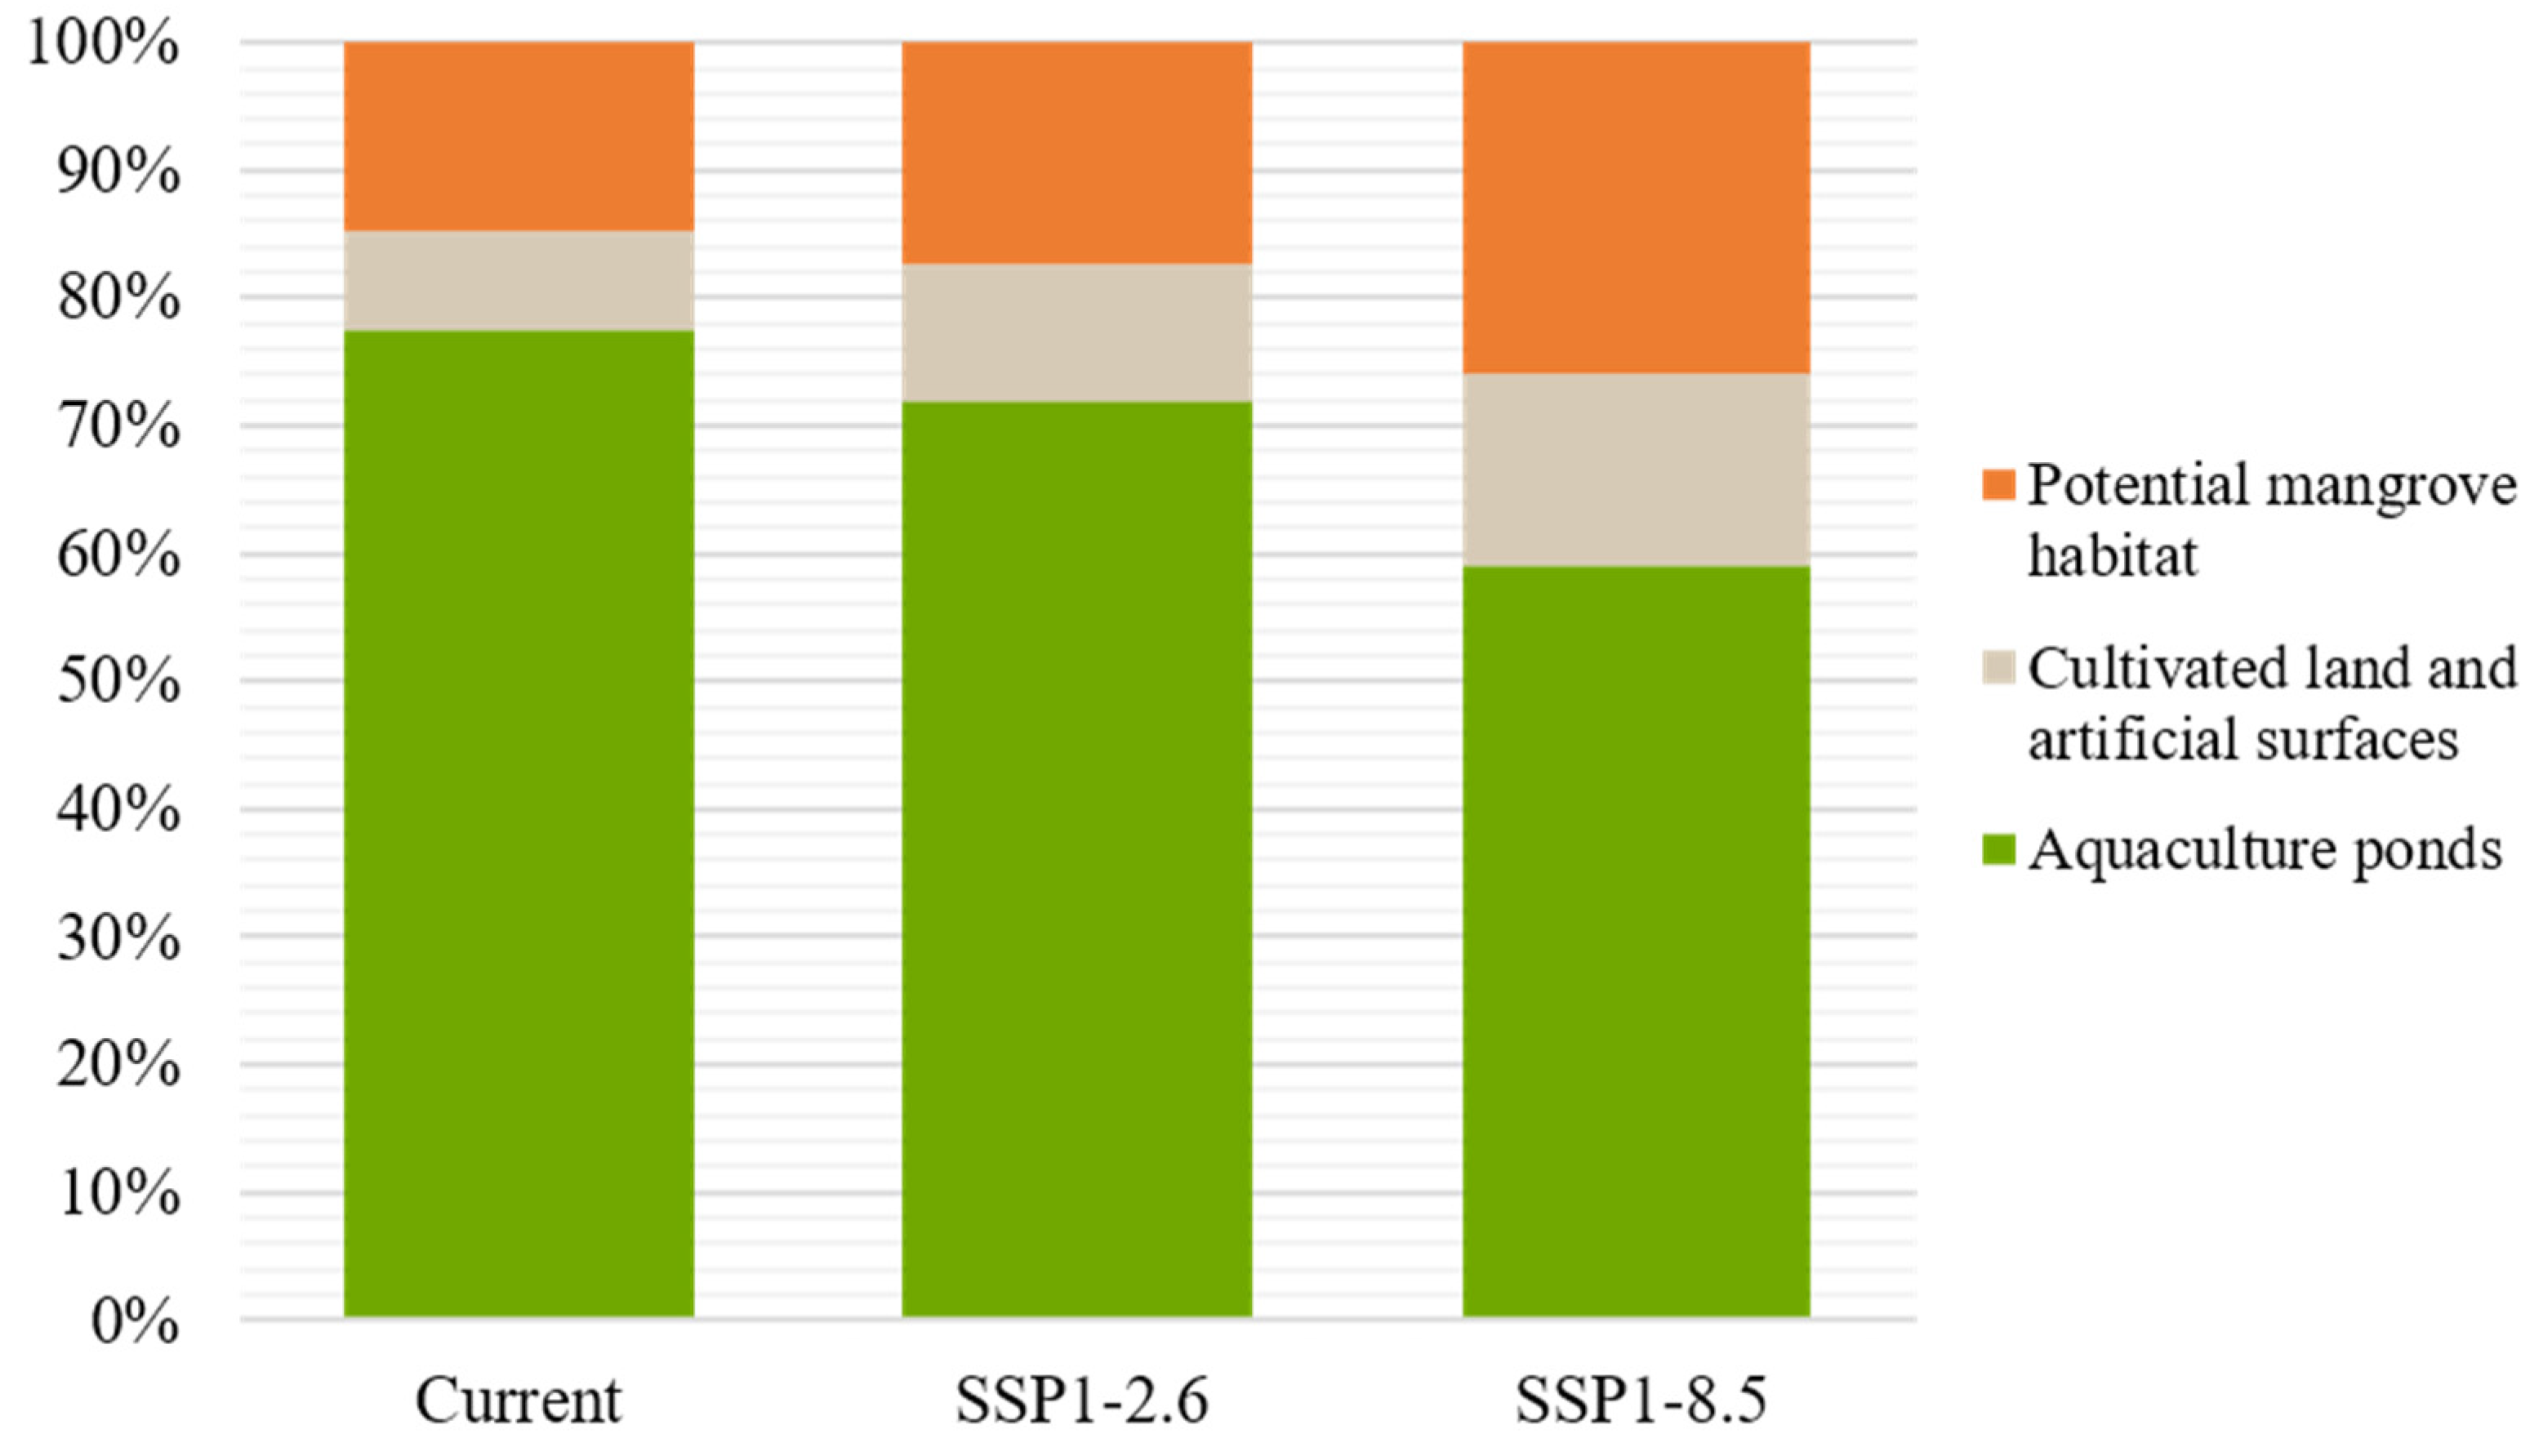
Comparing the refined results with the original MaxEnt outputs, lands unavailable for mangroves were excluded. After the refining process, the potential mangrove distribution area was 10,032 ha under the current scenario. Under the SSP1-2.6 and SSP5-8.5 scenarios, the area was 13,435 ha and 23,120 ha, increasing by 33.9% and 96.5%, respectively, compared to the current scenario. We found that in the original model’s results, only 15–26% of potential habitats were available land. In the unavailable habitats, aquaculture ponds accounted for 77.5%, 71.9%, and 59% and cultivated and artificial land accounted for 14.7%, 17.2%, and 25.9% in the current, SSP1-2.6, and SSP5-8.5 scenarios, respectively (Figure 7). The results indicate that a large number of potentially suitable mangrove habitats might be occupied by human activities in the present and future scenarios.

Figure 7.
Overlap of cultivated and artificial surfaces and aquaculture with current and future mangroves suitable habitats.
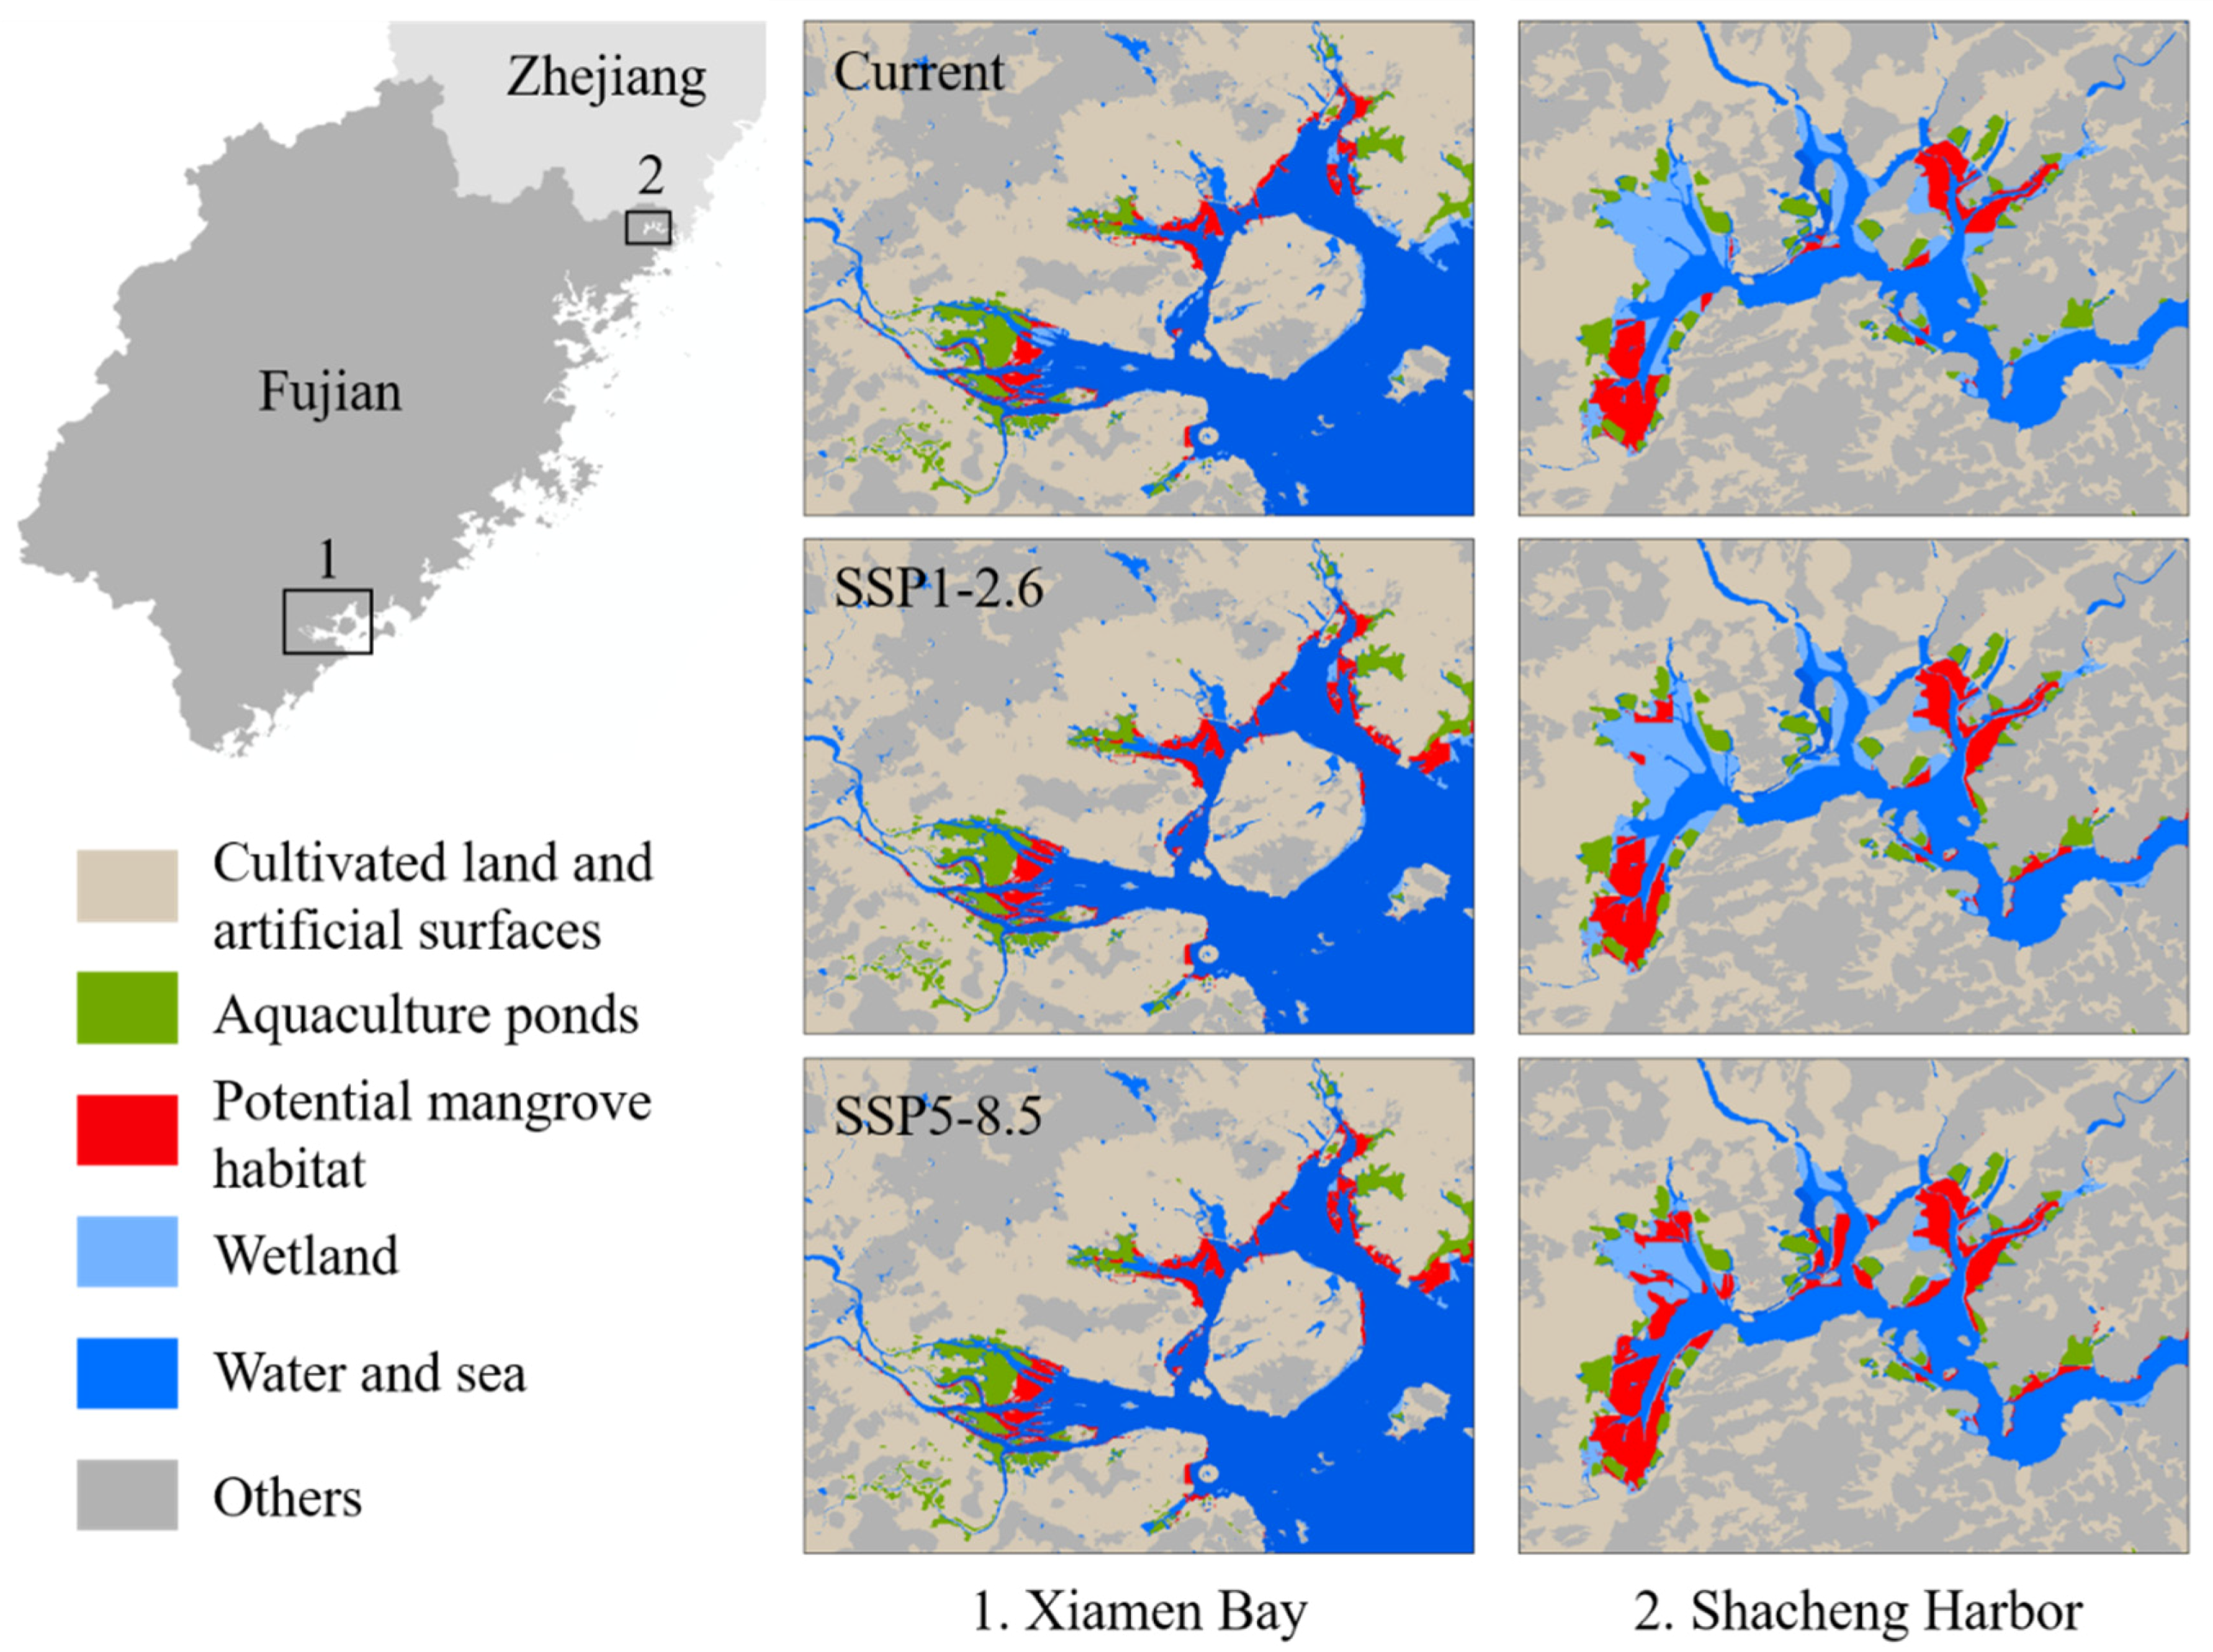
For available habitats, many potential habitat patches were close to aquaculture ponds, cultivated, and artificial land (Figure 8), which may limit the mangrove landward expansion under climate change. According to the mosaic maps, 28.22% of habitat patches were adjacent to cultivated and artificial land, and 17.51% were adjacent to aquaculture ponds. Under SSP1-2.6, 27.46% of potential habitat patches would be adjacent to cultivated and artificial land and 17.15% adjacent to aquaculture ponds. Under SSP5-8.5, 23.83% of potential habitat patches would be adjacent to cultivated and artificial land, and 16.19% adjacent to aquaculture ponds. Therefore, along with the expansion of mangroves under climate change, there may be consistent conflicts between land use and mangrove conservation.
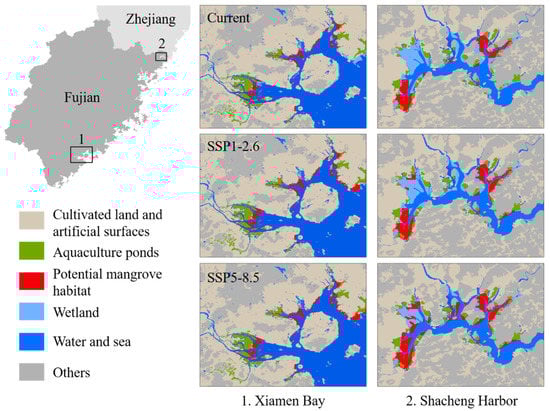
Figure 8.
Land-use influence on suitable habitats of mangrove concentrated distribution areas under current and future scenarios.
4. Discussion
4.1. Environmental Drivers of Mangrove Distribution Change
It has been acknowledged that changing marine and land factors, such as sea level rise, increasing temperatures, and altered precipitation regimes, affect mangroves at regional scales [38]. Our model predicted that topography and temperature were the main drivers expectedly affecting mangroves in Fujian and Zhejiang provinces, China. The suitable variable ranges indicated that mangroves were strictly distributed in the intertidal zone around the coastline; therefore, they were sensitive to changes in water inundation duration and frequency [51]. Global climate change has caused instability in the water–land boundary in the coastal zone and has driven the increase or decline in coastal mangroves [52]. However, mangroves have considerable resilience to land elevation changes caused by sea level rise. There is evidence that mangrove forests have the capacity to adjust the seabed level at a rate that matches sea level rise through their intrinsic biological feedback mechanisms [53]. For instance, vegetative structures, such as mangrove roots, can contribute to elevation gain [54].
In addition to topographic changes, local temperature and precipitation also act as critical drivers of mangrove distribution shifts [55]. Many mangrove distributions are latitudinally confined by the minimum temperature of 16 °C at winter worldwide [56]. Our study area is located at the northern edge of the global mangrove distribution. The model predicted that the mangroves in this region are most suitable at habitats with a minimum temperature of 13–14 °C, while physiological research showed that a winter temperature of 10 °C was the critical biological temperature for mangroves in Fujian Province [57]. The declining frequency of severe cold winter events and warmer winters in the future will likely cause migration to higher latitudes [58,59]; therefore, mangroves in this region may benefit from the temperature increase and further expand northward. In summary, mangroves in most of our study areas displayed a positive response when exclusively considering environmental drivers.
4.2. Trend of Mangrove Habitat Shifts
Previous reviews have shown that mangroves are expanding in response to global climate change at many studied sites [58,59,60,61,62]. Our study indicated that the extent of suitable mangrove habitats at the northernmost distribution in China would also expand under two climate change scenarios with a poleward shifting distance of ~1° in latitude by the 2050s, which is consistent with Record et al.’s (2013) model predictions in which mangroves would continue to expand as temperature and atmospheric CO2 concentrations increase. Furthermore, the habitat distribution range would shift poleward by 2° [15,61]. On the east coast of Florida in North America, mangrove areas doubled at the northern end of the range in the 1980s [59]. The mangroves in Tanzania are predicted to expand by more than 40% in climate change scenarios [30]. However, this trend may vary across different geographic regions. For example, the projected habitat suitability was reduced by 30% in Vietnam [29]. Our study also revealed varied trends at different sites on a smaller landscape scale. These differences may be caused by diverse local constraints, including temperature increase, seasonal variation in precipitation and temperature, sea level rise, and local anthropogenic pressures and impacts [62,63].
In addition to habitat shifting, species composition may change, although this aspect was not included in the present study. On a global scale, Central America and the Caribbean are predicted to lose more mangrove species than other regions [15]. Historical records of 27 mangrove forest ecoregions indicated that the shift rate of mangrove species growing in seaward habitat zones was higher than that in the intermediate and landward zones [55]. In our study region, there are seven mangrove species, among which only K. candel has adapted to the mean temperature of the coldest month, which is less than 11 °C [64]; thus, it can show a habitat shift to northern Fujian. Since mangroves are thermophilic plants, temperature warming profits the expansion of mangrove distribution, and more species could show a habitat shift to Fujian Province [65]. In addition, modeling studies of mangroves in Hainan Province showed that the mangrove habitats would not suffer loss at sea level rise rates of 4–16 mm yr−1; however, mangrove species zonation would alter along the elevation gradient by moving from a lower intertidal zone to a higher intertidal zone [9,66].
4.3. Coastal Land Usage Influence and Study Uncertainty
Considering climate change alone, mangroves are expected to increase in most areas. However, mangroves in low-lying islands and constrained intertidal areas may disappear [60]. Along the coastline, mangrove habitats may be squeezed between human land use on the landward side and rising sea levels on the seaward side, which is one of their major threats [67,68]. Unfortunately, due to the high population density in coastal areas, extensive modifications have been adopted to accommodate anthropogenic activities, such as aquaculture, cultivation, and urban development [10,69,70]. In China, due to the past land resource shortages and economic development, coastal reclamation has caused a huge loss of mangroves before 2000 [12].
Suitable habitats for mangroves in the future are mainly determined by the availability of accommodation spaces. A global study indicated that if sufficient additional accommodation space can be created through careful coastal management and restricting the building of anthropogenic infrastructure in the coastal zone, coastal wetland loss might be avoidable [71]. In 2018, China’s State Council strengthened the protection of coastal wetlands by introducing a strict policy to control reclamation [72]. In 2020, a special action plan for mangrove protection and restoration (2020–2025) was ignited [73]. The present study provides management directions for future mangrove conservation and restoration by revealing the difficulty of mangroves moving landward in the future if the land-use pattern is not optimized. Under SSP1-2.6 and SSP5-8.5, 40–44% of mangrove patches were adjacent to aquaculture ponds as well as cultivated and artificial land. The limitations of landward margins may result in waterlogging, eventually leading to the drowning of existing mangrove forests [74]. To reduce mangrove ecosystem vulnerability in the future, adaptation management can be improved by reducing non-climatic stressors in coastal areas [75]. For instance, some developed lands that may hinder the expansion of mangroves could be restored to natural wetlands, thereby creating available space for mangrove migration.
In this study, we proposed a refining procedure using high-resolution land-use data to improve MaxEnt predictions. We found that the results before and after refining differed, indicating that low-resolution models may be effective in trend prediction. Still, the exact area produced by them may not be meaningful. According to the 2005 forestry survey records, the suitable mangrove habitats in Fujian were 13,145.6 ha [76]. Compared to the overprediction of the original model output, the refined result better matches the field investigation results, indicating the suitable performance of this approach. Nevertheless, some uncertainty still taints the prediction of the actual habitat extent. First, the accuracy of the prediction depends on the CMIP6 data set. Although, for now, it is the best data we can obtain, and with the update of coupled model intercomparison project data in the next decade, the predicted results may change. Second, we found that the species distribution model at a 1 km resolution cannot accurately simulate the impact of sea level rise. The underlying reason might be that the predicted sea level rise was only 40–150 mm by 2050; thus, the impact on habitat may occur within a scale far less than 1 km. Combining an independent sea level impact model at high resolution may help increase prediction accuracy [29]. In addition, we conducted the refining process using 2020 land cover data, assuming that the land-use pattern would be stable until the 2050s. Nonetheless, land-use patterns could be dynamic because the coastal area is expected to develop and change. Therefore, coupling land use and climate change could provide more reasonable prospects for mangrove distribution and obtain more reliable simulations [77].
5. Conclusions
Collectively, our study assessed the northernmost mangroves in China’s climate change vulnerability and incorporated land-use types to refine potentially suitable area predictions. In the study region, mangroves would expand under climate change with northward moving distances of approximately 23 and 114 km under SSP1-2.6 and SSP5-8.5, respectively. Suitable habitat expansion was concentrated between 23.5° N and 24.5° N. However, aquaculture ponds, cultivated, and artificial land would possibly restrict mangrove landward expansion. For areas where mangrove habitat degradation is predicted, coastal wetland loss caused by development activities should be prevented, and climate adaptation management should be emphasized. Our predictions could help future mangrove restoration site selection and assess the ecological and economic benefits of mangroves afforestation to alternative land uses [78].
Author Contributions
Conceptualization, Y.W. and W.H.; Methodology, Y.W., P.D., W.H. and G.C.; Resources, G.L.; Software, P.D. and D.Z.; Writing—original draft, Y.W. and W.H.; Writing—review and editing, B.C. All authors have read and agreed to the published version of the manuscript.
Funding
The project was supported by the Fund of Fujian Provincial Key Laboratory of Marine Ecological Conservation and Restoration (MECR EPR2020005), the National Key Research and Development Program of China (2019YFE0124700), the National Natural Science Foundation of China (41906127, 42076163), the Provincial Natural Science Foundation of Fujian (2020J05078), and the China–ASEAN Maritime Cooperation Fund “Monitoring and Conservation of the Coastal Ecosystem in the South China Sea” (HX01-190701) and “Marine Protected Areas Network in China–ASEAN Countries” (HX04-210901).
Acknowledgments
We acknowledge the World Climate Research Programme, which, through its Working Group on Coupled Modelling, coordinated and promoted CMIP6. We thank the climate modeling groups for producing and making available their model outputs, the Earth System Grid Federation (ESGF) for archiving the data and providing access, and the multiple funding agencies who support CMIP6 and ESGF. We also acknowledge the data support from the National Earth System Science Data Center, the National Science and Technology Infrastructure of China (http://www.geodata.cn accessed on 28 July 2021).
Conflicts of Interest
The authors declare no conflict of interest.
References
- Buelow, C.; Sheaves, M. A Birds-Eye View of Biological Connectivity in Mangrove Systems. Estuar. Coast. Shelf Sci. 2015, 152, 33–43. [Google Scholar] [CrossRef]
- Zhang, Y.; Ding, Y.; Wang, W.; Li, Y.; Wang, M. Distribution of Fish among Avicennia and Sonneratia Microhabitats in a Tropical Mangrove Ecosystem in South China. Ecosphere 2019, 10, 02759. [Google Scholar] [CrossRef] [Green Version]
- Rogers, K.; Saintilan, N.; Mazumder, D.; Kelleway, J.J. Mangrove Dynamics and Blue Carbon Sequestration. Biol. Lett. 2019, 15, 20180471. [Google Scholar] [CrossRef] [PubMed] [Green Version]
- Kelleway, J.J.; Cavanaugh, K.; Rogers, K.; Feller, I.C.; Ens, E.; Doughty, C.; Saintilan, N. Review of the Ecosystem Service Implications of Mangrove Encroachment into Salt Marshes. Glob. Change Biol. 2017, 23, 3967–3983. [Google Scholar] [CrossRef]
- Dasgupta, S.; Islam, M.S.; Huq, M.; Khan, Z.H.; Hasib, M.R. Quantifying the Protective Capacity of Mangroves from Storm Surges in Coastal Bangladesh. PLoS ONE 2019, 14, e0214079. [Google Scholar] [CrossRef]
- Alongi, D.M. Present State and Future of the World’s Mangrove Forests. Environ. Conserv. 2002, 29, 331–349. [Google Scholar] [CrossRef] [Green Version]
- Romañach, S.S.; DeAngelis, D.L.; Koh, H.L.; Li, Y.; Teh, S.Y.; Barizan, R.S.R.; Zhai, L. Conservation and Restoration of Mangroves: Global Status, Perspectives, and Prognosis. Ocean. Coast. Manag. 2018, 154, 72–82. [Google Scholar] [CrossRef]
- Alongi, D.M. Mangrove Forests: Resilience, Protection from Tsunamis, and Responses to Global Climate Change. Estuar. Coast. Shelf Sci. 2008, 76, 1–13. [Google Scholar] [CrossRef]
- Saintilan, N.; Khan, N.S.; Ashe, E.; Kelleway, J.J.; Rogers, K.; Woodroffe, C.D.; Horton, B.P. Thresholds of Mangrove Survival under Rapid Sea Level Rise. Science 2020, 368, 1118–1121. [Google Scholar] [CrossRef] [PubMed]
- Ai, B.; Ma, C.; Zhao, J.; Zhang, R. The Impact of Rapid Urban Expansion on Coastal Mangroves: A Case Study in Guangdong Province, China. Front. Earth Sci. 2020, 14, 37–49. [Google Scholar] [CrossRef]
- Hu, W.; Wang, Y.; Zhang, D.; Yu, W.; Chen, G.; Xie, T.; Liu, Z.; Ma, Z.; Du, J.; Chao, B.; et al. Mapping the Potential of Mangrove Forest Restoration Based on Species Distribution Models: A Case Study in China. Sci. Total Environ. 2020, 748, 142321. [Google Scholar] [CrossRef] [PubMed]
- Jia, M.; Wang, Z.; Zhang, Y.; Mao, D.; Wang, C. Monitoring Loss and Recovery of Mangrove Forests During 42 Years: The Achievements of Mangrove Conservation in China. Int. J. Appl. Earth Obs. Geoinf. 2018, 73, 535–545. [Google Scholar] [CrossRef]
- IPCC. Climate Change 2021: The Physical Science Basis. Contribution of Working Group I to the Sixth Assessment Report of the Intergovernmental Panel on Climate Change 2021; Summary for Policymakers, IPCC: Geneva, Switzerland, 2021. [Google Scholar]
- Osland, J.M.; Day, R.H.; Hall, C.T.; Brumfield, M.D.; Dugas, J.L.; Jones, W.R. Mangrove Expansion and Contraction at a Poleward Range Limit: Climate Extremes and Land-Ocean Temperature Gradients. Ecology 2017, 98, 125–137. [Google Scholar] [CrossRef] [PubMed]
- Record, S.; Charney, N.D.; Zakaria, R.M.; Ellison, A.M. Projecting Global Mangrove Species and Community Distributions under Climate Change. Ecosphere 2013, 4, 34. [Google Scholar] [CrossRef]
- Osland, J.M.; Feher, L.C.; Griffith, K.T.; Cavanaugh, K.C.; Enwright, N.M.; Day, R.H.; Stagg, C.L.; Krauss, K.W.; Howard, R.J.; Grace, J.B.; et al. Climatic Controls on the Global Distribution, Abundance, and Species Richness of Mangrove Forests. Ecol. Monogr. 2017, 87, 341–359. [Google Scholar] [CrossRef] [Green Version]
- Cavanaugh, C.K.; Osland, M.J.; Bardou, R.; Hinojosa-Arango, G.; Lopez-Vivas, J.M.; Parker, J.D.; Rovai, A.S. Sensitivity of Mangrove Range Limits to Climate Variability. Glob. Ecol. Biogeogr. 2018, 27, 925–935. [Google Scholar] [CrossRef] [Green Version]
- Wang, Q.W.; Wang, M. The Mangroves of China; Science Press: Beijing, China, 2007. [Google Scholar]
- IUCN. Global Assessments of Mangrove Losses and Degradation. 2016. Available online: https://www.iucn.org/sites/dev/files/content/documents/mangroveloss-brief-4pp-19.10.low.pdf (accessed on 1 June 2021).
- Center, National Marine Information. Blue Book on Marine Climate Change in China 2020; Science Press: Beijing, China, 2021. [Google Scholar]
- Ministry of Natural Resources, PRC. 2020 China Sea Level Bulletin; 2021. Available online: http://www.panjin.gov.cn:803/uploadfile/files/20210518134919655.pdf (accessed on 1 June 2021).
- Ma, Z.; Melville, D.S.; Liu, J.; Chen, Y.; Yang, H.; Ren, W.; Zhang, Z.; Piersma, T.; Li, B. Rethinking China’s New Great Wall. Science 2014, 346, 912–914. [Google Scholar] [CrossRef] [Green Version]
- Hangqing, F.; Guangzhao, L. Effect of Sea Dike on the Quantity, Community Characteristics and Restoration of Mangrove Forest Along Guangxi Coast. Chin. J. Appl. Ecol. 1997, 8, 240–244. [Google Scholar]
- Phillips, J.S.; Anderson, R.P.; Schapire, R.E. Maximum Entropy Modeling of Species Geographic Distributions. Ecol. Model. 2006, 190, 231–259. [Google Scholar] [CrossRef] [Green Version]
- Elith, J.; Phillips, S.J.; Hastie, T.; Dudík, M.; Chee, Y.E.; Yates, C.J. A Statistical Explanation of Maxent for Ecologists. Divers. Distrib. 2011, 17, 43–57. [Google Scholar] [CrossRef]
- Elith, J.; Graham, C.H.; Anderson, R.P.; Dudík, M.; Ferrier, S.; Guisan, A.; Hijmans, R.J.; Huettmann, F.; Leathwick, J.R.; Lehmann, A.; et al. Novel Methods Improve Prediction of Species’ Distributions from Occurrence Data. Ecography 2006, 29, 129–151. [Google Scholar] [CrossRef] [Green Version]
- Tang, X.; Yuan, Y.; Li, X.; Zhang, J. Maximum Entropy Modeling to Predict the Impact of Climate Change on Pine Wilt Disease in China. Front. Plant. Sci. 2021, 12, 652500. [Google Scholar] [CrossRef] [PubMed]
- Hausfather, Z.; Drake, H.F.; Abbott, T.; Schmidt, G.A. Evaluating the Performance of Past Climate Model Projections. Geophys. Res. Lett. 2020, 47, e2019GL085378. [Google Scholar] [CrossRef]
- Dang, N.A.T.; Kumar, L.; Reid, M.; Anh, L.N.T. Modelling the Susceptibility of Wetland Plant Species under Climate Change in the Mekong Delta, Vietnam. Ecol. Inform. 2021, 64, 101358. [Google Scholar] [CrossRef]
- John, E.; Bunting, P.; Hardy, A.; Roberts, O.; Giliba, R.; Silayo, D.S. Modelling the Impact of Climate Change on Tanzanian Forests. Divers. Distrib. 2020, 26, 1663–1686. [Google Scholar] [CrossRef]
- Jayasinghe, L.S.; Kumar, L. Modeling the Climate Suitability of Tea [Camellia sinensis (L.) O. Kuntze] in Sri Lanka in Response to Current and Future Climate Change Scenarios. Agric. For. Meteorol. 2019, 272–273, 102–117. [Google Scholar] [CrossRef]
- Zhou, Y.; Zhang, Z.; Zhu, B.; Cheng, X.; Yang, L.; Gao, M.; Kong, R. Maxent Modeling Based on Cmip6 Models to Project Potential Suitable Zones for Cunninghamia Lanceolata in China. Forests 2021, 12, 752. [Google Scholar] [CrossRef]
- Hu, W.; Chao, B.; Wang, Y.; Dong, P.; Zhang, D.; Yu, W.; Chen, G.; Chen, B. Assessing the Potential Distributions of Mangrove Forests in Fujian Province Using Maxent Model. China Environ. Sci. 2020, 40, 4029–4038. [Google Scholar]
- Fujian Meteorological Administration. Fujian Climate Bulletin. Available online: http://www.weather.com.cn/fujian/zxfw/qhgb/index.shtml (accessed on 7 December 2021).
- Chen, L.; Zheng, W.; Yang, S.; Wang, W.; Zhang, Y. Research Progresses of Mangrove Cold-Tolerant Classes and Seral Classes, and Their Responses to Climate Change. J. Xiamen Univ. Nat. Sci. 2017, 56, 305–313. [Google Scholar]
- Chen, L.; Wang, W.; Li, Q.Q.; Zhang, Y.; Yang, S.; Osland, M.J.; Huang, J.; Peng, C. Mangrove Species’ Responses to Winter Air Temperature Extremes in China. Ecosphere 2017, 8, 01865. [Google Scholar] [CrossRef]
- Ximenes, A.C.; Maeda, E.E.; Arcoverde, G.F.B.; Dahdouh-Guebas, F. Spatial Assessment of the Bioclimatic and Environmental Factors Driving Mangrove Tree Species’ Distribution along the Brazilian Coastline. Remote Sens. 2016, 8, 451. [Google Scholar] [CrossRef] [Green Version]
- Ward, D.R.; Friess, D.A.; Day, R.H.; A, R. MacKenzie. Impacts of Climate Change on Mangrove Ecosystems: A Region by Region Overview. Ecosyst. Health Sustain. 2016, 2, e01211. [Google Scholar] [CrossRef] [Green Version]
- Fick, E.S.; Hijmans, R.J. Worldclim 2: New 1-Km Spatial Resolution Climate Surfaces for Global Land Areas. Int. J. Climatol. 2017, 37, 4302–4315. [Google Scholar] [CrossRef]
- Tabor, K.; Williams, J.W. Globally Downscaled Climate Projections for Assessing the Conservation Impacts of Climate Change. Ecol. Appl. 2010, 20, 554–565. [Google Scholar] [CrossRef] [PubMed] [Green Version]
- Tyberghein, L.; Verbruggen, H.; Pauly, K.; Troupin, C.; Mineur, F.; de Clerck, O. Bio-Oracle: A Global Environmental Dataset for Marine Species Distribution Modelling. Glob. Ecol. Biogeogr. 2012, 21, 272–281. [Google Scholar] [CrossRef]
- Assis, J.; Tyberghein, L.; Bosch, S.; Verbruggen, H.; Serrão, E.A.; de Clerck, O. Bio-Oracle V2.0: Extending Marine Data Layers for Bioclimatic Modelling. Glob. Ecol. Biogeogr. 2018, 27, 277–284. [Google Scholar] [CrossRef]
- Ren, C.; Wang, Z.; Zhang, Y.; Zhang, B.; Chen, L.; Xi, Y.; Xiao, X.; Doughty, R.B.; Liu, M.; Jia, M.; et al. Rapid Expansion of Coastal Aquaculture Ponds in China from Landsat Observations during 1984–2016. Int. J. Appl. Earth Obs. Geoinf. 2019, 82, 101902. [Google Scholar] [CrossRef]
- Mao, D.; Wang, Z.; Du, B.; Li, L.; Tian, Y.; Jia, M.; Zeng, Y.; Song, K.; Jiang, M.; Wang, Y. National Wetland Mapping in China: A New Product Resulting from Object-Based and Hierarchical Classification of Landsat 8 Oli Images. ISPRS J. Photogramm. Remote Sens. 2020, 164, 11–25. [Google Scholar] [CrossRef]
- Feng, X.; Park, D.S.; Liang, Y.; Pandey, R.; Papeş, M. Collinearity in Ecological Niche Modeling: Confusions and Challenges. Ecol. Evol. 2019, 9, 10365–10376. [Google Scholar] [CrossRef] [Green Version]
- Muscarella, R.; Galante, P.J.; Soley-Guardia, M.; Boria, R.A.; Kass, J.M.; Uriarte, M.; Anderson, R.P. Enmeval: An R Package for Conducting Spatially Independent Evaluations and Estimating Optimal Model Complexity for Maxent Ecological Niche Models. Methods Ecol. Evol. 2014, 5, 1198–1205. [Google Scholar] [CrossRef]
- Jamwal, S.P.; di Febbraro, M.; Carranza, M.L.; Savage, M.; Loy, A. Global Change on the Roof of the World: Vulnerability of Himalayan Otter Species to Land Use and Climate Alterations. Divers. Distrib. 2021, 1–15. [Google Scholar] [CrossRef]
- Thuiller, W.; Richardson, D.M.; Rouget, M.; Procheş, Ş.; Wilson, J.R.U. Interactions between Environment, Species Traits, and Human Uses Describe Patterns of Plant Invasions. Ecology 2006, 87, 1755–1769. [Google Scholar] [CrossRef]
- Udyawer, V.; Somaweera, R.; Nitschke, C.; d’Anastasi, B.; Sanders, K.; Webber, B.L.; Hourston, M.; Heupel, M.R. Prioritising Search Effort to Locate Previously Unknown Populations of Endangered Marine Reptiles. Glob. Ecol. Conserv. 2020, 22, e01013. [Google Scholar] [CrossRef]
- Chen, J.; Ban, Y.; Li, S. Open Access to Earth Land-Cover Map. Nature 2014, 514, 434. [Google Scholar]
- Friess, A.D.; Krauss, K.W.; Horstman, E.M.; Balke, T.; Bouma, T.J.; Galli, D.; Webb, L.E. Are All Intertidal Wetlands Naturally Created Equal? Bottlenecks, Thresholds and Knowledge Gaps to Mangrove and Saltmarsh Ecosystems. Biol. Rev. 2012, 87, 346–366. [Google Scholar] [CrossRef]
- Feng, Z.; Tan, G.; Xia, J.; Shu, C.; Chen, P.; Wu, M.; Wu, X. Dynamics of Mangrove Forests in Shenzhen Bay in Response to Natural and Anthropogenic Factors from 1988 to 2017. J. Hydrol. 2020, 591, 125271. [Google Scholar] [CrossRef]
- McKee, L.K.; Cahoon, D.R.; Feller, I.C. Caribbean Mangroves Adjust to Rising Sea Level through Biotic Controls on Change in Soil Elevation. Glob. Ecol. Biogeogr. 2007, 16, 545–556. [Google Scholar] [CrossRef]
- Krauss, W.K.; Mckee, K.L.; Lovelock, C.E.; Cahoon, D.R.; Neil, S.; Ruth, R.; Luzhen, C. How Mangrove Forests Adjust to Rising Sea Level. New Phytol. 2014, 202, 19–34. [Google Scholar] [CrossRef] [Green Version]
- Fazlioglu, F.; Wan, J.S.H.; Chen, L.Z. Latitudinal Shifts in Mangrove Species Worldwide: Evidence from Historical Occurrence Records. Hydrobiologia 2020, 847, 4111–4123. [Google Scholar] [CrossRef]
- Saenger, P. Mangrove Ecology, Silviculture and Conservation; Springer: Dordrecht, The Netherlands, 2012. [Google Scholar]
- Peng, L.; Ruichi, S.; Changyi, L. The Characteristics of Chilling-Resistance on Six Mangrove Plants. J. Xiamen Univ. 1994, 33, 249–252. [Google Scholar]
- Saintilan, N.; Wilson, N.C.; Rogers, K.; Rajkaran, A.; Krauss, K.W. Mangrove Expansion and Salt Marsh Decline at Mangrove Poleward Limits. Glob. Change Biol. 2014, 20, 147–157. [Google Scholar] [CrossRef] [Green Version]
- Cavanaugh, C.K.; Kellner, J.R.; Forde, A.J.; Gruner, D.S.; Parker, J.D.; Rodriguez, W.; Feller, I.C. Poleward Expansion of Mangroves Is a Threshold Response to Decreased Frequency of Extreme Cold Events. Proc. Natl. Acad. Sci. USA 2014, 111, 723–727. [Google Scholar] [CrossRef] [Green Version]
- Godoy, D.M.; de Lacerda, L.D. Mangroves Response to Climate Change: A Review of Recent Findings on Mangrove Extension and Distribution. An. Acad Bras. Cienc. 2015, 87, 651–667. [Google Scholar] [CrossRef] [PubMed] [Green Version]
- Alongi, D.M. The Impact of Climate Change on Mangrove Forests. Curr. Clim. Change Rep. 2015, 1, 30–39. [Google Scholar] [CrossRef]
- Hickey, M.S.; Phinn, S.R.; Callow, N.J.; van Niel, K.P.; Hansen, J.E.; Duarte, C.M. Is Climate Change Shifting the Poleward Limit of Mangroves? Estuaries Coasts 2017, 40, 215–226. [Google Scholar] [CrossRef]
- Yiming, L.; Peng, L. The Status and Conservation of the Mangrove Resources in Fujian. Ecol. Econ. 1999, 16, 16–19. [Google Scholar]
- Liao, B.; Zhang, Q. Area, Distribution and Species Composition of Mangroves in China. Wetland Sci. 2014, 12, 435–440. [Google Scholar]
- Xiaoyong, C.; Peng, L. Responses and Roles of Mangroves in China to Global Climate Changes. Trans. Oceanol. Limnol. 1999, 2, 11–17. [Google Scholar]
- Fu, H.; Wang, W.; Ma, W.; Wang, M. Differential in Surface Elevation Change across Mangrove Forests in the Intertidal Zone. Estuar. Coast. Shelf Sci. 2018, 207, 203–208. [Google Scholar] [CrossRef]
- Laurance, F.W.; Dell, B.; Turton, S.M.; Lawes, M.J.; Hutley, L.B.; McCallum, H.; Dale, P.; Bird, M.; Hardy, G.; Prideaux, G.; et al. The 10 Australian Ecosystems Most Vulnerable to Tipping Points. Biol. Conserv. 2011, 144, 1472–1480. [Google Scholar] [CrossRef]
- Fu, H.; Zhang, Y.; Ao, X.; Wang, W.; Wang, M. High Surface Elevation Gains and Prediction of Mangrove Responses to Sea-Level Rise Based on Dynamic Surface Elevation Changes at Dongzhaigang Bay, China. Geomorphology 2019, 334, 194–202. [Google Scholar] [CrossRef]
- Quader, A.M.; Agrawal, S.; Kervyn, M. Multi-Decadal Land Cover Evolution in the Sundarban, the Largest Mangrove Forest in the World. Ocean. Coast. Manag. 2017, 139, 113–124. [Google Scholar] [CrossRef]
- Tuholske, C.; Tane, Z.; López-Carr, D.; Roberts, D.; Cassels, S. Thirty Years of Land Use/Cover Change in the Caribbean: Assessing the Relationship between Urbanization and Mangrove Loss in Roatán, Honduras. Appl. Geogr. 2017, 88, 84–93. [Google Scholar] [CrossRef]
- Schuerch, M.; Spencer, T.; Temmerman, S.; Kirwan, M.L.; Wolff, C.; Lincke, D.; McOwen, C.J.; Pickering, M.D.; Reef, R.; Vafeidis, A.T.; et al. Future Response of Global Coastal Wetlands to Sea-Level Rise. Nature 2018, 561, 231–234. [Google Scholar] [CrossRef] [PubMed]
- The State Council. Circular of the State Council on Strengthening the Protection of Coastal Wetlands and Strictly Regulating Sea Enclosure and Reclamation; 2018. Available online: http://www.gov.cn/zhengce/content/2018-07/25/content_5309058.htm (accessed on 1 June 2021).
- National Development and Reform Commission and Ministry of Natural Resources, PRC. National Master Plan for Major Ecosystem Protection and Restoration Projects (2021–2035); 2020. Available online: http://www.gov.cn/zhengce/zhengceku/2020-08/29/content_5538354.htm (accessed on 1 June 2021).
- Jagtap, G.T.; Nagle, V.L. Response and Adaptability of Mangrove Habitats from the Indian Subcontinent to Changing Climate. Ambio 2007, 36, 328–334. [Google Scholar] [CrossRef]
- Ellison, C.J.; Zouh, I. Vulnerability to Climate Change of Mangroves: Assessment from Cameroon, Central Africa. Biology 2012, 1, 617–638. [Google Scholar] [CrossRef] [Green Version]
- Zhang, Z. Studies on Ecosystem Function and Development of Mangrove in Fujian. Master’s Thesis, Fujian Agriculture and Forestry University, Fuzhou, China, 2007. [Google Scholar]
- Wang, Y.; Chao, B.; Dong, P.; Zhang, D.; Yu, W.; Hu, W.; Ma, Z.; Chen, G.; Liu, Z.; Chen, B. Simulating Spatial Change of Mangrove Habitat under the Impact of Coastal Land Use: Coupling Maxent and Dyna-Clue Models. Sci. Total Environ. 2021, 788, 147914. [Google Scholar] [CrossRef]
- Lee, Y.S.; Hamilton, S.; Barbier, E.B.; Primavera, J.; Lewis, R.R. Better Restoration Policies Are Needed to Conserve Mangrove Ecosystems. Nat. Ecol. Evol. 2019, 3, 70–72. [Google Scholar] [CrossRef]


Publisher’s Note: MDPI stays neutral with regard to jurisdictional claims in published maps and institutional affiliations. |
© 2022 by the authors. Licensee MDPI, Basel, Switzerland. This article is an open access article distributed under the terms and conditions of the Creative Commons Attribution (CC BY) license (https://creativecommons.org/licenses/by/4.0/).