Abstract
Forest utilization makes a significant economic contribution to the livelihoods of rural households, especially those living in developing countries. This study was conducted to determine the absolute and relative forest income and measure the distributional impact of forest income on economic inequalities among rural households in the Rubi-Tele Hunting Domain (RTHD), Democratic Republic of the Congo (DR Congo). Household socioeconomic data and other qualitative informations were collected using structured household-level surveys, focus group discussions, and key informant interviews. The study used descriptive statistical analysis, Gini coefficient, and Lorenz curve computation. Additionally, the non-parametric alternative Kruskal–Wallis Test was also used. Findings revealed that 89.76% of the households’ sample were involved in forest-based activities. The annual average income from these forest-based activities was estimated at CDF 1,219,951.58 (USD 659.08) per household, contributing 32.46% to total annual household income. Other income sources share constituted 37.09%, 10.04%, 8.30%, 7.63%, 2.41%, and 2.08% from crop, livestock keeping, business activities, fishing, and non-forest environmental activities, paid employment, and other income sources, respectively. There was a significant difference between annual household income in terms of income sources (p < 0.5). Forest income constituted the second most crucial income portfolio after crop income. Bushmeat income share was higher than other forest products income share. However, the proportion of households involved in firewood extraction was substantial (80.70%). Gini coefficient and Lorenz curve analysis proved that forest income helped reduce economic inequality among the sampled households by 11%. Therefore, reducing access to forest would significantly impact rural households’ welfare and could increase income disparities. The present study provides valuable information for developing sustainable forest management policies and strategies to maintain and enhance the economic benefit of forest use without damaging biodiversity conservation.
1. Introduction
Natural forests are an essential component of Earth’s ecosystems and an integral part of rural livelihoods, especially in underdeveloped economies. In rural areas of less developed countries, indigenous communities still lack modern amenities and livelihood opportunities. Thus, forest use is a significant contributor to household cash income and sustenance [1]. Theoretical arguments and empirical findings frequently appear in the academic literature supporting the forest-led poverty alleviation school of thought and those advocating the fundamental role of forests in poverty reduction [2]. Recently, research has been focused on understanding and quantifying the economic contribution that forest resources make to the millions of rural households who live near forests [3,4,5,6,7,8,9,10].
The role of forests in rural livelihoods is significant globally, with an estimated 1 billion out of 1.2 billion extremely poor households depending on forest resources [11,12]. About 350 million people live inside or close to dense forests, and they largely depend on these forests for subsistence and income [11]. Forest resources offer critical and principal support to people’s livelihoods and the national economy [12]. Local communities depend on forest resources for various products such as fuelwood, construction materials, medicine, and food [13,14]. Nevertheless, not just the world’s poor who depend on forests. Indeed, rural people across the developing world generally derive a wide range of benefits from forests [5,10,15,16,17]. Forests contribute to rural livelihoods by serving as safety nets and insurance against risks and shocks [18,19,20,21,22]; as seasonal income gap-fillers in periods of low agricultural income and seasonal shortfalls (i.e., natural insurance) [2,5,10,21,23]; in poverty reduction and elimination [24,25]; and economic wellbeing [26,27,28].
In the last decade, forest-related income in household economies and rural development has received increasing attention from the international community. This is largely in recognition of the significant relationship between forest areas and poverty [17,29,30], and the emerging knowledge that forests could have a far more significant role in meeting the Millennium Development Goal’s poverty alleviation targets [22,30]. Hence, governments, international donors, and Non-Governmental Organizations (NGOs) are increasingly looking to the forestry sector for solutions to reduce poverty [31]. Therefore, empirical knowledge about forest-related income in household economies and rural development is still needed in this regard. Considering that forest income helps reduce income inequality and contributes to households’ food security [32], the success or failure to preserve and sustainably manage these forests will have significant consequences for millions of people dependent on them [1,33].
In the Congo Basin, people live in and around national parks and other protected forest landscapes and depend on those ecosystems [20,34,35,36,37]. Income estimation for people whose livelihoods depend on forests is central to understanding their wellbeing and the use of forests [38]. The analysis of forest resources used by forest dwellers can provide relevant insights to their management and design of effective development and conservation strategies [2,6,18,20,39,40,41,42,43]. For almost all forested and protected areas in the Congo Basin, scientific information remains qualitative, or where some quantitative information is provided, the overall income status of the forest-dependent households are rarely provided [34,35,37,43].
The forest of the DR Congo accounts for sixty percent (60%) of Congo Basin forests and forty-seven percent (47%) of Africa’s forests. It is, therefore, a real ”global lung” after the Amazon [44,45]. Indeed, DR Congo’s forest is considered as an essential reservoir of biodiversity. It is a vital resource for humans [46] since more than 70% of the population depends directly on it. However, the role of forest income in household livelihood is still unclear due to a lack of empirical data and research studies [18].
Meanwhile, research on environmental income has gained momentum, and a large share of relevant literature focuses on forests. Studies from Africa, Asia, and Latin America have found that forest and non-forest environmental income contribute significantly to livelihoods in most rural settings. In Malawi, it has been revealed that forest income contributes 15% to the total household income, and it has a critical income equalizing effect across rural households [2,47]. In South Africa, forest resources have prevented people from slipping into deeper poverty [48]. Forests products are key in enhancing the livelihood security of the poorest members of society, forming an important safety net, and raising household incomes to levels equivalent to the broader population [49,50]. Therefore, valuable information on forest resources’ role in livelihoods could be applied in developing forest conservation policies for enhanced ecosystem services and livelihoods [51].
Based on a comparative analysis of approximately 8000 households in 24 developing countries, environmental income accounts for 28% of total household income, and the poor relied more on subsistence products [52]. Some scholars have addressed conceptual discussions of forests’ role and their potential livelihood contributions [10,20,53,54,55]. Results from a meta-analysis of 51 case studies from 17 countries and other studies revealed that forest environmental income represented an average of 22% of the total income [9]. As such, other scholars emphasized that Non-Timber Forest Products (NTFPs) constitute a great income source and have a strong equalizing effect [56,57]. Results from the Gini coefficient and Lorenz curve analysis proved that supplemental forest income helps reduce economic inequality, and it is an essential part of poor rural households’ livelihoods strategies [58,59,60,61,62].
In Northern Ethiopia, income from forest environmental sources occupies the second-largest share in average total household income, next to crop income. It significantly reduces measured rural poverty and income inequality [63]. Other studies have found that the proportion of forest income to total household income ranged from 32% to 33%, while wood fuel constituted the largest income share to forest income [64,65]. In the Bolivian Amazon, forest income was highly related to cash income from Brazil nuts [66]. Other scholars have stressed the importance of forest income but noted that conservation measures might increase poverty unless additional measures are introduced to combat poverty [26,67]. In Bangladesh, local communities gather many NTFPs from national parks despite the official restrictions [68]. This shows that forest-related income remains important to households at all income levels, although lower-income households are more dependent due to a lack of other alternative sources [4,69].
These findings highlight the need for conservation and development projects to consider the role of forest resources in rural households’ economy and livelihoods, rather than relying on assumptions that poverty and forests are always linked. Most of the Congolese rural population depends on the forest for their daily lives. They derive most of their protein, medicines, energy, materials, and income from the forest [24]. These products provide employment opportunities, generate income through various informal sectors, and occupy an important cultural organization [70,71,72]. Of note, wood fuel revenues, especially charcoal, contribute substantially to household income. This contribution ranges from 12% for fuelwood producers around Kisangani to 75% for charcoal producers around Kinshasa, which helps in poverty reduction [73]. NTFPs often represent, in the eyes of local populations, the most obvious manifestation of the value of the forest as a natural source of capital [74]. To address the risk of unsustainable exploitation of those products, some researchers have suggested management approaches designed to help conserve natural resources without compromising rural communities’ health and income security [74].
The DR Congo’s protected areas cover about 11% of the national territory (9 national parks and about sixty hunting domains and reserves). It includes diversified landscapes, from upland forests, thick and wet, to savannah areas, and contains five world heritage sites. The economy based on forest products collection, on which more than 70% of the Congolese population depends, is never considered a spontaneous solution to poverty in the DR Congo. This vital sector for the national economy is almost ignored. Research about the role of forest income in household livelihoods has gained momentum [6,27,43]. However, only few empirical studies on this issue have been conducted in the DR Congo. Meanwhile, RTHD is one of DR Congo’s protected areas, located in the northeast where rural people live. Challenges to managing this protected area are important: lack of partner support, low funding, and insufficient human resources [75]. However, the fundamental role of these forest resources in sustaining the basic needs of those people, mainly through the informal sector, the extraction of NTFPs, and their contribution to poverty alleviation strategy cannot be ignored [76]. Nevertheless, there are some empirical researches related to the economic contribution of environmental resources to rural livelihoods in the DR Congo. However, in the RTHD, there is a substantial gap in understanding the actual impact of forest use on rural economy and livelihoods, the functioning of rural economies, and the extent of rural poverty and inequality. Assessing the economic contribution of forest use to rural livelihoods is critical for understanding the people living conditions and designing effective development and conservation strategies in this protected area [4,16,20,27,77].
This study, therefore, attempts to fill this gap by evaluating and providing empirical evidence on the economic contribution of forest use to livelihoods for the communities surrounding the RTHD. The present study had two main objectives: (1) to assess the absolute and relative contribution of forest-related income to rural households’ economy, and (2) to measure the distributional impact of forest income on economic inequalities among rural households.
2. Materials and Methods
2.1. Study Area and Sampling
This study was carried out in the RTHD located in the Bas-Uélé Province in DR Congo (Figure 1). This province covers an area of 148,331.00 km², and it is located in the Northern part of the country, on the borders of South Sudan and the Central African Republic. The RTHD was created between the Rubi and Tele rivers by the Order N°51/Agri./12 December, 1930, and modified by the Order N°64/ Agri./28 November, 1932 [78]. This protected area was created as a "Hunting reserve", just six years after Virunga National Park, and it represents one of the first protected areas in DR Congo with an area of over 8000.00 km2. According to the World Database on Protected Areas (WCMC, UNEP), the RTHD covers a land area of 9080.00 km2. The primary management measure applicable to this area is a ban on hunting specified in Article 2 of the Legal Act of 1930. Moreover, additional provisions allowing the ban on hunting to be lifted for certain species subject to authorization or permits issued to different categories of beneficiaries, including rural households, are laid down in Articles 2 and 3 of the Legal Act of 1930. It turns out that the primary management objective of this protected area is the protection of large wildlife [79].
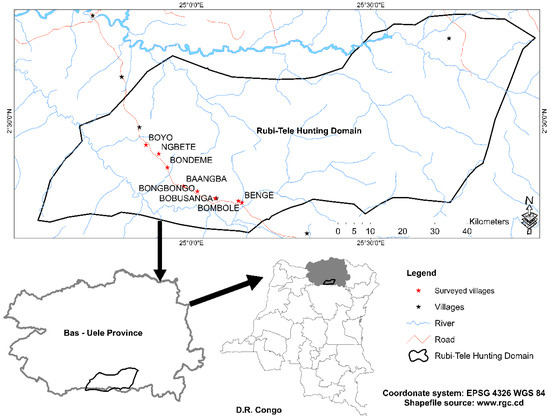
Figure 1.
Map of the Study Area.
The Rubi-Tele Forest is characterized by the abundance of Gilbertiodendron Dewevrei, a tropical species of primary forests with characteristics that make it impossible to regenerate naturally. Generally, the RTHD contains small faunal populations. A range of great fauna species which are the most sensitive to hunting and environmental degradation survives in this Domain. Small Ungulates and Chimpanzees are also present in this ecosystem. In addition, RTHD is also home to symbolic animals, such as the Okapi and the African Elephant. The presence of three lakes within this protected demonstrates its role in protecting certain aquatic animals. Despite the important role of this protected area, it is currently experiencing enormous challenges. RTHD is threatened from all sides by the local population and the local population and hunters and diamond dealers, who often come from neighboring territories.
This area mainly covers five Administrative Territorial Entities including the Territories of Aketi, Bambesa and Buta, which are found in Bas-Uélé Province, and the Territories of Banalia and Basoko, which are located in Tshopo Province. It is spread over eight sectors in Bas-Uélé Province including Bayeu-Bogbama, Mabinza, Makere II, Mongazulu and Yoko, and others in Tshopo Province including Baboa of Kole, Wahanga, and Yamandundu.
Previous research on the delimitation of the RTHD conducted by the ICCN (Congolese Institute for Nature Conservation)/Provincial Office with the financial support of the World Bank through the BEGES found that 3731 people had occupied the area and were distributed in 241 camps and 23 villages. A total of 674 people occupied the 241 camps (632 inside the estate and 42 others in the peripheral camps), and 3057 others were estimated to have occupied 23 villages (12 on the periphery and 14 inside) [79]. Hunting for subsistence use and sale is one of the main activities of the populations living on the periphery and in the RTHD. These populations also practice agriculture, fishing, and collect forest resources. The above-mentioned research also identified the superpositions between the RTHD, mining squares, and forest titles.
Eight villages in the RBHD that where easily accessible were randomly selected for sampling. These surveyed villages are marked by red small stars in Figure 1 (Baangba, Bongbongo, Bobusanga, Ngbete, Bondeme, Boyo, Bombole, and Benge). The selection of households was made through simple random sampling. A total of 127 households were then sampled from the selected villages.
2.2. Questionnaire Design and Data Collection
We designed and adapted the questionnaire following the Poverty-Environment Network (PEN) [80]. Primary data were collected using structured household-level surveys, focus group discussions, and key informant interviews. The questionnaire was focused on general household socioeconomic data (demographics, livelihoods strategies, assets and savings, and land tenure) and other qualitative information. Quantitative data was collected on household cash and non-cash income from all major sources to contextualize the specific contribution of forest income. Focus groups and key informant interviews helped collect common data from all households and the study area status. In addition, secondary data were collected through an extensive review of published and unpublished reference books, journals, scholarly articles, the internet, official reports, and documents.
The structured household survey contained closed and open questions. The questionnaire was tested among some households in the rural area of the Kisangani. Direct observations were used to collect general information on the villages and to understand the real situation of the households and forest-dependent activities [12]. The questionnaire survey was administered to the 127 households during fieldwork in the RTHD from November to December 2020. A household was defined as “a group of people living under the same roof and pooling resources (income and labor) for their livelihood” [80], and it was the final sampling unit in the sampling design. Surveys were conducted with household heads or senior household members in their absence. In some cases, both were interviewed to provide the most comprehensive recall on answers [4]. Two researchers with previous experiences and strong research interests were trained and facilitated to assist in the surveys.
Income data from wage, business, forest and environmental sources were based on a recall period of one month. In contrast, data for crop, livestock, fishing, and other sources of income were based on three months recall periods. Cash income from wage and business sources involved recording the amount earned. Cash and subsistence income from the forest, agricultural, environmental sources, fishing and non-forest environmental sources were calculated using the recorded quantities of products and services (collected, purchased or sold) multiplied by the local prices. Subsistence products or services were assigned cash equivalent values based on each household’s own-reported values, which were independently cross-checked by comparing them with retail prices at main local and urban markets and comparing average prices between sample villages. Finally, all incomes were estimated on an annual basis to obtain the total annual household income.
2.3. Income Calculations
Income is the return to the labor and capital that a household owns, used in its production and income-generating activities (self-employment or business) or sold in a market (e.g., wage labor). Transfers in the form of remittances, pensions, or other government payments were also included in the income definition (PEN, 2007b). This income definition was based on the PEN technical guidelines and was used in this study.
Following Cavendish [6], a household’s total income was defined as the sum of cash income generated from various activities (e.g., crop and livestock production, collection of wild foods, small-scale activities) and the monetary equivalent of a household’s subsistence use of the output of these activities (subsistence income was defined as the value of products consumed directly by the household or given away to friends and relatives). Total household income was accounted on an annual basis; it reflected the net income generated by the household sample under investigation. The total output value was deducted by the total value of the input (e.g., fertilizer for agricultural production, veterinary supplies) during the accounted period. In all income calculations, the cost of own labor was not considered because of existing variations in labor prices depending on tasks. Performing multiple works simultaneously can lead to under or overestimating own labor costs [6,81].
Total household income was divided into seven major categories [82]: crop income, forest-related income, business income, livestock income, wage income, other income, fish and non-forest environmental income. Definitions of these categories are outlined below:
Total household annual income = ∑ (Crop Income + Forest Income + Business Income + Livestock Income + Wage Income + Other Income + Fish and non-forest environmental income)
where Y represents the Total household annual income and is the income from source i.
Crop income: summation of the yield value from various crops grown by a household less the production costs. Total crop income was calculated as follows:
where represents the total crop income, is the yield of crop i, Pi is the market price of crop i, and Ki is the production costs of crop i.
Forest-related income includes the sale or consumption of plant or animal products harvested from natural forests or cultivated in plantations on designated forest land, plus payments for forest-based environmental services (such as government payments to households involved in afforestation programs).
where is total forest income, Fi is the quantity of product collected i, Pi is the market price of forest product i, and Ki is the production costs of forest product i.
Business income includes cash income from self-employment but does not include income from the household’s agriculture or forestry production and processing.
Livestock income only includes income from the sale or consumption of livestock assets.
where is the total livestock income, Ni is the number of livestock in category i, Qi is the quantity of livestock product from livestock i, Pi is the market price of livestock i, and Ki is cash costs of keeping livestock i, like pay for herder, costs of medicines and feeds.
Wage income includes cash from any paid employment, including income from forest-based employment activities.
Other income includes remittances, cash or non-cash gifts/support from friends and relatives, and pensions. Other income also includes support such as agricultural subsidies from the government, NGOs, or similar; payment from renting out the land; and compensation from the government, timber logging or mining companies (or similar).
Fish and non-forest environmental income includes all cash or subsistence income obtained from harvesting non-forest resources provided through natural processes that do not require intensive management (including wild fisheries related income).
where represents Total fish and non-forest environmental income, is the quantity of fish i, is the quantity of non-forest resources i, is the market price of fish or non-forest resources i, and is the cost of fishing or harvesting of non-forest resources i.
2.4. Measuring Forest Dependence
The forest dependence was measured using the relative forest income (RFI). Relative forest income was computed as a share of net forest income to total household income accounts derived from consumption and sale of forest environmental resources:
where RFI is the Relative Forest Income, THI is the Total Household Income, and TFI is the Total Forest Income.
2.5. Data Analysis
We conducted data analysis in the following phases: data entry, checking and correcting, calculation of descriptive statistics, Kruskal–Wallis Test processing, Gini coefficient computation, and Lorenz curve determination. Data analysis was performed using IBM® SPSS® Statistics 20, Microsoft Excel® 2019, and OriginPro® 2018 software.
The Kruskal–Wallis Test (sometimes referred to as the Kruskal–Wallis H Test) is the non-parametric alternative to a one-way between-group analysis of variance. This test was implemented using the IBM SPSS Statistics 20, and it helped check annual household income differences across households per income source and per tercile.
2.6. Measuring Economic Inequality
Numerous measures for inequality are available, but the measure commonly used [1] in the analysis of inequality at the household and global level is the Gini coefficient [28,82]. The Gini coefficient and Lorenz curve are often used to assess the contribution of forests to per capita household income [26,28]. The Italian statistician Corrado Gini developed the Gini coefficient (Gini) in 1912 as a summary measure of income inequality in society [62,83,84,85,86,87]. The Gini coefficient, or index of income concentration, represents the degree of inequality in income distribution in a given group [1]. Its value lies between 0 and 1, where 0 means that each member in the group receives the same income (equal distribution of income), and 1 means that only one member of the group receives all income in a group while the remaining members get nothing, implying that income is unequally distributed. The closer the Gini coefficient is to ‘0’, the greater the income equality [88], while the closer the Gini coefficient is to ‘1’, the more unequal the income distribution (the higher the income inequality) [62,85].
The Lorenz Curve is the key observation for interpreting the statistical analysis of the Gini coefficient [62,86,89]. The Lorenz curve is a cumulative frequency curve that compares the distribution of a specific variable with a uniform distribution that represents equality. A diagonal line represents this equality distribution, and the greater the deviation of the Lorenz curve from this line, the greater the inequality. It corresponds to twice the area between the Lorenz curve and the diagonal.
The overall Gini coefficient for the study area and each income tercile were separately measured to estimate how income from forest is important in reducing income inequality among households. The Gini coefficient was computed using Microsoft Excel® 2019. Different methods are used to calculate the Gini coefficient, but a formula frequently used is the Brown formula [90]. The formula is given as follows:
where G represents the Gini coefficient, is the cumulated proportion of the households variable, and is the cumulated proportion of the income variable.
3. Results
3.1. Basic Sample Characteristics
Of the total households sampled (n = 127), 85.83% were headed by men and 14.17% by women (Table 1). A total of 91.34% were married, 3.94% divorced, 2.36% widows/widowers, and 2.36% singles. The ages of household heads were between 21 and 79, with an average age of 45 years. Regarding education level, it was revealed that 1.57% of the household heads were illiterate, while 44.09%, 51.97%, and 2.36% reached primary, secondary and university levels, respectively. The average size of the household was 8.87, with a minimum and maximum of 1 and 25 family members, respectively. A total of 63.78% of household heads were not born in their current residences, while 36.22% were born in their current residences. The majority of the households owned their residences (96.06%), while 3.94% were renting houses. Concerning landholding, 99.21% of households possessed (owned) land, which varied between 0.5 and 5 ha, with an average of 1.55 ha. A total of 10.24% of households reported having savings, and the average was approximately 556,957.69 CDF (USD 300.90), while the average assets value and livestock assets were estimated at 268,755.67 CDF (USD 145.19) and 362,736.30 CDF (USD 195.97), respectively. Livestock assets were mainly constituted by ducks, chickens, pigs, goats, and sheep. Household assets included furniture, bikes, motorbikes, mobile phones, solar panels, televisions, radios, pirogues, shotguns, CD and VCD players. The average distance required to reach the forest site to extract forest resources was reported as 2.72 km, with 1 km and 5 km being the minimum and maximum distance, respectively.

Table 1.
Households sample characteristics.
3.2. Contribution of Forest Use to Total Household Income and Income Diversification Strategies
Household income diversification strategies and their share to total annual income are presented in Table 2. Based on the results, agriculture, forest-based activities, livestock, fishing and non-forest-based activities, business, employment, and other sources (remittances, gifts, and supports from friends and relatives) constituted the main livelihoods strategies for rural households in the RTHD. It was found that 71.65% of the households were involved in agriculture, 89.76% in forest-based activities, and 41.73% in livestock keeping, 44.09% in fishing and non-forest environmental-based activities. In comparison, 12.60%, 6.30%, and 22.83% were involved in business, employment, and other activities, respectively. Income from forest-based activities constituted the second most important income source. Its average annual value per household was estimated at CDF 1,219,951.58 (USD 659.08), contributing 32.46% to the total annual income. Agriculture’s average annual income per household was around CDF 1,746,024.20 (USD 943.29), contributing 37.09% to the total annual household income. Crop income was the most important income portfolio for the sampled households. CDF 811,264.15 (USD 438.28) was the average annual income per household from livestock keeping, and 10.04% was its share in the total annual household income. Livestock keeping was the third most important income source. Fishing and non-forest environmental-based activities generated CDF 583,335.71 (USD 315.15) (7.63%) as the average annual income per household and constituted the fifth most important income household portfolio. The average annual income per household received from business activities was around CDF 2,221,500.00 (USD 1200.16), and its share in total annual household income was 8.30% (Fourth most important income portfolio). Paid employment and other income sources share in the total annual household income were 2.08% and 2.41%, respectively. Results generated from Kruskal–Wallis Test revealed a significant difference between annual household income in terms of income sources (p < 0.5). Incomes generated from different activities differ significantly. Based on our results, forest income contributed to the livelihoods of rural households living in the Rubi-Tele Hunting Domain.
Table 2.
Households involved in livelihood strategies, average annual income per income sources (in CDF) and shares by income sources.
3.3. Contribution of Different Major Forest Products to Total Forest Income
Income from forest-based activities was found to be crucial for rural households in the RTHD, as presented in Table 2. Bushmeat, firewood, construction materials, fruits, mushrooms, and marenthaceae leaves constituted the main forest products extracted by these households (Table 3). Bushmeat generated CDF 1,340,312.50 (USD 724.10) as average annual income, and its share to total forest income was 46.26%. CDF 333,000.00 (USD 179.90) was the average annual income per household generated from firewood extraction, contributing 22.03% to total forest income. Construction materials, fruits, mushrooms, and marenthaceae leaves income shares to total forest income were 26.98%, 0.65%, 2.68%, and 1.4%, respectively. Bushmeat income share to total forest income was higher than those from other forest products, and the proportion of households involved in this activity was 42.11%. Firewood’s income share fell in third place. Still, it was particularly important because 80.70% of all sampled households were involved in home consumption and sale extraction. The proportion of households involved in the extraction of firewood was very high compared to other forest products despite the reported low economic (financial) value. Forest annual income differed in terms of major forest products income (p < 0.5).
Table 3.
Average annual household income (in CDF) from forest products, and their shares to the total forest income.
3.4. Distribution of Average Annual Household Income Shares by Tercile and Income Sources
Figure 2 presents the contribution of each income source to total annual household income by income terciles. The share of forest-related income decreased monotonically with increased average income. The share of forest-related income was high in the first tercile or low-income category than in other terciles. It accounted for 54.19%, while its share was 29.26% in the high-income tercile. Households in the low-income tercile depended more on forest resources than those in middle and high-income tercile. However, the absolute average forest incomes in these two later income terciles were higher than in poor households. The implication was that rich households consumed more forest products. Crop income constituted the second-largest income in the first income tercile, and it comprised the largest share in the middle (35.60%) and high-income (39.19%) terciles. It was also observed that the share of fish and non-forest environmental income decreased as the average income increased. The fish and non-forest environmental income shares in the total household income for the first, second and third income terciles were 10.48%, 9.04%, and 6.86%, respectively.
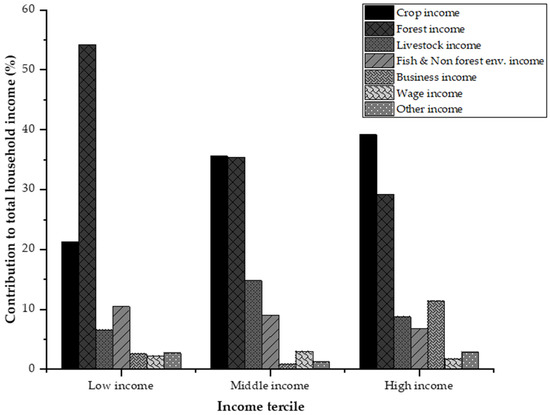
Figure 2.
Household income shares by tercile and income sources.
Figure 3 highlights the share of different forest income sources to total forest income by income terciles. The first largest share in the low-income category was from firewood, representing 50% of the total forest income, while the share of construction materials occupied the second position, representing 22.10%. In the middle-income category, the first largest share (39.93%) was from construction materials, and the second largest share (31.12%) was from firewood. Bushmeat share in the total forest income was 60.90% in the high-income tercile, and it constituted the largest share. Income from construction materials contributed 22.56%, representing the second most important share in this third income tercile.
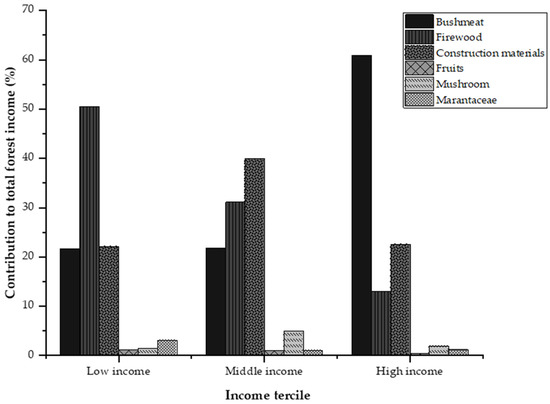
Figure 3.
Share of forest products income to total forest income according to income terciles.
3.5. Forest Income and Economic Inequality
The overall calculated Gini coefficient with forest income was 0.48 but rose to 0.59 without forest income, suggesting that income disparities are reduced through forest resources use. The percent point reduction was 11 points. Lorenz curves show that inclusion of the forest income in the annual household income led to the reduction of income disparities and contributed to household welfare (Figure 4). The Lorenz curve for annual household income without forest income was below the line of equality, indicating income inequality. However, when the forest income was included, it approached equality. The findings generally suggest that environmental resource use contributes to income inequality reduction but may still be less appreciated in conservation programs.
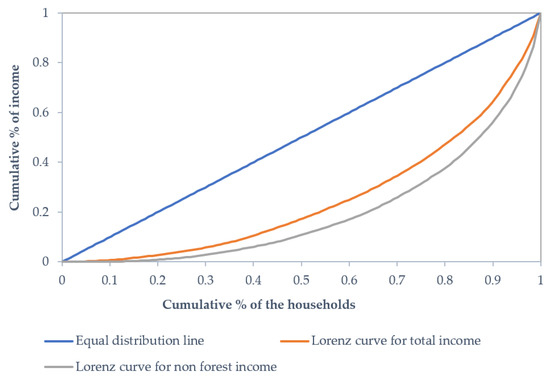
Figure 4.
Households’ income distribution with and without forest incomes.
Table 4 presents the Gini index according to income classes. Regarding the low-income class, the Gini index without forest income was 0.50. It was down to 0.30 when forest income was included, suggesting that forest income substantially reduced income inequalities among households in the low-income group by 20%. In the middle-income class, the Gini index for total income was 0.10, and 0.24 without the forest income. Forest income reduced income disparities by 14% among households in this income class. In the high-income class, the Gini index with forest income and without forest income were 0.29 and 0.44, respectively. There was a 15% reduction of income inequalities among households in this class when including forest income.
Table 4.
Gini coefficient by income classes.
4. Discussion
The findings of this study highlighted the crucial economic contribution of forest use to the livelihoods of the rural household living in the RTHD/DR Congo. The economic contribution is determined by cash and subsistence income and the effect of forest income in reducing economic inequality. In total, 89.76% of the household sample derive part of their annual income from forest-based activities in the RTHD. The average annual forest income per household representing the absolute forest income was estimated at CDF 1,219,951.58, contributing 32.46% to total annual household income. This clearly shows dependency on forest income. Forest income constituted the second most important income source after agriculture which provided an average annual income per household of CDF 1,746,024.20, contributing 37.09% to total annual household income. Another study reported that 59% of households were involved in forest extraction and recorded a forest income share of 41%, 34% and 22% in three different valleys [1]. The involvement percentage was lower than what was revealed in our study, and there were differences in forest income share. In Pakistan’s Basho Valley, 71% of people within the region extracted forest resources for their livelihood [91]. In Lobeke National Park in Cameroun, forest income contributed up to 44.44% to the total income [43]. The findings in Cameroon’s South and Southwest provinces showed that besides agriculture, forest products collection and sale formed 35–52.4% of income to households. Additionally, 70% of 15,707 people living in 12 villages around the Takamanda Forest Reserve had been found to exploit forest products. Other authors have found that forest products contributed over 40% to household incomes per month for some producers and sellers of Gnetum spp. and Irvingia gabonensis [92]. This income helped to meet various important targets of the Millennium Development Goals (MDGs) and buying agricultural implements [43]. In Kenya, forest income was significant to forest adjacent households on East Mau forest ecosystem contributing up to 33% of household income [13].
Another study in the Miombo woodlands of Zambia showed that forest income contributed 43.9% to the average household income [93]. In a compressive comparative analysis of environmental income, authors found that environmental income accounted for 28% of household income in 24 developing countries [52]. Another study reported an average forest contribution of 38% to total annual household income [94]. The study confirms that populations living in and around forests are mainly dependent on forest resources for their livelihoods. Similar studies in other parts of the world [21,52,69,95] and Africa [6,13,28,63,65,96,97,98,99,100,101] obtained a similar forest income share. In Dendi District in Ethiopia, forest income contributed 39% to the average household income and was roughly equal to agriculture, contributing 40% [96].
Our findings were consistent with the results of previous studies and reiterate that forest income plays a significant role in the livelihoods of rural households.
Besides, bushmeat, firewood, construction materials, fruits, mushrooms, and marenthaceae leaves constituted the main forest products extracted by the households living in and around the RTHD. Income generated from bushmeat, both for consumption and sale, represents the share of 46.26% in the total annual forest income, and the proportion of households involved in this activity was 42.11%. The contribution of construction materials, firewood, mushrooms, marenthaceae leaves, and fruits incomes to the total forest income were 26.98%, 22.03%, 2.68%, 1.4%, and 0.65%, respectively. Bushmeat income share to total forest income was higher than for other forest products. However, a significant percentage (80.70%) of households involved in firewood extraction. This shows the importance of firewood as an energy source. The difference in forest products’ income was due to their market values. Another study identified 14 forest products commonly harvested by households in Cameroun [43]. In Southern China, cash income from cultivating and selling bamboo shoots was the main source of forest-related income for households in all income quintiles. Over 60% of households were actively engaged in the activity. Firewood was used by 82% of households almost equally across all income groups. It was the third most important source of forest-related income and the second most valuable subsistence forest product [69]. These findings are in agreement with those revealed in the present study. Meanwhile, other studies have reported the important contribution of fuelwood (50%) and food products (27%) to household forest income, with the majority of households (90.3%) collecting significantly high level of firewood [101]. In another study, 88% of households harvested forest products where fuelwood was most commonly collected for subsistence and cash income. Moreover, leaves also constituted the most common commercial product [4]. In the Dendi District of Ethiopia, firewood constituted the largest share in forest income (59%), and it is utilized for home consumption and sale. The communities depend entirely on local forest resources for domestic energy needs, construction materials, farm implements, and wooden furniture [96]. Another study reported that among all forest products (firewood, timber, fodder, fruits and nuts, herbs, mushrooms, and honey), firewood contributed more to forest income with a share of 47% [65]. Results from another study reported that most households collected firewood (90.3%), herbal medicine (83.3%), poles (34.8%), honey (27.4%), while building stones were the least collected [13]. These findings indicate that firewood was the most crucial forest product for most households, both for energy and cash income sources. The above findings were similar to other reported findings [100,101], and they corroborated those revealed in our study, suggesting the importance of various forest products in rural livelihoods.
To investigate differences in income groups, we divided per capita household income data into three income tercile: first income tercile, second income tercile, and third income tercile, which were referred to as low income, middle income, and high-income groups, respectively. The share of forest-related income was high in the low-income group than in other terciles, and it accounted for 54.19%, while in the high-income group for 29.26%. The share of forest-related income decreased monotonically as average income increased. Households in the low-income group depended more on forest resources. However, absolute forest income in the middle- and high-income groups was significant. The share of crop income increased monotonically as average income increased. Crop income accounted for the first largest share (39.19%) in the high-income group.
Meanwhile, firewood income constituted the largest share of 50.55% in the total forest income in the low-income group. In contrast, construction materials and bushmeat incomes constituted the largest share in the total forest income in the middle- and high-income groups. These findings were consistent with those reported in other studies. In Kenya, moderately poor and higher-income households derive higher absolute forest income than very poor households. However, low-income group households showed a higher forest dependency in relative forest income. These findings on the higher dependency on forest resources by the very poor income groups are consistent with other reported findings [6,47,52,63,96,102,103,104,105]. Another study showed that within the poorest segment of the population (20%), around 78% of this population was highly dependent on forest products for income. Concerning the richest segment (20%), around 32% of this population was highly dependent on forest products, while the remainder were of low dependence on forest income [44]. These findings were consistent with those reported elsewhere [3,48,63,96,106]. However, rich households consume more forest products than the poor in terms of physical and monetary quantity. In Dendi District, the wealthiest quintile extracts roughly twice as much (in terms of value) as the poorest quintile. Still, the poorest remain roughly twice as dependent as the wealthy (measured in relative contribution) [96]. Relative forest income was inversely and significantly correlated with per capita household income. The strong, inverse relationship indicates that while comparatively wealthy households extracted more valuable forest products, they relied less on forest resources. Therefore, while forest income represented 59% of the poorest households’ income, the proportion declined to 30% for the wealthiest households.
Meanwhile, numerous studies have reported a common trend whereby higher-income households use greater amounts of forest products (and have higher absolute forest income) than lower-income households, which have lower absolute forest income but a higher relative forest income [5,6,9,43,97,107]. This may be explained by higher-income households having high cash income levels from other sources. In contrast, lower-income households have fewer income sources, making their forest income proportionally more important [69]. However, some studies have differed from these findings. In Vietnam, poor households were less dependent on forest income than average households. The poor raised 21% of their cash from forests, middle-income households raised 26%, and rich households raised 7% [4]. In Zimbabwe, poor households derived more of their income from forests, more than 40% higher than the rich [6].
Generally, our findings corroborate most previous studies suggesting that moderately poor and higher-income households derive higher absolute forest income than very poor households. However, in relative forest income, low-income group households have a higher level of forest dependency
In terms of income inequality, results from the Lorenz curve and Gini coefficient highlighted that forest income reduces the income inequality across the sampled households in the RTHD. Gini coefficient with forest income was 0.48 but rose to 0.59 without forest income, suggesting that income disparities were reduced through forest resources use. The percentage point reduction was 11 points. Numerous studies also reported the effect of forest income on poverty and inequality. Forests can be considered as pro-poor and play an inequality-reducing role [63]. The addition of forest income to the household accounts leads to 10%-30% reduction in measured income inequality, suggesting that forest income plays a significant role in mitigating poverty and inequality [26,27,28,96,108,109,110].
Another study contradicts the role of forest income in reducing the income equality effect; it indicates that overall forest income contributes to increasing disparities among people by 3% [94]. The disparity decreased by 15.5% in Ethiopia [97], and 16.4% in Nigeria [108]. The authors argued that these contradicting results were due to the artisanal logging practiced by a small number of households.
Findings reported in another study showed that the cumulative Gini coefficient for the study area was 0.45 without forest earnings and 0.25 with forest income. Lorenz curves showed that the inclusion of the forest income in the annual household income led to an equal distribution of income among the sample households [1]. A study in Malawi also reported a 12% reduction when income from forests was included in the annual household [28]. Similarly, in Ethiopia, Mamo et al. [96] provided insights on the income equalizing role of forests for rural households.
Most of these studies reported that income disparities are reduced through forest resources use, which was in support of our findings.
5. Conclusions
The main objective of this study was to assess the economic contribution of forest use to rural livelihoods of households living in the Rubi-Tele Hunting Domain/DR Congo. It was specifically aimed at determining the absolute and relative forest incomes and measuring the distributional effect of forest income on economic equality. Data were collected through structured household-level surveys, focus group discussions, and key informant interviews. The study revealed that 89.76% of the sampled households derived part of their annual income from forest-based activities in the RTHD. The average annual forest income per household was estimated at CDF 1,219,951.58 (USD 659.08), contributing 32.46% to total annual household income. Forest income constituted the second most important source after agriculture. The share of forest-related income was higher in the low-income group than in other terciles and decreased monotonically as the average income increased. Households in the low-income group depended more on forest resources. However, forest absolute income in the middle- and high-income groups was significant. In terms of income inequality, results from the Lorenz curve and Gini coefficient highlighted that forest income reduced the income inequality across households’ sample in the RTHD. Gini coefficient with forest income was 0.48 but reached 0.59 without forest income, suggesting that income disparities were reduced through forest resources use. Forest-related income helps households meet the multiple daily needs that subsequently solve the poverty-related problems in this area.
The findings revealed from this study are of great importance for implementing sustainable forest management policies and strategies that can balance the needs for conservation and development of rural households living around protected areas in DR Congo and the rest of the world. The government should invest more in strengthening the RTHD management capacity to regulate access to forest resources that guarantee the maintenance and improvement of the economic benefit derived by the population while sustaining the rational use of forest resources. A participative management model could be encouraged. Providing alternative sources of income can help reduce pressure on the forest. Alternate energy sources are essential to reduce the high dependence on firewood consumption. We also suggest the education of communities on the importance of the RTHD to their livelihoods and the need to ensure that resources are harvested sustainably.
Author Contributions
Conceptualization, R.K.M. and G.T.; methodology, R.K.M., S.U. and H.L.S.; software, R.K.M. and D.D.K.; validation, R.K.M., G.T. and S.U.; formal analysis, R.K.M., and D.D.K.; investigation, R.K.M. and H.L.S.; resources, R.K.M. and G.T.; data curation, R.K.M.; writing—original draft preparation, R.K.M., S.U., H.L.S. and D.D.K.; writing—review and editing, R.K.M. and G.T.; visualization, All authors.; supervision, G.T.; project administration, R.K.M. and G.T.; funding acquisition, G.T. All authors have read and agreed to the published version of the manuscript.
Funding
This research was funded by the National Social Science Foundation Project of China, grant number: 21BGJ066.
Institutional Review Board Statement
Not applicable.
Informed Consent Statement
Not applicable.
Acknowledgments
The authors are grateful to Northeast Forestry University, Harbin, China, for the technical-scientific support. We thank the Congolese Institute of the Nature Conservation staff in charge of the Management of the Rubi-Tele Hunting Domain for their collaboration during the fieldwork. We thank all who contributed to the achievement of this research.
Conflicts of Interest
The authors declare no conflict of interest.
References
- Rabbi, F.; Bauer, S.; Idalinya, J. Contribution of forests to rural inequality reduction: Present scope and future options for rural development and sustainable use of forests. Int. J. Sustain. Dev. World Ecol. 2010, 17, 4–14. [Google Scholar] [CrossRef]
- Wunder, S. Poverty Alleviation and Tropical Forests-What Scope for Synergies ? World Dev. 2001, 29, 1817–1833. [Google Scholar] [CrossRef]
- Arnold, J.E.M.; Pérez, M.R. Can non-timber forest products match tropical forest conservation and development objectives ? Ecol. Econ. 2001, 39, 437–447. [Google Scholar] [CrossRef] [Green Version]
- McElwee, P.D. Forest environmental income in Vietnam: Household socioeconomic factors influencing forest use. Environ. Conserv. 2008, 35, 147–159. [Google Scholar] [CrossRef]
- Byron, N.; Arnold, M. What futures for the people of the tropical forests? World Dev. 1999, 27, 789–805. [Google Scholar] [CrossRef] [Green Version]
- Cavendish, W. Empirical Regularities in the Poverty-Environment Relationship of Rural Households: Evidence from Zimbabwe. World Dev. 2000, 28, 1979–2003. [Google Scholar] [CrossRef]
- Coomes, O.T.; Barham, B.L.; Takasaki, Y. Targeting conservation—Development initiatives in tropical forests: Insights from analyses of rain forest use and economic reliance among Amazonian peasants. Ecol. Econ. 2004, 51, 47–64. [Google Scholar] [CrossRef]
- Belcher, B.M. Forest product markets, forests and poverty reduction. Int. For. Rev. 2005, 7, 82–89. [Google Scholar] [CrossRef]
- Vedeld, P.; Angelsen, A.; Bojö, J.; Sjaastad, E.; Kobugabe Berg, G.; Kobugabe, G. Forest environmental incomes and the rural poor. For. Policy Econ. 2007, 9, 869–879. [Google Scholar] [CrossRef]
- Sunderlin, W.D.; Belcher, B.; Wunder, S. Livelihoods, Forests, and Conservation in Developing Countries: An Overview. World Dev. 2005, 33, 1383–1402. [Google Scholar] [CrossRef]
- Chao, S. Forest Peoples: Numbers across the World; Forest Peoples Programme: Moreton-in-Marsh, UK, 2012; p. 27. [Google Scholar]
- Wen, Y.; Theint Htun, T.; Chan Ko Ko, A. Assessment of Forest Resources Dependency for local livelihood around Protected Area: A Case Study in Popa Mountain Park, Central Myanmar. Int. J. Sci. 2017, 3, 34–43. [Google Scholar] [CrossRef] [Green Version]
- Langat, D.; Maranga, E.K. Forest use and dependence by forest adjacent households on East Mau forest ecosystem, Kenya. J. Agric. Econ. Ext. Rural. Dev. 2015, 3, 326–337. [Google Scholar]
- Ullah, S.; Gang, T.; Rauf, T.; Sikandar, F.; Liu, J.Q.; Noor, R.S. Identifying the socio-economic factors of deforestation and degradation: A case study in Gilgit Baltistan, Pakistan. GeoJournal 2020, 1–14. [Google Scholar] [CrossRef]
- Kaimowitz, D.; Enforcement, F.L.; Diversity, B.; Partnership, F.; Witness, G.; International, T.; Forest, G. Forest law enforcement and rural livelihoods. Int. For. Rev. 2003, 5, 199–210. [Google Scholar] [CrossRef]
- Oksanen, T.; Pajari, B. Forests in Poverty Reduction Strategies: Capturing the Potential; European Forest Institute: Joensuu, Finland, 2003; ISBN 9529844964. [Google Scholar]
- World Bank. Sustaining Forests: A Development Strategy; The World Bank: Washington, DC, USA, 2004. [Google Scholar]
- Wei, D.; Ben, M.; Bo, S.; Yali, W. Dependence of the Poor on Forest Resources: Evidence from China. Small-scale For. 2017, 16, 487–504. [Google Scholar] [CrossRef]
- Vira, B.; Kontoleon, A. Dependence of the Poor on Biodiversity: Which Poor, What Biodiversity? In Biodiversity Conservation and Poverty Alleviation: Exploring the Evidence for a Link; Roe, D., Elliott, J., Sandbrook, C., Walpole, M., Eds.; John Wiley & Sons, Ltd.: Cambridge, UK, 2013; pp. 52–84. [Google Scholar]
- Angelsen, A.; Wunder, S. Exploring the Forest-Poverty Link: Key Concepts, Issues and Research Implications; CIFOR Occasional Paper No. 40; CIFOR: Bogor, Indonesia, 2003. [Google Scholar]
- Wunder, S.; Shively, G.; Wyman, M. Safety Nets, Gap Filling and Forests: A Global-Comparative Perspective. World Dev. 2014, 64, S29–S42. [Google Scholar] [CrossRef] [Green Version]
- Food and Agricultural Organization of the United Nations (FAO). State of the World’s Forests; FAO: Rome, Italy, 2005. [Google Scholar]
- Fisher, M.; Shively, G. Can Income Programs Reduce Tropical Forest Pressure ? Income Shocks and Forest Use in Malawi. World Dev. 2005, 33, 1115–1128. [Google Scholar] [CrossRef]
- Sunderlin, W.D.; Dewi, S.; Puntodewo, A. Poverty and Forests: Multi-Country Analysis of Spatial Association and Proposed Policy Solutions; CIFOR Occasional Paper No. 47; CIFOR: Bogor, Indonesia, 2007. [Google Scholar]
- FAO. Links between National Forest Programmes and Poverty Reduction Strategies. Available online: https://agris.fao.org/agris-search/search.do?recordID=XF2016006715 (accessed on 27 May 2021).
- Reddy, S.R.C.C.; Chakravarty, S.P. Forest dependence and income distribution in a subsistence economy: Evidence from India. World Dev. 1999, 27, 1141–1149. [Google Scholar] [CrossRef]
- Vedeld, P.; Angelsen, A.; Sjaastad, E.; Berg, G.K. Counting on Forest Incomes: Forest Incomes and the Rural Poor; Environmental Economics Series; Paper No. 98; The World Bank: Washington, DC, USA, 2004; pp. 1–95. [Google Scholar]
- Fisher, M. Environment and Development Development Economics: Household welfare and forest dependence in Household welfare and forest dependence in Southern Malawi. Environ. Dev. Econ. 2004, 9, 135–154. [Google Scholar] [CrossRef] [Green Version]
- Sunderlin, W.D.; Dewi, S.; Puntodewo, A.; Müller, D.; Angelsen, A.; Epprecht, M. Why Forests Are Important for Global Poverty Alleviation: A Spatial Explanation. Ecol. Soc. 2008, 13, 24. [Google Scholar] [CrossRef] [Green Version]
- World Bank. A Resvised Forest Strategy for the World Bank Group; The World Bank: Washington, DC, USA, 2002; Available online: http://www.mekonginfo.org/assets/midocs/0003214-environment-a-revised-forest-strategy-for-the-world-bank-group.pdf (accessed on 25 February 2021).
- Arnold, J.E.M. Forestry, Poverty and Aid; CIFOR Occasional Paper No. 33; CIFOR: Bogor, Indonesia, 2001. [Google Scholar]
- Hegde, R.; Enters, T. Forest Products and Household Economy: A Case Study from Mudumalai Wildlife Sanctuary, Southern India. Environ. Conserv. 2000, 27, 250–259. [Google Scholar] [CrossRef]
- Hegde, R.; Suryaprakash, S.; Achoth, L.; Bawa, K. Extraction of Non-Timber Forest Products in the Forests of Biligiri Rangan Hills, India. Econ. Bot. 1996, 50, 243–251. [Google Scholar] [CrossRef]
- Curran, B.; Sunderland, T.; Maisels, F.; Oates, J.; Asaha, S.; Balinga, M.; Defo, L.; Dunn, A.; Telfer, P.; Usongo, L.; et al. Are Central Africa’ s Protected Areas Displacing Hundreds of Thousands of Rural Poor? Conserv. Soc. 2009, 7, 30–45. [Google Scholar] [CrossRef]
- Sandker, M.; Campbell, B.M.; Nzooh, Z.; Sunderland, T.; Amougou, V.; Defo, L.; Sayer, J. Exploring the effectiveness of integrated conservation and development interventions in a Central African forest landscape. Biodivers. Conserv. 2009, 18, 2875–2892. [Google Scholar] [CrossRef]
- Tieguhong, J.C.; Ingram, V.; Schure, J. Impacts of Artisanal Gold and Diamond Mining on Livelihoods and the Environment in the Sangha Tri-National Park Landscape; CIFOR: Bogor, Indonesia, 2009; ISBN 9786028693141. [Google Scholar]
- Wilkie, D.S.; Morelli, G.A.; Demmer, J.; Starkey, M.; Steil, M. Parks and People: Assessing the Human Welfare Effects of Establishing Protected Areas for Biodiversity Conservation. Conserv. Biol. 2006, 20, 247–249. [Google Scholar] [CrossRef]
- Wollenberg, E.; Ingles, A. Incomes from the Forest: Methods for the Development and Conservation of Forest Products for Local Communities; Wollenberg, E., Ingles, A., Eds.; CIFOR: Bogor, Indonesia, 1998; ISBN 9798764196. [Google Scholar]
- Taylor, P.; Reserve, F.; Masozera, M.K.; Alavalapati, J.R.R. Forest Dependency and its Implications for Protected Areas Management: A Case Study From the Nyungwe Forest Dependency and its Implications for Protected Areas. Scand. J. For. Res. 2004, 19, 85–92. [Google Scholar] [CrossRef]
- Kumar, V.; Source, B.; Environment, H.; By, P.; Academy, R.S.; Doi, S. Forests in the Economy of the Rural Poor: An Estimation of the Dependency Level. AMBIO A J. Hum. Environ. 2000, 29, 126–129. [Google Scholar] [CrossRef]
- Emerton, L. Valuing the Subsistence Use of Forest Products Lucy Emerton The Forest and Forest-adjacent Area The Socio-economy in the Oldonyo Orok Area A Method for Valuing Local Forest Use. Rural Dev. For. Netw. Pap. 1996, 19, 21–29. [Google Scholar]
- Godoy, R.A.; Bawa, K.S. The Economic Value and Sustainable Harvest of Plants and Animals from the Tropical Forest: Assumptions, Hypotheses, and Methods. Econ. Bot. 1993, 47, 215–219. [Google Scholar] [CrossRef]
- Tieguhong, J.C.; Bank, A.D.; Nkamgnia, E.M. Household dependence on forests around lobeke Nationa Park, Cameroon. Int. For. Rev. 2012, 14, 196–212. [Google Scholar] [CrossRef]
- Oyono, P.R.; Ribot, J.C.; Larson, A.M. Green and Black Gold in Rural Cameroon: Natural Resources for Local Governance, Justice and Sustainability; World Resources Institute Working Paper 22; World Resources Institute: Washington, DC, USA, 2006. [Google Scholar]
- Eba, R.; Sébastien, D.; Mbala, M.; Tunguni, J.; Kyungu, P.M. Les Forêts de la République Démocratique du Congo en 2008. In Les Forêts du Bassin du Congo: État des forêts en 2008; de Wasseige, C., Devers, D., de Marcken, R., Eba’a Atyi, R., Nasi, R., Mayaux, P., Eds.; Office des Publications de l’Union Européenne: Luxembourg, 2009; pp. 115–128. ISBN 978-92-79-13211-7. [Google Scholar]
- Counsell, S. Forest Governance in the Democratic Republic of Congo: An NGO Perspective; FERN: Edgware, UK, 2006. [Google Scholar]
- Kamanga, P.; Vedeld, P.; Sjaastad, E. Forest incomes and rural livelihoods in Chiradzulu District, Malawi. Ecol. Econ. 2009, 68, 613–624. [Google Scholar] [CrossRef]
- Shackleton, C.M.; Shackleton, S.E. Household wealth status and natural resource use in the Kat River valley, South Africa. Ecol. Econ. 2006, 57, 306–317. [Google Scholar] [CrossRef]
- Shackleton, S.E.; Philosophy, D.O.F. The Significance of the Local Trade in Natural Resource Products for Livelihoods and Poverty Alleviation. Ph.D. Thesis, Rhodes University, Grahamstown, South Africa, 2005. [Google Scholar]
- Arnold, M. Clarifying the links between forests and poverty reduction Clarifying the links between forests and poverty. Int. For. Rev. 2002, 4, 231–233. [Google Scholar]
- Langat, D.K.; Maranga, E.K.; Aboud, A.A.; Cheboiwo, J.K. Role of Forest Resources to Local Livelihoods: The Case of East Mau Forest Ecosystem, Kenya. Int. J. For. Res. 2016, 2016, 4537354. [Google Scholar] [CrossRef] [Green Version]
- Angelsen, A.; Jagger, P.; Babigumira, R.; Belcher, B.; Hogarth, N.J.; Bauch, S.; Börner, J.; Smith-Hall, C.; Wunder, S. Environmental Income and Rural Livelihoods: A Global-Comparative Analysis. World Dev. 2014, 64, S12–S28. [Google Scholar] [CrossRef] [Green Version]
- Schreckenberg, K.; Belcher, B. Commercialisation of Non-timber Forest Products: A Reality Check. Dev. Policy Rev. 2007, 25, 363. [Google Scholar]
- de Sherbinin, A.; VanWey, L.K.; McSweeney, K.; Aggarwal, R.; Barbieri, A.; Henry, S.; Hunter, L.M.; Twine, W.; Walker, R. Rural household demographics, livelihoods and the environment. Glob. Environ. Chang. 2008, 18, 38–53. [Google Scholar] [CrossRef] [Green Version]
- Shackleton, S.; Shackleton, C.; Shanley, P. Non-Timber Forest Products in the Global Context; Shackleton, S., Shackleton, C., Shanley, P., Eds.; Springer: Berlin/Heidelberg, Germany, 2011; Volume 148, ISBN 9783642179822. [Google Scholar]
- Kaushal, K.K.; Melkani, V.K. India: Achieving the Millennium Development Goals through non-timber forest products. Int. For. Rev. 2005, 7, 128–134. [Google Scholar] [CrossRef]
- Gunatilake, H.M.; Senaratne, D.M.A.H.; Abeygunawardena, P. Role of non-timber forest products in the economy of peripheral communities of knuckles national wilderness area of Sri Lanka: A farming systems approach. Econ. Bot. 1993, 47, 275–281. [Google Scholar] [CrossRef]
- Aung, P.S.; Adam, Y.O.; Pretzsch, J.; Peters, R. Distribution of forest income among rural households: A case study from Natma Taung national park, Myanmar. For. Trees Livelihoods 2015, 24, 190–201. [Google Scholar] [CrossRef]
- Timko, J.; Waeber, P.; Kozak, R. The socio-economic contribution of non-timber forest products to rural livelihoods in Sub-Saharan Africa: Knowledge gaps and new directions. Int. For. Rev. 2010, 12, 284–294. [Google Scholar] [CrossRef]
- Fonta, W.M.; Ichoku, H.E.; Starrett, D.; Sterner, T.; Whittington, D.; Dellink, R.; Hassan, R.; Sumaila, R.; Chitiga, M.; Alemu, T.; et al. Forest Extraction Income, Poverty and Inequality: Empirical Evidence from a Community Forestry Area in Southeastern Nigeria; CEEPA: Pretoria, South Africa, 2010. [Google Scholar]
- Fonta, W.M.; Email, T.; Ayuk, E. The Distributional Impacts of Forest Income on Household Welfare in Rural Nigeria. J. Econ. Sustain. Dev. 2011, 2, 1–13. [Google Scholar]
- Nhem, S.; Lee, Y.J.; Phin, S. Forest income and inequality in Kampong Thom province, Cambodia: Gini decomposition analysis. Forest Sci. Technol. 2018, 14, 192–203. [Google Scholar] [CrossRef] [Green Version]
- Babulo, B.; Muys, B.; Nega, F.; Tollens, E.; Nyssen, J.; Deckers, J.; Mathijs, E. The economic contribution of forest resource use to rural livelihoods in Tigray, Northern Ethiopia. For. Policy Econ. 2009, 11, 109–117. [Google Scholar] [CrossRef]
- Mulenga, B.P.; Richardson, R.B.; Tembo, G. Non-Timber Forest Products and Rural Poverty Alleviation in Zambia; Indaba Agricultural Policy Research Institute (IAPRI): Lusaka, Zambia, 2012. [Google Scholar]
- Ali, N.; Hu, X.; Hussain, J. The dependency of rural livelihood on forest resources in Northern Pakistan’s Chaprote Valley. Glob. Ecol. Conserv. 2020, 22, e01001. [Google Scholar] [CrossRef]
- Zenteno, M.; Zuidema, P.A.; de Jong, W.; Boot, R.G.A. Livelihood strategies and forest dependence: New insights from Bolivian forest communities. For. Policy Econ. 2013, 26, 12–21. [Google Scholar] [CrossRef]
- Tynsong, H.; Tiwari, B.K.; Dkhar, M. Contribution of NTFPs to cash income of the War Khasi community of southern Meghalaya, North-East India. For. Stud. China 2012, 14, 47–54. [Google Scholar] [CrossRef]
- Mukul, S.A.; Rashid, A.Z.M.M.; Uddin, M.B.; Khan, N.A. Role of non-timber forest products in sustaining forest-based livelihoods and rural ’households’ resilience capacity in and around protected area: A Bangladesh study. J. Environ. Plan. Manag. 2015, 59, 628–642. [Google Scholar] [CrossRef] [Green Version]
- Hogarth, N.J.; Belcher, B.; Campbell, B.; Stacey, N. The Role of Forest-Related Income in Household Economies and Rural Livelihoods in the Border-Region of Southern China. World Dev. 2013, 43, 111–123. [Google Scholar] [CrossRef]
- Wright, J.H.; Priston, N.E.C. Hunting and trapping in Lebialem division, Cameroon: Bushmeat harvesting practices and human reliance. Endanger. Species Res. 2010, 11, 1–12. [Google Scholar] [CrossRef]
- Biloso, A.; Lejoly, J. Etude de l’exploitation et du marché des produits forestiers non ligneux à Kinshasa. Tropicultura 2006, 24, 183–188. [Google Scholar]
- Toirambe, B.B. Analyse de l’état des Lieux du Secteur des Produits Forestiers non Ligneux et Évaluation de Leur Contribution à la Sécurité Alimentaire en République Démocratique du Congo; FAO: Rome, Italy, 2007. [Google Scholar]
- Schure, J.; Levang, P. Producing Woodfuel for Urban Centers in the Democratic Republic of Congo: A Path Out of Poverty for Rural Households ? World Dev. 2014, 64, 1–11. [Google Scholar] [CrossRef]
- Wilkie, D.S.; Curran, B.; Tshombe, R.; Morelli, G.A. Managing bushmeat hunting in Okapi Wildlife Reserve, Democratic Republic of Congo. Oryx 2021, 32, 27–30. [Google Scholar] [CrossRef]
- UICN/PACO. Parcs et Réserves de la République Démocratique du Congo: Évaluation de L’efficacité de Gestion des Aires Protégées; UICN/PACO: Ouagadougou, Burkina Faso, 2010. [Google Scholar]
- Mendako, R.K. Etude Socioéconomique de la Chasse Villageoise dans une aire Protégée: Cas du Domaine de Chasse de Rubi-Tele (Bas-Uélé, RDC). Master’s Thesis, University of Kisangani, Kisangani, Democratic Republic of the Congo, 2016. [Google Scholar]
- Jagger, P.; Luckert, M.K. Asking Questions to Understand Rural Livelihoods: Comparing Disaggregated vs. Aggregated Approaches to Household Livelihood Questionnaires. World Dev. 2012, 40, 1810–1823. [Google Scholar] [CrossRef]
- Hart, T.B.; Lourd, A.P. Evaluation de l’Etat de Conservation Domaine de Chasse de Rubi-Tele: Inventaires Fauniques, Contexte Historique et Recommandations Pour Assurer la Conservation du Site en Rapport Avec la Réhabilitation de la Route Nationale 4. AGREGO GEIE: Bruxelles, Belgium, 2007. Available online: https://documents1.worldbank.org/curated/en/704821468027557379/pdf/E17180vol-07.pdf (accessed on 12 June 2021).
- Ministère de l’Amenqgement du Territoire, Urbanisme, Habitat, Travaux Publics et Reconstruction. Evaluation Préliminaire des Appuis à l’ICCN en Matière de Gestion Participative des aires Protégées; Ministère de l’Amenqgement du Territoire, Urbanisme, Habitat, Travaux Publics et Reconstruction: Kinshasa, Democratic Republic of the Congo, 2013. [Google Scholar]
- CIFOR. PEN Technical Guidelines; 4; CIFOR: Bogor, Indonesia, 2007. [Google Scholar]
- Campbell, B.M.; Luckert, M.K. Towards understanding the role of forests in rural livelihoods. In Uncovering the Hidden Harvest: Valuation Methods for Woodland and Forest Resources; People and Plants Conservation Series; Luckert, M.K., Campbell, B.M., Eds.; Earthscan Publications: London, UK, 2002; pp. 1–12. [Google Scholar]
- Shashi Kant, J.C.N.; Berry, R.A. Forests and economic welfare. J. Econ. Stud. 1996, 23, 31–43. [Google Scholar] [CrossRef]
- Liao, T.F. Evaluating Distributional Differences in Income Inequality. Socius Sociol. Res. Dyn. World 2016, 2, 2378023115627462. [Google Scholar] [CrossRef] [Green Version]
- Favero, G. A reciprocal legitimation: Corrado Gini and statistics in fascist Italy A reciprocal legitimation: Corrado Gini and statistics in fascist Italy. Manag. Organ. Hist. 2017, 9359, 261–284. [Google Scholar] [CrossRef]
- Ceriani, L.; Verme, P. The origins of the Gini index: Extracts from Variabilità e Mutabilità (1912) by Corrado Gini. J. Econ. Inequal. 2012, 10, 421–443. [Google Scholar] [CrossRef]
- Lerman, R.I.; Yitzhaki, S. Income Inequality Effects by Income Source: A New Approach and Applications to the United States. Rev. Econ. Stat. 1985, 67, 151–156. [Google Scholar] [CrossRef]
- Pandit, R. Forest Policy and Economics REDD + adoption and factors a ff ecting respondents’ knowledge of REDD + goal: Evidence from household survey of forest users from REDD + piloting sites in Nepal. For. Policy Econ. 2018, 91, 107–115. [Google Scholar] [CrossRef]
- Cullis, J.; van Koppen, B. Applying the Gini Coefficient to Measure Inequality of Water Use in the Olifants River Water Management Area, South Africa; IWMI: Colombo, Sri Lanka, 2007. [Google Scholar]
- Allison, P.D. Measures of Inequality. Am. Sociol. Rev. 2012, 43, 865–880. [Google Scholar] [CrossRef]
- Brown, M.C. Using Gini-style indices to evaluate the spatial patterns of health practitioners: Theoretical considerations and an application based on Alberta data. Soc. Sci. Med. 1994, 38, 1243–1256. [Google Scholar] [CrossRef]
- Ullah, S.; Noor, R.S.; Abid, A.; Mendako, R.K.; Waqas, M.M.; Shah, A.N.; Tian, G. Socio-economic impacts of livelihood from fuelwood and timber consumption on the sustainability of forest environment: Evidence from basho valley, Baltistan, Pakistan. Agriculture 2021, 11, 596. [Google Scholar] [CrossRef]
- Awono, A.; Manirakiza, D.; Ingram, V. Etude de Base du ’Ndo’o (Irvingia spp.) dans les Provinces du Centre, Sud et Littoral Cameroun; Center for International Forestry Research (CIFOR): Yaounde, Cameroon, 2009. [Google Scholar]
- Kalaba, F.K.; Helen, C.; Dougill, A.J. Contribution of forest provisioning ecosystem services to rural livelihoods in the Miombo woodlands of Zambia. Popul. Environ. 2013, 35, 159–182. [Google Scholar] [CrossRef]
- Makoudjou, A.; Levang, P.; Chupezi Tieguhong, J. The role of forest resources in income inequality in Cameroon. For. Trees Livelihoods 2017, 26, 271–285. [Google Scholar] [CrossRef] [Green Version]
- Rodriguez, L.G.; Pérez, M.R.; Yang, X.; Fu, M.; Geriletu; Wu, D. The changing contribution of forests to livelihoods: Evidence from Daxi village, Zhejiang Province, China. Int. For. Rev. 2009, 11, 319–330. [Google Scholar] [CrossRef]
- Mamo, G.; Sjaastad, E.; Vedeld, P. Economic dependence on forest resources: A case from Dendi District, Ethiopia. For. Policy Econ. 2007, 9, 916–927. [Google Scholar] [CrossRef]
- Yemiru, T.; Roos, A.; Campbell, B.M.; Bohlin, F. Forest incomes and poverty alleviation under participatory forest management in the bale highlands, Southern Ethiopia. Int. For. Rev. 2010, 12, 66–77. [Google Scholar] [CrossRef]
- Asfaw, A.; Lemenih, M.; Kassa, H.; Ewnetu, Z. Importance, determinants and gender dimensions of forest income in eastern highlands of Ethiopia: The case of communities around Jelo Afromontane forest. For. Policy Econ. 2013, 28, 1–7. [Google Scholar] [CrossRef]
- Bwalya, S. Household Dependence on Forest Income in Rural Zambia. Zambia Soc. Sci. J. 2011, 2, 6. [Google Scholar]
- Barirega, A.; Agea, J.G.; Van Damme, P. Prioritizing wild medicinal and food plants with potential for commercialization and value chain improvement for livelihood enhancement and poverty reduction in Uganda. Res. J. Environ. Earth Sci. 2012, 4, 668–673. [Google Scholar]
- Langat, D.; Cheboiwo, J. To Conserve or not to Conserve: A Case Study of Forest Valuation in Kenya. J. Trop. For. Sci. 2010, 22, 5–12. [Google Scholar]
- Hirsch, E.; Neumann, R.P. Commercialisation of Non-Timber Forest Products: Review and Analysis of Research; Center for International Forestry Research (CIFOR): Bogor, Indonesia, 2000; ISBN 979876451X. [Google Scholar]
- Kabubo-Mariara, J.; Gachoki, C. Forest Dependence and Household Welfare: Empirical Evidence from Kenya; CEEPA Discussion Paper No. 41; Centre for Environmental Economics and Policy in Africa, University of Pretoria: Pretoria, South Africa, 2008. [Google Scholar]
- Illukpitiya, P.; Yanagida, J.F. Farming vs forests: Trade-off between agriculture and the extraction of non-timber forest products. Ecol. Econ. 2010, 69, 1952–1963. [Google Scholar] [CrossRef]
- Heubach, K.; Wittig, R.; Nuppenau, E.A.; Hahn, K. The economic importance of non-timber forest products (NTFPs) for livelihood maintenance of rural west African communities: A case study from northern Benin. Ecol. Econ. 2011, 70, 1991–2001. [Google Scholar] [CrossRef]
- Teshome, B.; Kassa, H.; Mohammed, Z.; Padoch, C. Contribution of Dry Forest Products to Household Income and Determinants of Forest Income Levels in the Northwestern and Southern Lowlands of Ethiopia. Nat. Resour. 2015, 6, 331–338. [Google Scholar] [CrossRef]
- Cavendish, W. Quantitative Methods for Estimating the Economic Value of Resource Use to Rural Households; Campbell, B.M., Luckert, M.K., Eds.; Earthscan: London, UK, 2012; ISBN 9781136549793. [Google Scholar]
- Fonta, W.M.; Ayuk, E.T. Measuring the role of forest income in mitigating poverty and inequality: Evidence from south-eastern Nigeria. For. Trees Livelihoods 2013, 22, 86–105. [Google Scholar] [CrossRef] [Green Version]
- Botha, B.N. Looking for a Path Out of Poverty: The Study of Chimaliro Forestry Reserve, Malawi. Master’s Thesis, Agricultural University of Norway, Akershus, Norway, 2003. [Google Scholar]
- Aryal, B. Are Trees for the Poor? A Study from Budogo Forest, Uganda. Master’s Thesis, Agricultural University of Norway, Akershus, Norway, 2002. [Google Scholar]
Publisher’s Note: MDPI stays neutral with regard to jurisdictional claims in published maps and institutional affiliations. |
© 2022 by the authors. Licensee MDPI, Basel, Switzerland. This article is an open access article distributed under the terms and conditions of the Creative Commons Attribution (CC BY) license (https://creativecommons.org/licenses/by/4.0/).