1. Introduction
Soil can accumulate solar radiation, participate in cycles of organic matter, and as the source of nutrition for plants, is the basis of forest production [
1]. Soil is a vital moisture reservoir [
2], affects the quality of surface water, and provides an effective filter, affecting groundwater quality [
3,
4]. Soil degradation is one of the primary forms of damage associated with forestry [
5,
6] and forest operations [
7,
8], resulting from the use of heavy machinery for timber harvesting and transportation [
9]. Forest machinery traffic causes three types of soil disturbance: compaction, profile disturbance, and rutting [
10,
11]. Soil compaction is responsible for soil physical degradation [
12,
13]. It occurs when the load applied on soil exceeds the ground-bearing capacity and reduces the pore space and volume [
14,
15]. Compaction increases the soil bulk density and shear strength [
16,
17]. Increased resistance to penetration [
18] disturbs water drainage, air infiltration, respiration, and gas exchange [
19,
20]. Compaction effects on soil’s physical properties are commonly described through bulk density [
21] or soil penetration resistance, i.e., the vertical force required to penetrate a cone into the soil, thereby assessing soil strength and evaluating root penetrability [
22]. Many studies have focused on the effects of compaction on soil penetration resistance; however, the results are difficult to compare because of the variability of the experimental conditions, such as soil physical characteristics or equipment [
23]. Increased soil bulk density is often associated with reduced air and water permeability [
24]. However, the association between bulk density and permeability is not automatic; an increase in bulk density does not always lead to a change in the air and water infiltration rates [
25].
This study aims to compare the changes to bulk density and penetration resistance due to a varying number of passes of commonly used forest machinery over a forest soil surface. The novelty of our study lies in the fact that we assessed the effects of forest machinery on previously undisturbed soils, without the additional effects of the loads normally skidded over the soil surface, measuring soil parameters repeatedly after machine passes. This enabled us to control the conditions for assessing the effects of contact pressure on Cambisols. Furthermore, numerous studies focused on assessing the effects of machine traffic, simulating real-life situations, but the repeatability of such results is difficult as the machines pass over soils that were already subjected to machine traffic (different initial conditions). Moreover, though some studies account for the weight of the loads, weight is not the only factor when considering the effects of the loads. Skidding technology, routing of the skid trails, specific top/large end diameters, and other factors will play a role in the mechanisms of soil compaction or displacement. In summary, our study presents the effects of machine traffic, as isolated as possible in the field. Therefore, we formed two hypotheses: (i) the increasing number of machine passes uniformly increases soil bulk density and penetration resistance, and (ii) the changes of soil bulk density and penetration resistance are significantly affected by the weight class of the machine passing on the soil surface.
2. Material and Methods
Measurements were conducted at the forests managed by the University forest enterprise of the Technical University in Zvolen. The enterprise manages 9726 ha of forests used for education and research. The observed area is a moderately cold, highly moist climatic region of Slovakia, with a mean annual temperature range between 4 °C and 6 °C, maximal temperatures between 12 °C and 16 °C in July, and minimal temperatures between −6 °C to −4 °C in January. The mean annual precipitation is between 900 and 1000 mm, in July between 60 and 80 mm, and in January between 60 and 70 mm. Measurements were carried out in stand no. 554 (48°38′35.5″ N 19°02′12.5″ E) (
Table 1), in July and August 2020.
To identify the soil texture in the forest stand, a soil sample was taken and analyzed in a laboratory to determine the share of fine matter fractions under 0.063 mm (loam, silt, sand) via a Casagrande method. To determine the skeleton content (2–4 mm; >4 mm) in particular depth intervals, ten soil samples from up to 50 cm depth were taken from the vicinity of the experimental plots into steel cylinders (width 60 mm, length 1000 mm). The samples were divided into 10 cm sections and sieved with 125–63–32–16–8–4–2–1–0.5–0.25–0.126–0.063 mm normalized sieves. The grain size distribution is created by a combination of sieve analysis (particles between 125 mm and 0.063 mm) and hydrometer (densitometer) tests (particles less than 0.063 mm). Hydrometer (areometer, densitometer, the Casagrande’s test) is based on free and continuous sedimentation of the suspension (the Stoke’s law). During sedimentation, the density of the solution is read in seven defined time intervals: 2′, 5′, 15′, 30′, 60′, 120′, 240′ and 24 h. Subsequently, fictitious sieves are formed from these density readings and converted to grain size fractions. The data obtained by the sieving and hydrometer method were merged and plotted in the form of the grain size distribution curve [
27].
The study was conducted on three skid trails, where the soil’s bulk density (B.D.) and penetration resistance (P.R.) were observed before and after machine traffic. Machines passed over the soil surface unloaded to ensure the masses of the machines were consistent throughout the study. Each skid trail was passed by a single machine, the Zetor 7245 Horal system (universal skidder—U.S.), LKT 81 ITL (forest skidder—F.S.1), and HSM 805 HD (forest skidder—F.S.2) (
Table 2). The tire inflation pressure was measured by a portable tire pressure regulator Pneurex 1 (Blitz Co., Ltd., Bräunlingen, Germany). DINI ARGEO 3590 E with two WWSE10T load cells (700 × 450 mm; capacity 10,000 kg) axle scales were used to measure the mass of the machines.
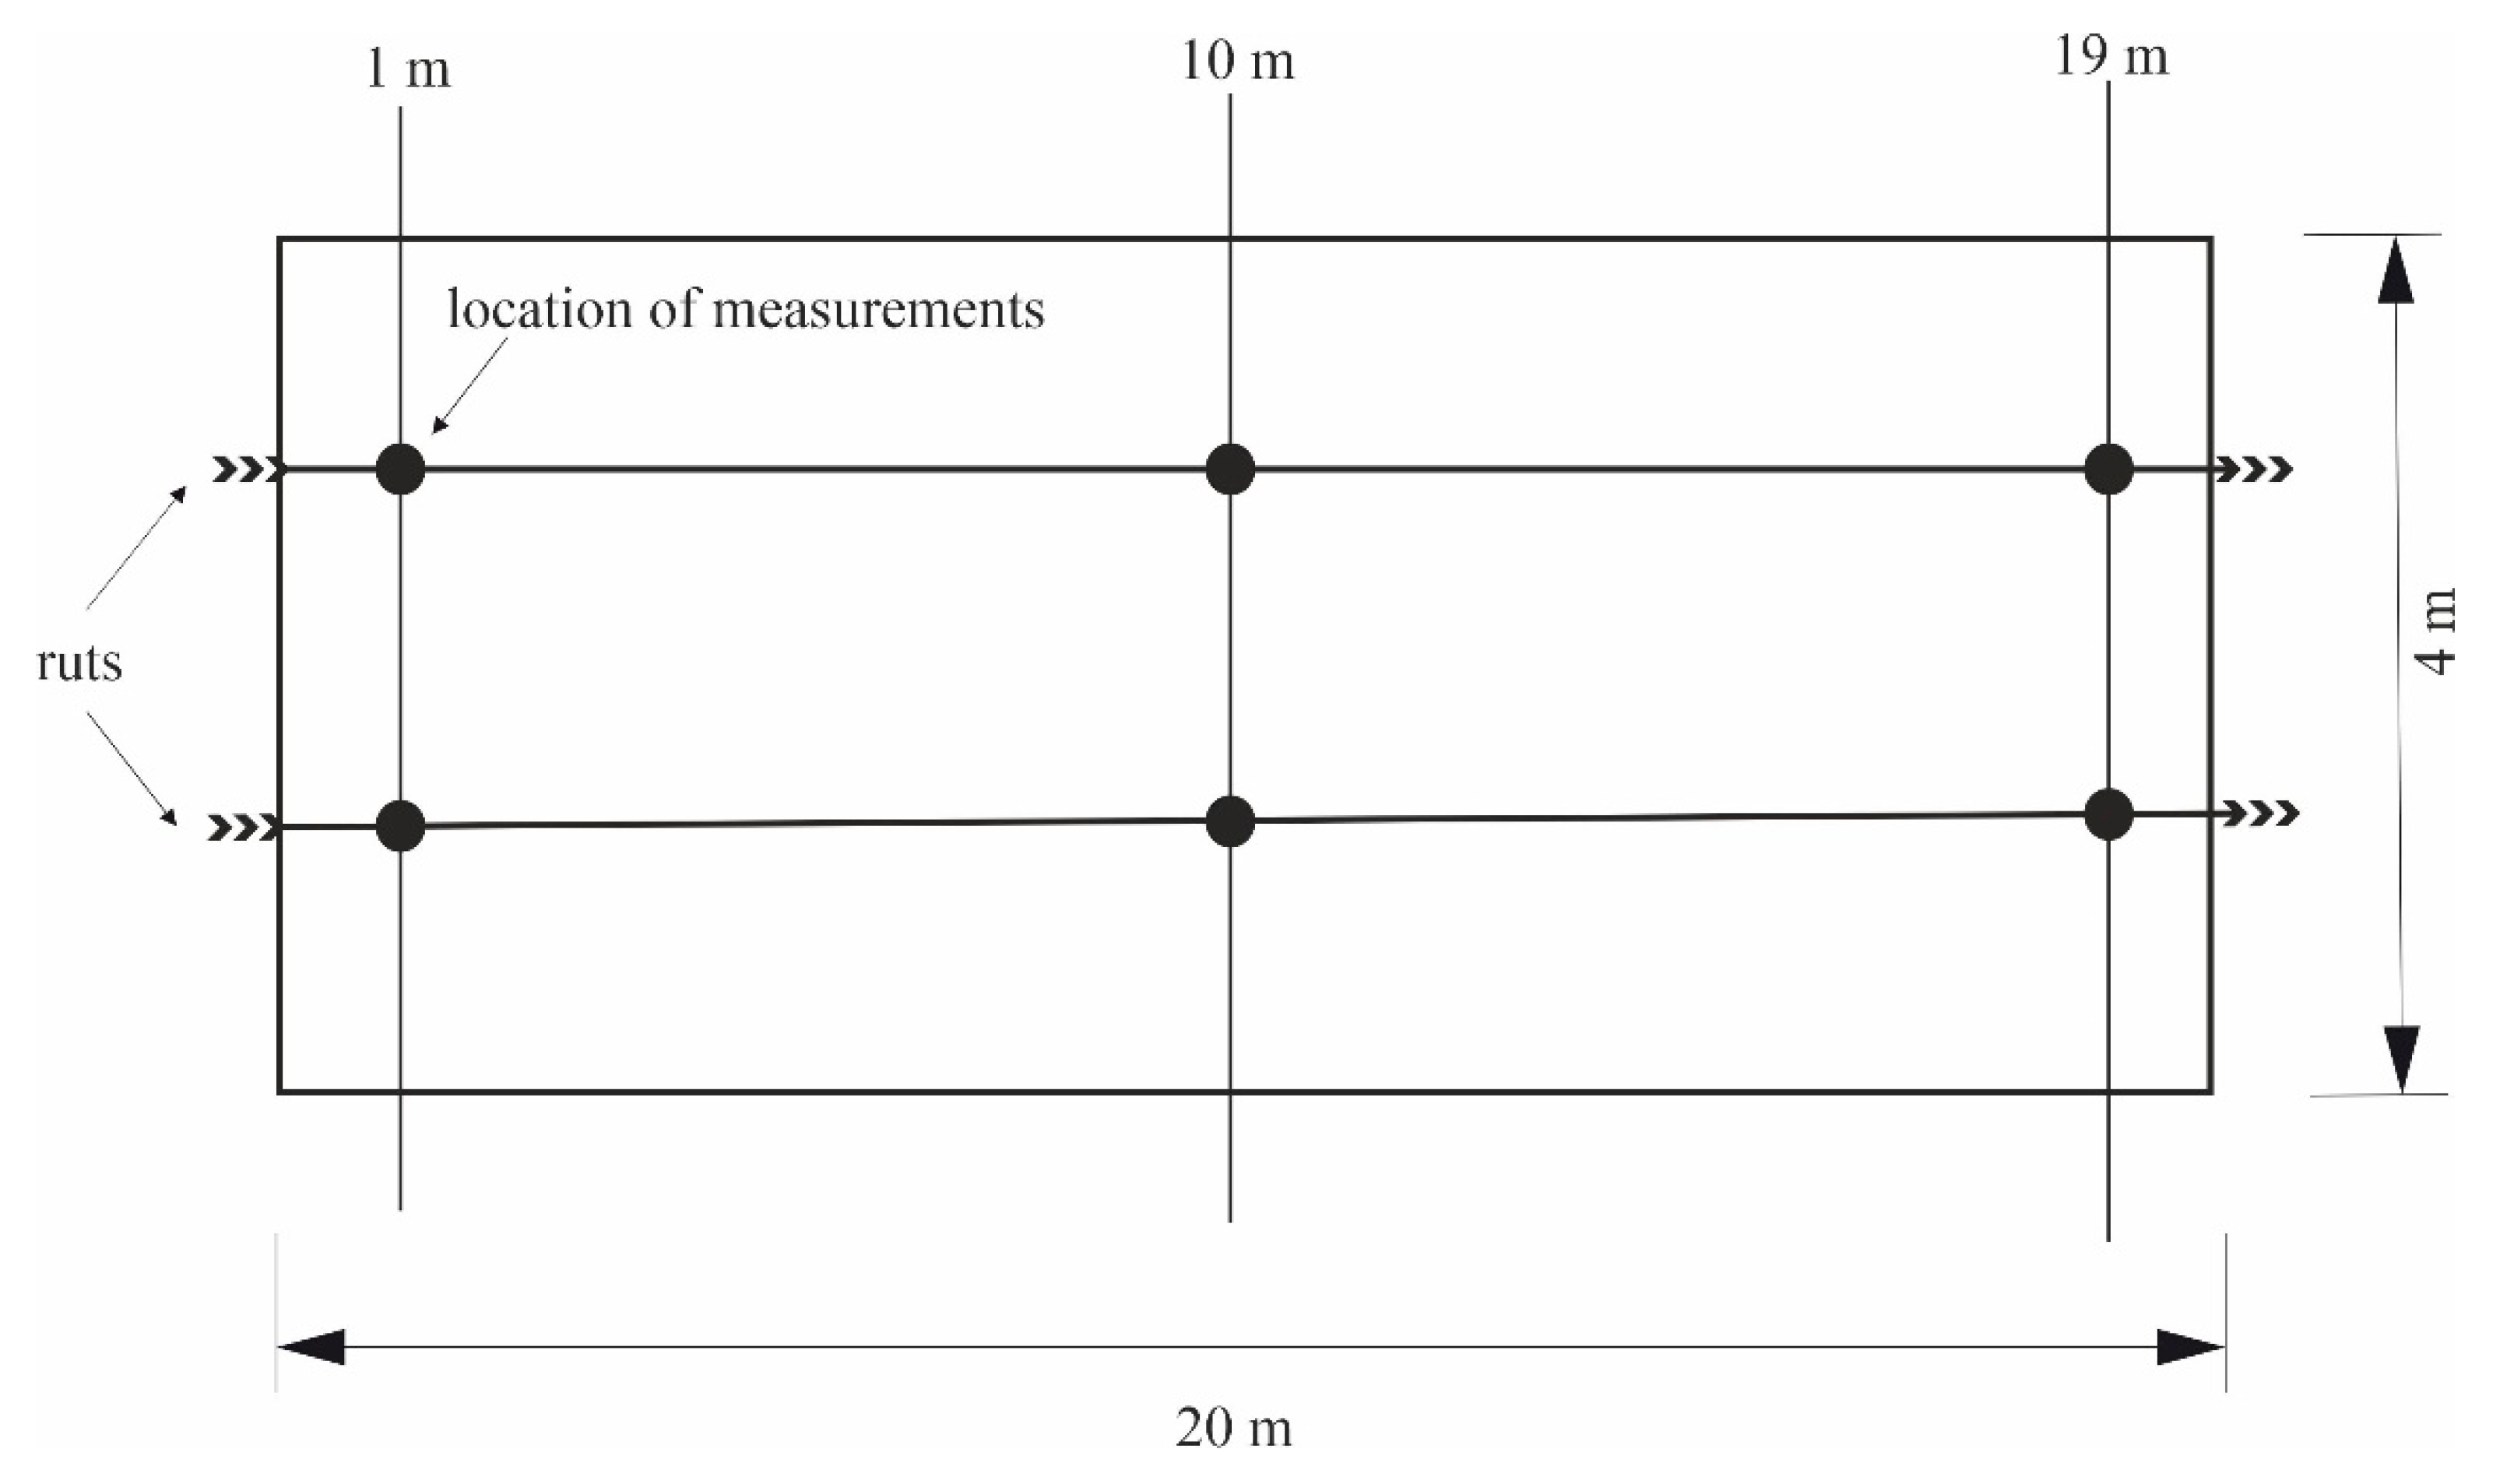
All experimental plots were 4 m wide and 20 m long (
Figure 1). The number of passes on each experimental plot was 40. Bulk density and P.R. were measured after pass no. 0, 3, 5, 10, 15, 20, 25, 30, 35, and 40. Three measurement places were selected on each experimental plot, at distances of 1, 10, and 19 m from the start of each plot. At each measurement location, soil B.D. and P.R. were measured for the left and right rut of the skid trail, i.e., a set of six measurements for each prescribed number of machine passes.
Control measurements were carried out on the experimental plots before the first pass of the machines. The experimental skid trails used in our study were located outside the delineated, permanent skid trails, thus eliminating the effects of previous machine traffic. We observed the following parameters on each experimental plot: (i) machine type, (ii) B.D. (g cm−3), (iii) moisture content (%), (iv) P.R. (MPa), (v) P.R. depth (cm), (vi) P.R. depth interval, (vii) the number of passes, and (viii) P.R. values, where the prescribed depth interval was not reached. To collect samples for B.D. evaluation, Eijkelkamp soil and water sampling cylinders with a 100 cm3 volume (length 50 mm, inner diameter 50 mm) were used. Before soil sampling, the organic matter layer was cleared from the soil surface. The sampled soil was hermetically sealed in the cylinders to prevent moisture loss and transferred to the laboratory for analysis. In the laboratory, samples were weighed on calibrated scales (accuracy 0.1 g). Subsequently, the samples were dried at 105 °C for 24 h to determine the B.D. Moisture content (%) was determined by the gravimetric method as the difference in weights of the fresh and dried samples.
An Eijkelkamp Penetrologger was used to measure P.R. (MPa) characteristics. The penetrometer was equipped with an 80 cm long rod and a cone with an 11.3 mm base diameter, a surface area of 1 cm2, and an angle of 30°. Penetration velocity was 2 cm s−1. The penetrometer was equipped with a new cone before measuring each machine. Data were logged into the memory of the device, from where they were exported into a P.C. via the Eijkelkamp Penetroviewer software. Data gathered were evaluated in Statistica 12.0 (regression and correlation analysis, analysis of variance, ꭓ2 test) and M.S. Excel.
4. Discussion
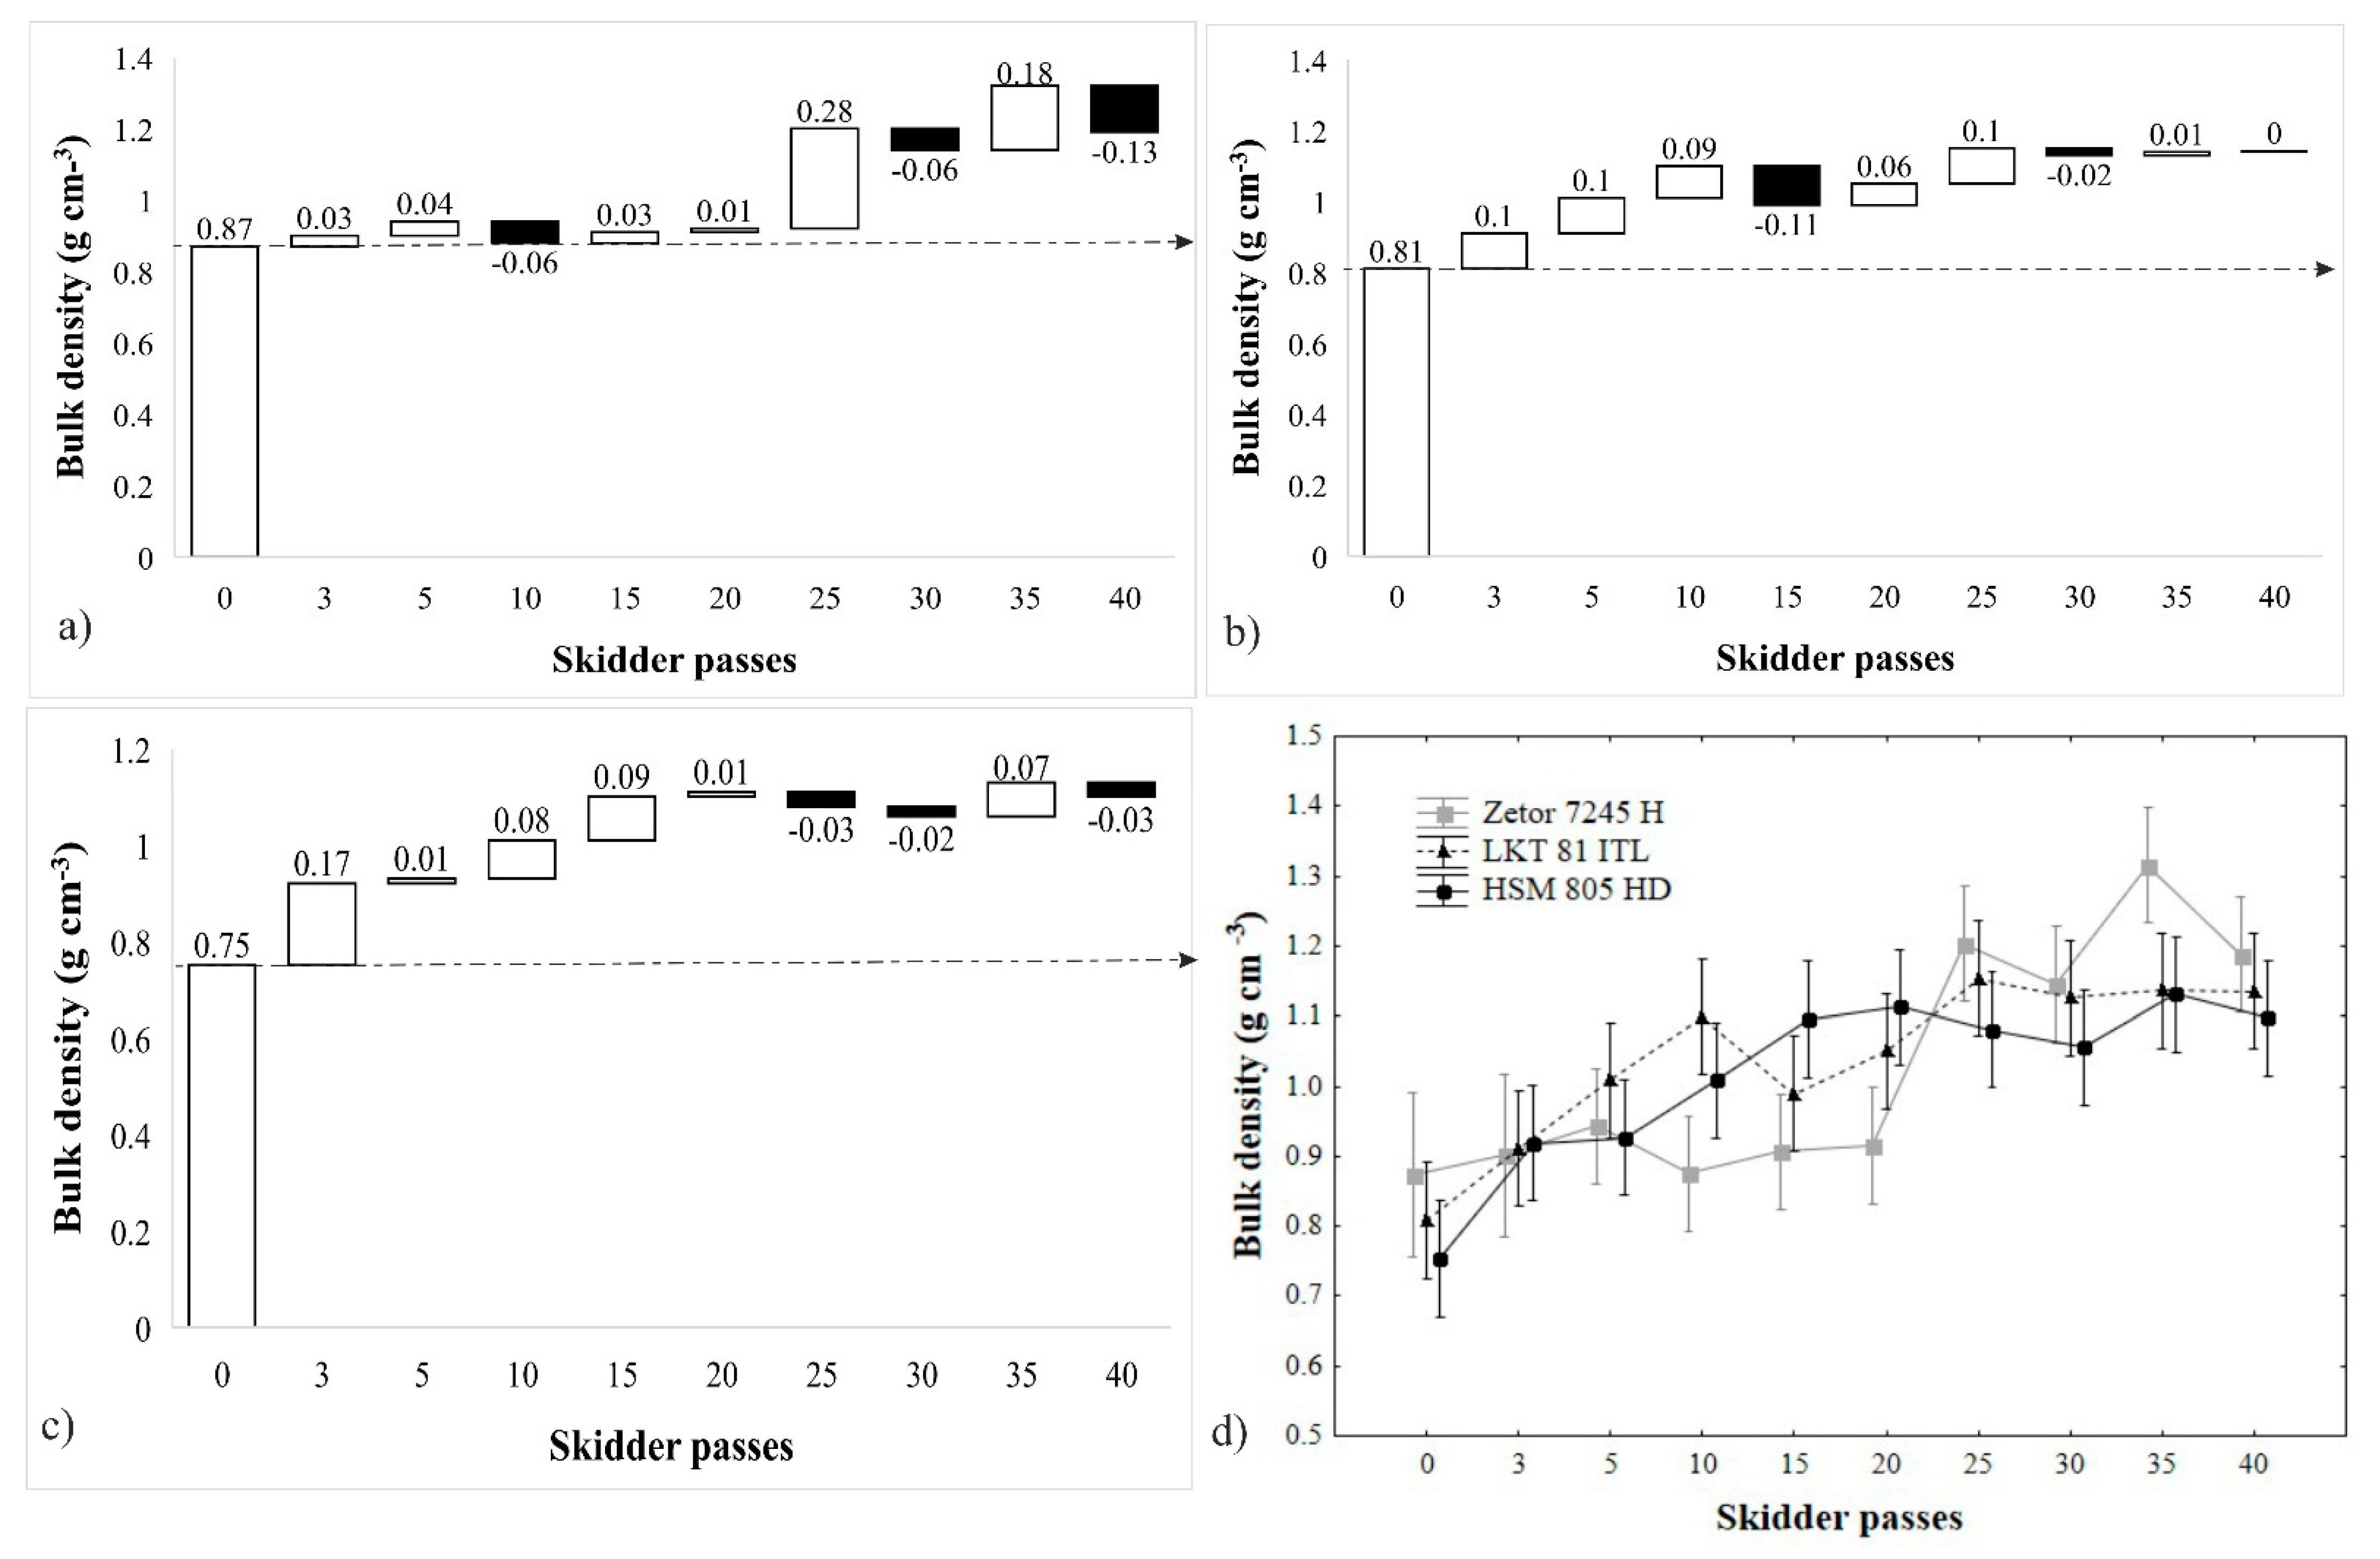
In our case, the average rates of B.D. of undisturbed soil ranged between 0.75–0.87 g cm
−3. Solgi et al. [
28] report the B.D. of undisturbed soil in the Guilan province of Iran is 0.7 g cm
−3, while [
29] report 1.12 g cm
−3 in the top 10 cm soil layer in Southwestern Georgia, USA. In our case, the maximal B.D. values varied between 1.13 and 1.32 g cm
−3 and were reached between passes 25 and 35. Bigelow et al. [
29] report maximal B.D. of 1.50 g cm
−3 measured in the rut of a Tigercat 610 C skid trail. The B.D. was reached between passes 22 and 49 of the machine on the skid trail. In our case, the difference in B.D. between the control measurement and the 40th machine pass ranged between 36.78% and 46.67%. Bigelow et al. [
29] also report that compared to the undisturbed soil in the stand, the mean B.D. of the top 10 cm soil layer increased by 77% in the rut of the skid trails. On the other hand, [
30] states that 21 machine passes caused a 58.5% increase in B.D. To compare the effects of load on the soil compaction while skidding, [
31] reported a mean B.D. of 1.35 and 1.29 g cm
−3 in the ruts of the trails, over which 411 m
3 and 215 m
3 of timber was skidded by an HSM 805 HD skidder. Allman et al. [
31] also report that on a Luvisol skid trail, over which 215 m
3 of timber was skidded by a Zetor 7245, the B.D. reached 1.24 g cm
−3. Compared to our results, the B.D. reached after the 40th machine pass was 19%, 15%, or 4% lower on average.
In our case, the first three passes of the machines caused an increase of between 3.45% and 22.67% in B.D. and the first five passes of the machines caused an increase of between 8.05% and 24.7%. Researchers [
18] found that bulk density increases more sharply, with 50% of the total impact occurring after three passes. A study provided by Williamson and Neilsen [
32] states an even greater increase of B.D. in the top 10 cm of soil, at 62%. On the other hand, [
30] provides a more conservative B.D. increase after skidder traffic—the first pass increases B.D. by 18.2%, and six passes cause a 33.6% increase. Similarly, [
33] reports that the first pass of a skidder causes a 5% increase in B.D. and five passes cause a 19% increase in the top 10 cm layer of soil. Similarly, we found that a significant increase in soil compaction occurred only after a certain number of machine passes (3–5) according to Tukey’s test, especially for the heavier machines. Canillas and Salokhe [
34], while modeling the soil compaction at a variable number of machine passes in laboratory conditions, state that significant compaction occurs during the first three machine passes, while subsequent passes cause do not cause substantial additional compaction.
In the case of our measurements, the relationship between the B.D. and soil moisture content was significant in the top 10 cm soil layer (
p < 0.05), with a negative correlation coefficient. Wang et al. [
35] state that on skid trails in the Appalachian Mountains, trafficked by the John Deere 648 G skidder, the B.D. change was not significantly affected by soil moisture on the skid trails or the number of loaded machine passes. A study [
36] analyzed the correlation between B.D. and soil moisture in various depth intervals (0–10 cm, 11–20 cm, 2130 cm), and a statistically significant relationship, with a negative correlation coefficient, was found only for the second depth interval (
p = 0.004). On the other hand, [
37] states that soil moisture affects observed soil compaction and trafficability.
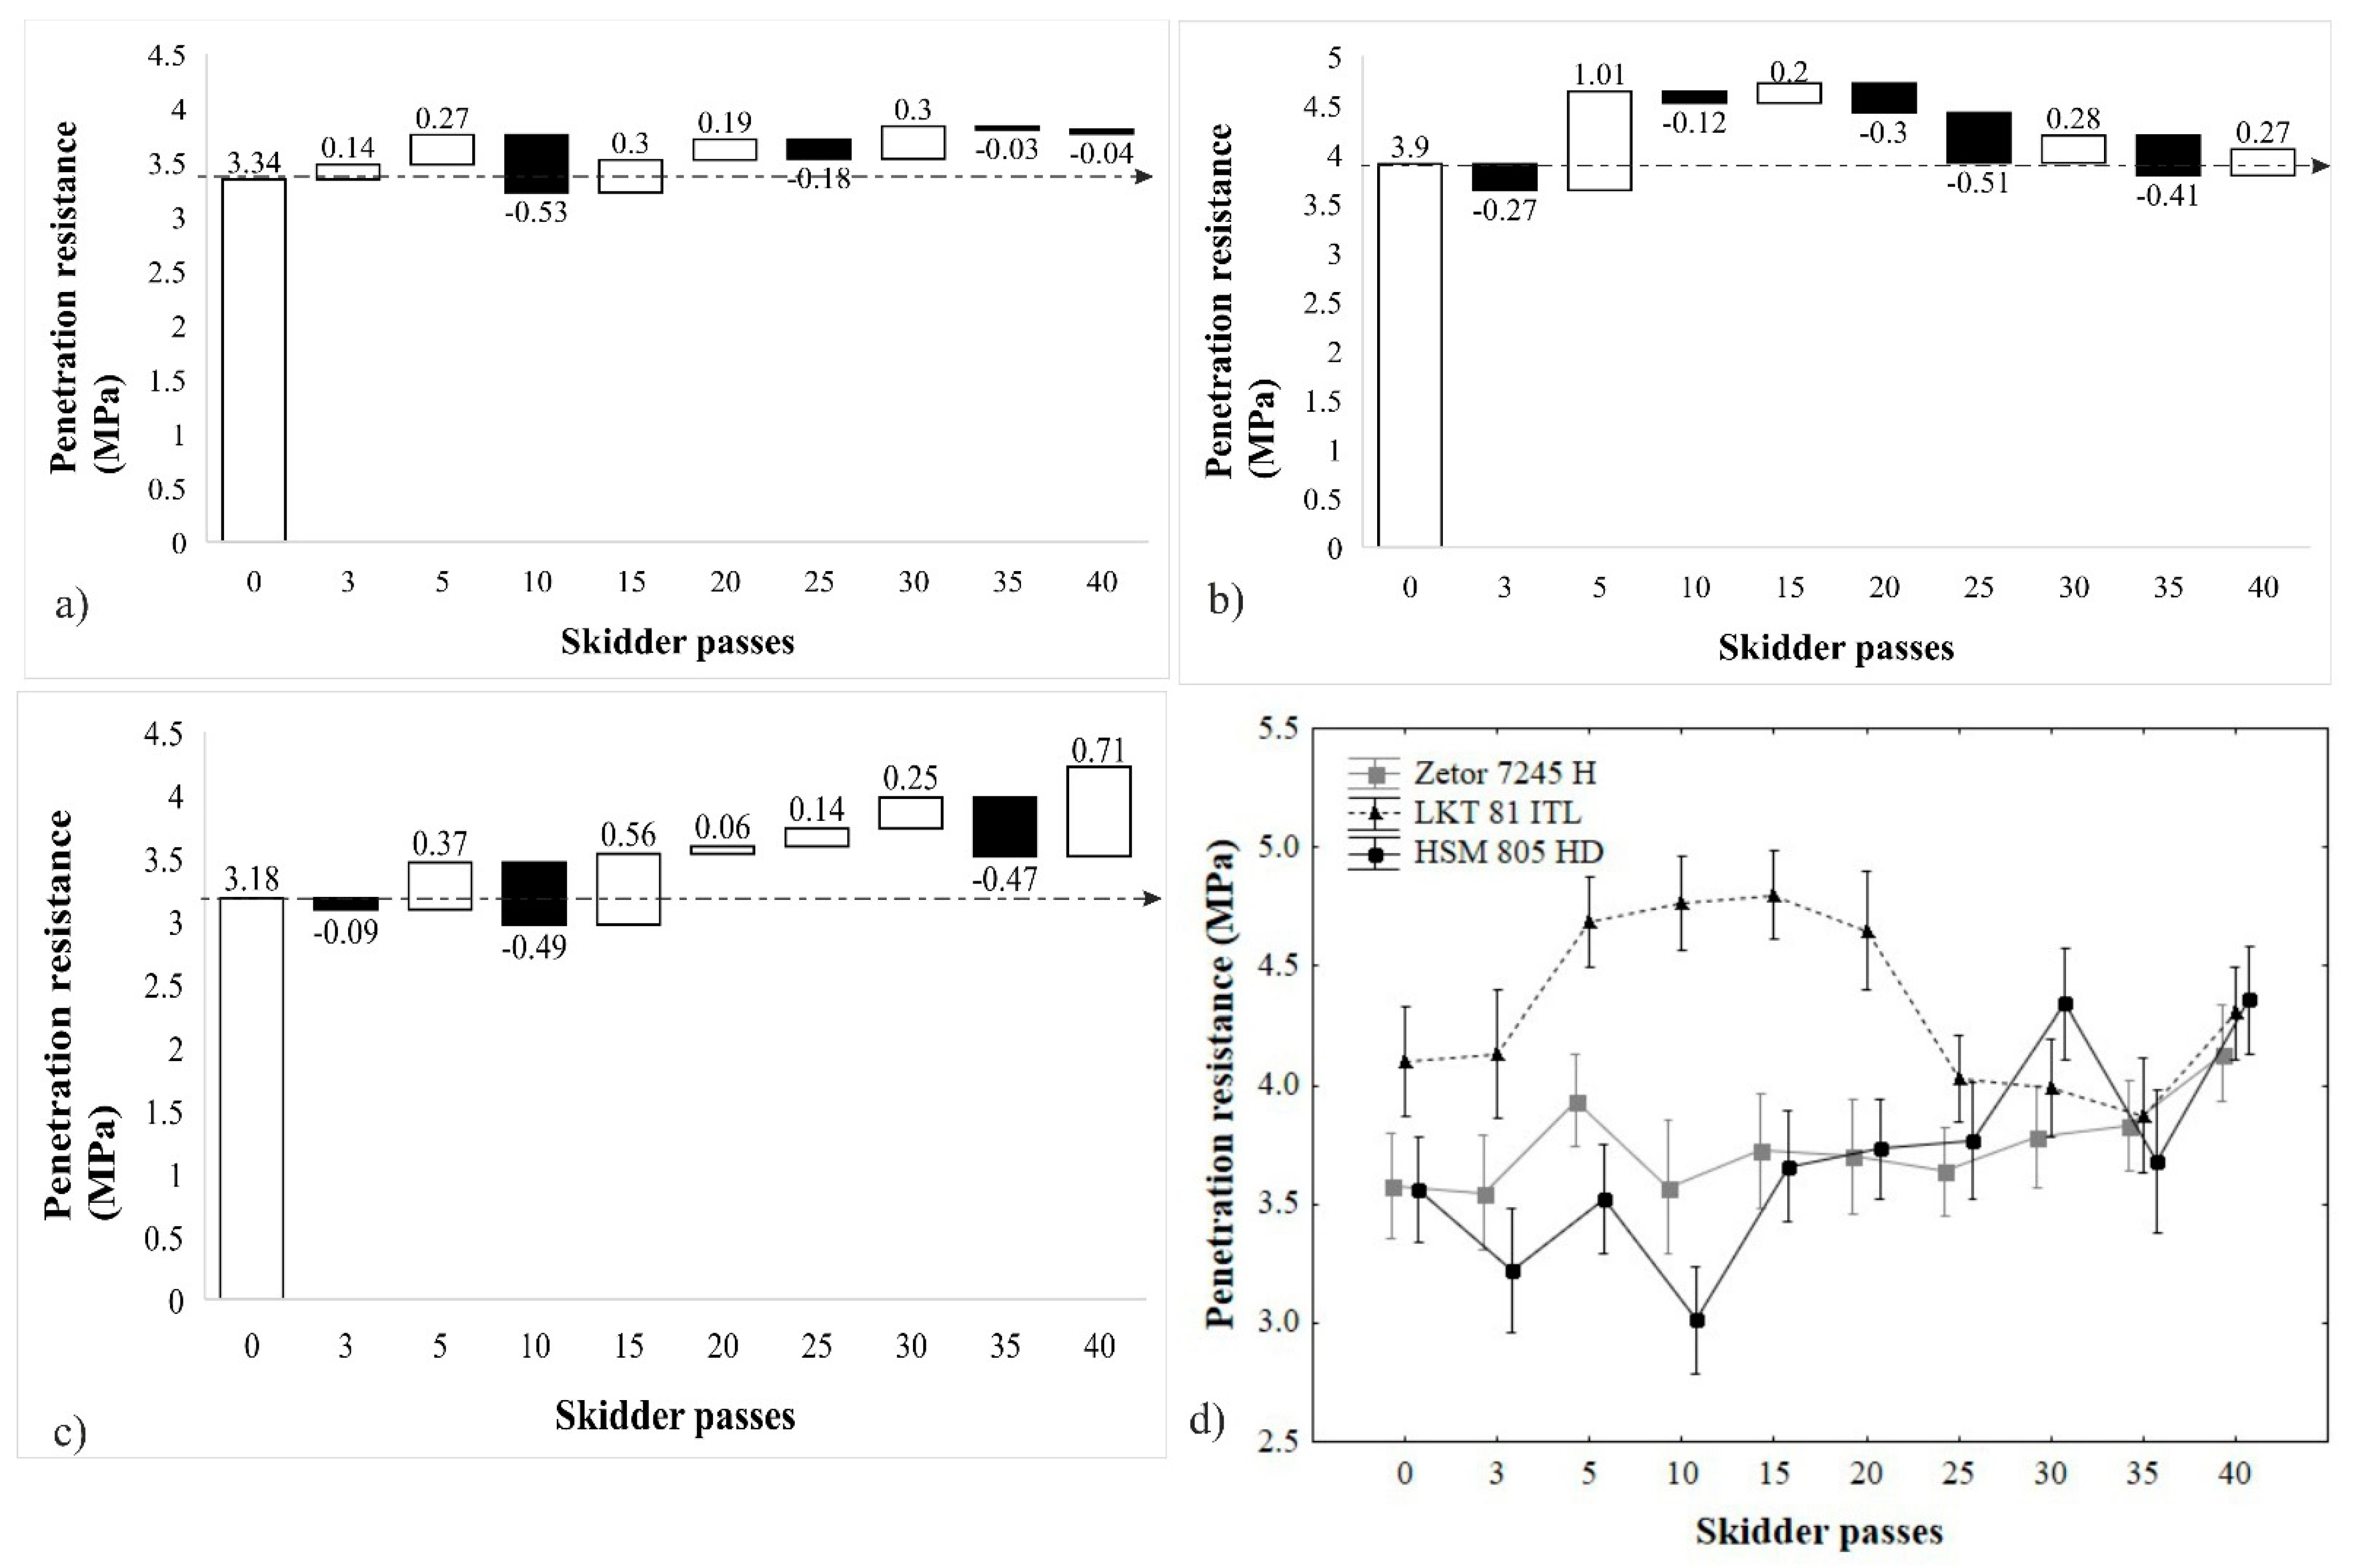
In our case, the maximal P.R. values (3.83–4.72 MPa) were reached after 15–40 machine passes (depending on the machine). Considering the P.R., [
18] state that the resistance of undisturbed sandy forest soils ranged between 0.24 and 0.36 MPa in the surface layer and between 2.46 and 2.51 MPa in the 80 cm depth. In our case, the resistance of undisturbed soil to penetration ranged between 3.18 and 3.90 MPa. Reichert et al. [
38] state that forest harvesting operations performed by a Caterpillar 525 on the clay soils found at the 17-year-old
Pinus taeda plantation in Brazil caused a maximal PR of 2 MPa after three machine passes.
We observed similar behavior: the most substantial increase in P.R. was observed in the top 10 cm layer and the 11 to 20 cm layer (28.7–43.30%). In the study [
39], the authors observed the effects of harvester traffic on the P.R. in North Idaho and found that machine traffic caused a significant change in P.R. in all depths in the 10–30 cm interval. The most substantial P.R. increase was observed in the top 10 cm soil layer, followed by the 11–20 cm interval and the 30 cm depth interval. Authors [
40], citing ANOVA results, also claim that the number of machine passes affects P.R. Besides machine traffic, the penetration depth is an important factor in considering P.R. Researchers [
23] state that depth explains 27% of the P.R. variability. In our case, P.R. and depth showed a moderately strong relationship (r = 0.33–0.55). Similarly, [
29] states that the number of passes, the penetration depth, and the interaction of said factors significantly affect the P.R. values.
5. Conclusions and Recommendations for Forest Management
This study described the changes of soil B.D. and P.R. at a differing number of skidder passes. The results showed that despite the substantial differences in masses of the machines, the soil compaction that the traffic caused was similar. Weight class affected the rate at which the top layers of soil were compacted but not the level of compaction. The limiting factor was the number of machine passes. Methods based on observing the changes in the soil B.D. in the surface soil layers appear to be efficient at evaluating the environmental effects of harvesting operations in terms of soil disturbance. The results of observations based on P.R. proved statistically significant differences in soil disturbance caused by the particular skidders, though they appear relatively challenging to interpret, as confirmed by Tukey’s test. The test proved that the method is susceptible to soil skeleton content, penetration depth, and other organic material (e.g., roots), typical for forest soils. The influence manifested mainly in the high share of unsuccessful measurements, where the prescribed penetration depth (>20 cm) could not be achieved. Said disadvantages of the method favor its use in agriculture and soils with lower root densities or skeleton content. The study focused on providing a comprehensive view of the effects of skidder technologies on the changes of soil characteristics in Western Carpathians. Our results document the effects of various factors affecting the extent of soil disturbance and the advantages and disadvantages of particular methods used in the study.
To improve the management of forest operations and the sustainability of forest management, we added the following recommendations.
The results achieved on silt loam Cambisols show that the mass of the skidder affects the trend of B.D. increase. However, the differences between the categories decrease with the increasing number of machine passes. Lighter machines, which can be used in less intensive management systems, can cause compaction similar to machines that are three times heavier with more passes over the soil surface.
Soil moisture content had statistically significant effects on Cambisol pedocompaction at particular machine passes. To minimize the effects of said factor, forest managers should plan harvesting operations for periods with minimal precipitation or minimize the number of passes over a single trail in these conditions by optimizing the density of the skid trail network. Observing the moisture content in practice is relatively simple. However, the managers need to set the moisture content limits for particular soil types and textures to optimize the harvesting operations.
Using B.D. measurements as a means of optimizing the pedocompaction is laborious and time-consuming. However, it provides relevant and interpretable results. Using P.R. can seem relatively less time-consuming and laborious; however, the method produces relevant and consistent data, primarily for soils with a low skeleton content.


