Article

Metabolome and Transcriptome Analyses Reveal Different Flavonoid Biosynthesis and Chlorophyll Metabolism Profiles between Red Leaf and Green Leaf of Eucommia ulmoides

1
Paulownia R&D Center, Chinese Academy of Forestry (CAF), Zhengzhou 450003, China
2
College of Forestry, Henan Agricultural University, Zhengzhou 450002, China
3
Key Laboratory of Non-Timber Forest Germplasm Enhancement & Utilization of National Forestry and Grassland Administration, Zhengzhou 450002, China
*
Author to whom correspondence should be addressed.
Forests 2021, 12(9), 1260; https://doi.org/10.3390/f12091260
Submission received: 19 August 2021 / Revised: 2 September 2021 / Accepted: 12 September 2021 / Published: 16 September 2021
(This article belongs to the Section Genetics and Molecular Biology)

Abstract

:
Flavonoids are natural antioxidants in plants that affect the color of plant tissues. Flavonoids can be divided into eight subgroups, including flavonols, anthocyanins, and proanthocyanidins. The mechanisms of flavonoid synthesis in model plants have been widely studied. However, there are a limited number of reports on the synthesis of flavonoids in the red leaf varieties of woody plants. In this study, we combined morphological observation, pigment content determination, metabolomics, and transcriptomics to investigate the metabolites and gene regulation present in the red and green leaves of Eucommia ulmoides Oliv. The results showed that the red leaves have a lower chlorophyll content and a higher anthocyanin content. Metabonomic analysis identified that the relative content of most flavonoids is up-regulated in red leaves based on UPLC-ESI-MS/MS, which included the apigenin class, quercetin class, kaempferol class, and procyanidins. Transcriptome data suggested that the differentially up-regulated genes are enriched in flavonoid and anthocyanin synthesis pathways, ABC transport, and GST pathways. The integrative analysis of the transcriptome and metabolome showed that the up-regulation of flavonoid metabolism and a high expression of chlorophyll degradation with the down-regulation of chlorophyll biosynthesis genes are detected in E. ulmoides red leaves compared with green leaves. In addition, the co-expression networks implied that cyanidin 3-5-O-diglucoside, EuDR5, EuPAL2, EuDFR11, Eu3MaT1, and EuF3′H are likely associated with the red leaf coloration of E. ulmoides. In summary, this research provided a reference for studying the mechanism of red leaf coloration in woody plants and the use of E. ulmoides red leaves as feedstock for bioactive products.

1. Introduction

Eucommia ulmoides is native to China and has been extensively cultivated across 27 provinces (24°50′–41°50′ N, 76°00′–126°00′ E) because of its high economic value and adaptability [1]. E. ulmoides leaf extract is a kind of herbal medicine and potential feedstock for bioactive products, which are used as animal feed additives [2,3,4]. Pharmacological experiments have shown that E. ulmoides leaf extract has antioxidation activity [5]. The flavonol glycosides extracted from E. ulmoides leaves display glycation inhibitory activity [6]. Flavonoids are important antioxidants and highly concentrated in E. ulmoides leaves [7]. Most flavonoid concentrations peak in growing leaves, reaching the peak concentration in growing green leaves [8]. A total of 13 flavonoids were identified in green E. ulmoides leaves using ultraperformance liquid chromatography–tandem quadrupole time-of-flight mass spectrometry (UPLC-Q-TOF-MS) detection [9]. Furthermore, the mass fraction of the total flavonoid content in E. ulmoides red leaf extract reached 1.7%, which was significantly higher than that in the green leaf variety [10].
Flavonoids, a group of natural substances, are well known for their beneficial effects on health and their use as natural antioxidants [11]. Flavonoids are a large family with variable hydroxylated polyphenolic structures, which are divided into the following subgroups: flavones, flavonols, flavanones, flavanonols, flavanols or catechins, anthocyanins, and chalcones [12]. The anthocyanin synthesis pathway shares the same upstream enzymatic steps with proanthocyanidin and flavonoid biosynthesis pathways [13,14,15]. The metabolism and molecular regulation of the flavonoid biosynthesis pathway have been well described in Arabidopsis thaliana [16,17]. First, phenylalanine, as a substrate, is catalyzed by phenylalanine ammonia-lyase (PAL), cinnamic acid 4-hydroxylase (C4H), and 4-coumaric acid:CoA ligase (4CL). Then, chalcone synthase (CHS) is the first committed enzyme in the biosynthesis of all flavonoids. Chalcone isomerase (CHI), flavanone 3-hydroxylase (F3H), flavonoid 3′,5′-hydroxylase (F3′5′H), flavonol synthase (FLS), and dihydroflavonol 4-reductase (DFR) are activated successively. Anthocyanidin reductase (ANR) catalyzes the NADPH-dependent reduction of anthocyanidin to epicatechin for the formation of proanthocyanidins. Anthocyanidin synthase (ANS) activates the switch of the compound to the anthocyanin biosynthesis pathway. Anthocyanidins can be modified into other forms of anthocyanins owing to the secondary glycosylation, acetylation, and methylation [18]. In addition to genes, transcription factors (TFs) also play important roles in flavonoid biosynthesis [19]. The key TFs, including MYBs, basic helix-loop-helix (bHLH) and WD40 proteins, can regulate the expression of flavonoid synthesis genes [20]. However, the flavonoid synthesis mechanism in red leaves of woody plants is more complicated and less well understood [21].
Anthocyanins, which belong to the flavonoid group, are natural pigments in plant tissues, including the leaves, stems, flowers, and fruits, contributing to red, pink, purple, and blue colors [22,23]. In the pink flowers of tea (Camellia sinensis), metabolites such as cyanidin 3-O-glucoside, petunidin 3-O-glucoside, and epicatechin gallate were identified using ultraperformance liquid chromatography–electrospray ionization–tandem mass spectrometry (UPLC-ESI-MS/MS) detection [24]. In red poplar leaves, several anthocyanins were identified by researchers, including cyanidin, cyanidin 3-O-glucoside, delphinidin 3-O-sambubioside, and delphinidin 3-O-glucoside [25]. Compared with fruits and flowers, there are few studies on anthocyanins in leaves, which limits the study of the mechanisms of leaf coloration.
E. ulmoides “Huazhong No. 12” (H12) is a variety whose leaves express an obvious red color in summer and autumn. Previous work on the red leaves of E. ulmoides suggested that enriched anthocyanin is the main cause of leaf color formation. The main factors determining the anthocyanin content are PAL enzyme activity, temperature, pH value, and light [26]. Transcriptome analysis of red leaves and green leaves of E. ulmoides showed that two MYB, one bHLH, one F3H, one F3′5′H, five DFR, and nine GT (glucosyltransferase)genes involved in the flavonoid biosynthesis and anthocyanin biosynthesis pathways might be related to the formation of red leaves. Nonetheless, we still do not know which anthocyanins cause red E. ulmoides leaves. The ratio of anthocyanins to chlorophyll is also important for determining whether the leaves will be red or green [27,28]. The chlorophyll II synthesis pathway of the angiosperm consists of three parts: chlorophyll synthesis, the chlorophyll cycle, and chlorophyll degradation [29]. In previous studies on the formation of red E. ulmoides leaves, the chlorophyll metabolism pathway was not analyzed.
Here, we combined the metabolome with the transcriptome to analyze the differentially expressed metabolites (DEMs) and differentially expressed genes (DEGs) in H12 (red leaves) and E. ulmoides “Huazhong No. 11” (H11, green leaves). The purpose of the present study was to reveal the metabolic pathways and candidate genes related to red leaf coloration in E. ulmoides. What are the differences between the red and green leaves of E. ulmoides at the transcriptome and metabolome level? To figure out these problems, integrative analysis of the transcriptome and metabolome was performed. Our results revealed the accumulation of a set of flavonoid metabolites (flavones, flavonols, anthocyanins, isoflavones, dihydroflavonols, chalcones, proanthocyanidins) accompanied by the regulation of structural genes in the flavonoid biosynthesis and anthocyanin biosynthesis pathways of E. ulmoides. This would provide a reference for the future study of woody plant leaf coloration and the use of flavonoids in red E. ulmoides leaves.

2. Materials and Methods

2.1. Plant Materials and Growth Conditions

The grafted seedlings of H12 (red leaves) and H11 (green leaves) were selected (Figure 1a), and typical leaves with stable red coloration were collected as materials on July 2018 (Figure 1b). The plantlets were preserved at the Yuanyang experimental site (North latitude 34°78′; East longitude 113°71′) and were grown under the same environmental conditions as the controls. The leaves for the metabolome study, transcriptome sequencing, and RT-qPCR validation were quickly frozen in liquid nitrogen and stored at −80 °C. Three biological replicates were collected per sample.

2.2. Leaf Pigment Content Determination

The chlorophyll and carotenoid contents of the H12 and H11 leaves were determined using the direct extraction method [30]. The leaves were weighed to 0.1 g (accurate to 0.01 g) after removing the veins, and 80% acetone was added to reach a volume of 10 mL. The supernatant was extracted after 72 h in darkness. The absorbance values at 445, 644, and 662 nm were determined using an ultraviolet spectrophotometer (JINGHUA Instruments 752, Shanghai Jinghua Technology Instruments Co., Ltd., Shanghai, China). The anthocyanin content was determined. Samples of 0.1 g (accurate to 0.01 g) were ground in 10 mL of 1% HCL methanol solution for 4 h and centrifuged for 15 min at 3500× g. The supernatant contents were determined at 530 nm and 600 nm. The calculation formula was as described in a previous paper [10].

2.3. Metabolite

The extraction and separation of leaf samples, metabolite identification, and quantification were done at MetWare Biotechnology Co., Ltd. (Wuhan, China) [31]. The freeze-dried leaf samples of H11-1, H11-2, and H11-3 (green leaves) and H12-1, H12-2, and H12-3 (red leaves) were crushed. A total of 100 mg of the resulting powder was dissolved in 1.0 mL of 70% aqueous methanol solution and extracted overnight at 4 °C. The extract was then centrifuged, adsorbed, and filtered before the ultraperformance liquid chromatography–mass spectrometry (UPLC-MS) analysis. Next, the UPLC-MS equipment was connected to an electrospray ionization (ESI)-triple quadrupole-linear ion trap–mass spectrometry/MS system (Q TRAP-MS/MS, Applied Biosystems 6500 Q TRAP) in this experiment. The characteristic ions of each metabolite were screened through the triple quadrupole (QQQ) mass spectrometer. In this method, the quadrupole first selected the parent ions (Q1) of the target substance with a regular molecular weight. The parent ions were ionized in the collision chamber and then fragmented. The fragment ions were screened through the QQQ to obtain target characteristic fragments (Q3). The non-target ions were eliminated to prevent interference. Next, the mass spectrum peaks detected in different samples of each metabolite were manually corrected to ensure data accuracy. Then, supported by the Metware database and the public database of metabolite information, metabolites were identified based on their mass spectra information, including parent ions (Q1), characteristic fragments (Q3), molecular weight, and retention time. The relative contents of corresponding metabolites were represented by the integrals of the chromatographic peak area, which were calculated and corrected using MultiQuant (version 3.0.2) [32]. In addition, partial least squares discriminant analysis (PLS-DA) was used to maximize the metabolite differences between two groups of samples. The variable importance in projection (VIP) of ≥1 and fold-change of ≥2 or ≤0.5 were used as screening criteria [33]. The heatmaps of metabolite differences between H11 and H12 leaves were created by TBtools software [34].

2.4. RNA-Seq

The total RNA of each sample was extracted using a SuperPure plant polyRNA rapid extraction kit (GeneAnswer). RNA concentration and purity were determined using a NanoDrop 2000 spectrophotometer (Thermo Fisher Scientific, Wilmington, NC, USA) and the Bioanalyzer 2100 system (Agilent Technologies, Santa Clara, CA, USA), respectively. RNA integrity was validated using 1% agarose gel electrophoresis. Then, RNA-seq libraries were prepared for sequencing at Majorbio Technology Co., Ltd. (Shanghai, China). The Illumina Novaseq 6000 platform was used for transcriptome sequencing. Raw reads were filtered to obtain high-quality reads. The clean reads were aligned with the reference genome using Hisat2 software (version 2.1.0) [35]. After each sample was spliced using StringTie software (version 1.3.3b), the expression levels of genes and transcripts were quantified using RSEM software (version 1.3.1), and the quantitative index was expressed in fragments per kilobase of exon model per million mapped fragments (FPKM) [36]. The annotation of the genes and transcripts was performed on public databases, including Nr, COG, KEGG, and Swiss-Prot. Differentially expressed genes (DEGs) were determined using DESeq2 (version 1.24.0) by edgeR (version 3.24.3). DEGs met the criteria of |log2(fold-change)| ≥ 1 and corrected p ≤ 0.05. All the DEGs were analyzed for Gene Ontology (GO) enrichment using goatools (version 0.6.5) [37] and KEGG enrichment using KOBAS software (version 2.1.1). Then TFs were annotated into the PlantTFDB database. To find the candidate EuMYB and EubHLH TFs regulating flavonoid synthesis, all EuMYBs and EubHLHs were compared with Arabidopsis thaliana and combined with the expression data to speculate the possible transcription factors. Multiple sequence alignment of putative domain proteins was performed by MUSCLE (v3.8.31) using default parameters. Phylogenetic analysis was performed using BEAST (v2.6.2), and the maximum likelihood method with 10,000,000 bootstrap replicates was used [38].

2.5. Integrative Analysis of Metabolome and Transcriptome

Pearson correlation coefficients (PCCs) were applied to integrate metabolites and their corresponding genes. The DEMs and DEGs were selected as variants to generate nine quadrant diagrams. Black dashed lines divided each graph into nine quadrants. Each quadrant showed the different expression of metabolites and genes. For example, the third quadrant showed a positive correlation of metabolites and genes. Next, a co-expression network was presented to find the relationship between metabolites and genes. Each pair of metabolites and genes (PCC > 0.8, FDR < 0.01) was chosen to construct the network. The co-expression network was visualized by Cytoscape (version 2.8.2).

2.6. Real-Time Quantitative PCR (RT-qPCR) Validation

In total, 12 related genes were selected for RT-qPCR, and the primer lists are shown in Table S1. The SYBR Premix Ex TaqTM kit (TaKaRa, Japan) was used, and RT-qPCR expression assays were performed on a CFX96 platform (Bio-Rad, Foster City, CA, USA). The GADPH gene (EUC05716) was used as the relative quantitative reference gene. Three technical replicates were performed for each sample. The expression levels of the genes in the list were calculated using the 2ΔΔCt method [39]. The mean values ± standard deviations were determined.

3. Results

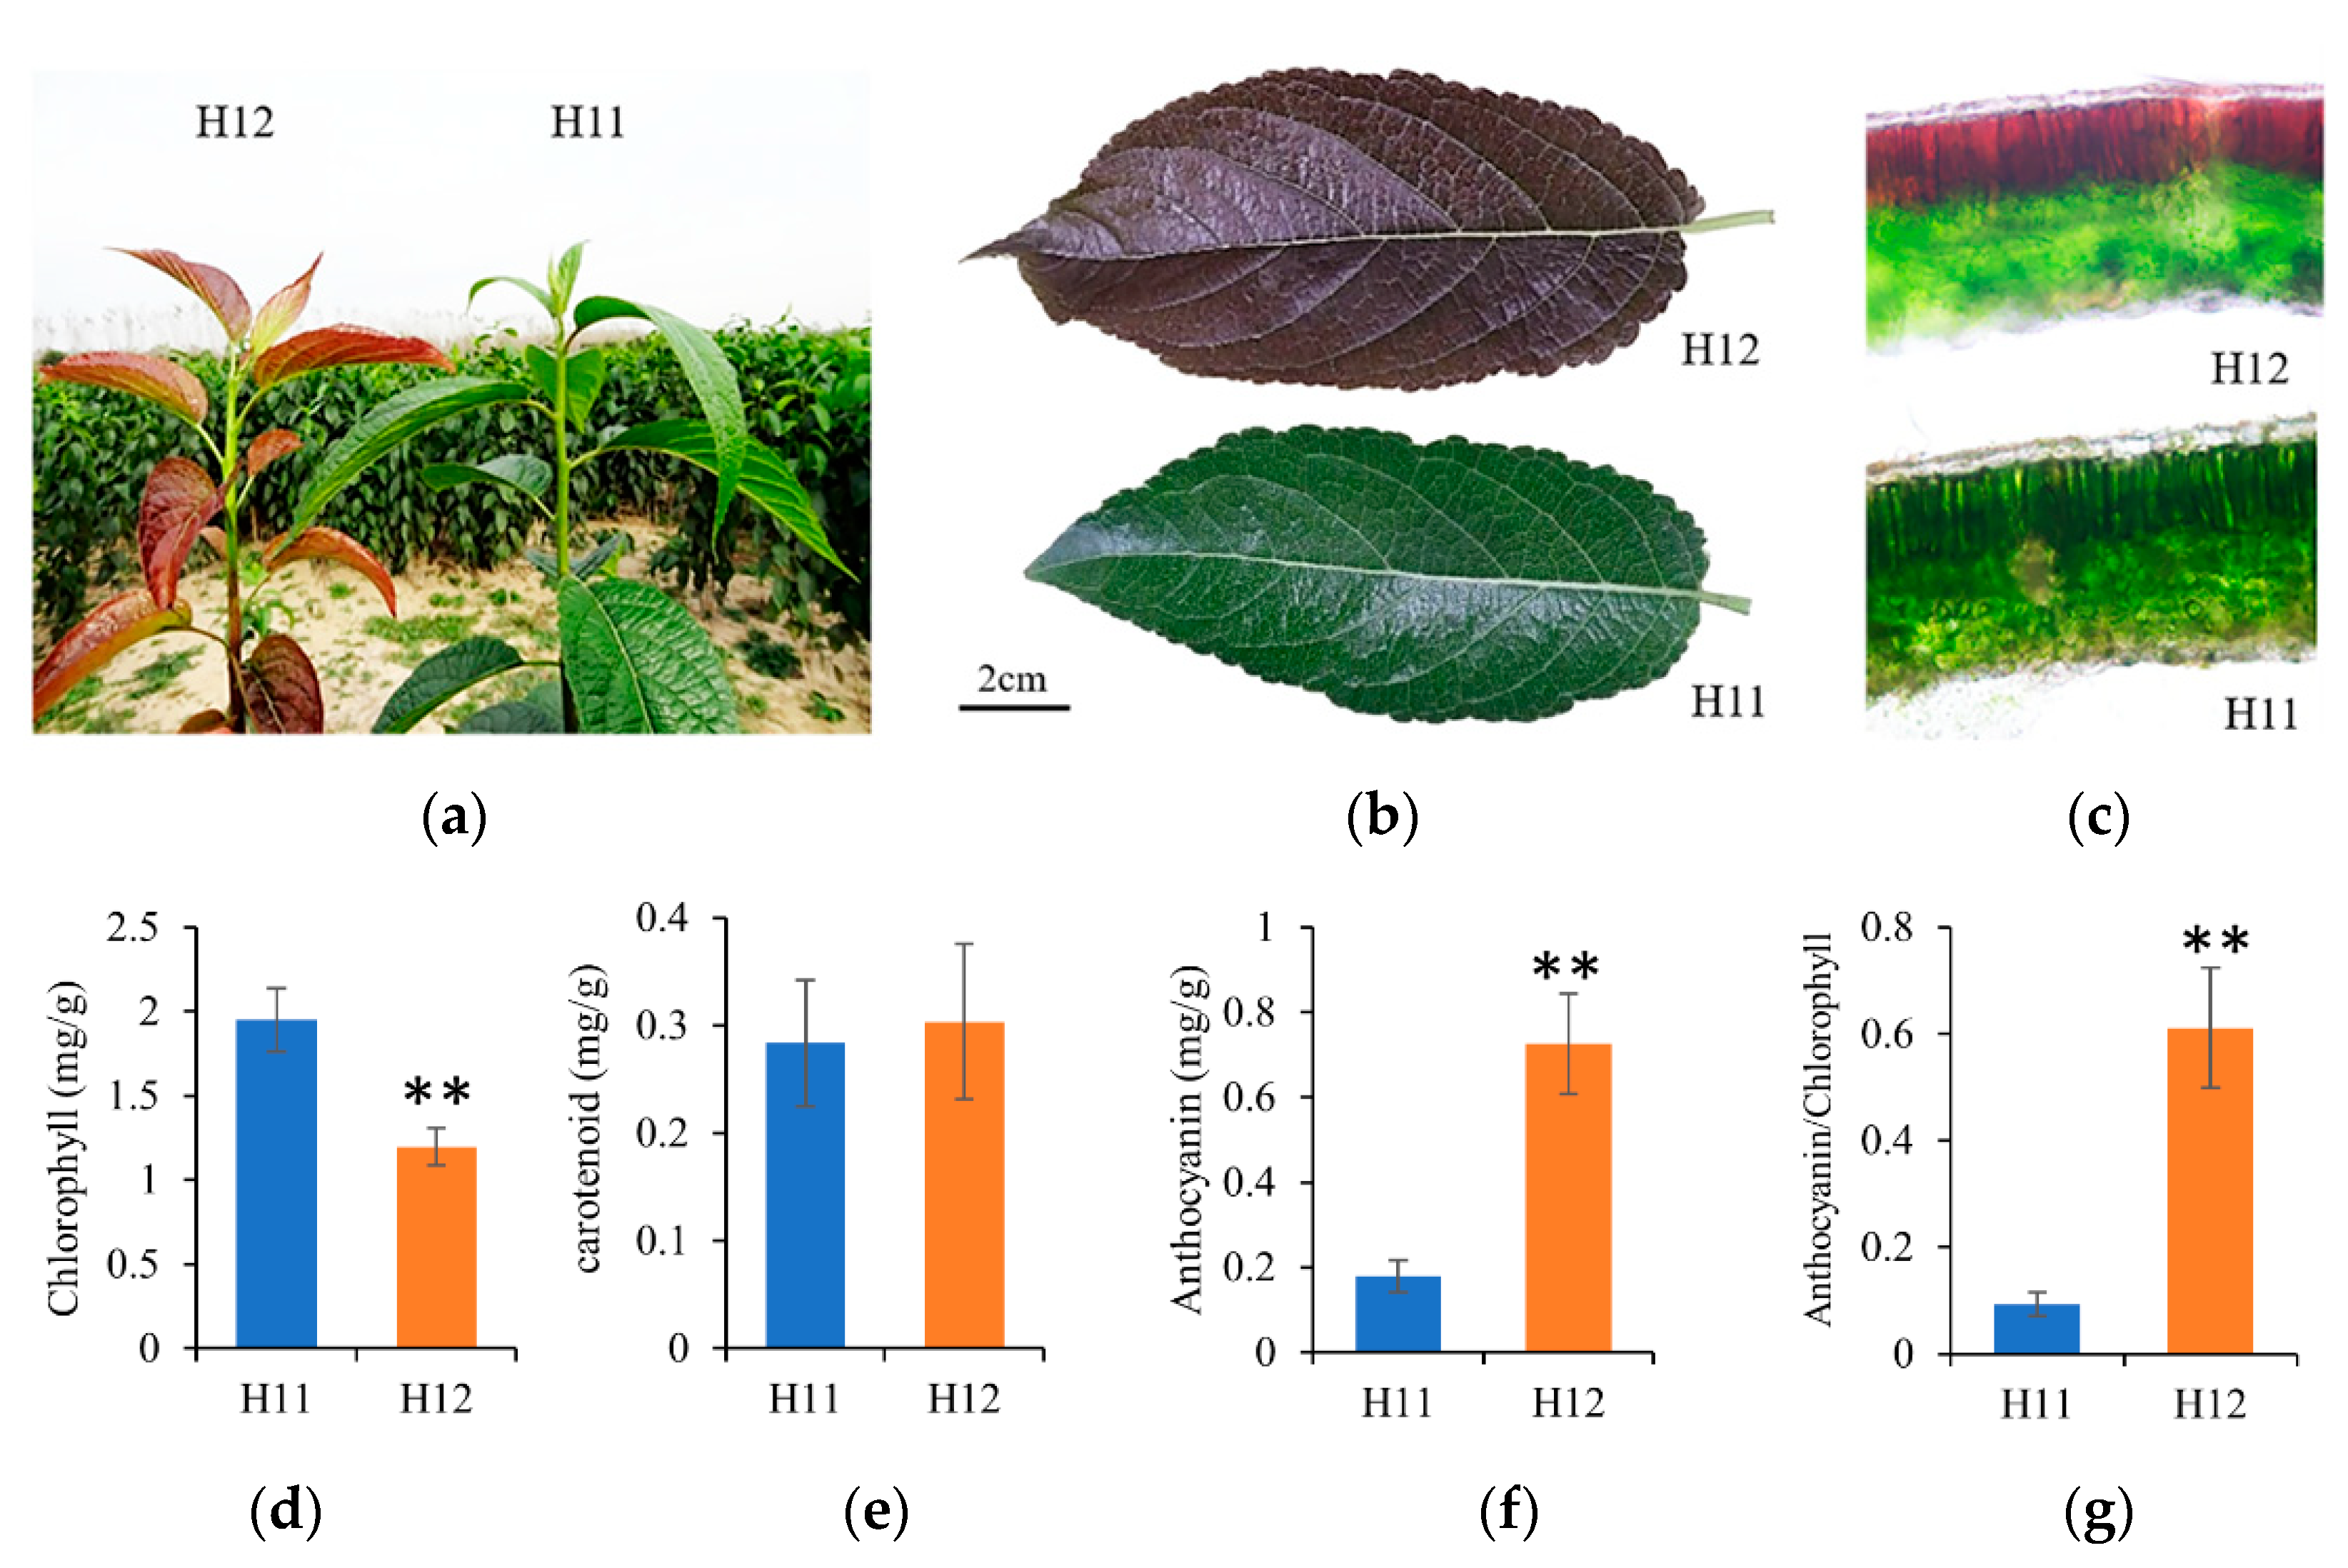
3.1. Photosynthetic Pigment and Anthocyanin Content of Leaves

The diversity of pigments primarily determines the plant leaf color. Our detection revealed that the chlorophyll, carotenoid and anthocyanin contents of H12 leaves were 0.61-, 1.07-, and 4.04-fold, respectively, compared with H11 leaves. The chlorophyll content of H12 was significantly lower than that of H11, while the anthocyanin content was significantly higher than that of H11. In addition, there was no significant difference in the carotenoid content between H11 and H12 (Figure 1d–f). The ratio of anthocyanins to chlorophyll of H12 was 0.61, while that of H11 was 0.09 (Figure 1g). The results suggested that a lower content of chlorophyll and a higher content of anthocyanin might be responsible for the redness of H12 leaves.

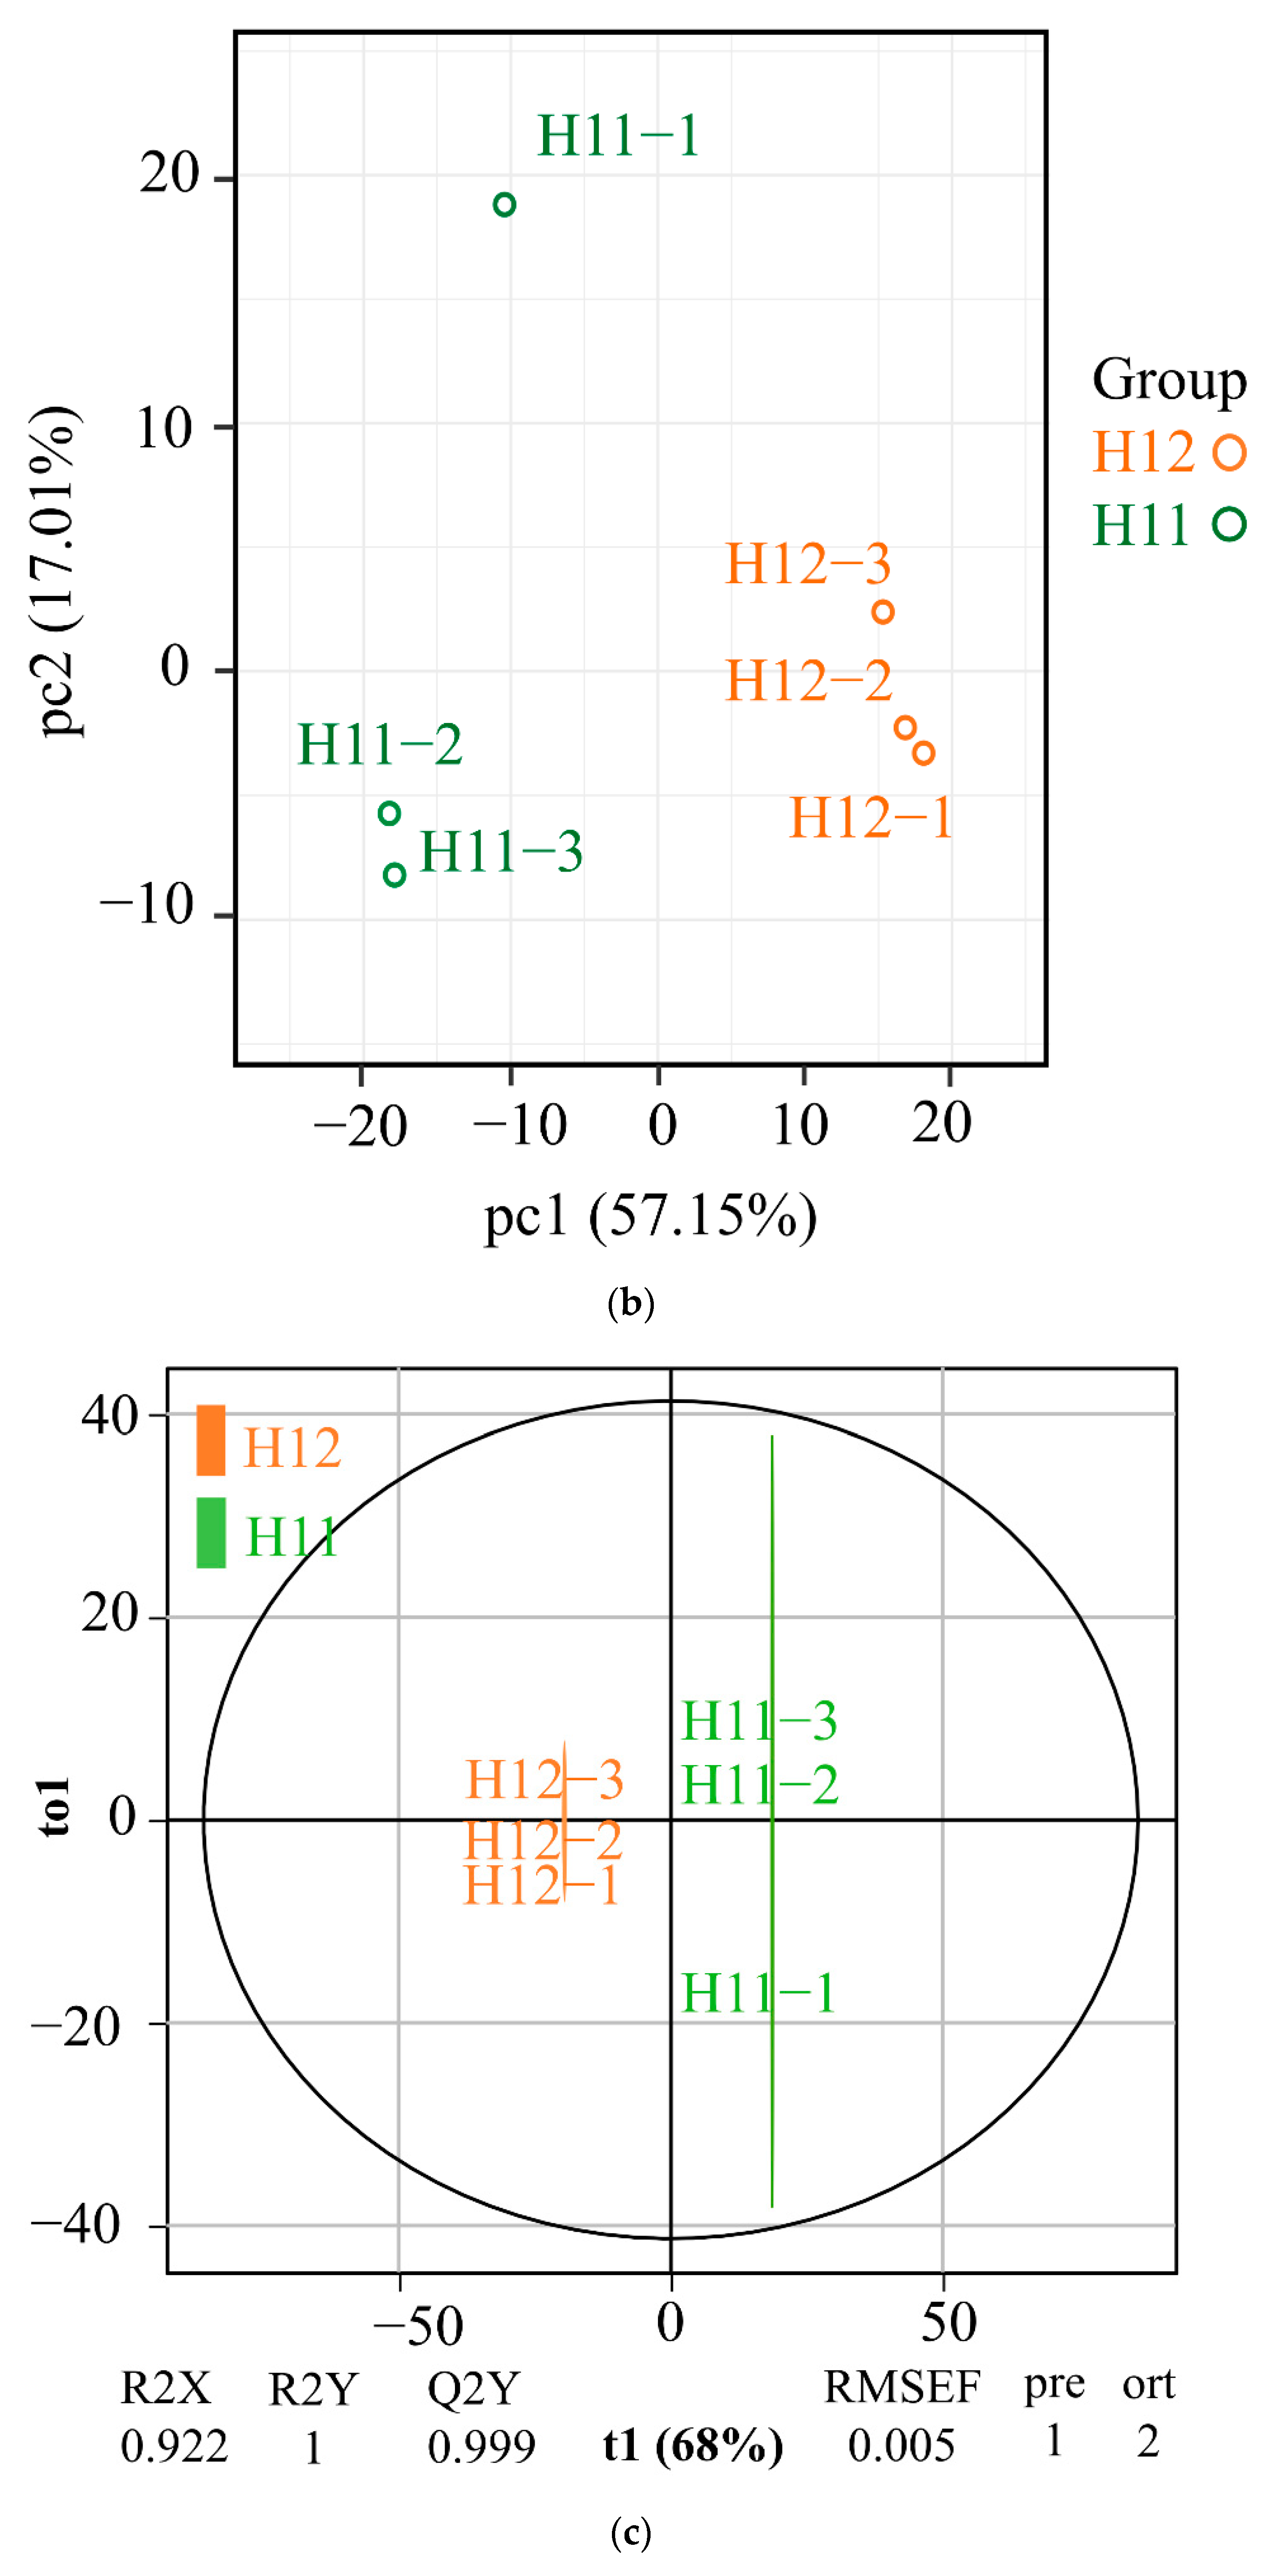
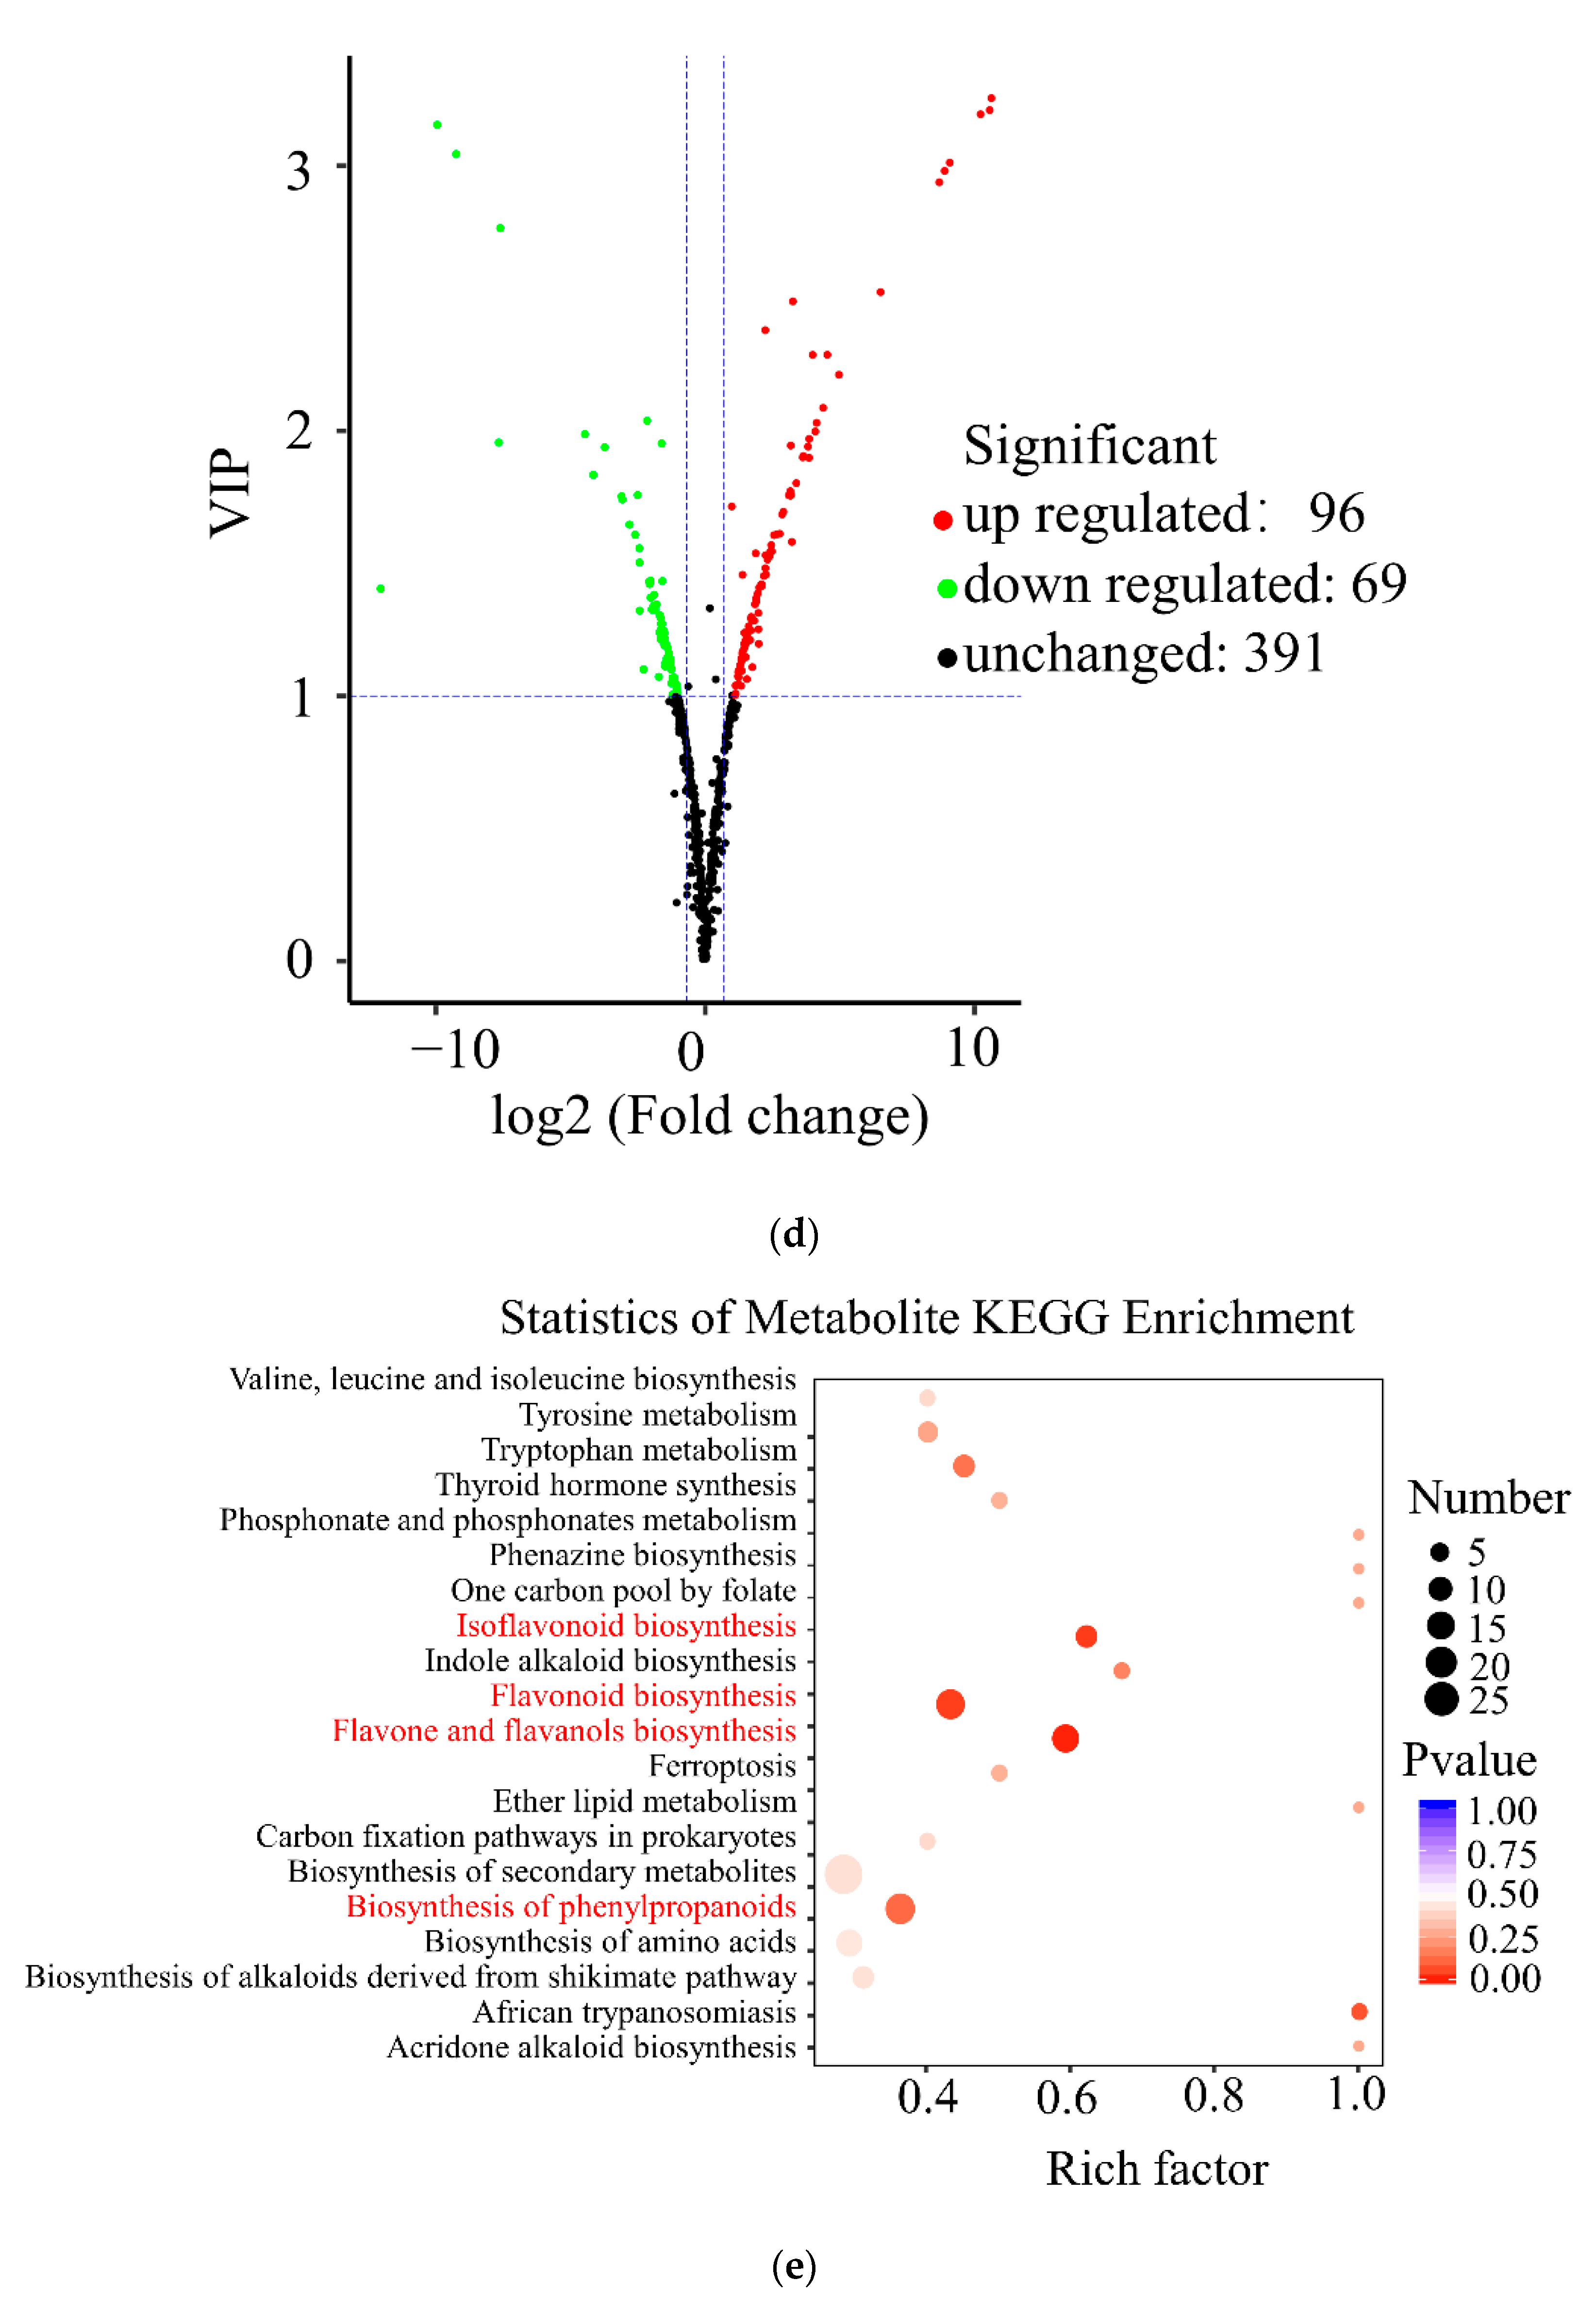
3.2. Metabolomics Analysis

For an overview of the metabolic profiling of red and green leaves, qualitative and quantitative analyses were further performed by UPLC-Q TRAP-MS/MS technology. The overlapping total ion current (TIC) curves of the quality control (QC) in different samples showed that the retention time and peak intensity were consistent, indicating the sample signal was stable (Figure S1). In this experiment, 556 metabolites were detected, including flavonoids, phenylpropanoids, phenols, lipids, amino acids, organic acids, nucleotides, and other substances (Figure 2a). Among these, a total of 14 anthocyanin metabolites were identified and their relative contents were analyzed, including cyanidin 3-O-glucoside, cyanidin 3-O-rutinoside, cyanidin 3,5-O-diglucoside, cyanidin 3-O-malonylhexoside, cyanidin O-syringic acid, delphinidin 3-O-rutinoside, delphinidin 3-O-rutinoside, peonidin O-hexoside, petunidin 3-O-glucoside, rosin din O-hexoside, malvidin 3-O-galactoside, and malvidin 3-O-glucoside (Table 1). The results showed that most of anthocyanins are highly accumulated in E. ulmoides red leaves.
Principal component analysis (PCA) was used to display the difference in metabolites between H12 and H11. The six samples from the two varieties were classified into two different regions of the PCA plot, indicating that the detected differences in metabolite profiles are related to the leaf color (Figure 2b). Simultaneously, the orthogonal partial least squares discriminant analysis (OPLS-DA) model was used to distinguish between H12 and H11 to the most extent (R2X = 0.922, R2Y = 1, and Q2 = 0.999). The Q2 value was more than 0.9, indicating this model is stable and accurate (Figure 2c). The OPLS-DA model was tested by permutation verification (n = 200). Then, we obtained the variable importance in project (VIP) value from the OPLS-DA permutation model. The volcano plots calculated the statistical significance of the difference between H12 and H11 (Figure 2d). Based on the criteria of VIP ≥ 1 and fold-change ≤ 0.5 or fold-change ≥ 2, 165 DEMs were screened. Among them, 96 and 69 metabolites were up-regulated and down-regulated, respectively, in H12 compared with H11. According to the results of different metabolites, the KEGG pathway was enriched (Figure 2e). KEGG pathway enrichment analysis revealed that four flavonoid-related pathways (phenylpropanoid biosynthesis, flavonoid biosynthesis, flavone and flavanol biosynthesis, and isoflavonoid biosynthesis) changed significantly in H12 compared with H11. In addition, the amino acid biosynthesis, tyrosine metabolism, and tryptophan metabolism pathways were also significantly enriched in H12 compared with H11.
A total of 165 DEMs were also classified into 14 categories. The majority of DEMs were classified into five categories, including flavonoids (67, 40.61%), amino acids and derivatives (19, 11.51%), organic acids (16, 9.70%), lipids (9, 5.45%), and nucleotides and derivates (7, 4.24%). More specifically, these flavonoids were further classified into 5 isoflavones, 22 flavones, 4 flavanones, 19 flavonols, 5 anthocyanidins, 2 proanthocyanidin, and other flavonoids. The heatmap analysis of flavonoids with relative contents showed that most of them are up-regulated in H12 (Figure S2a,b). Notably, this was the first time proanthocyanidins were detected in E. ulmoides red leaves. In addition, the contents of most amino acids, their derivatives, and organic acids were significantly down-regulated in H12 (Figure S2c). Taken together, about 29.68% of all detected metabolites showed significant differences in the content level. Flavonoids were the main differential metabolite, and their relative contents were most up-regulated in red leaves.

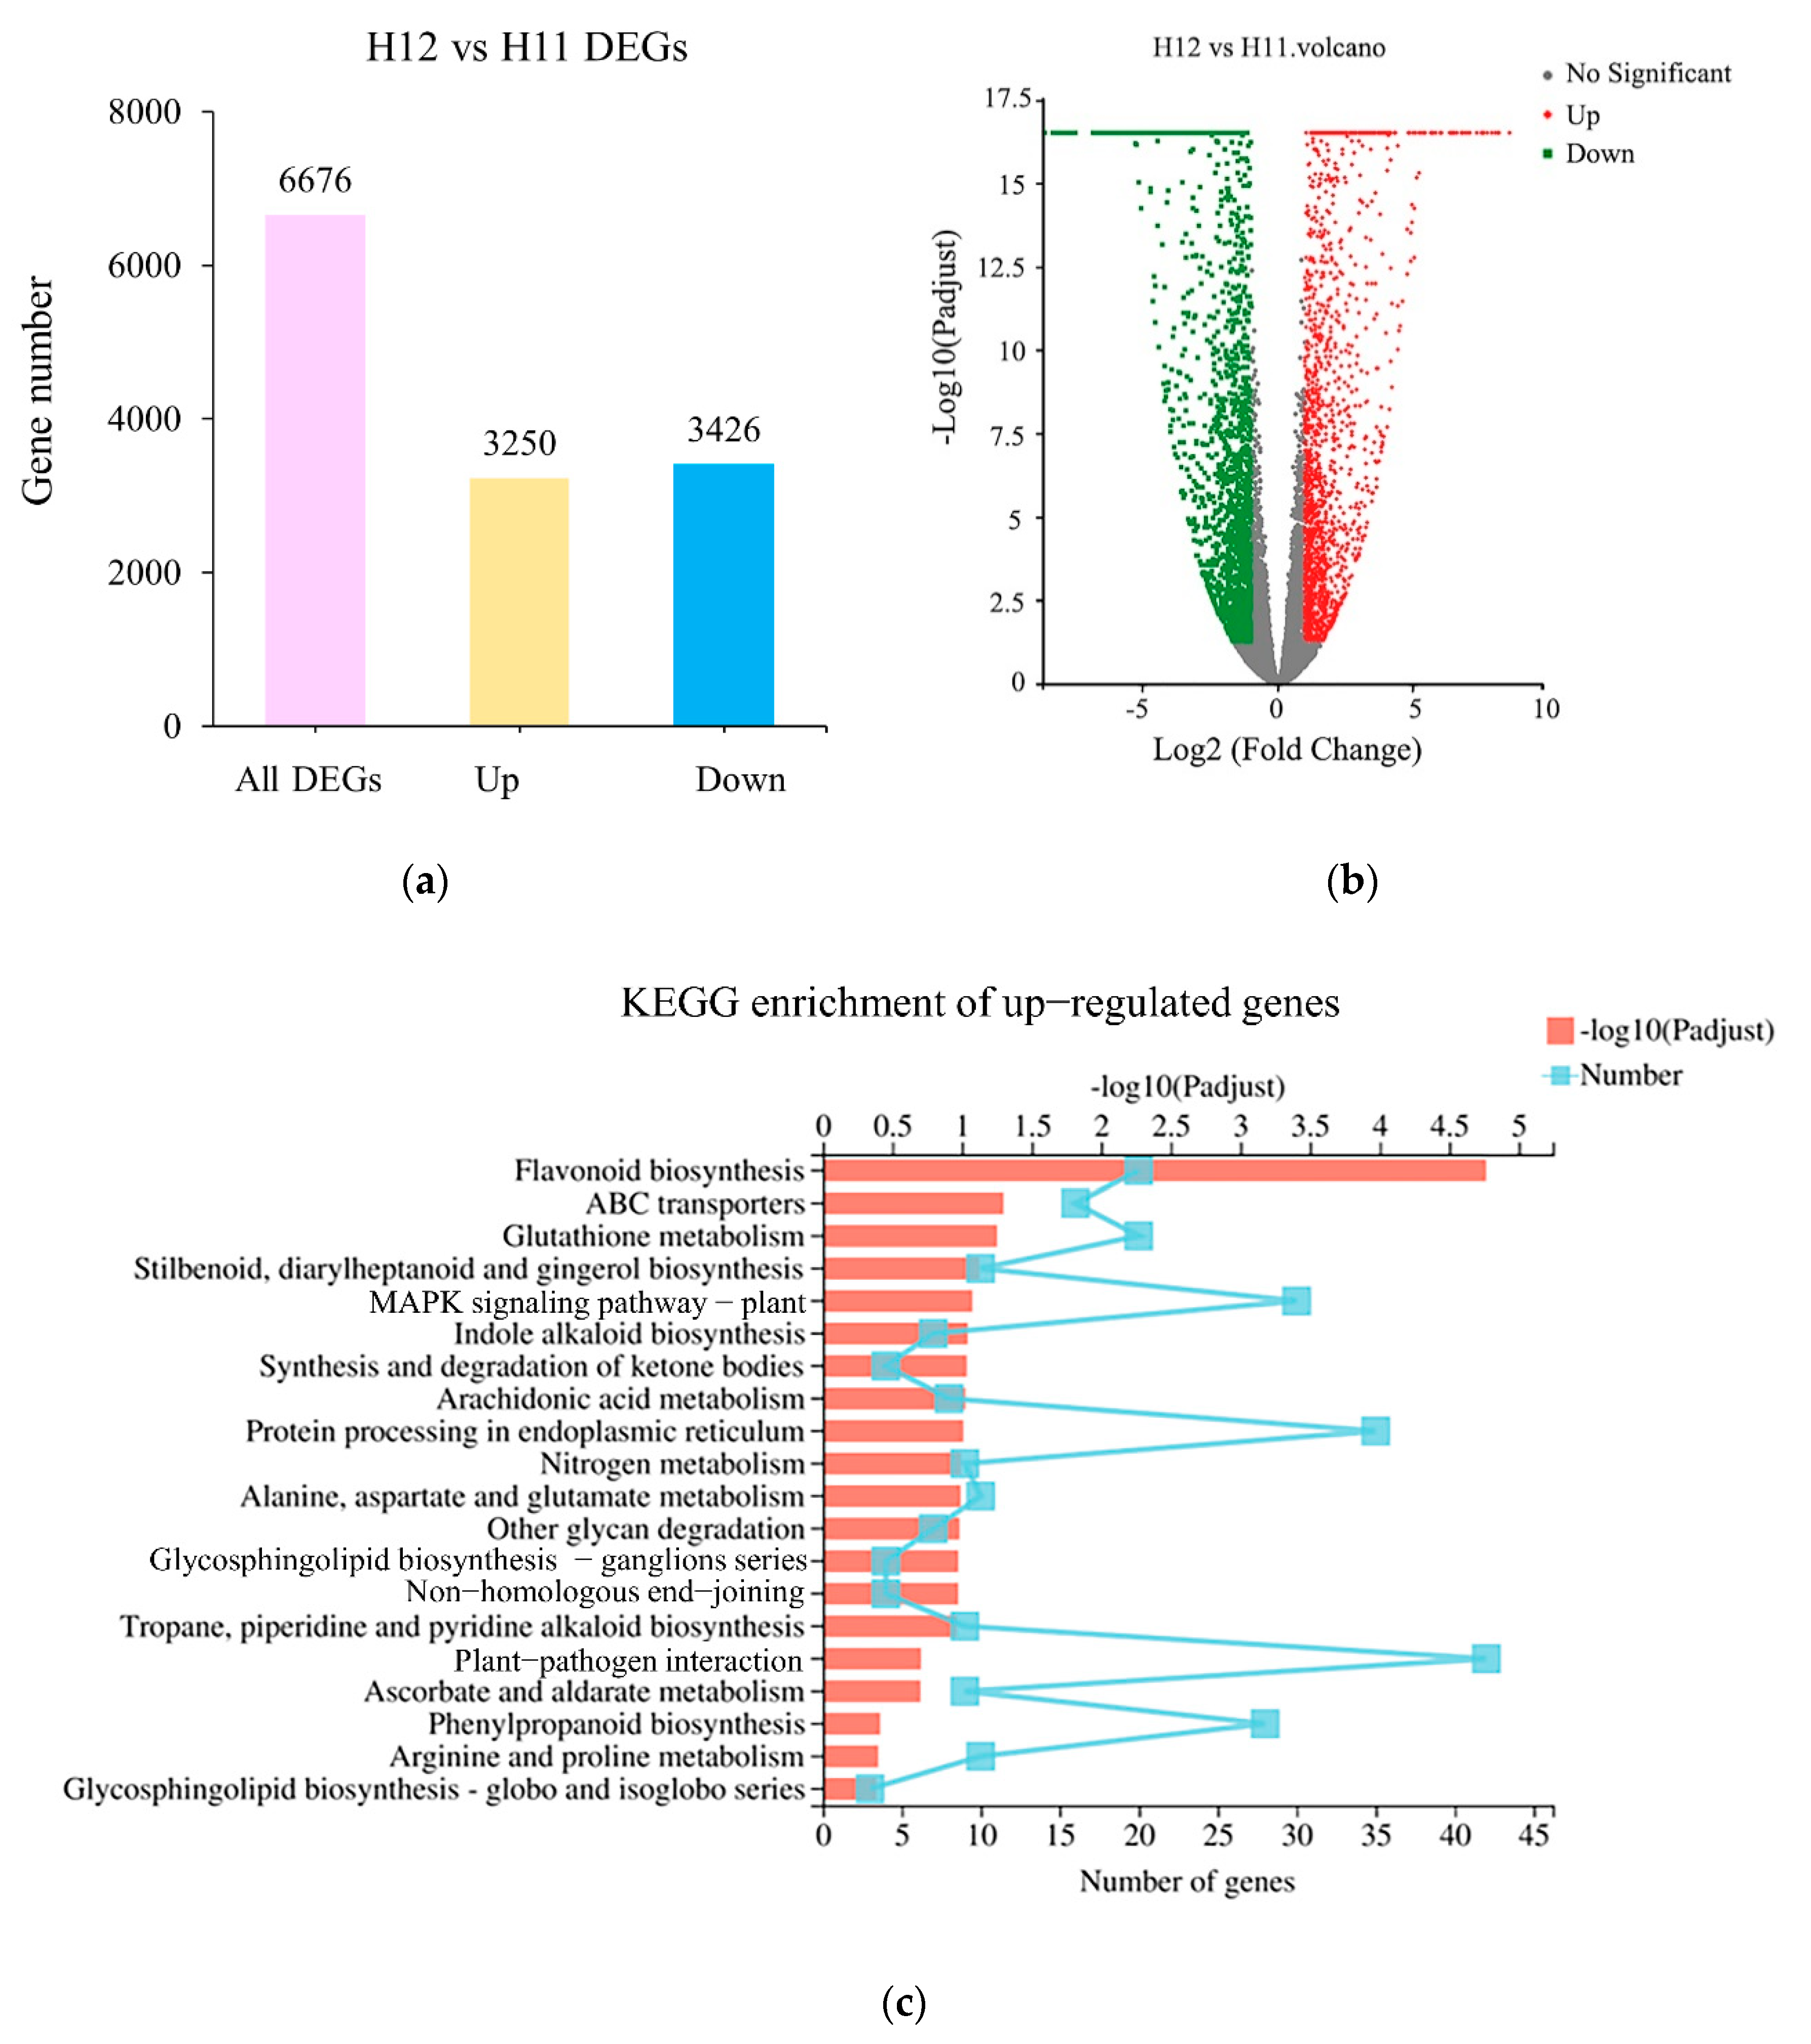
3.3. Transcriptome Analysis

To study the molecular basis of leaf coloration in E. ulmoides, transcriptome sequencing was performed on H11 and H12. The average H11 sample produced 60,047,905 clean reads, the base error distribution rate was 0.02%, and the GC content was 46.76%. The average H12 sample produced 59,423,610 clean reads, the base error distribution rate was 0.02%, and the GC content was 46.57%. The clean data have been submitted to the SRA database of the NCBI (accession IDs SRR12569328 and SRR12569327). The sequenced reads were compared with the reference genome of E. ulmoides (the BioProject accession no. of E. ulmoides genome sequencing at the NCBI is PRJNA357336). The average rates of total mapping for H12 and H11 were 95.53% and 95.36%, respectively. A total of 37,065 transcripts were then searched against protein databases as follows: 30,085 in Nr (81.17%), 23,520 in Swiss-Prot (63.46%), 22,519 in Pfam (60.76%), 29,271 in COG (78.97%), 14,793 in GO (39.91%), and 12,917 in KEGG (34.85%). Differentially expressed genes (DEGs) met the criteria of |log2(fold-change)| ≥ 1 and corrected p ≤ 0.005. In total, 6676 DEGs in H12 vs. H11 were identified, with 3250 genes up-regulated and 3426 genes down-regulated (Figure 3a,b).
GO annotation and KEGG pathway analysis were used to identify the biological functions of DEGs. The GO analysis annotated DEGs that mapped to the biological process, cell component, and molecular functional classes. Cellular process, cell part, and binding had the most genes involved in each GO category (Figure S3). The KEGG enrichment of DEGs reflected the differential metabolic processes of H11 and H12 during the same period in leaf tissues. The up-regulated genes showed the most significant differences in flavonoid biosynthesis, ABC transporters, glutathione metabolism, and phenylpropanoid biosynthesis pathways (Figure 3c). Notably, anthocyanin biosynthesis used phenylalanine as a substrate and shared the same upstream enzymatic steps as the flavonoid biosynthesis pathway. Anthocyanins were transported to vacuoles for storage by transporters, such as glutathione sulfur transferase (GST) and ATP binding box C family (ABBC) [40]. Therefore, the known results well supported our results of metabolic pathways enriched by up-regulated genes. The down-regulated genes were mainly enriched in starch and sucrose metabolism, cyanoamino acid metabolism, photosynthesis, porphyrin and chlorophyll metabolism, and unsaturated fatty acid biosynthesis pathways (Figure S4).

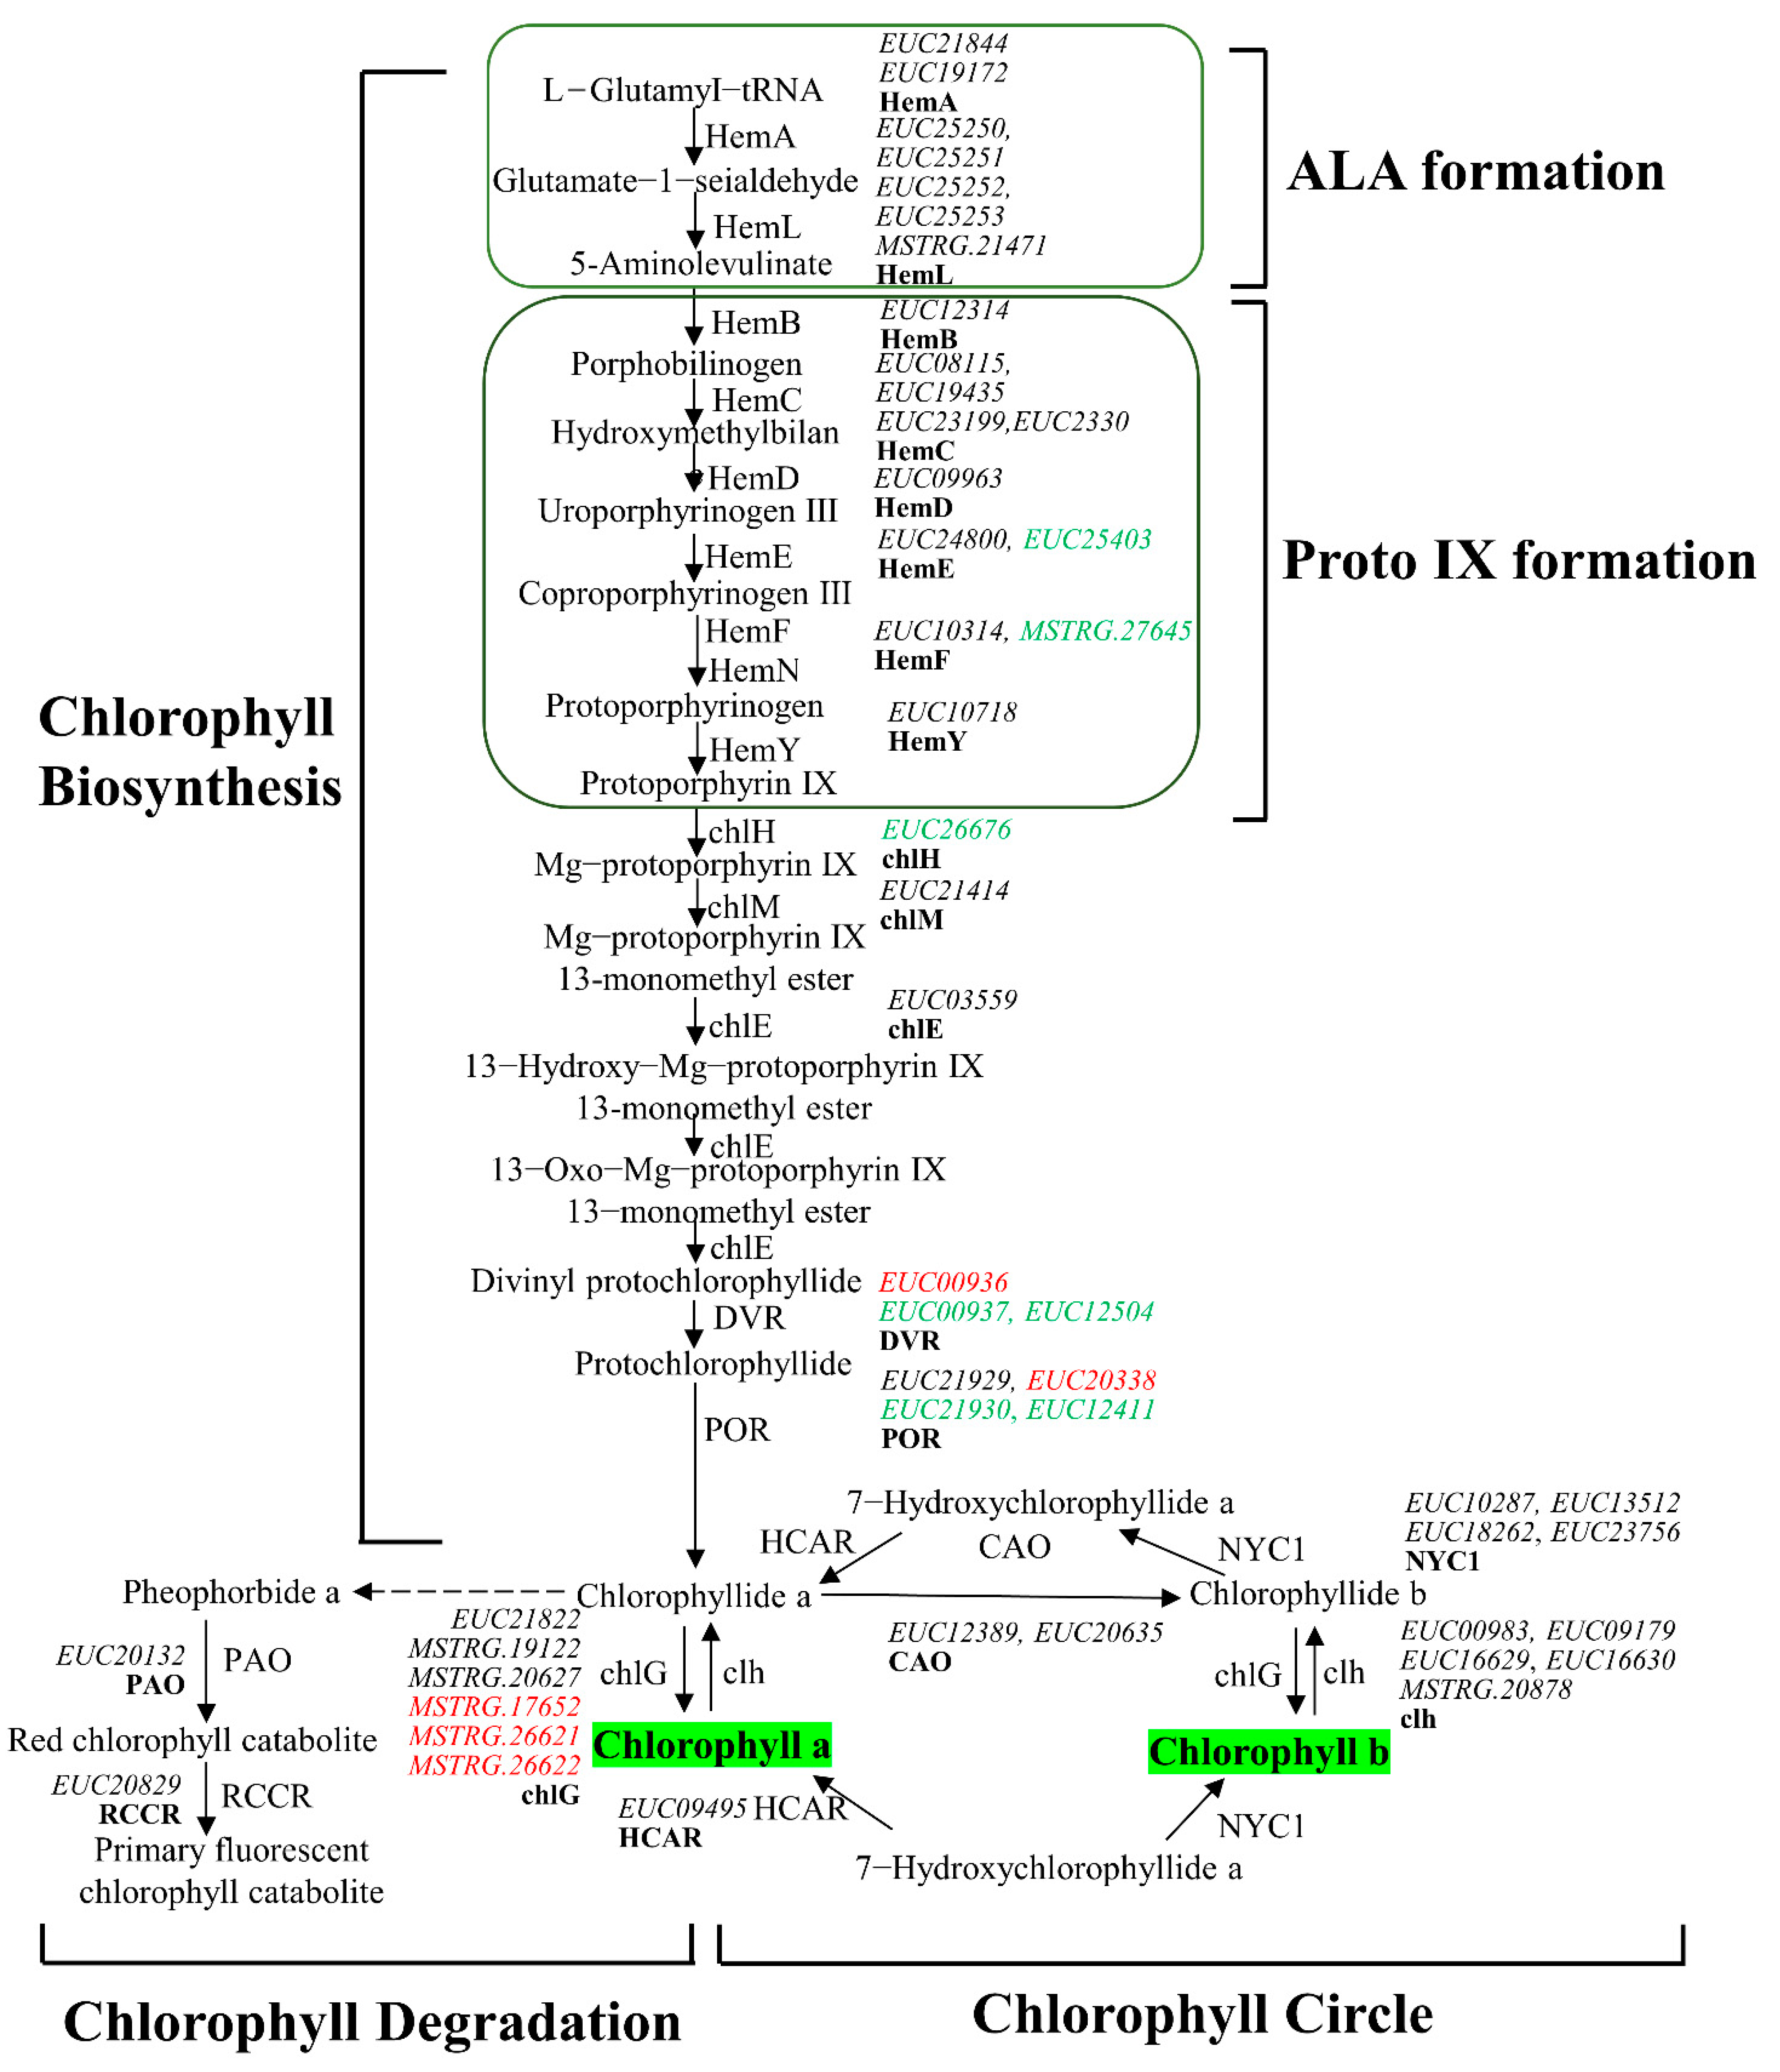
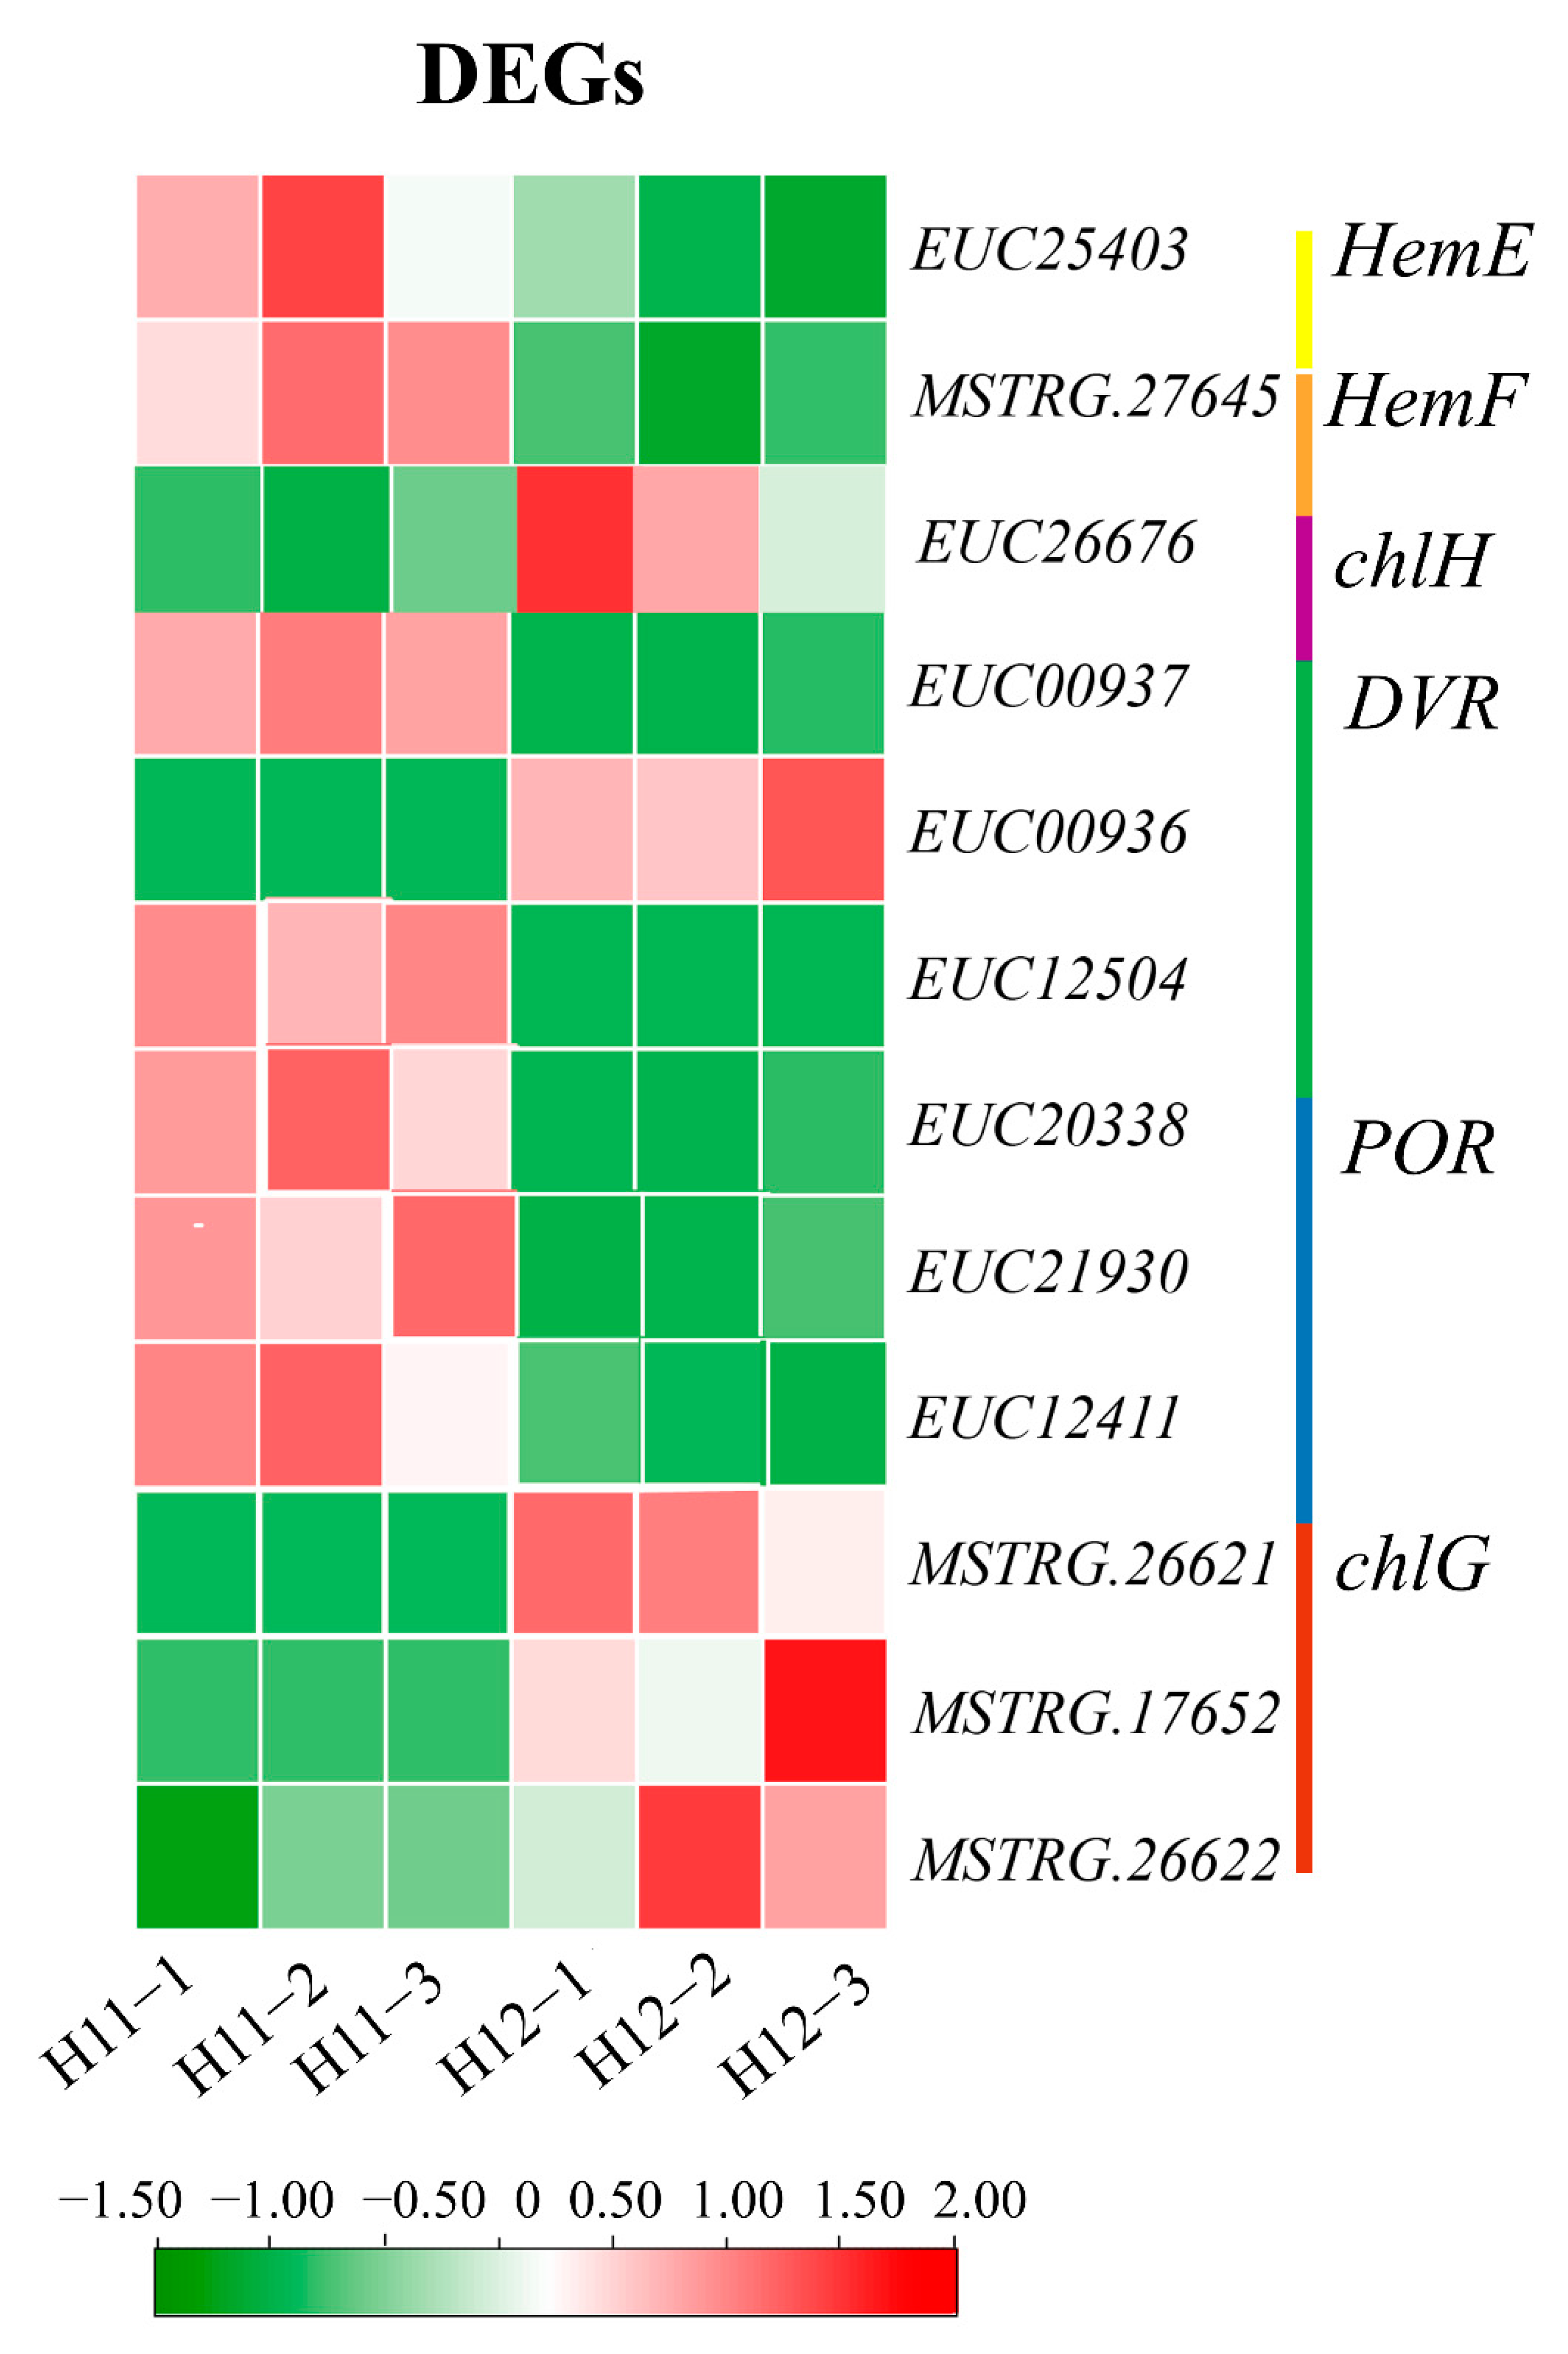
3.4. Differential Expression of Chlorophyll Genes Involved in Leaf Coloration

As we know, the ratio of anthocyanins to chlorophyll is important to the red color of leaves. The lack of any reaction of chlorophyll synthesis would result in green-deficient leaves. Thus, the key genes encoding enzymes related to chlorophyll metabolism should be identified. In this study, 48 candidate genes that encoded 20 enzymes involved in the chlorophyll metabolism pathway were identified (Table S2). Among them, 12 DEGs contributed to chlorophyll metabolism (Figure 4). Genes in chlorophyll biosynthesis in H12 that were significantly down-regulated compared with H11 included uroporphyrinogen decarboxylase (HemE), coproporphyrinogen-III oxidase (HemF), and magnesium chelatase subunit H (chlH). In addition, some genes encoding divinyl protochlorophyllide (DVR) and protochlorophyllide reductase (POR) in the chlorophyll biosynthesis process were also significantly down-regulated. Chlorophyll synthase (ChlG), as the last enzyme of chlorophyll biosynthesis, plays an important role in this process [41]. Under the catalysis of chlG enzyme, chlorophyllide-a was transformed into chlorophyll-a. Our data showed that chlG genes are significantly up-regulated in the red leaves of H12. This result indicated that most of the genes of the chlorophyll synthesis pathway are significantly down-regulated. Those might cause the decrease in the chlorophyll content of red leaves.
Compared to the green leaves of H11, the expression of photosynthetic DEGs was significantly down-regulated in the red leaves of H12. The photosynthesis pathway had five parts: photosystem II, photosystem I, cytochrome b6/f complex, photosynthetic electron transport, and F-type ATPase. According to KEGG enrichment results, 10 DEGs relevant to PSII polypeptide subunits, 2 DEGs related to PSI polypeptide subunits, 2 DEGs related to cytochrome-b, and 2 DEGs related to ferredoxin showed significant reductions in mRNA levels of red leaves (Table S3). For example, LHCB1 genes, which are thought to bind chlorophyll-b and transfer excitation energy to the reaction centers in photosystem II (PSII) [42], were primarily down-regulated (Figure S5).

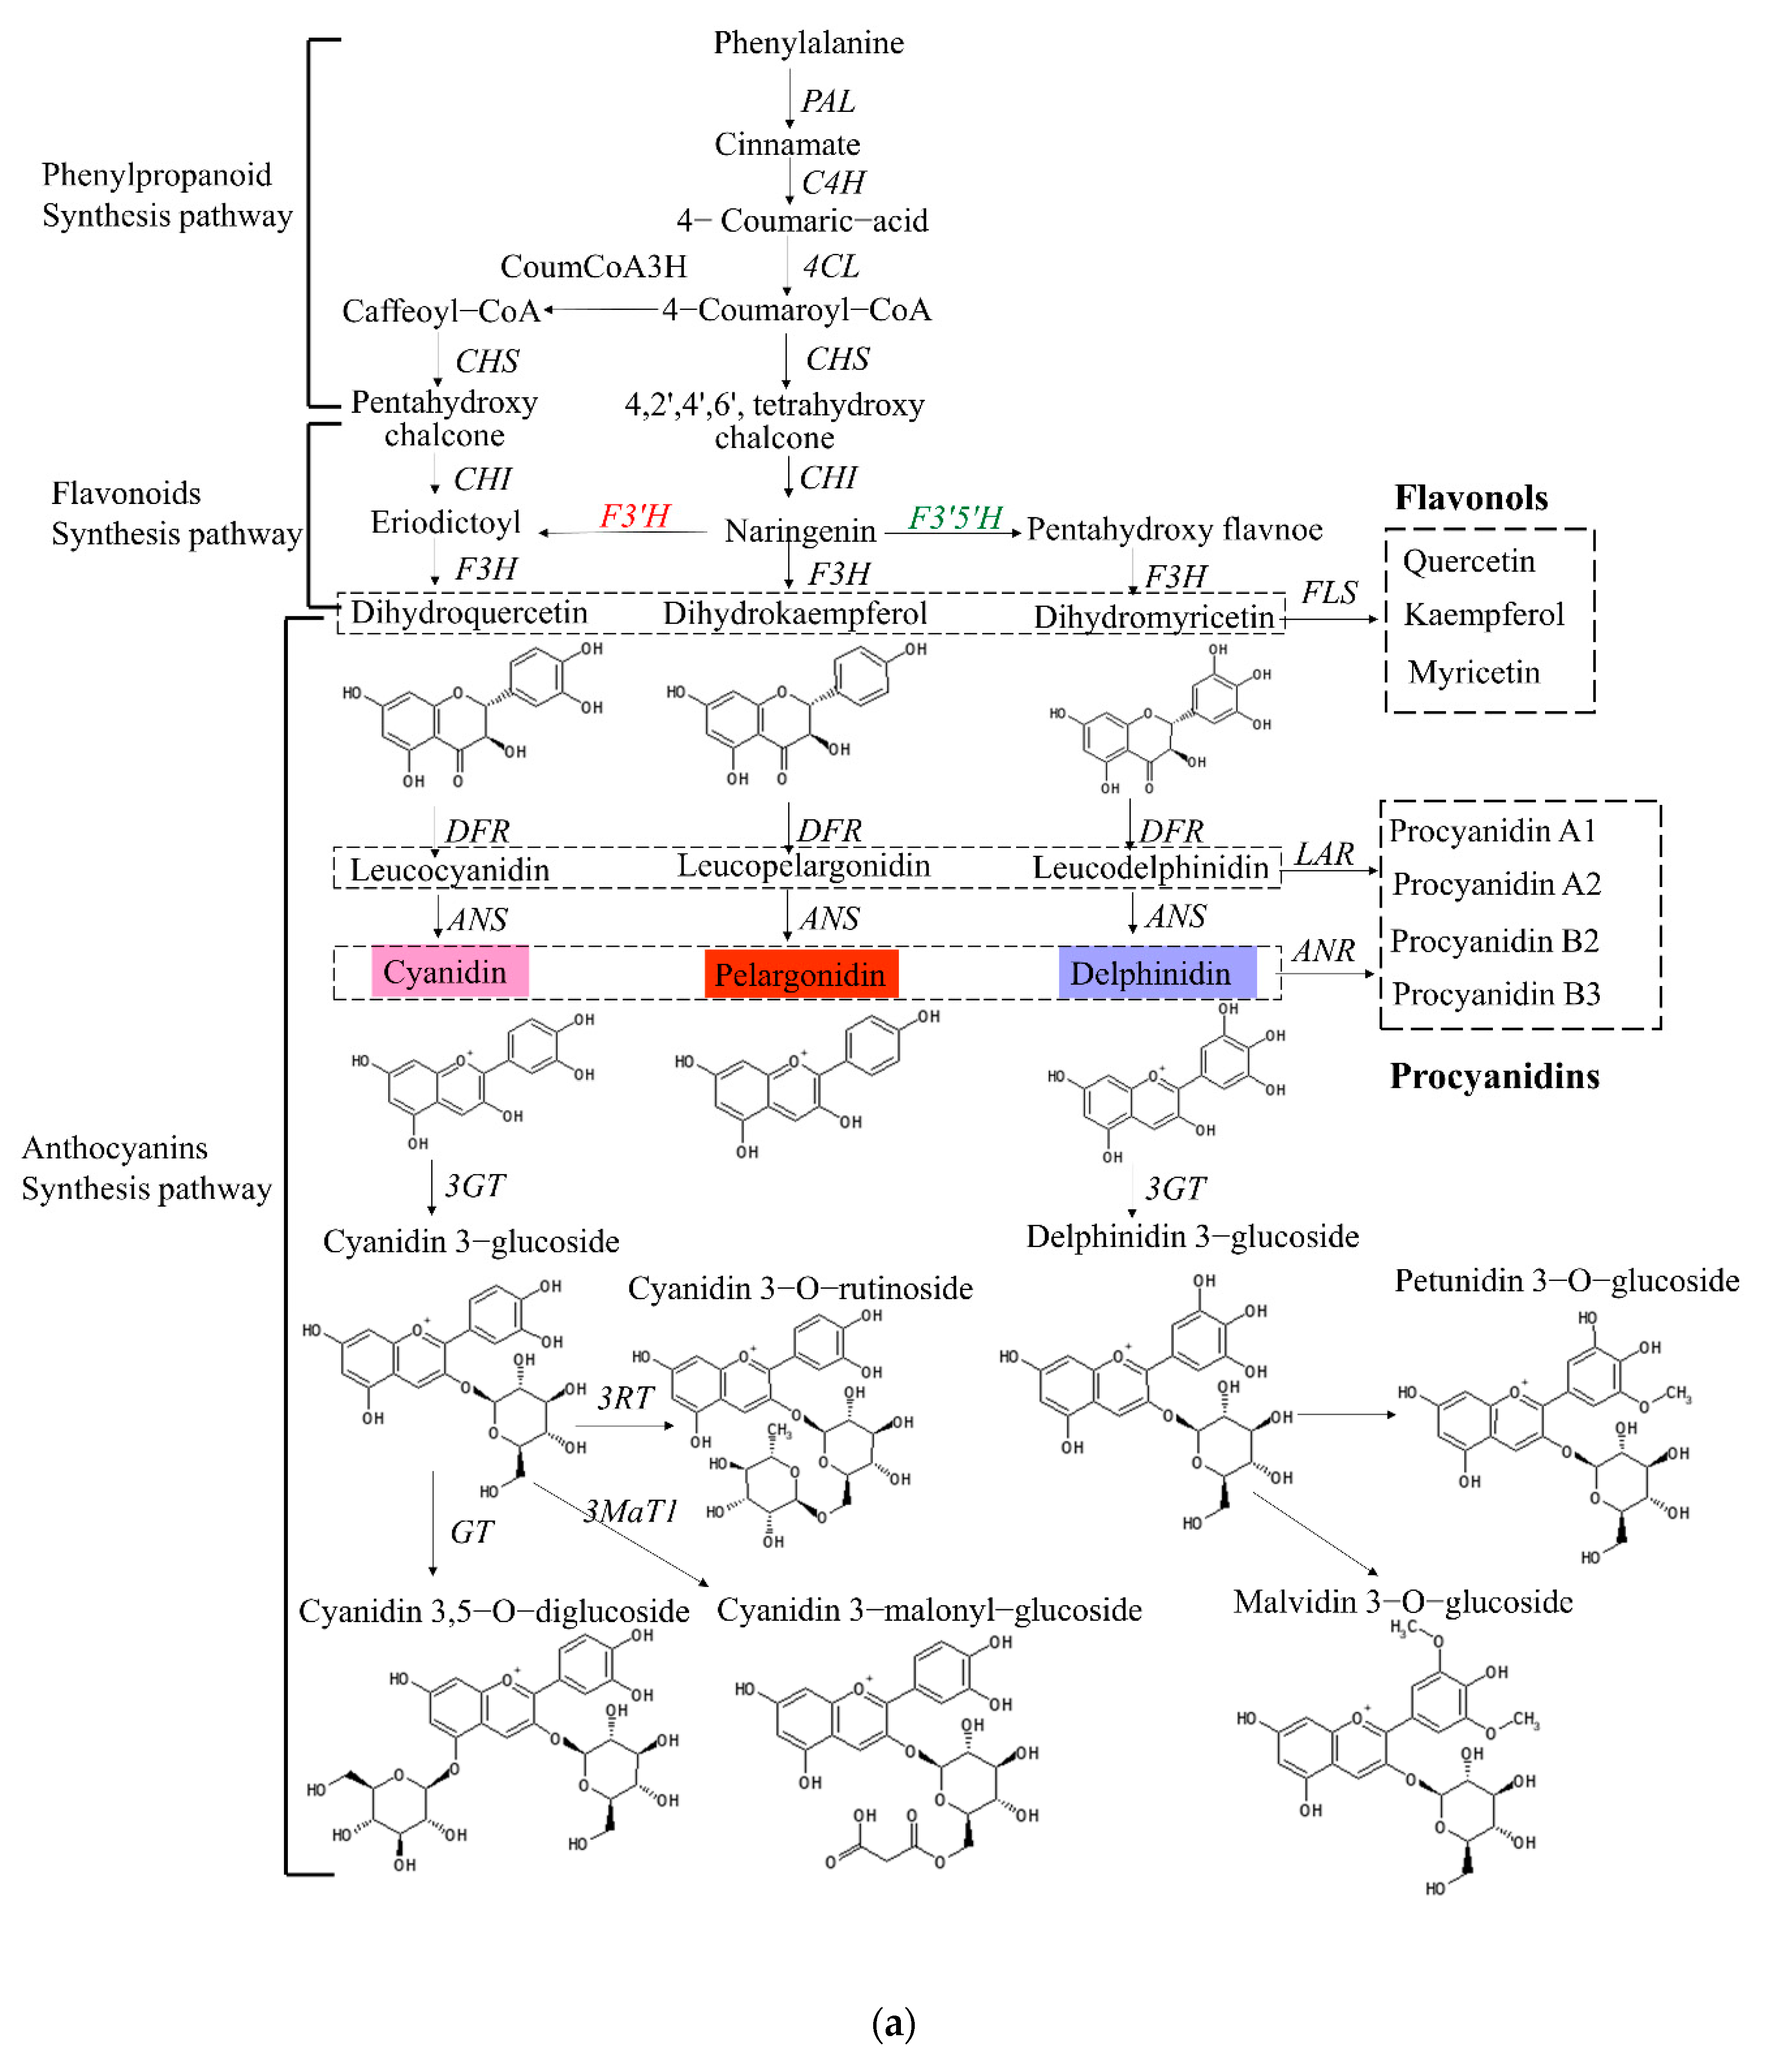
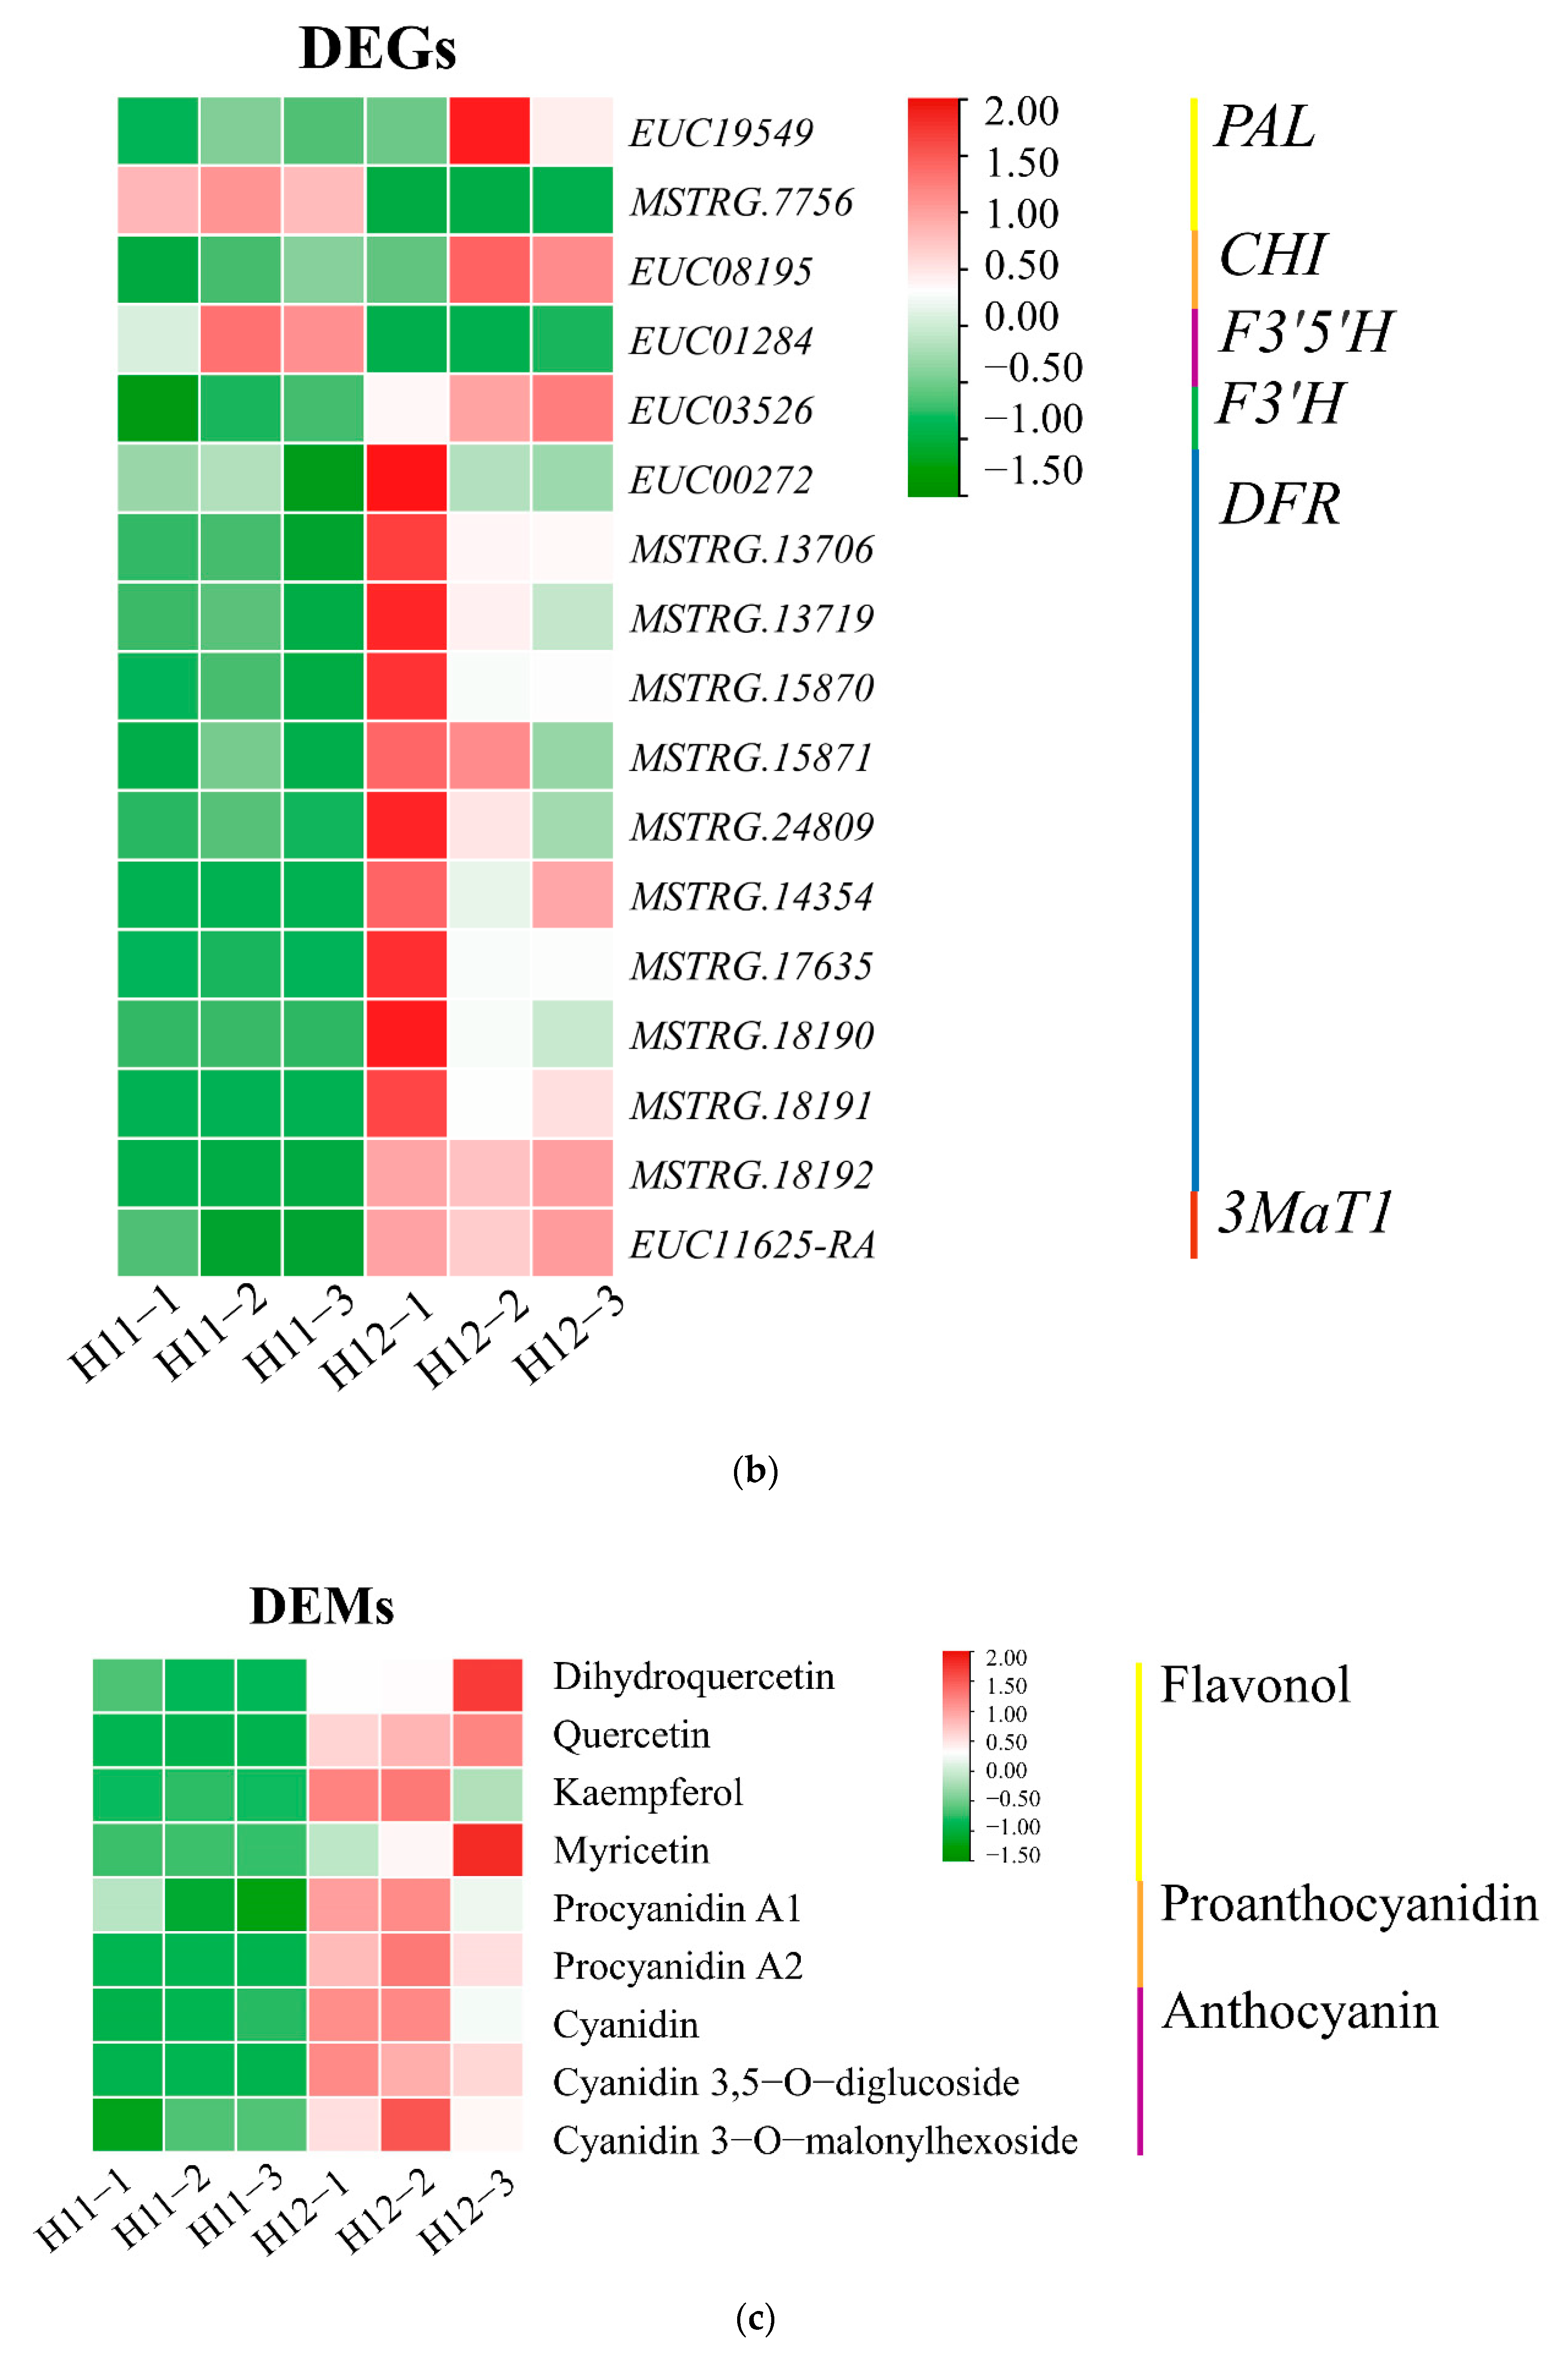
3.5. Up-Regulation of Key Genes and Corresponding Metabolites Related to the Flavonoid Biosynthesis Pathway

According to transcriptome and metabolome integrative analysis results, we identified 45 candidate genes that encoded 15 enzymes and 156 metabolites related to the flavonoid biosynthesis pathway (Table S4). The results showed majority up-regulation of genes and metabolites related to the flavonoid synthesis pathway in E. ulmoides red leaves. We focused on the anthocyanin, flavonol, and proanthocyanin synthesis. Therefore, 18 DEGs and 9 DEMs involved in the flavonoid metabolic pathway were screened (Figure 5). First, the expression of the CHI gene was up-regulated 1.06-fold in H12 compared with H11. Second, the F3′5′H gene was down-regulated −3.34-fold, while F3′H was up-regulated 1.22-fold, which increased the content of dihydroquercetin by 10.51-fold. Third, DFR genes were up-regulated. DFR genes plays a decisive role in the formation of anthocyanins. The corresponding result was that dihydroquercetin was more transformed to promote the synthesis of cyanidin, and the content of cyanidin was up-regulated 7.99-fold. Then, the 3MaT1 gene was up-regulated 1.22-fold. Cyanidin 3-malonylglucoside and cyanidin 3,5-glucoside were up-regulated 1.58- and 5.51-fold, respectively. FLS plays an important role in flavonol synthesis. Under the regulation of FLS genes, the contents of quercetin, kaempferol, and myricetin were up-regulated 22.73-, 5.15-, and 45.41-fold, respectively. Leucoanthocyantin reductase (LAR) and ANR are important genes in proanthocyanin synthesis. Their existence and function led to an increase in the proanthocyanidin content. In general, the expression of EuPAL, EuCHI, EuF3′H, EuF3′5′H, EuDFR, Eu3MaT1, EuFLS, EuLAR, and EuANR genes may result in the up-regulation of most metabolites in the flavonoid biosynthesis and anthocyanin metabolism pathways.

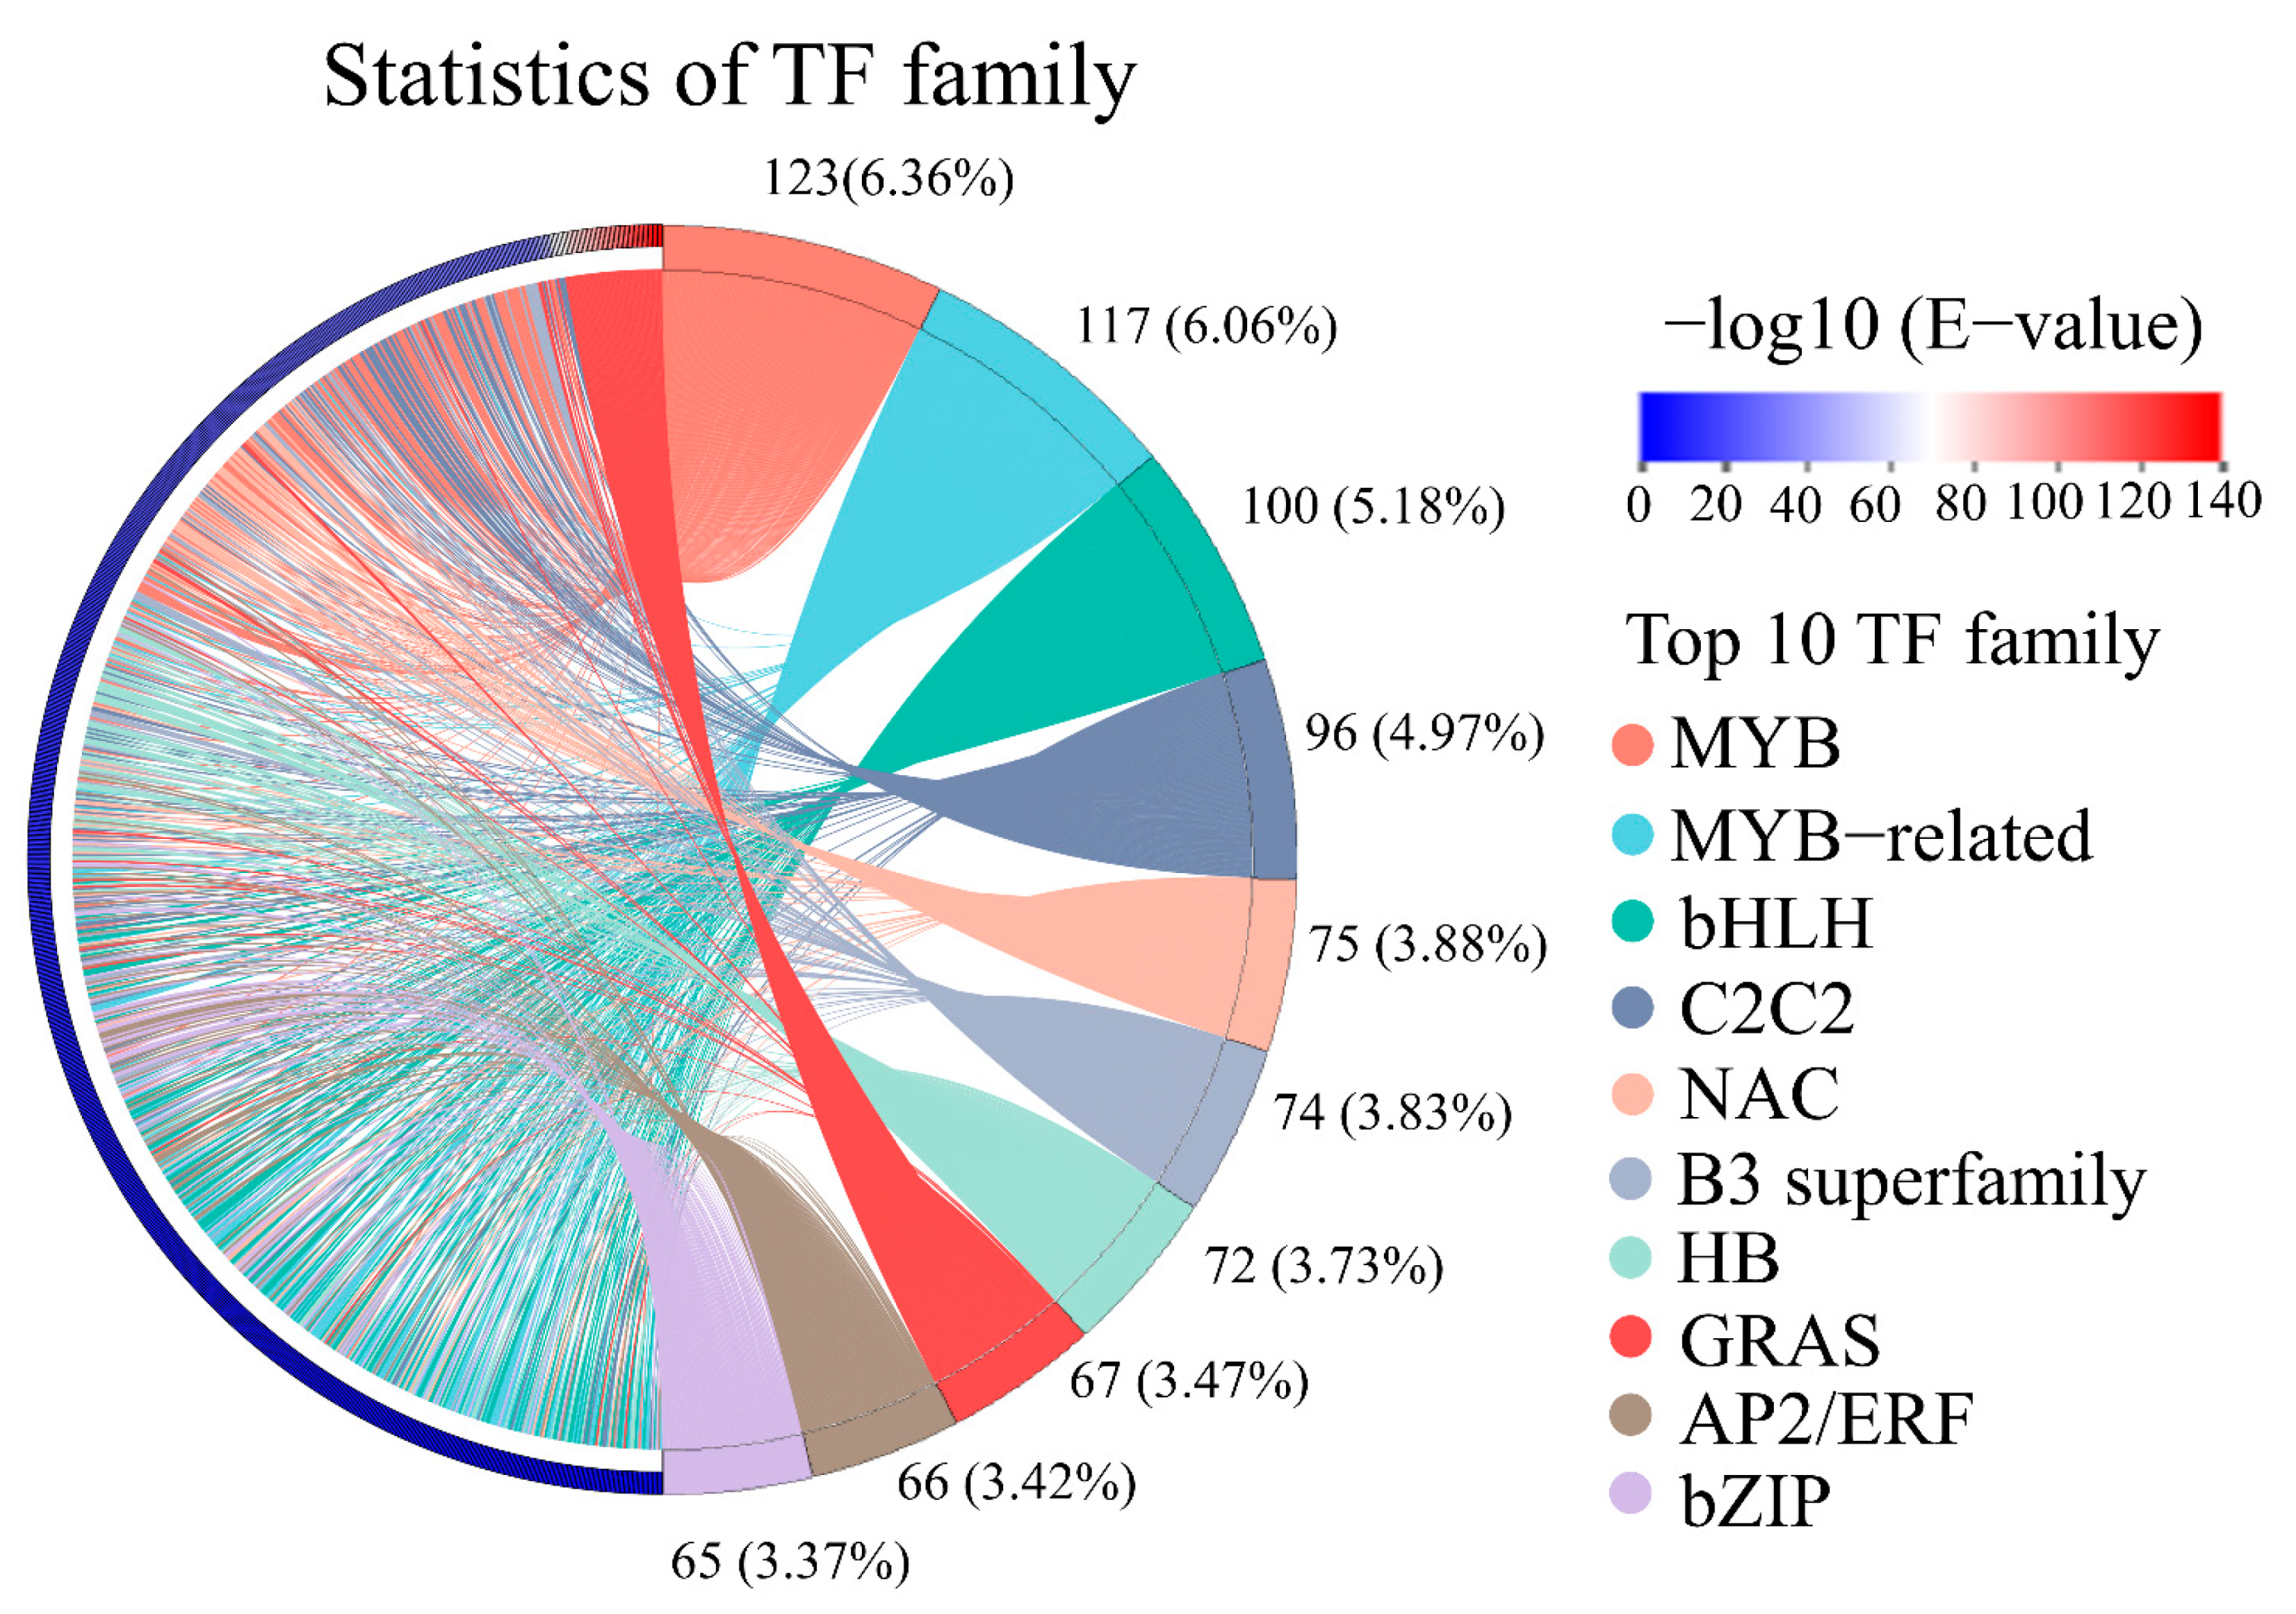
3.6. Transcription Factors

Transcription factors (TFs) are key proteins that manipulate target genes to be expressed at a specific time in a specific space with a specific intensity in various biological processes in plants. In this study, a total of 1931 transcripts were annotated as TFs, which were divided into 44 TF families. Among these TF families, MYB TFs were the most abundant TF family (123, 6.36%), followed by the MYB-related family (117, 6.06%), and bHLH (100, 5.18%), C2C2 (96, 4.97%), NAC (75, 3.88%), and B3 superfamilies (74, 3.83%; Figure 6). Then, the MYB and MYB-related gene families were identified: nine DEGs of the MYB gene family were up-regulated, while 6 DEGs were down-regulated. Most of the DEGs of the bHLH gene family were significantly down-regulated in H12. Additionally, some DEGs encoding C2C2, NAC, AP2/ERF, and bZIP families showed highly significant up-regulation in red leaves compared with normal green leaves (Table S5).
MYB and bHLH TFs play an important role in regulating flavonoid synthesis. AtMYB75, AtMYB90, AtMYB113, and AtMYB114 were reported to regulate anthocyanin biosynthesis. AtMYB123 regulated proanthocyanidin biosynthesis. AtMYB11, AtMYB12, and AtMYB111 were involved in flavonol biosynthesis [20,43]. AtMYB4, AtMYB7, AtMYB32, and AtMYB75 interacted with the bHLH TFs AtbHLH042/TT8, AtbHLH001/GL3, and AtbHLH002/EGL3, regulating flavonoid biosynthesis [44,45]. According to phylogenetic analysis results (Figure S6), EUC01949, EUC02121, and EUC20877 were highly homologous with TFs regulating anthocyanin biosynthesis. Seven EuMYBs might be related to proanthocyanidin biosynthesis. EUC03871 was likely to regulate flavonol synthesis. EUC23975 and EUC15883 were clustered with AtMYB4. Furthermore, EUC06643 was aligned with AtbHLH042/TT8 (Figure S7), which positively induced the accumulation of flavonoids [46]. Combined with the expression profile of their transcripts (Table S6), the expression of EuMYBs was relatively low at the mRNA level. However, the expression of the bHLH TF EUC06643 was significantly up-regulated in H12 and was relatively higher. This result showed that there might be amounts of EuMYB TFs related to flavonoid synthesis, but their expression levels were quite low in this period. This might be due to the accumulation of flavonoids in E. ulmoides leaves when the color of the sampled leaves remains unchanged.

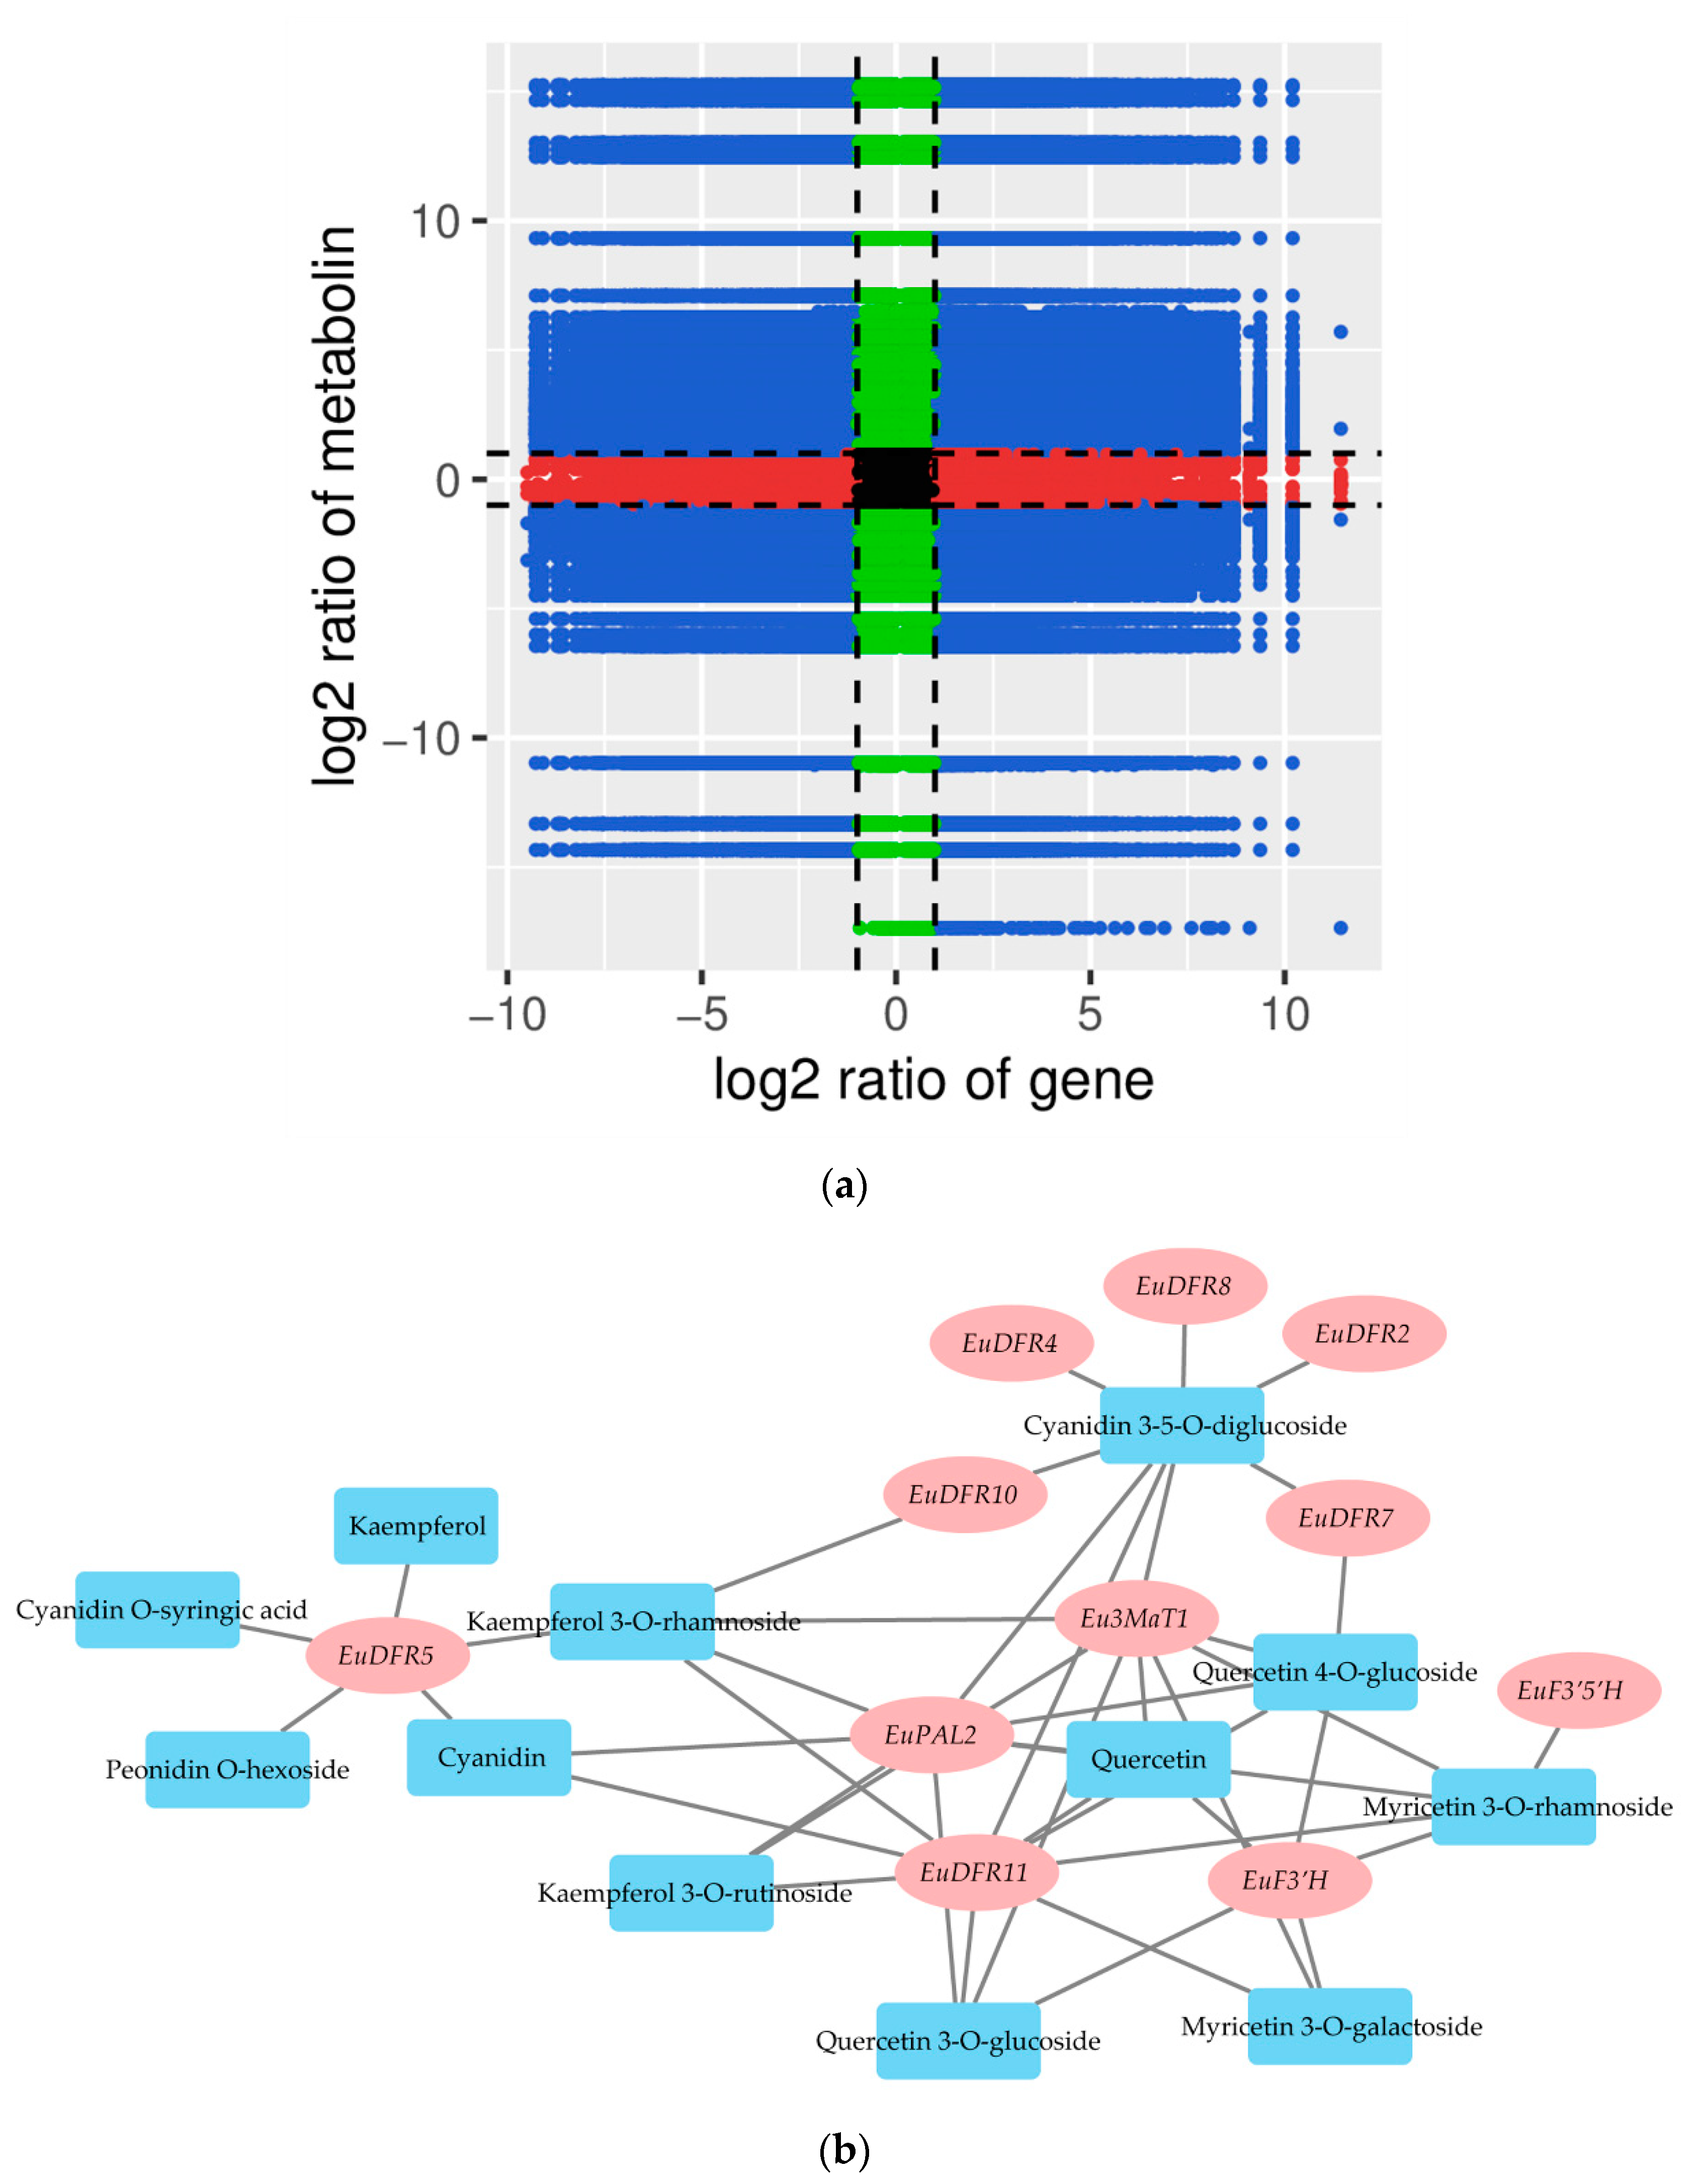
3.7. Correlation Analysis of Metabolites and Genes Involved in Flavonoid and Anthocyanin Biosynthesis

To obtain the hub metabolites and genes related to leaf coloration, correlation analysis was performed. First, nine quadrant diagrams were used to comprehensively evaluate the correlation between metabolites and genes (Figure 7a). Most pairs of flavonoid metabolites and corresponding genes were found in the third quadrant, which represented up-regulated metabolites and genes. Thus, the representative DEMs and DEGs (PCC > 0.8) related to flavonoid and anthocyanin biosynthesis were selected to generated co-expression networks. The visualized networks were divided into three subnetworks with core nodes. The first subnetwork was central with the EuDR5 gene node. The second subnetwork took the cyanidin 3-5-O-diglucoside metabolite as the node. The third subnetwork may take quercetin as the node. In addition, EuPAL2, EuDFR11, Eu3MaT1, and EuF3′H might be the key nodes of the whole network (Figure 7b, Table S7). These gene nodes would become candidates for our future research on flavonoid and anthocyanin biosynthesis in E. ulmoides. In addition, these nodes contain cyanidin 3-5-O-diglucoside, EuDR5, EuPAL2, EuDFR11, Eu3MaT1, and EuF3′H, which are likely associated with the red leaf coloration of E. ulmoides.

3.8. RT-qPCR Verification

To verify the RNA-seq results, we selected 10 genes (2 genes in the flavonoid synthesis pathway, 4 in the anthocyanin synthesis pathway, and 3 in the photosynthetic metabolism pathway). RT-qPCR results showed the that up-regulated and down-regulated gene expression levels in the leaves of H11 and H12 were consistent with RNA-seq (Figure S8).

4. Discussion

The central problem to be solved was which metabolic pathways and candidate genes lead to the color of red leaves of Eucommia ulmoides. As we know, flavonoid synthesis is a colored model for studying metabolism, contributing to the major red, blue, and purple pigments in plants [17]. In addition, the ratio of anthocyanins to chlorophyll is crucial to leaf color [47]. Our study suggested that the up-regulation of flavonoid biosynthesis and a high expression of chlorophyll degradation with the down-regulation of chlorophyll biosynthesis are detected in E. ulmoides red leaves compared with green leaves. Although there were intriguing discoveries related to the dynamic changes in flavonoids and chlorophyll, we still do not know whether there is a relationship between flavonoid synthesis and chlorophyll metabolism. For example, in the purple leaves of ornamental cabbage, the trends in anthocyanin and chlorophyll gene expression are consistent with our results [48]. In the yellow mutant of poplar, a high level of anthocyanin metabolism and a high level of chlorophyll degradation genes with down-regulation of carotenoid synthesis were found compared with green leaves [49]. Fortunately, a few studies have been were reported to determine the relationship between flavonoids and chlorophyll. First, at the genetic level, the content of naringenin chalcone segregated as a monogenic trait independently to carotenoids and chlorophyll in melon fruit rinds [50]. Second, at the transcriptional regulation level, down-regulation of SlMYB72 increased chlorophyll accumulation and increased flavonoid accumulation in tomato fruits [51]. SlMYB72 directly targeted SlPOR and SlChlH genes in the chlorophyll metabolism pathway and Sl4CL and SlCHS genes related to flavonoid biosynthesis. Therefore, there might be some relationship between flavonoids and chlorophyll metabolism in E. ulmoides leaves.
Delphinidin, peonidin, and malvidin cause purple and dark colors, whereas cyanidin and pelargonidin derivatives result in the main bright-red coloration [52]. In our study, a total of 14 anthocyanin metabolites in E. ulmoides red leaves were identified and their relative contents were analyzed based on UPLC-MS/MS for the first time. Importantly, the combined analysis of the transcriptome and metabolome suggested that cyanidin, cyanidin 3-malonylglucoside, and cyanidin 3,5-glucoside might be related to E. ulmoides red leaves. Similarly, a study on poplar showed that cyanidin 3-O-glucoside, malvidin 3-O-galactoside, malvidin 3-O-glucoside, delphinidin 3-O-glucoside, and pelargonin are specifically accumulated in red leaves compared with green leaves. There is little difference in the kinds of anthocyanins detected between E. ulmoides red leaves and poplar red leaves [21]. These studies thus offer a reference for the anthocyanin study associated with woody plant leaf coloration.
Flavonoid biosynthesis is regulated by a series of genes, some of which compete with each other [17]. Our results implied that EuPAL, EuCHI, EuF3′H, EuF3′5′H, EuDFR, Eu3MaT1, EuFLS, EuLAR, and EuANR genes regulate the flavonoid biosynthesis in E. ulmoides leaves. Notably, the analysis showed that F3′5′H was down-regulated −3.34-fold, while F3′H was up-regulated 1.22-fold, which resulted in the activation of the cyanidin pathway and the blocking of the delphinidin pathway. The F3′5′H genes were barely expressed, whereas the F3′H genes showed high expression levels. F3′5′H encodes a flavonoid 3′,5′-hydroxylase belonging to the cyp75a subfamily, while F3′H encodes a flavanone 3-hydroxylase belonging to the cyp75b subfamily [53]. F3′5′H catalyzed naringenin and dihydrokaempferol into dihydromyricetin, while F3′H catalyzed them into dihydroquercetin. Therefore, these results well explained that the content of dihydroquercetin was significantly up-regulated in the red leaves of E. ulmoides. In addition, there are reports that FLS can affect anthocyanin synthesis through substrate competition. FLS changed the ratio of flavonol and anthocyanin and finally changed the flower color of Petunia hybrida [54]. FLS competed with DFR, causing the white-flowered mutant of Muscari botryoides Mill to lose the cyanidin compound compared with the blue-flowered plant [55]. Our study indicated that EuF3′H competes with EuF3′5′H, which might affect the final red coloration of E. ulmoides leaves.
E. ulmoides “Huazhong No. 12” (H12) is a woody plant whose leaves express an obvious red color. Our study showed comprehensive detection of flavonoid biosynthesis in E. ulmoides red leaves. Recently, by applying metabolome and transcriptome combined analysis, flavonoid biosynthesis profiles were studied in several plant species, including the pre-angiosperm, monocot, and eudicot clades. However, the flavonoid profiles of woody plants are different from those of monocotyledons and herbaceous dicotyledons [21]. The flavonoid synthesis in woody plants may be more complex than that in Arabidopsis and maize [17,56]. Combining metabolome and transcriptome analysis can further deepen our understanding of the differences between red and green leaves. Integrative analysis indicated that EuPAL2, EuF3′H, EuDFR5, EuDFR11, and Eu3MaT1 might play an important role in regulating phenylalanine, flavonoid, and anthocyanin biosynthesis. In the beginning, phenylalanine, as a substrate, was regulated by EuPAL2. Then the up-regulation of EuF3′H resulted in the increased content of dihydroquercetin. Under the regulation of EuDFR and EuANS, dihydroquercetin was converted to cyanidin. Thus, EuDFR5 and EuDFR11 were significantly up-regulated and might be crucial to the formation of cyanidin. However, dihydroquercetin, as a substrate, was catalyzed into flavonols, including quercetin, kaempferol, and myricetin. Finally, cyanidin was controlled by Eu3GT and Eu3MaT1 genes. The content of cyanidin 3-malonylglucoside and cyanidin 3,5-glucoside was up-regulated. Therefore, our research on flavonoid synthesis provided a reference for studying the molecular mechanism of flavonoid synthesis in woody plants.
Flavonoids are natural products known for their beneficial effects on health. Pharmacological experiments show that flavonoids have antioxidant, anti-inflammatory, and anti-carcinogenic properties [57]. Among them, flavonols, flavones, chalcones, proanthocyanidins, and other substance have shown great potential in nutraceutical and medicinal applications. The most abundant citrus flavonoids are flavanones, such as hesperidin, naringin, or neohesperidin, which display antioxidant and anti-inflammatory properties [58]. Quercetin and apigenin are considered to be natural compounds for cancer treatment [59]. Cocoa procyanidins are reported to regulate transcriptional pathways related to inflammation and metabolism in human dendritic cells [60]. These studies provide a basis for the use of flavonoids from E. ulmoides red leaves. Our metabolome analysis demonstrated that E. ulmoides red leaves show a relatively higher flavonoid content, including apigenin class, quercetin class, kaempferol class, and procyanidins (Figure S2). Thus, besides anthocyanins, these flavonoids are also important findings in E. ulmoides. Given that E. ulmoides leaves are used as herbal medicine and animal feed, the relatively flavonoid-rich E. ulmoides red leaves may be more useful as feedstock for bioactive products.

5. Conclusions

In conclusion, through the determination of the phenotype and pigment content, we found that the ratio of anthocyanins to chlorophyll of H12 is higher than that in H11, which is one of the reasons for the leaf color difference. At the metabolic level, most flavonoids and anthocyanins were highly accumulated in red leaves. Gene expression analysis suggested that flavonoid biosynthesis and phenylpropanoid biosynthesis genes shows high levels in H12 than in H11, which also validated the significant up-regulation of flavonoid metabolism. On the basis of a comprehensive analysis relating metabolites to the gene expression profile, our study indicated that the up-regulation of flavonoid biosynthesis and a high expression of chlorophyll degradation with the down-regulation of chlorophyll biosynthesis contributes to the red leaves of E. ulmoides. These findings expand the understanding of the mechanism of red leaf coloration in woody plants. Furthermore, the relatively flavonoid-rich E. ulmoides red leaves may be more useful as feedstock for bioactive products.

Supplementary Materials

The following are available online at https://www.mdpi.com/article/10.3390/f12091260/s1, Figure S1. Analysis of the total ion current (TIC) in different quality control (QC) samples. The abscissa represents the retention time (min) of metabolite detection, and the ordinate represents the intensity (count per second (cps)) of the ion current. Figure S2. Metabolite differences between H11 (green leaves) and H12 (red leaves). (a) Compared with H11, most isoflavone and flavone metabolites were up-regulated in H12 based on relative quantitative contents. (b) The up-regulation of major flavanone, flavonol, anthocyanidin, and proanthocyanidin metabolites. (c) The down-regulation of most amino acid derivatives and organic acids. The darker the color, the higher the metabolite expression level. Figure S3. GO classification of different expression genes in leaf transcriptomes of E. ulmoides among different samples. Figure S4. KEGG enrichment of down-regulated genes in H12 (red leaves) compared with H11 (green leaves) of E. ulmoides. Figure S5. Differential expression of genes related to the photosynthesis pathway. The expression level was based on the FPKM value. The darker the color, the higher the gene expression level. Figure S6. Phylogeny of all EuMYBs and AtMYBs. MYBs involved in flavonoid biosynthesis were analyzed. Phylogenic analysis followed the settings: the maximum likelihood method, the substitution model was Dayhoff, priors set to the Yule model, the birth rate was 1.0, the mcmc chain length was 10,000,000, bootstrapping was set to 1000, and the TreeAnnotator program set the posterior probability limit to 1.0 with a burn-in percentage of 90. The scale bar indicates the average number of amino acid substitutions per site. Figure S7. Phylogeny of all EubHLHs and AtbHLHs. Phylogenetic analysis followed the above settings. Figure S8. qRT-PCR analysis of the expression of candidate genes in E. ulmoides leaves. Table S1. Primer sequences of genes for RT-qPCR verification. Table S2. Candidate genes involved in the chlorophyll metabolism pathway. Table S3. Candidate genes involved in the photosynthesis pathway. Table S4. Candidate genes related to the flavonoid biosynthesis pathway. Table S5. DEGs of the gene family of H11 (green leaves) and H12 (red leaves). Table S6. The expression profile of EuMYB and EubHLH transcripts related to flavonoid synthesis. Table S7. The node genes of flavonol and anthocyanin biosynthesis.

Author Contributions

Data curation, Y.Y.; formal analysis, Y.Y. and M.C.; funding acquisition, J.Z.; investigation, M.C., Y.L., H.D. (Huanhuan Ding) and J.Z.; methodology, Y.Y. and J.Z.; project administration, J.Z.; resources, H.D. (Hongyan Du) and J.Z.; software, Y.Y.; supervision, H.D. (Hongyan Du) and Z.S.; validation, Y.Y. and H.D. (Huanhuan Ding); visualization, Y.Y.; writing—original draft, Y.Y.; writing—review and editing, H.D. (Hongyan Du), Z.S. and J.Z. All authors have read and agreed to the published version of the manuscript.

Funding

This work was funded by the Open Fund of State Key Laboratory of Tree Genetics and Breeding (Chinese Academy of Forestry) (TGB2015002), the Henan Province Natural Science Foundation of China (202300410554), and the Tackling Key Scientific and Technological Problems project of Henan Province (192102110169).

Data Availability Statement

The transcriptome clean data have been submitted to the SRA database of the NCBI (Accession IDs SRR12569328 and SRR12569327).

Acknowledgments

The transcriptome data were analyzed on the free online Majorbio Cloud Platform (http://www.majorbio.com, accessed on 18 August 2021).

Conflicts of Interest

The authors declare no conflict of interest.

References

  1. Wuyun, T.N.; Wang, L.; Liu, H.; Wang, X.; Zhang, L.; Bennetzen, J.L.; Li, T.; Yang, L.; Liu, P.; Du, L.; et al. The Hardy Rubber Tree Genome Provides Insights into the Evolution of Polyisoprene Biosynthesis. Mol. Plant 2018, 11, 429–442. [Google Scholar] [CrossRef] [Green Version]
  2. Hashikawa-Hobara, N.; Hashikawa, N.; Sugiman, N.; Hosoo, S.; Hirata, T.; Yamaguchi, Y.; Yamasaki, H.; Kawasaki, H.; Nishibe, S. Oral administration of Eucommia ulmoides Oliv. Leaves extract protects against atherosclerosis by improving macrophage function in ApoE knockout mice. J. Food Sci. 2020, 85, 4018–4024. [Google Scholar] [CrossRef] [PubMed]
  3. Zhu, M.Q.; Sun, R.C. Eucommia ulmoides Oliver: A Potential Feedstock for Bioactive Products. J. Agric. Food Chem. 2018, 66, 5433–5438. [Google Scholar] [CrossRef] [PubMed]
  4. Peng, M.; Wang, Z.; Peng, S.; Zhang, M.; Duan, Y.; Li, F.; Shi, S.; Yang, Q.; Zhang, C. Dietary supplementation with the extract from Eucommia ulmoides leaves changed epithelial restitution and gut microbial community and composition of weanling piglets. PLoS ONE 2019, 14, e0223002. [Google Scholar]
  5. Ding, H.; Cao, A.; Li, H.; Zhao, Y.; Feng, J. Effects of Eucommia ulmoides leaf extracts on growth performance, antioxidant capacity and intestinal function in weaned piglets. J. Anim. Physiol. Anim. Nutr. 2020, 104, 1169–1177. [Google Scholar] [CrossRef]
  6. Kim, H.Y.; Moon, B.H.; Lee, H.J.; Choi, D.H. Flavonol glycosides from the leaves of Eucommia ulmoides O. with glycation inhibitory activity. J. Ethnopharmacol. 2004, 93, 227–230. [Google Scholar] [CrossRef] [PubMed]
  7. Wang, C.Y.; Tang, L.; He, J.W.; Li, J.; Wang, Y.Z. Ethnobotany, Phytochemistry and Pharmacological Properties of Eucommia ulmoides: A Review. Am. J. Chin. Med. 2019, 47, 259–300. [Google Scholar] [CrossRef]
  8. Li, L.; Liu, M.; Shi, K.; Yu, Z.; Zhou, Y.; Fan, R.; Shi, Q. Dynamic Changes in Metabolite Accumulation and the Transcriptome during Leaf Growth and Development in Eucommia ulmoides. Int. J. Mol. Sci. 2019, 20, 4030. [Google Scholar] [CrossRef] [Green Version]
  9. Huang, Q.; Zhang, F.; Liu, S.; Jiang, Y.; Ouyang, D. Systematic investigation of the pharmacological mechanism for renal protection by the leaves of Eucommia ulmoides Oliver using UPLC-Q-TOF/MS combined with network pharmacology analysis. Biomed. Pharmacother. 2021, 140, 111735. [Google Scholar] [CrossRef]
  10. Yang, Y.; Zhu, J.; Chen, M.; Zhao, H.; Liu, P.; Ding, H.; Jia, Z.; Du, H. Phenotypic and transcriptome analysis on red leaf and green leaf Eucommia ulmoides Oliver. Acta Physiol. Plant. 2020, 42, 65. [Google Scholar] [CrossRef]
  11. Fan, Y.; Zhang, L.-F.; Han, S.; Qi, L. Metabolome and Transcriptome Association Analysis Reveals Regulation of Flavonoid Biosynthesis by Overexpression of LaMIR166a in Larix kaempferi (Lamb.) Carr. Forests 2020, 11, 1367. [Google Scholar] [CrossRef]
  12. Panche, A.N.; Diwan, A.D.; Chandra, S.R. Flavonoids: An overview. J. Nutr. Sci. 2016, 5, e47. [Google Scholar] [CrossRef] [Green Version]
  13. Barghetti, A.; Sjögren, L.; Floris, M.; Paredes, E.B.; Wenkel, S.; Brodersen, P. Heat-shock protein 40 is the key farnesylation target in meristem size control, abscisic acid signaling, and drought resistance. Genes Dev. 2017, 31, 2282–2295. [Google Scholar] [CrossRef] [PubMed] [Green Version]
  14. Jaakola, L.; Määttä, K.; Pirttilä, A.M.; Törrönen, R.; Kärenlampi, S.; Hohtola, A. Expression of genes involved in anthocyanin biosynthesis in relation to anthocyanin, proanthocyanidin, and flavonol levels during bilberry fruit development. Plant Physiol. 2002, 130, 729–739. [Google Scholar] [CrossRef] [Green Version]
  15. Li, P.; Dong, Q.; Ge, S.; He, X.; Verdier, J.; Li, D.; Zhao, J. Metabolic engineering of proanthocyanidin production by repressing the isoflavone pathways and redirecting anthocyanidin precursor flux in legume. Plant Biotechnol. J. 2016, 14, 1604–1618. [Google Scholar] [CrossRef] [Green Version]
  16. Saito, K.; Yonekura-Sakakibara, K.; Nakabayashi, R.; Higashi, Y.; Yamazaki, M.; Tohge, T.; Fernie, A.R. The flavonoid biosynthetic pathway in Arabidopsis: Structural and genetic diversity. Plant Physiol. Biochem. 2013, 72, 21–34. [Google Scholar] [CrossRef] [PubMed] [Green Version]
  17. Winkel-Shirley, B. Flavonoid Biosynthesis. A Colorful Model for Genetics, Biochemistry, Cell Biology, and Biotechnology. Plant Physiol. 2001, 126, 485–493. [Google Scholar] [CrossRef] [Green Version]
  18. Sparvoli, F.; Martin, C.; Scienza, A.; Gavazzi, G.; Tonelli, C. Cloning and molecular analysis of structural genes involved in flavonoid and stilbene biosynthesis in grape (Vitis vinifera L.). Plant Mol. Biol. 1994, 24, 743–755. [Google Scholar] [CrossRef] [PubMed]
  19. Xu, W.; Dubos, C.; Lepiniec, L. Transcriptional control of flavonoid biosynthesis by MYB-bHLH-WDR complexes. Trends Plant Sci. 2015, 20, 176–185. [Google Scholar] [CrossRef]
  20. Dubos, C.; Stracke, R.; Grotewold, E.; Weisshaar, B.; Martin, C.; Lepiniec, L. MYB transcription factors in Arabidopsis. Trends Plant Sci. 2010, 15, 573–581. [Google Scholar] [CrossRef]
  21. Tian, Y.; Li, Q.; Rao, S.; Wang, A.; Zhang, H.; Wang, L.; Li, Y.; Chen, J. Metabolic profiling and gene expression analysis provides insights into flavonoid and anthocyanin metabolism in poplar. Tree Physiol. 2021, 41, 1046–1064. [Google Scholar] [CrossRef]
  22. Davies, K.M.; Albert, N.W.; Schwinn, K.E. From landing lights to mimicry: The molecular regulation of flower colouration and mechanisms for pigmentation patterning. Funct. Plant Biol. FPB 2012, 39, 619–638. [Google Scholar] [CrossRef]
  23. Albert, N.W.; Davies, K.M.; Lewis, D.H.; Zhang, H.; Montefiori, M.; Brendolise, C.; Boase, M.R.; Ngo, H.; Jameson, P.E.; Schwinn, K.E. A conserved network of transcriptional activators and repressors regulates anthocyanin pigmentation in eudicots. Plant Cell 2014, 26, 962–980. [Google Scholar] [CrossRef] [Green Version]
  24. Rothenberg, D.O.; Yang, H.; Chen, M.; Zhang, W.; Zhang, L. Metabolome and Transcriptome Sequencing Analysis Reveals Anthocyanin Metabolism in Pink Flowers of Anthocyanin-Rich Tea (Camellia sinensis). Molecules 2019, 24, 1064. [Google Scholar] [CrossRef] [Green Version]
  25. Alcalde-Eon, C.; García-Estévez, I.; Rivas-Gonzalo, J.C.; Rodríguez de la Cruz, D.; Escribano-Bailón, M.T. Anthocyanins of the anthers as chemotaxonomic markers in the genus Populus L. Differentiation between Populus nigra, Populus alba and Populus tremula. Phytochemistry 2016, 128, 35–49. [Google Scholar] [CrossRef] [PubMed] [Green Version]
  26. Peng, S.B.; Zhang, C.H.; Ren, L.Y. Analysis on Leaf Color Variation of Eucommia ulmoides. J. ZheJiang For. Sci. Technol. 2013, 33, 61–66. [Google Scholar]
  27. Xu, L.; Yang, P.; Feng, Y.; Xu, H.; Cao, Y.; Tang, Y.; Yuan, S.; Liu, X.; Ming, J. Spatiotemporal Transcriptome Analysis Provides Insights into Bicolor Tepal Development in Lilium “Tiny Padhye”. Front. Plant Sci. 2017, 8, 398. [Google Scholar] [CrossRef] [Green Version]
  28. Li, W.-x.; Yang, S.-b.; Lu, Z.; He, Z.-c.; Ye, Y.-l.; Zhao, B.-b.; Wang, L.; Jin, B. Cytological, physiological, and transcriptomic analyses of golden leaf coloration in Ginkgo biloba L. Hortic. Res. 2018, 5, 12. [Google Scholar] [CrossRef] [Green Version]
  29. Beale, S.I. Green genes gleaned. Trends Plant Sci. 2005, 10, 309–312. [Google Scholar] [CrossRef] [PubMed]
  30. Gitelson, A.A.; Viña, A.; Ciganda, V.; Rundquist, D.C.; Arkebauer, T.J. Remote estimation of canopy chlorophyll content in crops. Geophys. Res. Lett. 2005, 32, L08403. [Google Scholar] [CrossRef] [Green Version]
  31. Wang, F.; Chen, L.; Chen, H.; Chen, S.; Liu, Y. Analysis of Flavonoid Metabolites in Citrus Peels (Citrus reticulata “Dahongpao”) Using UPLC-ESI-MS/MS. Molecules 2019, 24, 2680. [Google Scholar] [CrossRef] [Green Version]
  32. Fraga, C.G.; Clowers, B.H.; Moore, R.J.; Zink, E.M. Signature-discovery approach for sample matching of a nerve-agent precursor using liquid chromatography-mass spectrometry, XCMS, and chemometrics. Anal. Chem. 2010, 82, 4165–4173. [Google Scholar] [CrossRef]
  33. Thévenot, E.A.; Roux, A.; Xu, Y.; Ezan, E.; Junot, C. Analysis of the Human Adult Urinary Metabolome Variations with Age, Body Mass Index, and Gender by Implementing a Comprehensive Workflow for Univariate and OPLS Statistical Analyses. J. Proteome Res. 2015, 14, 3322–3335. [Google Scholar] [CrossRef]
  34. Chen, C.; Chen, H.; Zhang, Y.; Thomas, H.R.; Frank, M.H.; He, Y.; Xia, R. TBtools: An Integrative Toolkit Developed for Interactive Analyses of Big Biological Data. Mol. Plant 2020, 13, 1194–1202. [Google Scholar] [CrossRef]
  35. Daehwan, K.; Ben, L.; Salzberg, S.L. HISAT: A fast spliced aligner with low memory requirements. Nat. Methods 2015, 12, 357–360. [Google Scholar]
  36. Pertea, M.; Pertea, G.M.; Antonescu, C.M.; Chang, T.C.; Mendell, J.T.; Salzberg, S.L. StringTie enables improved reconstruction of a transcriptome from RNA-seq reads. Nat. Biotechnol. 2015, 33, 290–295. [Google Scholar] [CrossRef] [PubMed] [Green Version]
  37. Klopfenstein, D.; Zhang, L.; Pedersen, B.; Ramírez, F.; Vesztrocy, A.W.; Naldi, A.; Mungall, C.; Yunes, J.; Botvinnik, O.; Weigel, M.; et al. GOATOOLS: A Python library for Gene Ontology analyses. Sci. Rep. 2018, 8, 10872. [Google Scholar] [CrossRef] [PubMed]
  38. Bouckaert, R.; Vaughan, T.G.; Barido-Sottani, J.; Duchêne, S.; Fourment, M.; Gavryushkina, A.; Heled, J.; Jones, G.; Kühnert, D.; De Maio, N.; et al. BEAST 2.5: An advanced software platform for Bayesian evolutionary analysis. PLoS Comput. Biol. 2019, 15, e1006650. [Google Scholar] [CrossRef] [Green Version]
  39. Livak, K.J.; Schmittgen, T.D. Analysis of relative gene expression data using real-time quantitative PCR and the 2(-Delta Delta C(T)) Method. Methods 2001, 25, 402–408. [Google Scholar] [CrossRef] [PubMed]
  40. Zhao, J. Flavonoid transport mechanisms: How to go, and with whom. Trends Plant Sci. 2015, 20, 576–585. [Google Scholar] [CrossRef] [PubMed]
  41. Gaubier, P.; Wu, H.J.; Laudié, M.; Delseny, M.; Grellet, F. A chlorophyll synthetase gene from Arabidopsis thaliana. Mol. Gen. Genet. MGG 1995, 249, 58–64. [Google Scholar] [CrossRef]
  42. Pietrzykowska, M.; Suorsa, M.; Semchonok, D.A.; Tikkanen, M.; Boekema, E.J.; Aro, E.M.; Jansson, S. The light-harvesting chlorophyll a/b binding proteins Lhcb1 and Lhcb2 play complementary roles during state transitions in Arabidopsis. Plant Cell 2014, 26, 3646–3660. [Google Scholar] [CrossRef] [PubMed] [Green Version]
  43. Stracke, R.; Werber, M.; Weisshaar, B. The R2R3-MYB gene family in Arabidopsis thaliana. Curr. Opin. Plant Biol. 2001, 4, 447–456. [Google Scholar] [CrossRef]
  44. Qi, T.; Song, S.; Ren, Q.; Wu, D.; Huang, H.; Chen, Y.; Fan, M.; Peng, W.; Ren, C.; Xie, D. The Jasmonate-ZIM-domain proteins interact with the WD-Repeat/bHLH/MYB complexes to regulate Jasmonate-mediated anthocyanin accumulation and trichome initiation in Arabidopsis thaliana. Plant Cell 2011, 23, 1795–1814. [Google Scholar] [CrossRef] [PubMed] [Green Version]
  45. Wang, X.C.; Wu, J.; Guan, M.L.; Zhao, C.H.; Geng, P.; Zhao, Q. Arabidopsis MYB4 plays dual roles in flavonoid biosynthesis. Plant J. 2020, 101, 637–652. [Google Scholar] [CrossRef] [PubMed]
  46. Baudry, A.; Caboche, M.; Lepiniec, L. TT8 controls its own expression in a feedback regulation involving TTG1 and homologous MYB and bHLH factors, allowing a strong and cell-specific accumulation of flavonoids in Arabidopsis thaliana. Plant J. 2006, 46, 768–779. [Google Scholar] [CrossRef] [PubMed]
  47. Yang, S.; Liang, K.; Wang, A.; Zhang, M.; Zhang, L. Physiological Characterization and Transcriptome Analysis of Camellia oleifera Abel. during Leaf Senescence. Forests 2020, 11, 812. [Google Scholar] [CrossRef]
  48. Jin, S.W.; Rahim, M.A.; Afrin, K.S.; Park, J.I.; Kang, J.G.; Nou, I.S. Transcriptome profiling of two contrasting ornamental cabbage (Brassica oleracea var. acephala) lines provides insights into purple and white inner leaf pigmentation. BMC Genom. 2018, 19, 797. [Google Scholar] [CrossRef] [PubMed] [Green Version]
  49. Yuru, T.; Shupei, R.; Qianqian, L.; Meng, X.; Aike, W.; Hechen, Z.; Jinhuan, C. The coloring mechanism of a novel golden variety in Populus deltoides based on the RGB color mode. For. Res. 2021, 1, 5. [Google Scholar]
  50. Tadmor, Y.; Burger, J.; Yaakov, I.; Feder, A.; Libhaber, S.E.; Portnoy, V.; Meir, A.; Tzuri, G.; Sa’ar, U.; Rogachev, I.; et al. Genetics of flavonoid, carotenoid, and chlorophyll pigments in melon fruit rinds. J. Agric. Food Chem. 2010, 58, 10722–10728. [Google Scholar] [CrossRef] [PubMed]
  51. Wu, M.; Xu, X.; Hu, X.; Liu, Y.; Cao, H.; Chan, H.; Gong, Z.; Yuan, Y.; Luo, Y.; Feng, B.; et al. SlMYB72 Regulates the Metabolism of Chlorophylls, Carotenoids, and Flavonoids in Tomato Fruit. Plant Physiol. 2020, 183, 854–868. [Google Scholar] [CrossRef] [PubMed]
  52. Jaakola, L. New insights into the regulation of anthocyanin biosynthesis in fruit. Trends Plant Sci. 2013, 18, 477–483. [Google Scholar] [CrossRef] [PubMed] [Green Version]
  53. Wang, Y.-S.; Xu, Y.-J.; Gao, L.-P.; Yu, O.; Wang, X.-Z.; He, X.-J.; Jiang, X.-L.; Liu, Y.-J.; Xia, T. Functional analysis of Flavonoid 3′,5′-hydroxylase from Tea plant (Camellia sinensis): Critical role in the accumulation of catechins. BMC Plant Biol. 2014, 14, 347. [Google Scholar] [CrossRef] [PubMed] [Green Version]
  54. Holton, T.A.; Brugliera, F.; Tanaka, Y. Cloning and expression of flavonol synthase from Petunia hybrida. Plant J. 2010, 4, 1003–1010. [Google Scholar] [CrossRef] [PubMed]
  55. Lou, Q.; Liu, Y.; Qi, Y.; Jiao, S.; Tian, F.; Jiang, L.; Wang, Y. Transcriptome sequencing and metabolite analysis reveals the role of delphinidin metabolism in flower colour in grape hyacinth. J. Exp. Bot. 2014, 65, 3157–3164. [Google Scholar] [CrossRef] [Green Version]
  56. Wang, L.; Lu, W.; Ran, L.; Dou, L.; Yao, S.; Hu, J.; Fan, D.; Li, C.; Luo, K. R2R3-MYB transcription factor MYB6 promotes anthocyanin and proanthocyanidin biosynthesis but inhibits secondary cell wall formation in Populus tomentosa. Plant J. Cell Mol. Biol. 2019, 99, 733–751. [Google Scholar] [CrossRef]
  57. Serafini, M.; Peluso, I.; Raguzzini, A. Flavonoids as anti-inflammatory agents. Proc. Nutr. Soc. 2010, 69, 273–278. [Google Scholar] [CrossRef] [Green Version]
  58. Benavente-García, O.; Castillo, J. Update on uses and properties of citrus flavonoids: New findings in anticancer, cardiovascular, and anti-inflammatory activity. J. Agric. Food Chem. 2008, 56, 6185–6205. [Google Scholar] [CrossRef]
  59. Shafabakhsh, R.; Asemi, Z. Quercetin: A natural compound for ovarian cancer treatment. J. Ovarian Res. 2019, 12, 55. [Google Scholar] [CrossRef]
  60. Midttun, H.L.E.; Ramsay, A.; Mueller-Harvey, I.; Williams, A.R. Cocoa procyanidins modulate transcriptional pathways linked to inflammation and metabolism in human dendritic cells. Food Funct. 2018, 9, 2883–2890. [Google Scholar] [CrossRef]
Figure 1. Leaves of E. ulmoides “Huazhong No. 12” (H12, red) and E. ulmoides “Huazhong No. 11” (H11, green, CK). (a) Leaves from H12 and H11 seedlings; (b) mature leaves of H12 and H11 used as experimental materials; (c) bare-hand sectioning of H12 and H11 leaves observed under the light microscope; (df) chlorophyll, carotenoid, and anthocyanin content in leaves of H11 and H12; and (g) anthocyanin and chlorophyll content ratio in leaves of two varieties. Data indicate means ± STDEV (n = 12, p < 0.01, comparison method ANOVA). ** means that there is a significant difference in the pigment content of H11 and H12, and the difference level reaches p < 0.01.
Forests 12 01260 g001
Figure 2. Metabolome analysis of E. ulmoides H11 (green leaves, CK) and H12 (red leaves). (a) Statistics of the number of classified metabolites, (b) PCA of metabolites, (c) OPSLDA model of metabolite differences, (d) volcano plot of differentially expressed metabolites (DEMs), and (e) KEGG enrichment of DEMs.
Forests 12 01260 g002aForests 12 01260 g002bForests 12 01260 g002c
Figure 3. Functional annotation of transcripts in leaf transcriptomes of E. ulmoides among different samples. (a) Summary of transcriptome DEGs. (b) Volcano plot of transcriptome DEGs. (c) KEGG enrichment of up-regulated genes.
Forests 12 01260 g003
Figure 4. Differential expression of genes related to the chlorophyll metabolism pathway. The gene expression level was based on the FPKM value. The darker the color, the higher the gene expression level.
Forests 12 01260 g004aForests 12 01260 g004b
Figure 5. Regulation related to flavonoid metabolism and anthocyanidin synthesis. (a) Genes and metabolites related to the flavonoid metabolism pathway in E. ulmoides leaves. (b) Differentially expressed genes (DEGs) in the flavonoid metabolism pathway. The expression level was based on the FPKM value. (c) Differentially expressed metabolites (DEMs) in the flavonoid metabolism pathway. The expression level of metabolites was based on relative quantitative contents. The darker the color, the higher the gene expression level.
Forests 12 01260 g005aForests 12 01260 g005b
Figure 6. Transcription factors (TFs) in in E. ulmoides leaves.
Forests 12 01260 g006
Figure 7. Integrative analysis of the metabolome and transcriptome. (a) Quadrant diagrams representing the association of metabolomic and transcriptomic data. (b) Co-expression network of metabolites and genes involved in flavonol and anthocyanin biosynthesis. The gene–metabolite pairs were connected within the network by edges. Red nodes represent genes, and blue nodes represent metabolites.
Forests 12 01260 g007
Table 1. List of anthocyanins and anthocyanidins detected in H11 and H12.
Compounds 1Q1 (Da) 2Q3 (Da) 3Rt (min) 4Molecular Weight 5 (Da)Relative Content 6
H11H12
Cyanidin287.00231.603.45287.24815,6678,570,000
Cyanidin 3-O-glucoside447.30284.102.55448.3082,53367,967
Cyanidin 3-O-rutinoside595.00287.902.62595.003,890,0002,650,000
Cyanidin 3,5-O-diglucoside611.00287.702.15611.00431,00019,700,000
Cyanidin 3-O-malonylhexoside535.10287.402.94535.10122,733368,000
Cyanidin O-syringic acid465.10285.302.50466.1058,9003,380,000
Delphinidin303.00149.302.90303.243,716,6678,826,667
Delphinidin 3-O-rutinoside611.00303.002.37611.004,126,6674,086,667
Pelargonin595.00271.802.40595.001,453,3332,563,333
Peonidin O-hexoside463.10301.403.00463.12103,00014,150,000
Petunidin 3-O-glucoside479.00317.002.63479.00140,933429,000
Rosinidin O-hexoside477.10315.603.31477.10111,000228,000
Malvidin 3-O-galactoside493.00331.702.87493.00205,667141,667
Malvidin 3-O-glucoside493.20331.602.87493.20258,667173,667
1 Compounds refer to anthocyanins and anthocyanidins. 2 Q1, parent ions; 3 Q3, characteristic fragments; 4 Rt, retention time; and 5 Molecular weight were the basis of metabolic characteristics. 6 Relative contents of the metabolites were calculated by chromatographic peak areas.
Publisher’s Note: MDPI stays neutral with regard to jurisdictional claims in published maps and institutional affiliations.

