Article

Down-Regulation of Photosynthesis to Elevated CO2 and N Fertilization in Understory Fraxinus rhynchophylla Seedlings

1
Department of Agriculture, Forestry and Bioresources, College of Agriculture and Life Sciences, Seoul National University, Seoul 08826, Korea
2
Interdisciplinary Program in Agricultural and Forest Meteorology, College of Agriculture and Life Sciences, Seoul National University, Seoul 08826, Korea
3
Department of Forest Bioresources, National Institute of Forest Science, Suwon 16631, Korea
4
National Center for Agro Meteorology, Seoul 08826, Korea
5
Research Institute for Agriculture and Life Sciences, College of Agriculture and Life Sciences, Seoul National University, Seoul 08826, Korea
*
Author to whom correspondence should be addressed.
Forests 2021, 12(9), 1197; https://doi.org/10.3390/f12091197
Submission received: 16 July 2021 / Revised: 20 August 2021 / Accepted: 31 August 2021 / Published: 3 September 2021

Abstract

:
(1) Background: Down-regulation of photosynthesis has been commonly reported in elevated CO2 (eCO2) experiments and is accompanied by a reduction of leaf nitrogen (N) concentration. Decreased N concentrations in plant tissues under eCO2 can be attributed to an increase in nonstructural carbohydrate (NSC) and are possibly related to N availability. (2) Methods: To examine whether the reduction of leaf N concentration under eCO2 is related to N availability, we investigated understory Fraxinus rhynchophylla seedlings grown under three different CO2 conditions (ambient, 400 ppm [aCO2]; ambient × 1.4, 560 ppm [eCO21.4]; and ambient × 1.8, 720 ppm [eCO21.8]) and three different N concentrations for 2 years. (3) Results: Leaf and stem biomass did not change under eCO2 conditions, whereas leaf production and stem and branch biomass were increased by N fertilization. Unlike biomass, the light-saturated photosynthetic rate and photosynthetic N-use efficiency (PNUE) increased under eCO2 conditions. However, leaf N, Rubisco, and chlorophyll decreased under eCO2 conditions in both N-fertilized and unfertilized treatments. Contrary to the previous studies, leaf NSC decreased under eCO2 conditions. Unlike leaf N concentration, N concentration of the stem under eCO2 conditions was higher than that under ambient CO2 (4). Conclusions: Leaf N concentration was not reduced by NSC under eCO2 conditions in the understory, and unlike other organs, leaf N concentration might be reduced due to increased PNUE.

1. Introduction

The primary effect of rising atmospheric carbon dioxide (CO2) concentration on plants is an increase in the photosynthetic rate. C3 plants show significantly stimulated carbon assimilation and enhanced growth under elevated CO2 (eCO2) conditions [1,2,3]; however, many studies claim that plants cannot sustain the stimulation of biomass accumulation, which would result under long-term CO2 fumigation [2,4]. The uncertainties in the sustainability of enhanced productivity and carbon (C) storage under elevated CO2 (eCO2) conditions are because of different nutrient conditions [5,6]. For example, productivity enhancement decreased with time as nitrogen (N) availability decreased at the Oak Ridge FACE site [4]. A suboptimal N supply can lead to the down-regulation of photosynthesis [7].
Down-regulation of photosynthesis is commonly reported in eCO2 experiments. This phenomenon involves a reduction in the maximum carboxylation rate (VCmax) and maximum electron transport rate driving ribulose biphosphate (RuBP) regeneration (Jmax). It is associated with reduced leaf N concentration [3,8] because a large fraction of leaf N concentration is invested in the photosynthetic apparatus [9]. Many researchers have suggested that accumulated nonstructural carbohydrates (NSC) dilute leaf N concentration to balance sink–source organs [10]. Reduced leaf N concentration can be attributed to dilution by additional photosynthates, such as NSC, resulting from a “sink–source imbalance,” i.e., an incapacity to form a sufficient “sink” [10,11]. “Sink organs” are plant parts that use photosynthates in storage, construction, and respiration. Plants with large sink organs exhibit little down-regulation despite growing under eCO2 conditions because the NSC can be translocated to the sink organs. In a study on poplar, free-air CO2 enrichment (POP-FACE), down-regulation of VCmax occurred only in Populus alba, which had the smallest sink (diameter growth) among the three poplar clones [12].
Down-regulation of photosynthesis occurs because accumulated NSC suppress the gene expression of Rubisco [10,13], and whereas NSC accumulation is accelerated under eCO2 conditions and low N availability [14]. Previous studies have suggested that photosynthesis down-regulation is mitigated under eCO2 conditions at high N concentration [3,15]. Rubisco suppression under eCO2 conditions is associated with leaf N reallocation from a non-limiting source to other limiting photosynthetic components, such as the light-harvesting complex [9,16]. This change in N allocation can provide an opportunity to increase photosynthetic N use efficiency (PNUE), which is defined as the net C assimilation rate per unit leaf N [8] and is associated with the enhanced efficiency of Rubisco due to photorespiration suppression under eCO2 conditions [17,18]. However, to the best of our knowledge, there has been no investigation of changes in leaf N allocation in woody plants under different N availability conditions under eCO2 conditions.
In contrast, N reduction also occurs in other sink organs apart from leaves [19,20,21]. For example, the N concentration in the edible parts of major food crops decreased by 9%–15% [20], whereas that aboveground in wheat decreased by 23% [21]. N reduction in sink organs can be regarded as a dilution of NSC accumulation [19]. In a previous meta-analysis, the average concentration of soluble sugars and starch in aboveground woody parts significantly increased by 38.6% and 9.9%, respectively. In roots, starch (9.8%) concentration significantly increased under elevated CO2 conditions, whereas soluble sugar concentration decreased by 6.7% but not significantly [22]. The effect of eCO2 on leaf N dilution can be reduced by N fertilization [20,23]; thus, it can be speculated whether NSC changes can be attributed to N concentration variations in other sink organs under different CO2 and N conditions.
Most previous studies have focused on the effects of elevated CO2 on dominant overstory trees (Souza et al., 2010), whereas few studies have investigated the effects of interactions of CO2 and nutrients on understory tree physiological characteristics [24,25,26,27], although the understory contribution to the forest carbon balance is substantial [28,29]. To investigate how the combination of N fertilization and eCO2 administered to seedlings in the understory affects the N concentrations of sink and source organs and the down-regulation of photosynthesis, we exposed understory Fraxinus rhynchophylla seedlings to three different CO2 concentrations (ambient, ~400 ppm [aCO2]; ambient × 1.4 ppm, 560 ppm [eCO21.4]; and ambient × 1.8, 720 ppm [eCO21.8]) and three different N treatments (unfertilized: 2.98 gN m−2 yr−1, N1 + 5.6 gN m−2 yr−1, and N1 + 11.2 gN m−2 yr−1) using an open-top chamber (OTC) for 2 years. F. rhynchophylla is a deciduous tree mainly distributed in East Asia and an economically important species. This research proposes three hypotheses to further understanding between photosynthesis, NSC and N condition:
  • Down-regulation of photosynthesis under eCO2 occurs in low N availability.
  • Leaf N allocation changes with different N and CO2 concentrations.
  • Dilution occur other organs changes with different N availability under eCO2.

2. Materials and Methods

2.1. Study Site

The study was conducted using an OTC at the National Institute of Forest Science (37°15′04′′ N, 136°57′59′′ E) in South Korea. The mean annual temperature is 13.0 °C, and the annual precipitation is 1271.2 mm (19 May 2020, https://data.kma.go.kr/). The OTC experiment utilized three decagonal chambers (10 m in diameter and 7 m in height) with different atmospheric CO2 concentrations: ambient, 400 ppm (aCO2); ambient × 1.4, 560 ppm (eCO21.4); and ambient × 1.8, 720 ppm (one OTC per treatment). Two eCO2 concentrations have been predicted for 2050 and 2070 by the IPCC [30]. A 0.15-mm-thick polyolefin film with a light transmittance of approximately 88% and chemical and water resistance formed the outer covering material. The CO2 exposure device consisted of 16 cylindrical discharge polyvinyl chloride pipes in each chamber (height: 1.5 m, diameter: 10 cm), vertically connected to the pipe, thus exposing the plants to CO2. The CO2 concentrations in the chambers were measured using an infrared gas analyzer (ZRH type, Fuji Electric System Co. Ltd., Tokyo, Japan), and the CO2 concentrations inside were controlled by mixing pure liquefied CO2 from 8:00 a.m. to 6:00 p.m. [31]. The overstory canopy comprised six temperate species. Three seedlings of 4-year-old Pinus densiflora Siebold & Zucc and 2-year-old Fraxinus rhynchophylla HANCE, Quercus acutissima, Acer pseudosieboldianum (Pax) Kom., Crataegus pinnatifida for. pinnatifida, and Sorbus alnifolia Siebold & Zucc Koch were planted in September 2009. The density within the OTC was 2547 trees ha−1. The leaf area index was 0.28 ± 0.06, 0.34 ± 0.07, and 0.46 ± 0.07 m2 m−2 under aCO2, eCO21.4, and eCO21.8, respectively, using leaf litter collection methods [32] in 2017 (p = 0.166).
Seedlings of 2-year-old F. rhynchophylla were transplanted into 10 L pots filled with a 1:1:1:1 mixture of cocopeat: peat moss: vermiculite: pearlite and exposed to three different CO2 treatments using the OTCs in March 2019. Plants were fertilized monthly from May to July for 2 years with NH4NO3, as follows: unfertilized treatment (N1), 5.6 gN m−2 yr−1 (N2), or 11.2 gN m−2 yr−1 (N3) [33]. There were five replicate seedlings in each N fertilization system and a total of 15 replicate seedlings in each CO2 treatment (5 replications × 3 N concentrations). Furthermore, F. rhynchophylla is a deciduous temperate species; the average height of the seedlings was 59.64 ± 0.76 cm, and the diameter was 9.23 ± 0.29 cm in 2019.

2.2. Leaf Gas Exchange Measurements and Sample Collection

A portable gas exchange system (LI-6400, LI-COR, Lincoln, NE, USA) was used to measure the light-saturated photosynthetic rate (Amax) between 08:00 and 14:00, at a leaf temperature of 25 °C in July in 2019 and July and September in 2020. A light response curve was generated by changing the photosynthetic photon flux density in the following order: 1400, 1200, 1000, 800, 600, 400, 200, 100, 75, 50, 25, 0, and 1200 μmol m−2 s−1. The CO2 samples were set at 400, 560, and 720 μmol mol−1 for growth under CO2 conditions (aCO2, eCO21.4, and eCO21.8), respectively. The light-saturated photosynthetic rate (Amax) was estimated by selecting the highest photosynthesis value under light-saturated irradiance from the light response curve. The maximum carboxylation rate (VCmax) and RuBP regeneration rates (Jmax) were measured in July 2019 and 2020 by plotting A/Ci curves under irradiance (1200 μmol m−2 s−1), which is the optimal irradiance for Rubisco activity [34,35]. The change in the reference CO2 concentrations for each chamber were in the following order: aCO2: 400, 300, 200, 100, 75, 50, 25, 0, 400, 400, 600, 800, 1000, and 1200 μmol m−2 s−1; eCO2 1.4: 560, 400, 300, 200, 100, 75, 50, 25, 0, 560, 560, 800, 1000, and 1200 μmol m−2 s−1; and eCO2 1.8: 720, 600, 400, 300, 200, 100, 75, 50, 25, 0, 720, 720, 100, and 1200 μmol m−2 s−1. The VCmax and Jmax were estimated using the curve fitting model of version 2.0 developed by Sharkey [36].
Three leaves were collected (three leaves × five replicates × three N treatments in each treatment), including one for leaf gas exchange and two leaves nearby in July 2019 and July and September 2020. To measure NSC, the N per unit area (Narea, g m−2), N per unit mass (Nmass, g m−2), Rubisco (g m−2), and chlorophyll (g m−2), leaf discs with 1-cm diameter were punched out, excluding the midrib, and stored in a liquid nitrogen tank (−196 °C). The dried samples at 70 °C were powdered using a homogenizer (FastPrep-24, MP Biomedicals, Solon, OH), and leaf N concentration was measured using a CHNS-Analyzer Flash EA 1112 (Thermo Electron Corporation, Massachusetts, USA) at NICEM, Seoul National University. PNUE (µmol N–1 s−1) was calculated as the ratio of Amax to Narea.
The seedlings were harvested and sectioned into leaves, stems, branches, and roots in September 2020 to evaluate biomass allocation to determine their dry weights, and the root, stem, and stem and root Nmass were estimated using the same methods as those for leaf N concentrations.

2.3. Total Nonstructural Carbohydrates

Three discs of leaves and 15–20 mg of root and stem were ground, and the ground samples were used to measure the NSC (sum of the soluble sugars and starch). The soluble sugars were extracted with 1.5 mL of 80% (v/v) ethanol in a water bath at 80 °C for 30 min. After 10 min of centrifugation at 14,000× g, the soluble sugar concentration was determined colorimetrically at 490 nm using the phenol-sulfuric method [37]. Starch was extracted from the remaining pellets after measuring the sugar concentrations. The pellet was incubated in 2.5 mL sodium acetate buffer (0.2 M) in a 100 °C water bath for 1 h. After cooling to room temperature, 2 mL of the buffer and 1 mL of amyloglucosidase (0.5% by weight, Sigma A9229-1G) were added. The mixed samples were incubated overnight in a water bath at 55 °C. After 10 min of centrifugation at 14,000× g, the starch concentration was determined colorimetrically at 490 nm using the phenol-sulfuric method.

2.4. Measurement of Rubisco and Chlorophyll Contents

Rubisco was extracted from leaf discs stored at −80 °C, and Rubisco content on an area basis was determined using sodium dodecyl sulphate (SDS)-polyacrylamide gel electrophoresis (PAGE) [38]. One leaf disc (0.785 cm2) was ground using a homogenizer (FastPrep-24, MP Biomedicals, Solon, OH), and samples were extracted in 1 mL of extraction buffer at 4 °C. The protein extraction buffer comprised 80 mM Tris-HCl (pH 7.4), 1% (w/v) polyvinylpolypyrrolidone, 1.5% (v/v) glycerol, 100 mM β-mercaptoethanol, and 20 kg m−3 SDS. The samples were centrifuged at 15,000× g for 30 min at 4 °C, denatured at 90 °C for 5 min, and subsequently analyzed by SDS-PAGE.
Chlorophyll was extracted using the dimethyl sulfoxide (DMSO) method [39]. The two discs were incubated in a brown bottle containing 5 mL of DMSO at 65 °C for 6 h in a water bath. The samples were estimated at two wavelengths, 649 and 665 nm, using a spectrophotometer (Optizen 2120 UV, Mecasys, Korea). The chlorophyll N content was derived using the DMSO equation [40] as follows:
Total chlorophyll content (μg mL−1) = 21.44 A649 + 5.97 A665

2.5. Statistical Analysis

A three-way repeated-measures ANOVA was performed using the R program (ver. 3.3.2; R Core Team, 2016) for Amax, VCmax, Jmax, leaf Nmass, leaf Narea, Rubisco, PNUE, NSC, chlorophyll, and chlorophyll:Rubisco. Three-way repeated measures of ANOVA were performed with the fixed factors “CO2 treatment” and “nitrogen” and the random factor “period.” Two-way ANOVA was conducted on Nmass, NSC and biomass of stem and root, and total leaf production to compare the CO2 and N effects within a period. In repeated-measures ANOVA and two-way ANOVA, when the main factors of CO2 and N and interaction with CO2 treatment and N treatment were significant, Tukey’s HSD test was performed to compare the CO2 and N effects.

3. Results

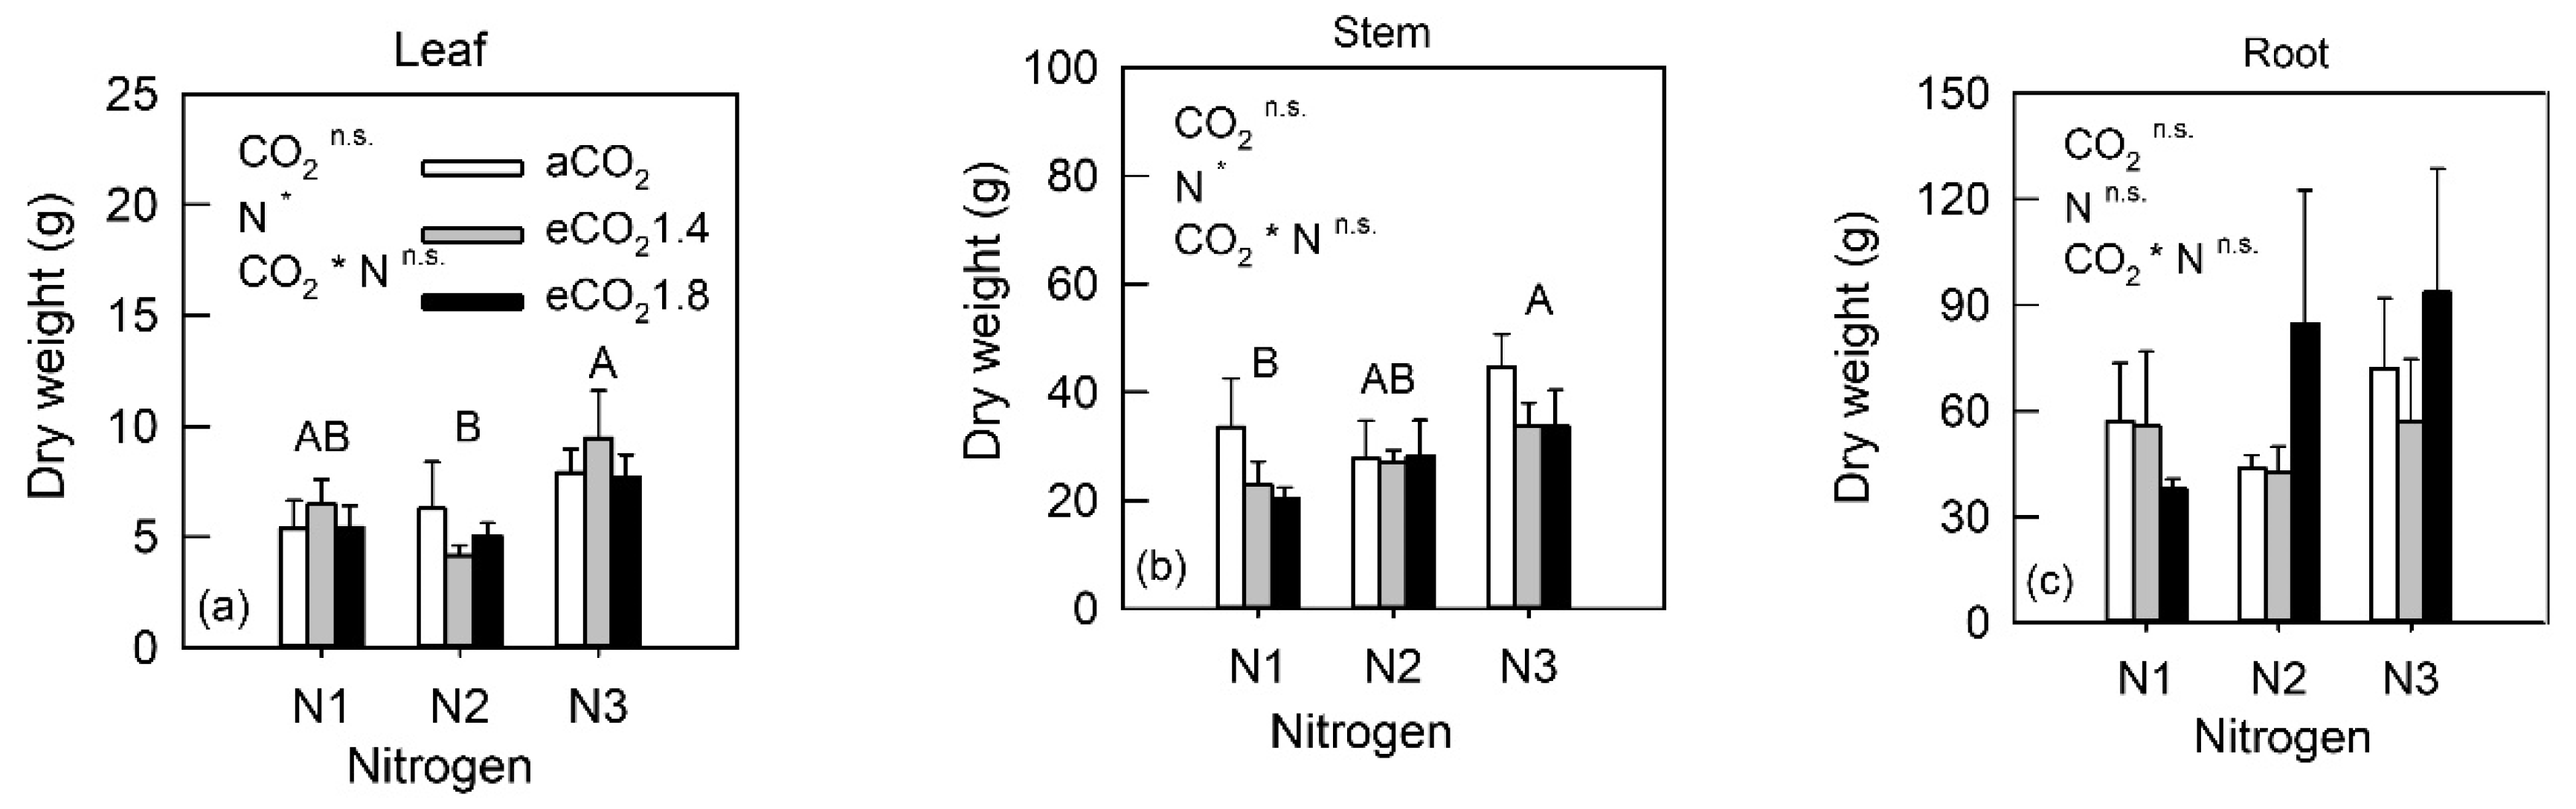
3.1. Whole Plant Biomass Allocation

There was a significant increase in the aboveground biomass with increased N fertilization, but no effect of CO2 treatment was observed (Figure 1). Leaf production under N3 condition (8.34 ± 0.83 g) was 43.3% and 61.7% higher than that under N1 (5.82 ± 0.62 g, p = 0.060) and N2 (5.16 ± 0.72 g, p = 0.018) conditions, respectively (Figure 1a). Stem production also increased with N fertilization, with that under N3 condition being 50. 2% higher than that under N1 condition (24.00 ± 3.12 g, p = 0.011, Figure 1b). Unlike the aboveground biomass, roots showed no differences with the N treatments (Figure 1c).

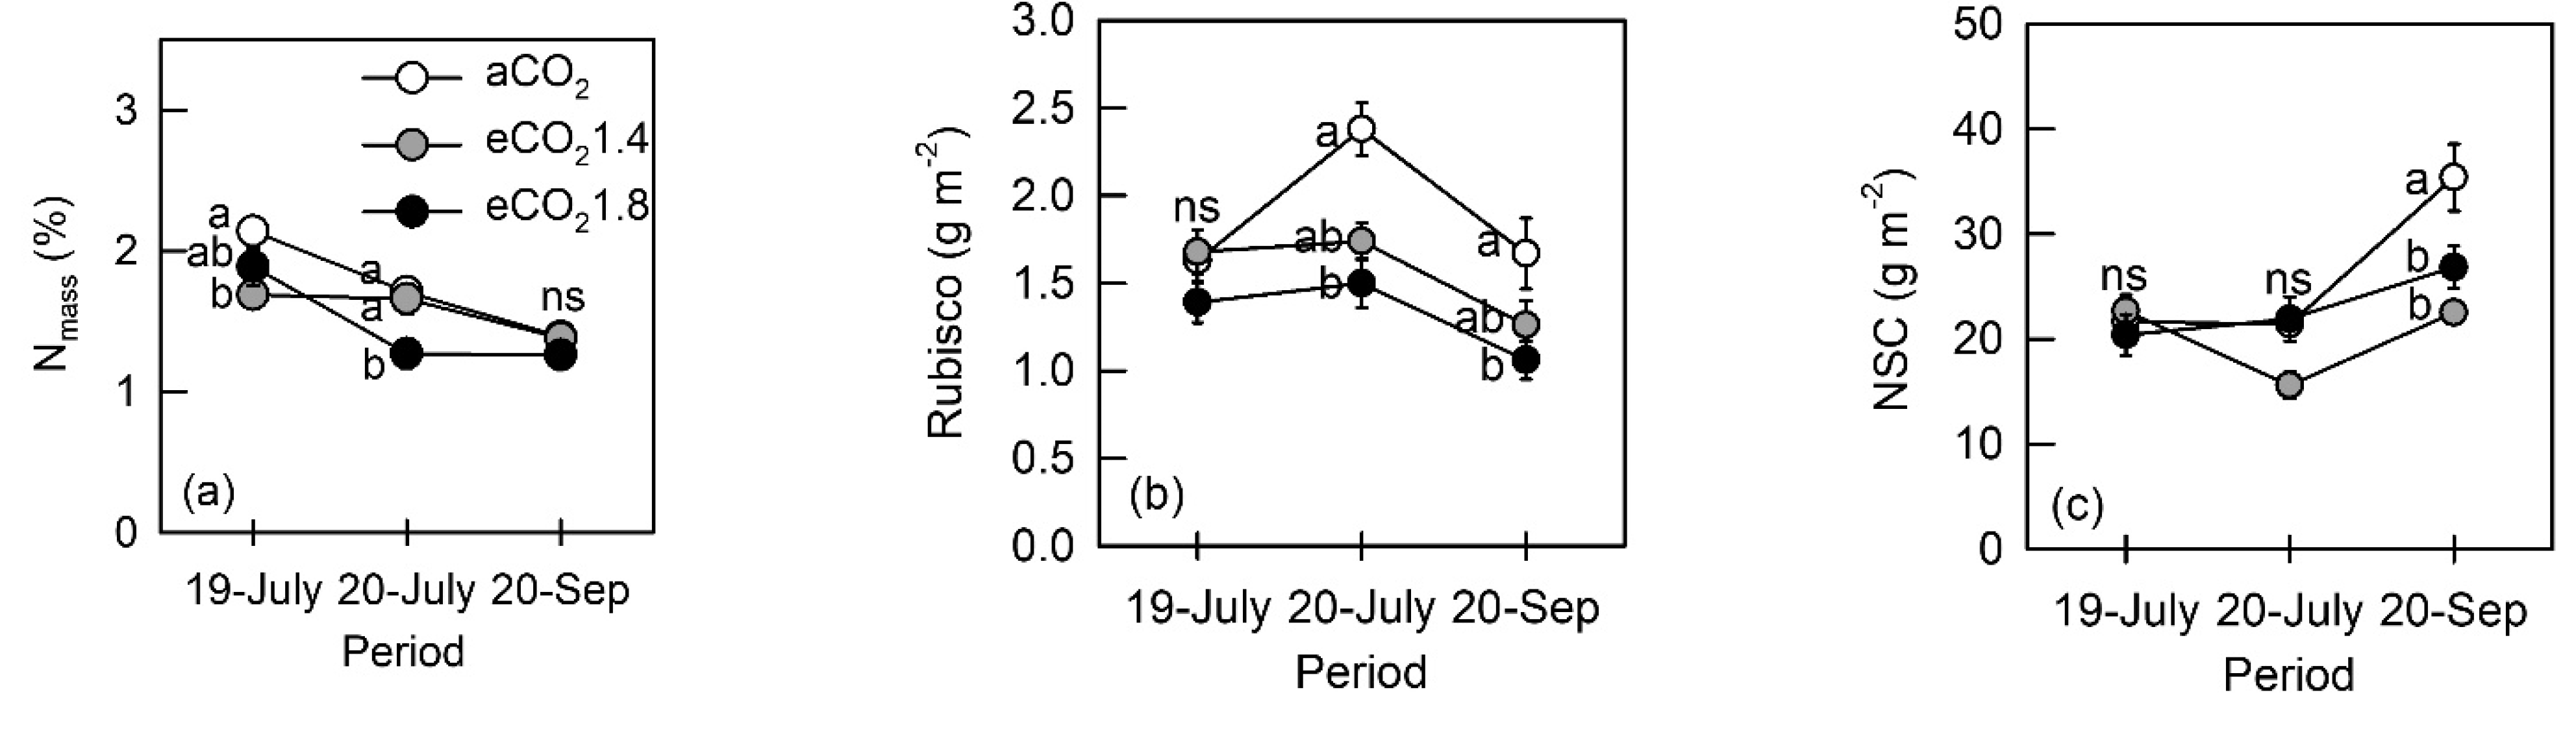
3.2. Photosynthetic Characteristics and Nonstructural Carbohydrates

Elevated CO2 exposure increased the light-saturated photosynthetic rate (Amax), and there was no N fertilization effect or interaction effect between N and CO2 treatments (Table 1). The average Amax was 20.1% and 31.0% higher under eCO21.4 (p = 0.036) and eCO21.8 (p < 0.001) conditions than under aCO2 condition, respectively, whereas Amax showed an increasing tendency under eCO2 conditions compared with that under aCO2 condition in all N treatments, although the difference was not significant (Table 2). Unlike Amax, down-regulation of other photosynthetic characteristics occurred, including Jmax, leaf N concentration, Rubisco content, and chlorophyll content (Table 1). The average Jmax under eCO21.8 was 20.9% and 18.0% lower than that under eCO21.4 condition (p = 0.002) and under aCO2 condition (p = 0.008), respectively, and Jmax under eCO21.8 condition decreased by 32.4% compared with that under aCO2 condition in N3 (Table 2, p = 0.012). Similarly, the average VCmax under eCO21.8 showed the lowest value and was lower than that under aCO2 in all N treatments, but there were only marginal differences in VCmax among CO2 treatments (p = 0.083, Table 2). Leaf Nmass decreased under eCO2 conditions and increased with N fertilization, but there was no interaction between N and CO2 treatments (Table 1). The average leaf Nmass decreased by 9.4% and 15.3% under eCO21.4 (p = 0.035) and eCO21.8 (p < 0.001) conditions compared with that under aCO2 condition, respectively (Table 2). In addition, Nmass showed an interaction effect between CO2 and time period (Table 1); thus, the differences in leaf Nmass decreased in September 2020 (Figure 2a). The reduction in leaf Nmass under eCO21.4 decreased from 21.0% (aCO2: 2.14 ± 0.08% vs. eCO21.4: 1.69 ± 0.09%) in 2019 to no significant decrease in July and September 2020; similarly, the reduction in leaf Nmass under eCO21.8 compared with that under aCO2 was significant in July, 2020 (aCO2: 1.71 ± 0.06% vs. eCO21.8: 1.27 ± 0.08%, −25.5%) but became non-significant in September 2020. For N treatment, Nmass showed incremental changes under both N2 and N3 treatments (N2: 1.69 ± 0.06%, +17.6%, N3: 1.68 ± 0.06%, +17.1%) compared with those under N1 (1.44 ± 0.07%, maximum P = 0.002). Similar to Nmass, Narea also decreased under eCO2 conditions (Table 1). The average Narea was 15.1% and 24.0% lower under eCO21.4 (p = 0.001) and eCO21.8 (p < 0.001) conditions than under aCO2 condition, respectively (Table 2). Unlike Nmass, Narea did not show an N-fertilization effect. In addition, there was no interaction between N and CO2 interaction (Table 1), but Narea decreased by 34.3% and 24.8% under eCO21.8 condition compared with that under aCO2 condition in N1 and N2, respectively (Table 2).
Rubisco content decreased under eCO2 conditions, but there was no N fertilization effect (Table 1). The average Rubisco content decreased with increasing CO2 concentration (maximum p = 0.040) and Rubisco content under eCO21.8 condition decreased by 39.0% compared with that under aCO2 condition in N3 (Table 2, p < 0.001). In addition, Rubisco contents showed an interaction between CO2 and time period (Table 1). Rubisco did not differ with CO2 concentrations in 2019 but decreases under eCO2 condition in 2020 (Figure 2b). Rubisco content was 37.0% and 36.5% lower under eCO21.8 than under aCO2 in July (aCO2: 2.38 ± 0.15 g m−2, p = 0.014) and September (aCO2: 1.66 ± 0.20 g m−2, p < 0.001), respectively.
To examine the dilution hypothesis and determine whether N fertilization could mitigate the down-regulation of photosynthesis, NSC were quantified in different CO2 and N treatments. NSC differed depending on the CO2 treatments and time periods (Table 1). In contrast to previous results of NSC under eCO2 conditions, the average NSC was 44.5% lower under eCO21.4 (p < 0.001) than under aCO2, and the average NSC under eCO21.8 tended to be lower than that under aCO2 but not significantly (p = 0.061). Moreover, the reduction in NSC under eCO2 conditions was noticeably greater in N3 than in the other N treatments (Table 2). The NSC in September (28.21 ± 1.51 g m−2) were higher than those in July (2019: 21.58 ± 0.94 g m−2, 2020: 19.78 ± 1.02 g m−2, maximum p < 0.001). In addition, NSC showed a correlation between CO2 concentrations and time period (Table 1). There was no reduction in NSC under eCO2 in July 2019 and 2020, but NSC were reduced by 36.5% and 24.1% under eCO21.4 (p < 0.001) and eCO21.8 (p < 0.001) relative to those under aCO2 (35.40 ± 3.19 g m−2) in September 2020 (Figure 2c).
Table 1 shows that PNUE also increased with eCO2 concentration. The average PNUE was higher under eCO21.4 (52.0%, p < 0.001) and eCO21.8 (66.6%, p < 0.001) than under aCO2, whereas PNUE increased under eCO21.8 in all N treatments (Table 2). There was a decrease in the chlorophyll content under eCO21.8 compared with that under aCO2 (Table 1). The chlorophyll content was 11.8% lower under eCO21.8 than that under aCO2 (p = 0.006, Table 2). Moreover, the chlorophyll: Rubisco ratio showed no differences between CO2 treatments (Table 1); thus, there was no leaf N reallocation under eCO2 conditions and N fertilization treatments.

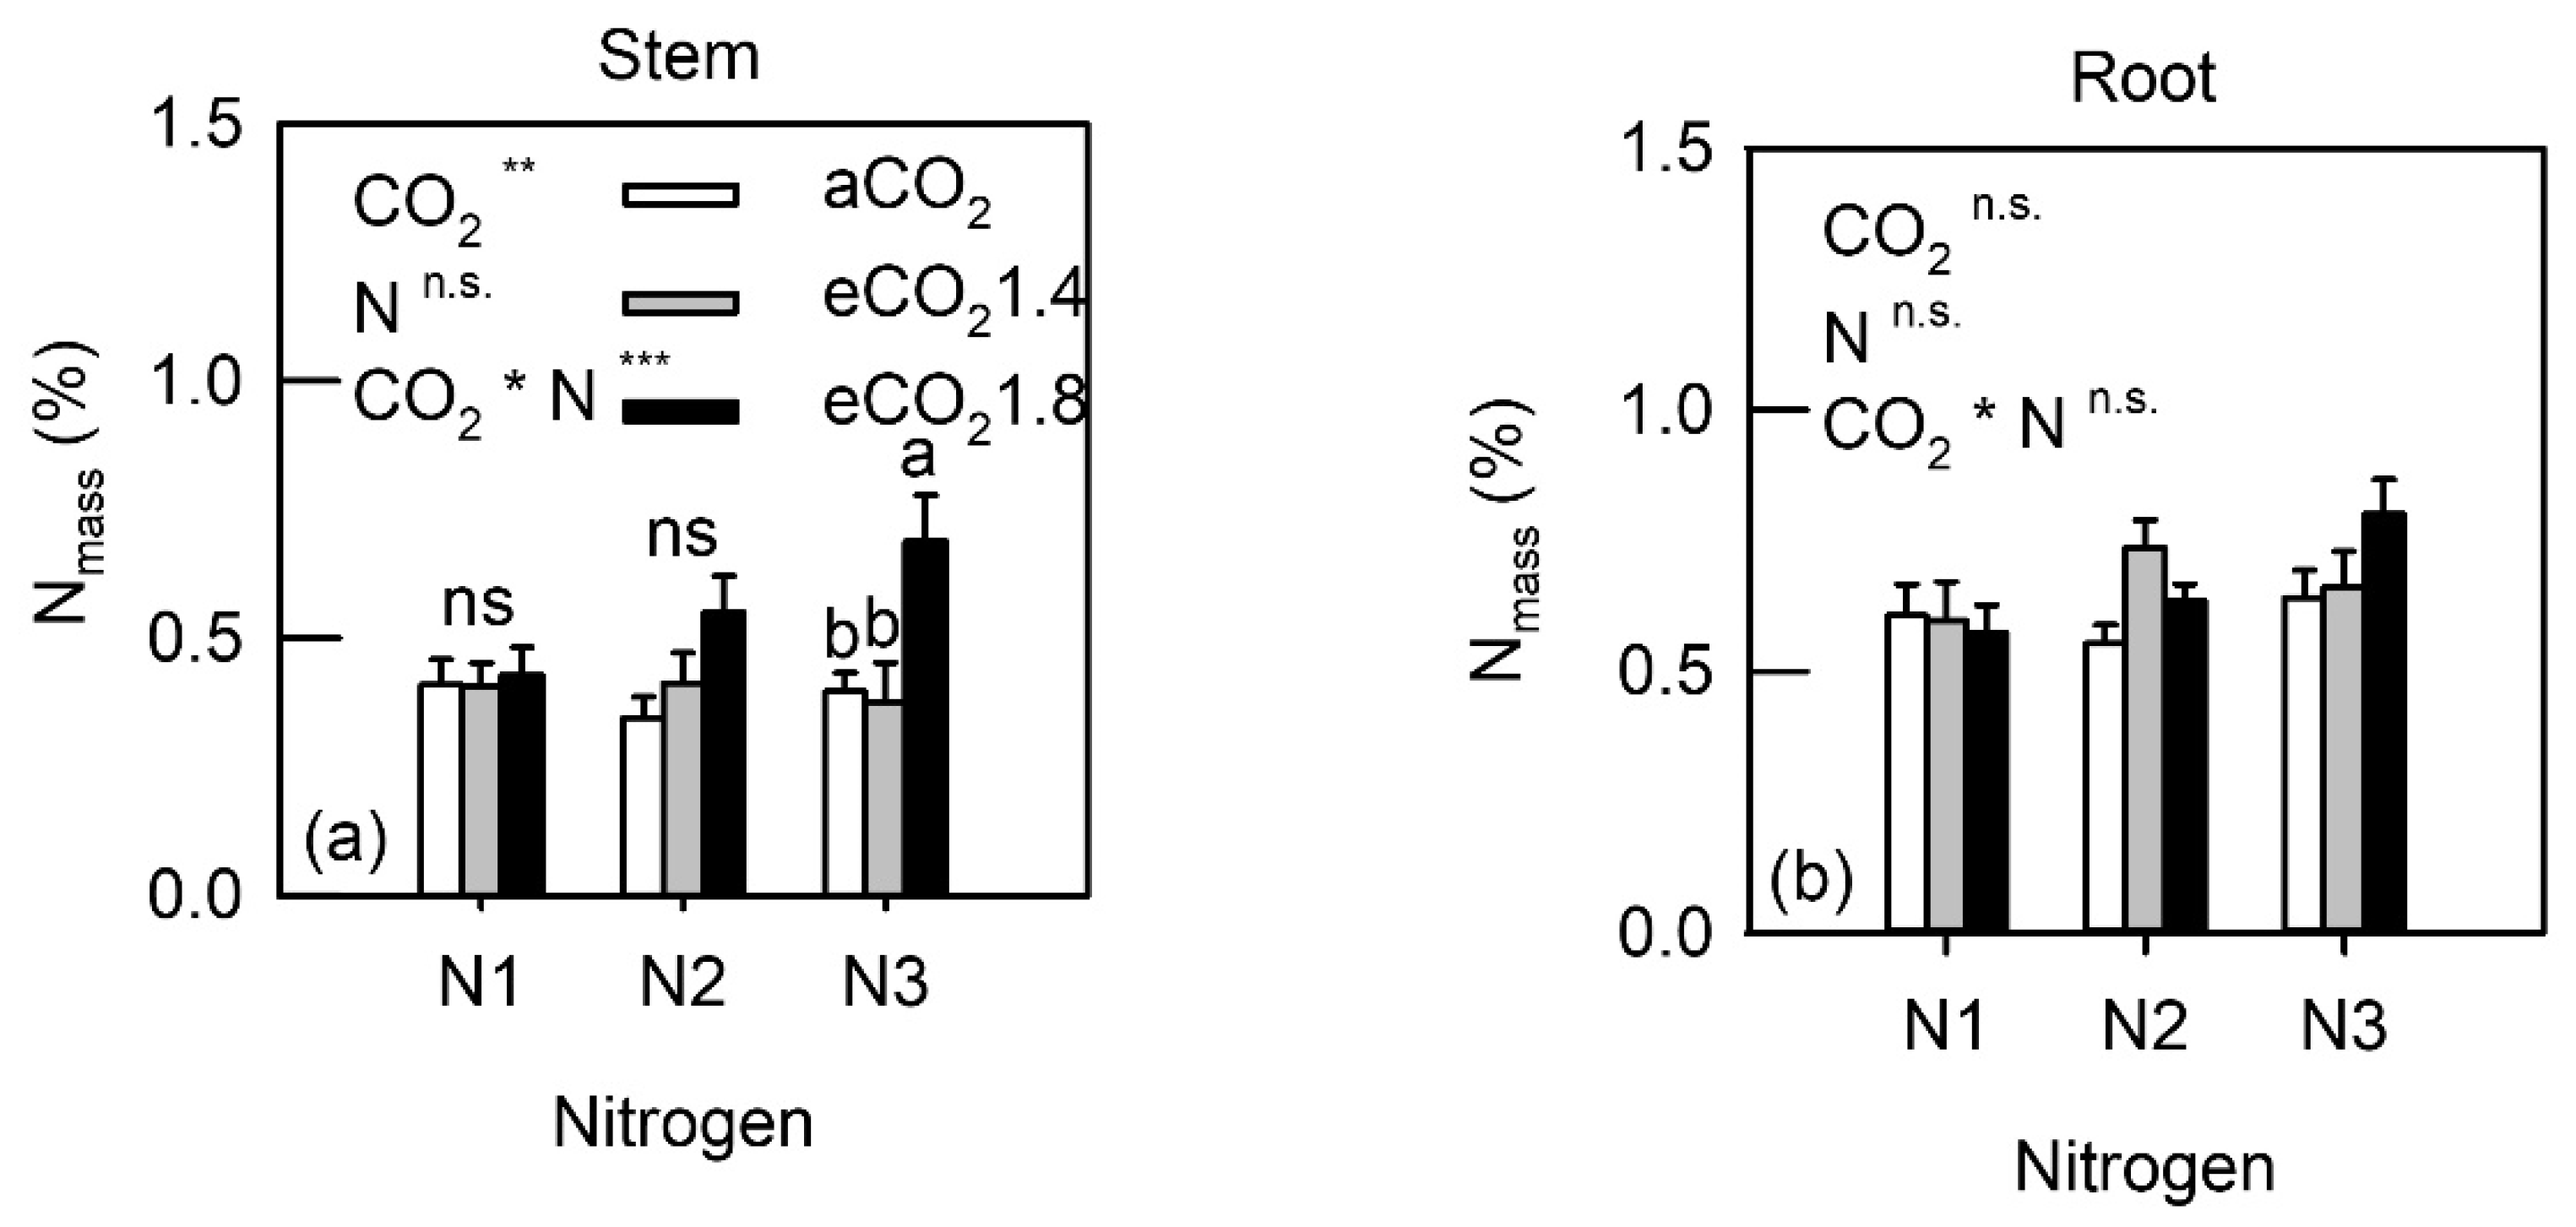
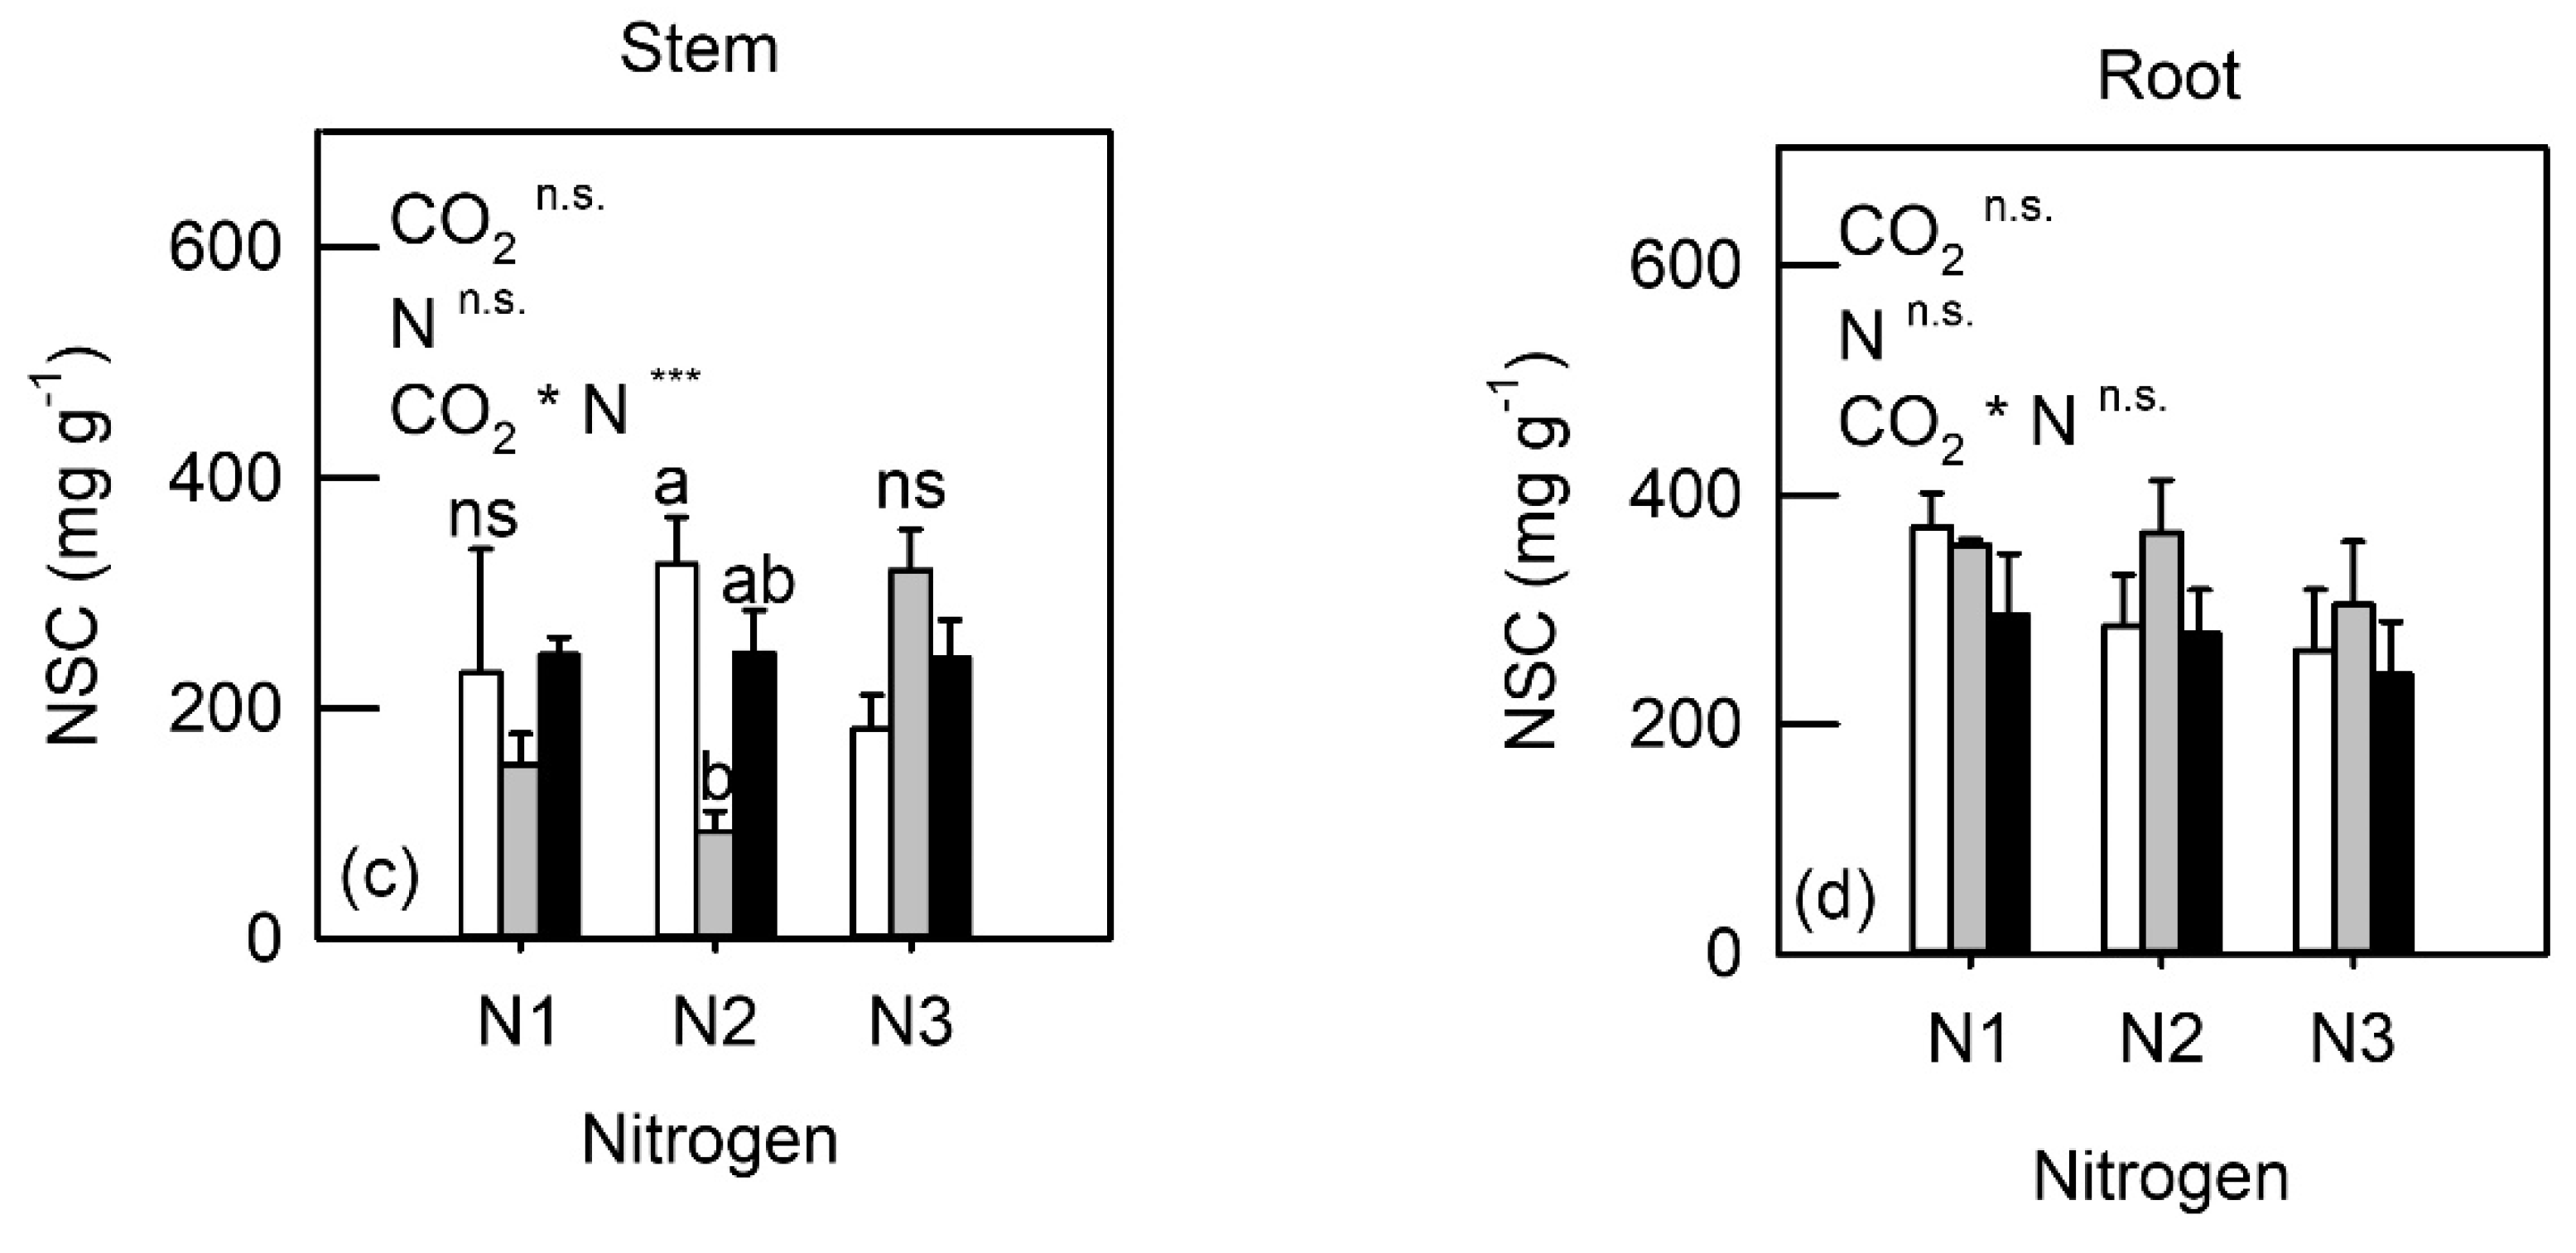
3.3. Whole-Plant Biochemical Characteristics

Stem Nmss was increased under eCO2 conditions, but there were no differences between the N treatments (Figure 3a). Stem Nmss under eCO2 1.8 (0.56 ± 0.05%) increased by 44.9% and 39.7% compared with that under aCO2 (p = 0.004) and eCO2 1.4 (0.40 ± 0.03%, p = 0.008), respectively. Although there was no interaction effect between N and CO2, stem Nmass under eCO21.8 was 74.1% and 83.5% higher than that under aCO2 (p = 0.036) and eCO2 1.4 (p = 0.020) in the N3 treatment, respectively. There were no differences in root Nmass between CO2 and N treatments (Figure 3b). For NSC, there was no effect of CO2 and N treatments, with an interaction effect of only N × CO2 on the stem. The NSC under eCO2 1.4 (230.08 ± 56.50 g) decreased by 76.1% compared with that under aCO2 (307.99 ± 28.79 g) only in N2 (p = 0.006) (Figure 3c). There were no differences in the root NSC between the CO2 and nitrogen treatments (Figure 3d).

4. Discussion

4.1. Biomass under eCO2 and N Fertilization

Biomass enhancement under eCO2 conditions has been reported in many previous studies [41]. However, the N availability and water status determined the increment of net primary production at the eCO2 Duke FACE site [42] and Flakaliden [43]. In the understory, the FACE experiment across years reported that the aboveground biomass of the understory community was 25% greater under eCO2 than under aCO2 [44]. However, similar to our study, which showed no increase in understory seedling biomass under eCO2 conditions in any plant part (leaf, stem, or root) (Figure 1), 15 tropical species showed no increase in understory stand biomass (leaf and stem) under eCO2 conditions [45]. Moreover, increased seedling biomass under eCO2 conditions is associated with light availability [46]. However, the pot limitation effect can also limit the biomass incurred by eCO2. In addition, F. excelsior and Dactylis glomerata seedlings showed marginal increases under eCO2. conditions in a pot experiment, similar to our results [47].
N fertilization can cause an increase in net primary production in terrestrial ecosystems [48]; however, understory tree responses to N fertilization were not significant in some studies [49,50]. In addition, N fertilization significantly decreased the aboveground biomass of understory Dicranopteris dichotoma and Lophatherum gracile by 82.1% and 67.2%, respectively, compared with that under unfertilized treatments [51]. However, in our study, leaf and stem biomass were increased by N fertilization without an interaction effect between CO2 and N (Figure 1). In summary, unlike overstory biomass, there was no increase in understory biomass under eCO2 conditions owing to low light availability and the effect of N availability but without an interaction with eCO2.

4.2. Down-Regulation of Photosynthesis and NSC under eCO2 and N Fertilization

Table 1 and Table 2 show reductions in leaf N and Rubisco contents under eCO2 conditions, without an N fertilization effect, except in case of leaf Nmass. A previous meta-analysis showed that down-regulation of photosynthesis was associated with reduced leaf Nmass and Rubisco content under eCO2 conditions [8,52]. Similar to the findings of other studies, leaf N and Rubisco contents also decreased under eCO2 conditions in understory seedlings (Table 2) in our study; however, the differences in Nmass among CO2 conditions decreased owing to retranslocation in September (Figure 2a). The dilution hypothesis suggests that down-regulation of photosynthesis is because of NSC accumulation resulting from a sink–source imbalance [11,53]. Yin [23] suggested that this sink–source imbalance can be mitigated by N fertilization under eCO2 conditions; however, in our study, there were no interaction effects between N and CO2 on Jmax, Rubisco content, and NSC, and the differences in Rubisco content and NSC among CO2 treatments were greater in N3 due to increased Rubisco content under aCO2 conditions by N fertilization (Table 1 and Table 2). Moreover, contrary to the dilution effect hypothesis, a reduction in NSC under eCO21.4 condition occurred in our study (Table 1 and Table 2). Some studies have shown no differences in understory NSC under eCO2 conditions, whereas NSC in a light-sufficient canopy increased under eCO2 conditions. For example, the NSC of Hedera helix was consistently 60% higher under eCO2 in the subcanopy; in contrast, leaves in the understory showed no differences in NSC between eCO2 and aCO2 conditions [54]. The accumulation of NSC increased noticeably with height in the canopy under eCO2 conditions in 15 tropical species, suggesting that full solar illumination accelerates sink and source imbalances under eCO2 conditions [45].
In addition, there was an interaction effect of CO2 and time period, resulting in a greater decrease in NSC under eCO2 conditions in September 2020, when leaf senescence started in the overstory and light availability increased in the understory (Table 1, Figure 2c). Therefore, decreased NSC under eCO2 conditions in the understory was related to decreased leaf N concentration and low light availability, and down-regulation of photosynthesis was not caused by the accumulation of NSC in this study. Some studies have suggested that photosynthesis down-regulation cannot be explained entirely by sink size [55,56]. Bloom, et al. [57] and Wujeska-Klause, Crous, Ghannoum and Ellsworth [17] suggested that lower leaf N concentration under eCO2 condition than under aCO2 condition is driven by insufficient reductant from decreased photorespiration, resulting in reduced NO3 assimilation compared with root absorption of NO3.
Although photosynthesis was downregulated, Amax enhancement of understory saplings under eCO2 conditions occurred for 2 years, regardless of N fertilization (Table 2). Similar to our results, Sefcik, et al. [58] reported that the long-term improvement of Amax under eCO2 conditions was 97% for seedlings in deep shade and 47% for those in moderate shade compared with seedlings grown under CO2 conditions. Similarly, several previous studies have reported that the impact of eCO2 increases Amax under light-limiting conditions [59,60,61].

4.3. PNUE and N Allocation under eCO2 Conditions and N Fertilization

Increased PNUE is associated with the enhanced efficiency of Rubisco due to photorespiration suppression under eCO2 conditions [8]. Similar to the findings of a previous study, PNUE increased under eCO2 conditions regardless of N fertilization (Table 1 and Table 2). In general, increased leaf N concentration was accompanied by decreased PNUE, but the increase in PNUE was sustained under eCO2 conditions despite a high N supply, similar to our results [62,63]. Davey, Parsons, Atkinson, Wadge and Long [63] suggested that the eCO2 effect may improve PNUE, independent of leaf N content. Increased PNUE under eCO2 conditions was associated with the reallocation of leaf N from Rubisco to other photosynthetic apparatuses, such as light harvesting or electron transport enzymes [64]. However, there were no differences in the chlorophyll: Rubisco ratio among the CO2 treatments (Table 1), and chlorophyll were reduced by the effect of eCO2 (Table 2). In contrast to the findings of our study, other studies have noted an increase in chlorophyll under eCO2 conditions [65]. In addition, a small decrease in Rubisco content via suppression of Rubisco small subunit (RBC) genes led to increased chlorophyll content under eCO2 conditions [16]. In contrast, the chlorophyll content was significantly reduced under eCO2 conditions in some seedling experiments [66,67].

4.4. Biochemical Changes in Sink Organs under eCO2 and N Fertilization

Unlike the reduction of leaf Nmass under eCO2 conditions, the stem Nmass under eCO2 conditions increased compared with that under aCO2 conditions, showing noticeable differences under N3 treatment in this study (Figure 3a). Root Nmass also showed a similar tendency, but the difference was not significant (Figure 3b). However, the average root Nmass under eCO2 conditions decreased by 7.1% compared with that under aCO2 conditions in a meta-analysis [68], and stem Nmass under eCO2 conditions was also reduced in 11 species [69]. However, similar to the findings of our study, eCO2 significantly increased the grain yield of rice crops in middle N and high N concentrations with a reduction of leaf N concentration under eCO2 conditions, which was attributed to the increased N uptake under eCO2 conditions being the highest at high N concentration [70].
Taub and Wang [19] suggested that the reduction of Nmass in whole plants can be attributed to the accumulation of NSC under eCO2 conditions. In this study, the NSC of stems showed no differences among CO2 treatments, except for N2, being lower under eCO21.4 than under aCO2 (Figure 3c). For root NSC, there were no differences between the N and CO2 treatments (Figure 3d). In the case of Populus cathayana, root starch significantly decreased under eCO2 conditions compared with that under aCO2 conditions under low N concentration, and stem starch increased under eCO2 conditions in both N-fertilized and unfertilized conditions [71]. However, there were no changes in soluble sugar in aboveground woody parts and roots under eCO2 conditions compared with those under aCO2 conditions, whereas starch increased by 9.8% under elevated CO2 conditions in 71 species in a meta-analysis. The NSC of roots and stems varied with species and growth conditions, and we concluded that the Nmass of roots and stems was not affected by the NSC of those parts in this study.

5. Conclusions

The reduction of leaf N and Rubisco contents decreased under eCO2 conditions in the understory, but N fertilization could not mitigate this decrease. In addition, NSC decreased under eCO2 conditions; this result contradicts that of previous overstory studies, wherein leaf NSC increased under eCO2 conditions. The reduction of leaf N and Rubisco content was not caused by NSC accumulation, and decreased NSC was associated with insufficient light availability in the understory. Reduction of leaf Nmass could be related to PNUE improvement, resulting from reduced photorespiration driving less availability of reductant in NO3 under eCO2 conditions. Unlike leaf N, stem N increased under eCO2 conditions, and there was no change in root N. The increase in stem Nmass might have been caused by increased N uptake under N fertilization treatment.

Author Contributions

Conceptualization, S.B. and H.S.K.; Methodology, S.-H.H. and C.O.; Investigation, K.K., J.H., S.K. (Seohyun Kim), S.K. (Sukyung Kim), C.P. and D.R.; Writing—Original Draft Preparation, S.B.; Writing—Review & Editing, S.B. and H.S.K.; Visualization, S.B.; Supervision, H.S.K.; Project Administration, H.S.K.; Funding Acquisition, H.S.K. All authors have read and agreed to the published version of the manuscript.

Funding

This research was funded by the National Research Foundation of Korea (grant numbers 2017R1A2B22012605 and 2014R1A1A2055127).

Acknowledgments

We would like to thank the Department of Forest Bioresources, the National Institute of Forest Science for their assistance.

Conflicts of Interest

The authors declare no conflict of interest.

References

  1. Drake, B.G.; Gonzalez-Meler, M.A.; Long, S.P. More efficient plants: A consequence of rising atmospheric CO2? Annu. Rev. Plant Physiol. Plant Mol. Biol. 1997, 48, 609–639. [Google Scholar] [CrossRef] [Green Version]
  2. Reich, P.B.; Hobbie, S.E.; Lee, T.D.; Pastore, M.A. Unexpected reversal of C3 versus C4 grass response to elevated CO2 during a 20-year field experiment. Science 2018, 360, 317–320. [Google Scholar] [CrossRef] [Green Version]
  3. Ainsworth, E.A.; Long, S.P. What have we learned from 15 years of free-air CO2 enrichment (FACE)? A meta-analytic review of the responses of photosynthesis, canopy properties and plant production to rising CO2. New Phytol. 2005, 165, 351–372. [Google Scholar] [CrossRef]
  4. Norby, R.J.; Warren, J.M.; Iversen, C.M.; Medlyn, B.E.; McMurtrie, R.E. CO2 enhancement of forest productivity constrained by limited nitrogen availability. Proc. Natl. Acad. Sci. USA 2010, 107, 19368–19373. [Google Scholar] [CrossRef] [Green Version]
  5. Jiang, M.; Medlyn, B.E.; Drake, J.E.; Duursma, R.A.; Anderson, I.C.; Barton, C.V.; Boer, M.M.; Carrillo, Y.; Castañeda-Gómez, L.; Collins, L. The fate of carbon in a mature forest under carbon dioxide enrichment. Nature 2020, 580, 227–231. [Google Scholar] [CrossRef]
  6. Wang, S.; Zhang, Y.; Ju, W.; Chen, J.M.; Ciais, P.; Cescatti, A.; Sardans, J.; Janssens, I.A.; Wu, M.; Berry, J.A. Recent global decline of CO2 fertilization effects on vegetation photosynthesis. Science 2020, 370, 1295–1300. [Google Scholar] [CrossRef]
  7. Luo, Y.; Su, B.; Currie, W.S.; Dukes, J.S.; Finzi, A.C.; Hartwig, U.; Hungate, B.; McMurtrie, R.E.; Oren, R.; Parton, W.J.; et al. Progressive nitrogen limitation of ecosystem responses to rising atmospheric carbon dioxide. Bioscience 2004, 54, 731–739. [Google Scholar] [CrossRef] [Green Version]
  8. Leakey, A.D.B.; Ainsworth, E.A.; Bernacchi, C.J.; Rogers, A.; Long, S.P.; Ort, D.R. Elevated CO2 effects on plant carbon, nitrogen, and water relations: Six important lessons from FACE. J. Exp. Bot. 2009, 60, 2859–2876. [Google Scholar] [CrossRef]
  9. Evans, J.R. Photosynthesis and nitrogen relationships in leaves of C 3 plants. Oecologia 1989, 78, 9–19. [Google Scholar] [CrossRef]
  10. Moore, B.; Cheng, S.H.; Sims, D.; Seemann, J. The biochemical and molecular basis for photosynthetic acclimation to elevated atmospheric CO2. Plant Cell Environ. 1999, 22, 567–582. [Google Scholar] [CrossRef]
  11. Ainsworth, E.A.; Rogers, A.; Nelson, R.; Long, S.P. Testing the “source–sink” hypothesis of down-regulation of photosynthesis in elevated [CO2] in the field with single gene substitutions in Glycine max. Agric. For. Meteorol. 2004, 122, 85–94. [Google Scholar] [CrossRef]
  12. Hovenden, M.J. Photosynthesis of coppicing poplar clones in a free-air CO2 enrichment (FACE) experiment in a short-rotation forest. Funct. Plant Biol. 2003, 30, 391–400. [Google Scholar] [CrossRef]
  13. Kelly, A.A.; van Erp, H.; Quettier, A.-L.; Shaw, E.; Menard, G.; Kurup, S.; Eastmond, P.J. The sugar-dependent1 lipase limits triacylglycerol accumulation in vegetative tissues of Arabidopsis. Plant Physiol. 2013, 162, 1282–1289. [Google Scholar] [CrossRef] [Green Version]
  14. Sugiura, D.; Watanabe, C.K.; Betsuyaku, E.; Terashima, I. Sink–source balance and down-regulation of photosynthesis in Raphanus sativus: Effects of grafting, N and CO2. Plant Cell Physiol. 2017, 58, 2043–2056. [Google Scholar] [CrossRef] [PubMed]
  15. Ruiz-Vera, U.M.; De Souza, A.P.; Long, S.P.; Ort, D.R. The role of sink strength and nitrogen availability in the down-regulation of photosynthetic capacity in field-grown Nicotiana tabacum L. at elevated CO2 concentration. Front. Plant Sci. 2017, 8, 998. [Google Scholar] [CrossRef]
  16. Kanno, K.; Suzuki, Y.; Makino, A. A small decrease in Rubisco content by individual suppression of RBCS genes leads to improvement of photosynthesis and greater biomass production in rice under conditions of elevated CO2. Plant Cell Physiol. 2017, 58, 635–642. [Google Scholar] [CrossRef] [Green Version]
  17. Wujeska-Klause, A.; Crous, K.Y.; Ghannoum, O.; Ellsworth, D.S. Lower photorespiration in elevated CO2 reduces leaf N concentrations in mature Eucalyptus trees in the field. Glob. Chang. Biol. 2019, 25, 1282–1295. [Google Scholar] [CrossRef]
  18. Gifford, R.M.; Barrett, D.J.; Lutze, J.L. The effects of elevated [CO2] on the C: N and C: P mass ratios of plant tissues. Plant Soil 2000, 224, 1–14. [Google Scholar] [CrossRef]
  19. Taub, D.R.; Wang, X. Why are nitrogen concentrations in plant tissues lower under elevated CO2? A critical examination of the hypotheses. J. Integr. Plant Biol. 2008, 50, 1365–1374. [Google Scholar] [CrossRef] [PubMed]
  20. Taub, D.R.; Miller, B.; Allen, H. Effects of elevated CO2 on the protein concentration of food crops: A meta-analysis. Glob. Chang. Biol. 2008, 14, 565–575. [Google Scholar] [CrossRef]
  21. Wang, L.; Feng, Z.; Schjoerring, J.K. Effects of elevated atmospheric CO2 on physiology and yield of wheat (Triticum aestivum L.): A meta-analytic test of current hypotheses. Agric. Ecosyst. Environ. 2013, 178, 57–63. [Google Scholar] [CrossRef]
  22. Li, W.; Hartmann, H.; Adams, H.D.; Zhang, H.; Jin, C.; Zhao, C.; Guan, D.; Wang, A.; Yuan, F.; Wu, J. The sweet side of global change–dynamic responses of non-structural carbohydrates to drought, elevated CO2 and nitrogen fertilization in tree species. Tree Physiol. 2018, 38, 1706–1723. [Google Scholar] [CrossRef]
  23. Yin, X. Responses of leaf nitrogen concentration and specific leaf area to atmospheric CO2 enrichment: A retrospective synthesis across 62 species. Glob. Chang. Biol. 2002, 8, 631–642. [Google Scholar] [CrossRef]
  24. Bazzaz, F.; Miao, S. Successional Status, Seed Size, and Responses of Tree Seedlings to CO 2, Light, and Nutrients. Ecology 1993, 74, 104–112. [Google Scholar] [CrossRef]
  25. Sholtis, J.D.; Gunderson, C.A.; Norby, R.J.; Tissue, D.T. Persistent stimulation of photosynthesis by elevated CO2 in a sweetgum (Liquidambar styraciflua) forest stand. New Phytol. 2004, 162, 343–354. [Google Scholar] [CrossRef]
  26. Ellsworth, D.S.; Reich, P.B.; Naumburg, E.S.; Koch, G.W.; Kubiske, M.E.; Smith, S.D. Photosynthesis, carboxylation and leaf nitrogen responses of 16 species to elevated pCO2 across four free-air CO2 enrichment experiments in forest, grassland and desert. Glob. Chang. Biol. 2004, 10, 2121–2138. [Google Scholar] [CrossRef] [Green Version]
  27. Kerstiens, G. Meta-analysis of the interaction between shade-tolerance, light environment and growth response of woody species to elevated CO2. Acta Oecol. 2001, 22, 61–69. [Google Scholar] [CrossRef]
  28. Dirnböck, T.; Kraus, D.; Grote, R.; Klatt, S.; Kobler, J.; Schindlbacher, A.; Seidl, R.; Thom, D.; Kiese, R. Substantial understory contribution to the C sink of a European temperate mountain forest landscape. Landsc. Ecol. 2020, 35, 483–499. [Google Scholar] [CrossRef] [Green Version]
  29. Wu, J.; Liu, Z.; Chen, D.; Huang, G.; Zhou, L.; Fu, S. Understory plants can make substantial contributions to soil respiration: Evidence from two subtropical plantations. Soil Biol. Biochem. 2011, 43, 2355–2357. [Google Scholar] [CrossRef]
  30. Stocker, T.F.; Qin, D.; Plattner, G.-K.; Tignor, M.; Allen, S.K.; Boschung, J.; Nauels, A.; Xia, Y.; Bex, V.; Midgley, P.M. Climate Change 2013: The Physical Science Basis. In Contribution of Working Group I to the Fifth Assessment Report of the Intergovernmental Panel on Climate Change; Cambridge University Press: Cambridge, UK, 2013; Volume 1535. [Google Scholar]
  31. Lee, J.-C.; Kim, D.-H.; Kim, G.-N.; Kim, P.-G.; Han, S.-H. Long-term climate change research facility for trees: CO2-enriched open top chamber system. Korean J. Agric. For. Meteorol. 2012, 14, 19–27. [Google Scholar] [CrossRef] [Green Version]
  32. Eriksson, H.; Eklundh, L.; Hall, K.; Lindroth, A. Estimating LAI in deciduous forest stands. Agric. For. Meteorol. 2005, 129, 27–37. [Google Scholar] [CrossRef]
  33. Billings, S.A.; Ziegler, S.E. Altered patterns of soil carbon substrate usage and heterotrophic respiration in a pine forest with elevated CO2 and N fertilization. Glob. Chang. Biol. 2008, 14, 1025–1036. [Google Scholar] [CrossRef]
  34. Kitao, M.; Löw, M.; Heerdt, C.; Grams, T.E.; Häberle, K.-H.; Matyssek, R. Effects of chronic elevated ozone exposure on gas exchange responses of adult beech trees (Fagus sylvatica) as related to the within-canopy light gradient. Environ. Pollut. 2009, 157, 537–544. [Google Scholar] [CrossRef] [PubMed]
  35. Larcher, W. Physiological Plant Ecology: Ecophysiology and Stress Physiology of Functional Groups; Springer Science & Business Media, Institute of Botany University of Innsbruck Sternwartestrasse: Innsbruck, Austria, 2003. [Google Scholar]
  36. Sharkey, T.D. What gas exchange data can tell us about photosynthesis. Plant Cell Environ. 2016, 39, 1161–1163. [Google Scholar] [CrossRef] [PubMed]
  37. Ashwell, G. New colorimetric methods of sugar analysis. In Methods in Enzymology; Elsevier, Michigan State University: East Lansing, MI, USA, 1966; Volume 8, pp. 85–95. [Google Scholar]
  38. Hikosaka, K.; Shigeno, A. The role of Rubisco and cell walls in the interspecific variation in photosynthetic capacity. Oecologia 2009, 160, 443–451. [Google Scholar] [CrossRef]
  39. Shinano, T.; Lei, T.; Kawamukai, T.; Inoue, M.; Koike, T.; Tadano, T. Dimethylsulfoxide method for the extraction of chlorophylls a and b from the leaves of wheat, field bean, dwarf bamboo, and oak. Photosynthetica 1996, 32, 409–415. [Google Scholar]
  40. Wellburn, A.R. The spectral determination of chlorophylls a and b, as well as total carotenoids, using various solvents with spectrophotometers of different resolution. J. Plant Physiol. 1994, 144, 307–313. [Google Scholar] [CrossRef]
  41. van der Kooi, C.J.; Reich, M.; Löw, M.; De Kok, L.J.; Tausz, M. Growth and yield stimulation under elevated CO2 and drought: A meta-analysis on crops. Environ. Exp. Bot. 2016, 122, 150–157. [Google Scholar] [CrossRef]
  42. McCarthy, H.R.; Oren, R.; Johnsen, K.H.; Gallet-Budynek, A.; Pritchard, S.G.; Cook, C.W.; LaDeau, S.L.; Jackson, R.B.; Finzi, A.C. Re-assessment of plant carbon dynamics at the Duke free-air CO2 enrichment site: Interactions of atmospheric [CO2] with nitrogen and water availability over stand development. New Phytol. 2010, 185, 514–528. [Google Scholar] [CrossRef]
  43. Ryan, M.G. Three decades of research at Flakaliden advancing whole-tree physiology, forest ecosystem and global change research. Tree Physiol. 2013, 33, 1123–1131. [Google Scholar] [CrossRef] [Green Version]
  44. Souza, L.; Belote, R.T.; Kardol, P.; Weltzin, J.F.; Norby, R.J. CO2 enrichment accelerates successional development of an understory plant community. J. Plant Ecol. 2010, 3, 33–39. [Google Scholar] [CrossRef]
  45. Körner, C.; Arnone, J.A. Responses to elevated carbon dioxide in artificial tropical ecosystems. Science 1992, 257, 1672–1675. [Google Scholar] [CrossRef] [PubMed]
  46. Hättenschwiler, S.e.; Körner, C.r. Tree seedling responses to in situ CO2-enrichment differ among species and depend on understorey light availability. Glob. Chang. Biol. 2000, 6, 213–226. [Google Scholar] [CrossRef]
  47. Bloor, J.; Barthes, L.; Leadley, P.W. Effects of elevated CO2 and N on tree–grass interactions: An experimental test using Fraxinus excelsior and Dactylis glomerata. Funct. Ecol. 2008, 22, 537–546. [Google Scholar] [CrossRef]
  48. LeBauer, D.S.; Treseder, K.K. Nitrogen limitation of net primary productivity in terrestrial ecosystems is globally distributed. Ecology 2008, 89, 371–379. [Google Scholar] [CrossRef] [Green Version]
  49. Tian, D.; Li, P.; Fang, W.; Xu, J.; Luo, Y.; Yan, Z.; Zhu, B.; Wang, J.; Xu, X.; Fang, J. Growth responses of trees and understory plants to nitrogen fertilization in a subtropical forest in China. Biogeosciences 2017, 14, 3461–3469. [Google Scholar] [CrossRef] [Green Version]
  50. Son, Y.; Lee, M.-H.; Noh, N.J.; Kang, B.H.; Kim, K.O.; Yi, M.J.; Byun, J.K.; Yi, K. Fertilization effects on understory vegetation biomass and structure in four different plantations. J. Korean Soc. For. Sci. 2007, 96, 520–527. [Google Scholar]
  51. Wang, F.; Chen, F.; Wang, G.G.; Mao, R.; Fang, X.; Wang, H.; Bu, W. Effects of experimental nitrogen addition on nutrients and nonstructural carbohydrates of dominant understory plants in a Chinese fir plantation. Forests 2019, 10, 155. [Google Scholar] [CrossRef] [Green Version]
  52. Rogers, A.; Ellsworth, D.S. Photosynthetic acclimation of Pinus taeda (loblolly pine) to long-term growth in elevated pCO(2) (FACE). Plant Cell Environ. 2002, 25, 851–858. [Google Scholar] [CrossRef] [Green Version]
  53. Stitt, M.; Krapp, A. The interaction between elevated carbon dioxide and nitrogen nutrition: The physiological and molecular background. Plant Cell Environ. 1999, 22, 583–621. [Google Scholar] [CrossRef]
  54. Zotz, G.; Cueni, N.; Körner, C. In situ growth stimulation of a temperate zone liana (Hedera helix) in elevated CO2. Funct. Ecol. 2006, 20, 763–769. [Google Scholar] [CrossRef]
  55. Ziska, L.H.; Bunce, J.A. Sensitivity of field-grown soybean to future atmospheric CO2: Selection for improved productivity in the 21st century. Funct. Plant Biol. 2000, 27, 979–984. [Google Scholar] [CrossRef]
  56. Ziska, L.H.; Bunce, J.A.; Caulfield, F.A. Rising atmospheric carbon dioxide and seed yield of soybean genotypes. Crop Sci. 2001, 41, 385–391. [Google Scholar] [CrossRef]
  57. Bloom, A.J.; Burger, M.; Asensio, J.S.R.; Cousins, A.B. Carbon dioxide enrichment inhibits nitrate assimilation in wheat and Arabidopsis. Science 2010, 328, 899–903. [Google Scholar] [CrossRef] [Green Version]
  58. Sefcik, L.T.; Zak, D.R.; Ellsworth, D.S. Photosynthetic responses to understory shade and elevated carbon dioxide concentration in four northern hardwood tree species. Tree Physiol. 2006, 26, 1589–1599. [Google Scholar] [CrossRef] [Green Version]
  59. Hättenschwiler, S. Tree seedling growth in natural deep shade: Functional traits related to interspecific variation in response to elevated CO2. Oecologia 2001, 129, 31–42. [Google Scholar] [CrossRef] [PubMed]
  60. Leakey, A.; Press, M.C.; Scholes, J.; Watling, J. Relative enhancement of photosynthesis and growth at elevated CO2 is greater under sunflecks than uniform irradiance in a tropical rain forest tree seedling. Plant Cell Environ. 2002, 25, 1701–1714. [Google Scholar] [CrossRef]
  61. Granados, J.; Körner, C. In deep shade, elevated CO2 increases the vigor of tropical climbing plants. Glob. Chang. Biol. 2002, 8, 1109–1117. [Google Scholar] [CrossRef]
  62. Novriyanti, E.; Watanabe, M.; Kitao, M.; Utsugi, H.; Uemura, A.; Koike, T. High nitrogen and elevated [CO2] effects on the growth, defense and photosynthetic performance of two eucalypt species. Environ. Pollut. 2012, 170, 124–130. [Google Scholar] [CrossRef] [Green Version]
  63. Davey, P.; Parsons, A.; Atkinson, L.; Wadge, K.; Long, S.P. Does photosynthetic acclimation to elevated CO2 increase photosynthetic nitrogen-use efficiency? A study of three native UK grassland species in open-top chambers. Funct. Ecol. 1999, 13, 21–28. [Google Scholar] [CrossRef] [Green Version]
  64. Evans, J.R.; Seemann, J.R. The allocation of protein nitrogen in the photosynthetic apparatus: Costs, consequences, and control. Photosynthesis 1989, 8, 183–205. [Google Scholar]
  65. Choi, D.; Watanabe, Y.; Guy, R.D.; Sugai, T.; Toda, H.; Koike, T. Photosynthetic characteristics and nitrogen allocation in the black locust (Robinia pseudoacacia L.) grown in a FACE system. Acta Physiol. Plant. 2017, 39. [Google Scholar] [CrossRef]
  66. Sallas, L.; Luomala, E.-M.; Utriainen, J.; Kainulainen, P.; Holopainen, J.K. Contrasting effects of elevated carbon dioxide concentration and temperature on Rubisco activity, chlorophyll fluorescence, needle ultrastructure and secondary metabolites in conifer seedlings. Tree Physiol. 2003, 23, 97–108. [Google Scholar] [CrossRef] [PubMed] [Green Version]
  67. Zhao, X.; Mao, Z.; Xu, J. Gas exchange, chlorophyll and growth responses of Betula Platyphylla seedlings to elevated CO2 and nitrogen. Int. J. Biol. 2010, 2, 143. [Google Scholar] [CrossRef]
  68. Nie, M.; Lu, M.; Bell, J.; Raut, S.; Pendall, E. Altered root traits due to elevated CO2: A meta-analysis. Glob. Ecol. Biogeogr. 2013, 22, 1095–1105. [Google Scholar] [CrossRef]
  69. Cotrufo, M.F.; Ineson, P.; Scott, A. Elevated CO2 reduces the nitrogen concentration of plant tissues. Glob. Change Biol. 1998, 4, 43–54. [Google Scholar] [CrossRef]
  70. Kim, H.Y.; Lieffering, M.; Kobayashi, K.; Okada, M.; Miura, S. Seasonal changes in the effects of elevated CO2 on rice at three levels of nitrogen supply: A free air CO2 enrichment (FACE) experiment. Glob. Change Biol. 2003, 9, 826–837. [Google Scholar] [CrossRef]
  71. Zhao, H.; Xu, X.; Zhang, Y.; Korpelainen, H.; Li, C. Nitrogen deposition limits photosynthetic response to elevated CO2 differentially in a dioecious species. Oecologia 2011, 165, 41–54. [Google Scholar] [CrossRef] [PubMed] [Green Version]
Figure 1. Average dry weight of the (a) leaf, (b) stem and (c) root measured in Fraxinus rhynchophylla grown at three different CO2 chambers (ambient: aCO2; ambient × 1.4: eCO21.4; ambient × 1.8: eCO21.8) and three different N treatments (N1: unfertilized, N2: N1 + 5.6 gN m−2 yr−1 and N3: N1 + 11.2 gN m−2 yr−1). Results are presented as mean + SE and summary of a two-way ANOVA. In summary of a two-way ANOVA, CO2 represents CO2 treatment and N represents nitrogen treatment. The X axis represents N fertilization and CO2 treatments: aCO2 (white bar), eCO21.4 (grey bar) and eCO21.8 (black bar). The significance of the primary effects and their interactions are shown with the abbreviations. n.s., non-significant; *, p < 0.05 (two-way ANOVA, CO2 × N). There were differences between N treatments in dry weight of leaf and stem. Different capital letters indicate significant differences among N treatment and lowercase letters indicate significant differences among CO2 treatments (Tukey’s test, p < 0.05).
Forests 12 01197 g001
Figure 2. The average of (a) nitrogen per unit mass (Nmass) (b) Rubisco per unit area (Rubisco) and (c) nonstructural carbohydrates per unit area (NSC) measured in Fraxinus rhynchophylla grown in three different CO2 chambers (ambient: aCO2; ambient × 1.4: eCO21.4; ambient × 1.8: eCO21.8) for three periods. Results are presented as mean + SE in each CO2 treatment: aCO2 (white circle), eCO21.4 (grey circle) and eCO21.8 (black circle). The X axis represents period (19-July: July 2019, 20-July: July 2020 and 20-Sep: September 2020). There were interactions between CO2 × Period. Different letters indicate significant differences among CO2 treatments in each period and ns indicate non-significant (Tukey’s test, p < 0.05).
Forests 12 01197 g002
Figure 3. Average of the nitrogen per unit mass (Nmass) from (a) stem and (b) root and nonstructural carbohydrates per unit mass (NSC) from (c) stem and (d) root measured in Fraxinus rhynchophylla grown at three different CO2 chambers (ambient: aCO2; ambient × 1.4: eCO21.4; ambient × 1.8,: eCO21.8) and three different N treatments (N1: unfertilized, N2: N1 + 5.6 gN m−2 yr−1 and N3: N1 + 11.2 gN m−2 yr−1). Results are presented as mean + SE and summary of a two-way ANOVA. In the summary of the two-way ANOVA, CO2 represents the CO2 treatment and N represents the nitrogen treatment. The X axis represents N fertilization and CO2 treatments: aCO2 (white bar), eCO21.4 (grey bar) and eCO21.8 (black bar). The significance of the primary effects and their interactions are shown with the abbreviations. n.s, non-significant; *, p < 0.05; **, p < 0.01; ***, p < 0.001 (two-way ANOVA, CO2 × N). Different lowercase letters indicate significant differences among CO2 treatment in each N treatments and capital letters indicate significant differences among N treatment (Tukey’s test, p < 0.05).
Forests 12 01197 g003aForests 12 01197 g003b
Table 1. p-Values of a three-way ANOVA across period for maximum photosynthetic rate (Amax), maximum carboxylation rate (VCmax), RuBP regeneration rate (Jmax), nitrogen per unit mass (Nmass), nitrogen per unit area (Narea), Rubisco per unit area (Rubisco), nonstructural carbohydrates per unit area (NSC), photosynthetic N use efficiency (PNUE), chlorophyll per unit area (Chlorophyll), and ratio of chlorophyll and Rubisco measured in Fraxinus rhynchophylla grown at three different CO2 chambers (ambient: aCO2; ambient × 1.4: eCO21.4; ambient × 1.8: eCO21.8) and three different N treatments (N1: unfertilized, N2: N1 + 5.6 gN m−2 yr−1 and N3: N1 + 11.2 gN m−2 yr−1).
EffectdfAmaxVCmaxJmaxNmassNareaRubiscoNSCPNUEChlorophyllChlorophyll: Rubisco
CO220.0200.0830.007<0.001<0.001<0.001<0.0010.021<0.0010.708
N20.2970.9270.3840.0210.8700.7830.2560.4420.4850.813
Period20.1670.0010.002<0.001<0.0010.002<0.0010.219<0.0010.588
CO2 × N40.3480.2490.1990.4960.9130.3210.1400.6310.9250.157
CO2 × Period40.9960.2570.219<0.0010.1170.0290.0100.0630.6110.549
N × Period40.3600.1170.0100.8720.5420.7100.6930.1920.0310.944
In the table, p-values for the repeated-measures ANOVA are in bold when significant (p < 0.05).
Table 2. Average ± standard error of maximum photosynthetic rate (Amax), maximum carboxylation rate (VCmax), RuBP regeneration rate (Jmax), nitrogen per unit mass (Nmass), nitrogen per unit area (Narea), Rubisco per unit area (Rubisco), nonstructural carbohydrates per unit area (NSC), photosynthetic N use efficiency (PNUE), chlorophyll per unit area (Chlorophyll) measured in Fraxinus rhynchophylla grown at three different CO2 chambers (ambient: aCO2; ambient × 1.4: eCO21.4; ambient × 1.8: eCO21.8) and three different N treatments (N1: unfertilized, N2: N1 + 5.6 gN m−2 yr−1 and N3: N1 + 11.2 gN m−2 yr−1).
NitrogenChamberAmax
(μmol m−2s−1)
VCmax
(μmol m−2s−1)
Jmax
(μmol m−2s−1)
Nmass
(%)
Narea
(g m−2)
Rubisco
(g m−2)
NSC
(g m−2)
PNUE
(μmol (molN)−1s−1)
Chlorophyll
(g m−2)
N1aCO25.57 ± 0.53 ns35.03 ± 5.55 ns58.20 ± 5.08 ns1.61 ± 0.11 ns0.99 ± 0.10 a1.56 ± 0.12 ns23.68 ± 1.58 ns78.8 ± 4.4 b0.15 ± 0.01 ns
eCO21.46.76 ± 0.7042.41 ± 8.6863.81 ± 8.891.38 ± 0.110.73 ± 0.07 ab1.41 ± 0.1318.59 ± 1.28133.9 ± 12.1 a0.13 ± 0.02
eCO21.87.43 ± 0.9129.03 ± 6.5251.10 ± 6.661.20 ± 0.170.65 ± 0.08 b1.18 ± 0.1224.69 ± 2.56142.0 ± 17.8 a0.12 ± 0.02
N2aCO26.77 ± 0.52 ns38.45 ± 7.00 ns65.66 ± 4.82 ns1.85 ± 0.14 ns1.01 ± 0.09 a1.72 ± 0.15 ns24.77 ± 2.40 ns95.52 ± 9.2 b0.17 ± 0.01 ns
eCO21.48.52 ± 0.8037.24 ± 4.6770.31 ± 6.291.76 ± 0.071.00 ± 0.09 ab1.63 ± 0.1120.35 ± 1.33130.6 ± 13.6 ab0.18 ± 0.01
eCO21.89.19 ± 0.8535.78 ± 4.1959.21 ± 5.501.55 ± 0.080.80 ± 0.05 b1.37 ± 0.1421.34 ± 1.48158.8 ± 14.0 a0.15 ± 0.01
N3aCO27.97 ± 1.00 ns42.90 ± 5.87 ns75.07 ± 6.45 a1.75 ± 0.15 ns1.17 ± 0.08 ns2.27 ± 0.20 a30.67 ± 3.89 a97.0 ± 11.2 b0.18 ± 0.01 ns
eCO21.49.62 ± 0.7550.84 ± 5.0872.14 ± 5.52 ab1.65 ± 0.080.96 ± 0.131.65 ± 0.14 ab22.63 ± 1.89 b155.3 ± 22.1 ab0.16 ± 0.02
eCO21.810.10 ± 1.0423.72 ± 4.4550.73 ± 10.39 b1.74 ± 0.150.89 ± 0.041.38 ± 0.11 b22.97 ± 2.18 b154.5 ± 16.2 a0.18 ± 0.01
AverageaCO26.80 ± 0.44 b38.46 ± 3.47 ns65.61 ± 3.30 a1.74 ± 0.08 a1.05 ± 0.05 a1.87 ± 0.11 a26.26 ± 1.61 a90.9 ± 3.4 b0.17 ± 0.01 a
eCO21.48.17 ± 0.47 a42.69 ± 4.2067.96 ± 4.43 a1.58 ± 0.06 b0.89 ± 0.06 b1.57 ± 0.08 b20.48 ± 0.89 b138.2 ± 8.7 a0.16 ± 0.01 ab
eCO21.88.91 ± 0.55 a29.73 ± 3.0553.79 ± 4.26 b1.49 ± 0.08 b0.78 ± 0.04 b1.31 ± 0.08 c23.04 ± 1.23 ab151.4 ± 9.2 a0.15 ± 0.01 b
In the table, average of factors ± their standard errors are shown. Different letters next to the mean indicate significant differences among the CO2 treatments (Tukey’s test, p < 0.05). n.s.: non-significant.
Publisher’s Note: MDPI stays neutral with regard to jurisdictional claims in published maps and institutional affiliations.

